evidence from seattle - the conference exchange › paa › 2017 › mediafile...preliminary. please...
TRANSCRIPT

Preliminary. Please do not cite without permission
1
Minimum Wage Increases, Wages, and Low-Wage Employment: Evidence from Seattle
Mark C. Long, Robert Plotnick, Ekaterina Roshchina,
Emma van Inwegen, Jacob Vigdor, and Hilary Wething
with major intellectual contributions from members† of
Evans School of Public Policy & Governance School of Social Work School of Public Health
April 5, 2017
THESE RESULTS ARE PRELIMINARY AND SUBJECT TO REVISION.
PLEASE DO NOT CITE THESE RESULTS WITHOUT OUR PERMISSION
Abstract
This paper evaluates the effect of the first phase-in of the Seattle Minimum Wage Ordinance, which raised the minimum wage from $9.47 to $11 per hour in 2015, on the number of low-wage jobs and hours worked in those jobs. We use a variety of methodologies, including difference-in-differences, synthetic controls, and interactive effects. We find that prior studies that focus on a particular industry (such as restaurants), but are unable to distinguish between low-paid and higher paid workers within that industry, are likely to produce attenuated disemployment estimates. On the other hand, estimated impacts on low-wage workers within the restaurant industry are higher than estimated impacts on low-wage workers in all industries. Our preferred estimates suggest that hours worked in Seattle jobs that paid less than $19 per hour declined by 2 to 3 percent. We show that the impact on wages of these workers was substantially smaller than the change in the statutory minimum wage. Thus, we conclude that traditional estimates of elasticities of employment with respect to changes in minimum wages substantially underestimate such elasticities – by a factor of 20 in our analysis – because they base the denominator on the change in the statutory minimum wage rather than the impact of the statutory change on actual wages. Our estimates indicate that the minimum wage ordinance reduced incomes of affected workers, on average, by roughly $100 per calendar quarter.
† The team investigators are Jacob Vigdor, Mark C. Long, Jennifer Romich, Scott W. Allard, Heather D. Hill, Jennifer Otten, Robert Plotnick, Scott Bailey, and Anneliese Vance-Sherman. Any opinions expressed in this report are those of the authors and not those of the University of Washington, the Washington Employment Security Department, or any supporting or contracted entity. To contact the Seattle Minimum Wage Study Team, email [email protected].

Preliminary. Please do not cite without permission
2
Acknowledgments
Thank you to the state of Washington’s Employment Security Department for providing the Study Team access to data on which this report is based. Thanks to the Laura and John Arnold Foundation, the Russell Sage Foundation, and the City of Seattle for funding and supporting the Seattle Minimum Wage Study. Partial support for this study came from a Eunice Kennedy Shriver National Institute of Child Health and Human Development research infrastructure grant, R24 HD042828, to the Center for Studies in Demography & Ecology at the University of Washington. We are grateful to conference session participants at the 2016 fall APPAM meeting and to seminar participants at the University of California-Irvine, Montana State University, National University of Singapore, University of Houston, and University of British Columbia for helpful comments on previous iterations of this work.
Revision History
This manuscript extends and is intended to supersede a policy report released by the Minimum Wage Study in July 2016, which was converted to a working paper in November 2016. Relative to these earlier iterations, this version omits longitudinal analysis, which will be prepared as a separate manuscript.

Preliminary. Please do not cite without permission
3
Minimum Wage Increases, Wages, and Low-Wage Employment: Evidence from Seattle
Introduction
Economic theory suggests that binding price floor policies, including minimum wages, should lead to a disequilibrium marked by excess supply and diminished demand. Previous empirical studies have questioned the extent to which this prediction holds in the labor market, with many estimates suggesting a negligible impact of higher minimum wages on employment. This paper, using rich administrative data on employment, earnings and hours in Washington State, re-examines this prediction in the context of Seattle’s April 2015 minimum wage increase from $9.47 to $11/hour. It reaches a markedly different conclusion: employment losses associated with mandated wage increases are in fact large enough to result in net reductions in payroll expenses – and total employee earnings – in the low-wage job market. The contrast between this conclusion and previous literature can be explained entirely by data limitations that we are able to circumvent in our analysis. Most importantly, much of the literature examines the impact of minimum wage policies in datasets that do not actually reveal wages, and thus can neither focus precisely on low-wage employment nor examine impacts of policies on wages themselves.
Theory drastically oversimplifies the low-skilled labor market, often supposing that all participants possess homogeneous skill levels generating equivalent productivity on the job. In reality, minimum wages might be binding for the least-skilled, least-productive workers, but not for more experienced workers at the same firm. Empirically, it becomes challenging to identify the relevant market for which the prediction of reduced employment should apply, particularly when data do not permit direct observation of wages. Previous literature, discussed below, has typically defined the relevant market by focusing on lower-wage industries, such as the restaurant sector, or on lower-productivity employees such as teenagers.
In this paper, we examine the impact of a minimum wage increase for employment across all categories of low-wage employees, spanning all industries and worker demographics. We do so by utilizing data collected for purposes of administering unemployment insurance by Washington’s Employment Security Department (ESD). Washington is one of four states that collects quarterly hours data in addition to earnings, enabling the computation of realized hourly wages for the entire workforce. As we have the capacity to replicate earlier studies’ focus on the restaurant industry, we can examine the extent to which use of a proxy variable for low wage status, rather than actual low wage jobs, biases effect estimates.
We further examine the impact of other methodological choices on our estimates. Prior studies have typically drawn “control” cases from geographic regions immediately adjoining the “treatment” region. This could yield biased effect estimates to the extent that control regions raise wages in response to the policy change in the treatment region. We report results from a variety of specifications, ranging from simple geographic control strategies to synthetic control and interactive fixed effects methods. We can also compare estimated employment effects to estimated wage effects, more accurately pinpointing the elasticity of employment with regard to wage increases occasioned by a rising price floor.
Preliminary. Please do not cite without permission
4
In our analysis, replicating methods used in previous studies yields minimum wage impact estimates within the range presented in those studies, with relatively modest implied elasticities of employment with respect to the statutory increase in the minimum wage. Estimated employment effects are higher when examining only low-wage jobs in the restaurant industry, and when examining total hours worked rather than employee headcount. In our preferred specifications, employment elasticities as conventionally calculated are within the range established in prior literature, if somewhat on the high side.
Our analysis reveals an important limitation of conventional methods, however. When comparing percent changes in employment to percent changes in wage, conventional methods assume that the impact of a minimum wage policy on wages is equal to the statutory increase in the minimum. This is often a necessity, as analysis is performed using datasets that do not permit the estimation of policy impacts on wages themselves. We show that the impact of Seattle’s minimum wage increase on wage levels is much smaller than the statutory increase, reflecting the fact that many affected low-wage workers were already earning more than the statutory minimum at baseline. By our estimates, then, conventionally calculated elasticities are substantially underestimated. Our preferred estimates suggest that a one percent increase in wages occasioned by a minimum wage increase yield a 3.4 percent decrease in hours worked in a period six to nine months after the increase.
While these findings imply that Seattle’s minimum wage policy served to decrease total payroll expenses on low-wage employees, and by extension those employees’ incomes, several caveats are in order. These estimates pertain to a minimum wage increase from what had been the nation’s highest state minimum wage to an even higher level, and might not indicate the effects of more modest changes from lower initial levels. Our data do not capture income earned in the informal sector, or by contractors, and minimum wage policies could conceivably lead employers to shift towards these labor market arrangements. Some employers may have shifted jobs out of Seattle but kept them within the metropolitan area, in which case the job losses in Seattle overstate losses in the local labor market. Because of limitations of our data, smaller single-site employers are over-represented in our sample, and these businesses may react differently than larger multi-site employers. Last, the effects of a minimum wage on a small, open economy such as Seattle’s are likely to be larger (perhaps considerably so) than those on a statewide or national economy
We also emphasize that any analysis of the welfare implications of a minimum wage increase must consider how income gains and losses distribute across the low-wage workforce. Some low-wage workers are household heads responsible for maintaining a family’s standard of living. Others are secondary or tertiary earners whose income is less necessary for basic survival. Our previously reported longitudinal analysis of experienced workers suggest that their earnings have held steady or slightly increased over the time period examined here (The Seattle Minimum Wage Study Team, 2016). A pattern of gains for experienced workers coupled with losses for new entrants would be consistent with qualitative evidence indicating employers’ focus on hiring employees who do not require on-the-job training. In future work we anticipate studying effect heterogeneity in detail by linking administrative payroll data to other administrative data with more socioeconomic and demographic information on individual workers.

Preliminary. Please do not cite without permission
5
Related Literature
Over the course of the past 25 years, a robust literature has developed with researchers using a variety of estimation strategies to estimate the effect of minimum wages on employment and other outcomes with various definitions of the low-wage treatment group. While this literature has often generated significant debate over econometric specifications and data sources, the heavy reliance on proxies for low wage employment in the absence of actual wage data has figured less prominently.
Treatment Group Specification
Previous literature has not examined the entire minimum wage market but, rather, has focused on lower-wage industries, such as the restaurant sector, or on lower-productivity employees such as teenagers. Within the “new minimum wage” paradigm, the choice to study the restaurant industry harkens back to the seminal study by Card and Krueger (1994), who utilized a case study approach to estimate the employment effects of New Jersey’s then-new minimum wage ordinance. The authors argue that fast-food restaurants are not just a leading employer of low-wage workers, but also display high rates of compliance with minimum-wage regulations. Many authors have subsequently chosen the restaurant and fast food industry to study federal and state level minimum wages (Addison, Blackburn and Cotti, 2012, 2014; Dube, Lester and Reich, 2010; Dube, Lester and Reich, 2016; Neumark, Salas and Wascher, 2014; Totty, 2015; Allegretto, Dube, Lester and Reich, 2016). Other authors have focused on retail (Kim and Taylor, 1995; Addison, Blackburn and Cotti, 2008).
Another strand of studies estimates the effect of minimum wages on teenagers. These studies argue that teenagers are typically at the bottom of the wage and earnings distribution and make up a large share of the low-wage workforce. Studies of minimum wage effects on teenagers have occurred at the federal and state level (Card, 1992, Allegretto, Dube, and Reich, 2011; Neumark and Wascher, 1994, 1996, 2004, 2008, 2011; Neumark, Salas, and Wascher, 2014).
Using restaurant or retail employees or teenagers as proxies for the entire low-wage labor market might lead to attenuation bias of minimum wage effects. Intuitively, a sample mixing jobs directly affected by the minimum wage with others for which the price floor is irrelevant would be expected to skew estimated impacts towards zero. Isolating one industry, such as the fast food industry, may lead to downwardly biased wage and employment effects due to heterogeneity in wages in the industry (i.e., some workers whose wages are above the minimum wage will be misclassified as belonging to the “treatment” group). The estimates capture the minimum wage’s net effects on all restaurant employees, not the effects on low wage employees, which would likely be stronger. Similarly, using teenagers may lead to artificially large employment estimates as this group omits other low-wage workers, particularly those that have a stronger attachment to the labor force and are full-time full-year workers, for whom the wage-elasticity of demand may be smaller. On the other hand, since some teens earn wages well above the minimum, including them in the sample would lead to artificially low estimates of the impacts for that demographic group. Our approach, which directly estimates the worker’s wage more precisely identifies the workers most likely to be affected by minimum wage laws and

Preliminary. Please do not cite without permission
6
allows for more precise estimation of employment effects, and direct estimation of the wage impacts.
To be sure, our analysis is not immune from conceptual issues regarding what should be counted as a “low wage” job. In theory, one might categorize a job as a “low wage” job if no particular skill level or credential is required to be hired. In practice, we have no data on either skill requirements or skills possessed by individual workers. In the analysis below, we rather bluntly define low wage jobs as those paying less than a certain threshold per hour. This creates potential concerns to the extent that a minimum wage regulation might cause hourly pay to move above the threshold. We address this concern by assessing the sensitivity of our results to thresholds from 109% to 227% of Seattle’s statutory minimum.
Measurement specification
In addition to the challenge of properly identifying the treatment group, there is an ongoing debate about the appropriate estimation strategy. The traditional approach uses variation in state-based minimum wages and estimates minimum wage-employment elasticities using a two-way fixed effect OLS regression (Neumark and Wascher, 2008). This approach assumes parallel pre-trends across treatment and control states and estimates the overall impact of minimum wages on wage and employment of multiple minimum wages over time. The two-way fixed effect approach has come under criticism in recent years because there are spatial patterns in minimum wage adoption (Allegretto, Dube, Lester and Reich, 2016). States with higher minimum wages are concentrated in the Northeast and West coast, regions that have different employment patterns from states in the South and parts of the Midwest. If this underlying regional pattern affects state employment trends differentially, then the parallel trends assumption of the two-way fixed effects model does not hold. Subsequently, difference-in-differences estimation strategies, which weight all states without a higher minimum wage equally as their control region, may bias employment elasticity estimations to be more negative than they are in reality.
To account for this issue, researchers have argued for a variety of different specifications. These include: the use of local area controls, such as division-period fixed effects or a border discontinuity approach, (Allegretto, Dube and Reich, 2011; Dube, Lester and Reich, 2010; 2016; Allegretto, Dube, Lester, Reich, 2016); the use and order of region-specific time trends (Addison, Blackburn, Cotti, 2012, 2014); the use of a synthetic control to identify control regions with pre-trend employment levels similar to the treatment region (Neumark, Salas, and Wascher; 2014); and linear factor estimation (Totty, 2015). Due to the nature of our data, we will focus attention on local area controls, synthetic estimators, and linear factor estimation.1
The assumption underlying local area controls is that neighboring counties or states within a census division region are more similar in trends and levels than regions further away, which make them an appropriate choice as a control. Researchers using local-area controls (Dube, Lester and Reich 2010, 2016; Allegretto, Dube, Reich, 2011) show strong and significant
1 Note, we do not replicate region-specific time trends due to the limited time-frame of our treatment group. However, this specification has become popular; see Dube, Lester and Reich (2010, 2016) and Addison, Blackburn and Cotti (2014) for use of linear and polynomial time trends in minimum wage estimation strategies.

Preliminary. Please do not cite without permission
7
earnings elasticity estimates but employment elasticities that are insignificant and near zero. They argue therefore that their approach appropriately identifies the effects of a minimum wage on wages and employment. We replicate use of contiguous counties by comparing Seattle to the remainder of King County, in which it is located.
The local area control specification has come under criticism from researchers who argue that local areas are worse comparisons than those further away using pre-trends as a benchmark (Neumark, Salas, and Wascher, 2014). Using a synthetic matching estimator approach, Neumark, Salas, and Wascher (2014) show that local areas are not picked as donors in the synthetic estimator of panel national data, and thus should not be used as an estimation approach. While we do not use the synthetic matching estimator in Neumark, Salas, and Wascher (2014), we do employ a synthetic control estimation strategy and find the regions picked are the large urban areas in Washington State, such as Olympia, and Spokane, as well as regions nearby Seattle such as Skagit County.
A final strand of estimation has used linear factor estimation and interactive fixed effect. Totty (2015) utilizes Pesaran’s (2006) common correlated effects estimators as a linear factor estimation. Pesaran common correlated effects estimators do not estimate common factor and common factor loadings, like the interactive fixed effect estimator, but rather use cross-sectional averages of the dependent and independent variables as a proxy for factors. Totty also uses an interactive fixed effect estimator, identical to ours, which involves estimating the common factors and factor loadings across space and over time and finds insignificant and null employment effects of minimum wages.
To stay consistent with the literature, we use a difference-in-differences model that compares Seattle to the remainder of King County and to three Puget Sound counties adjacent to King County (Snohomish, Kitsap and Pierce counties). In addition, we employ both a synthetic and an interactive fixed effects strategy to allow for temporal and spatial heterogeneity in labor market outcomes in Seattle and the rest of Washington. Our study is one of the first studies of a local minimum wage policy (e.g., Dube, Naidu, and Reich, 2007; Schmitt and Rosnick, 2011; and Potter, 2006) and thus understanding the appropriate estimation strategies, in addition to our precise identification of the treatment group, is core to our contribution.
Policy Context
We study the minimum wage effects of the minimum wage hike in Seattle in 2015 using data from Washington State. During the years we study (2005 to 2015), the State of Washington had a state-specific minimum wage that was indexed to CPI-W (growing at an average annual rate of 2%) and was, on average, 30% higher than the federal Minimum Wage. As a result, none of the increases in federal minimum wage over this time period have been binding in Washington. The nominal state minimum wage experienced relatively large increases only twice during this period – in the 3rd quarter of 2009, when the state minimum wage increased by 5.9%, and in the 1st quarter of 2012, when the state minimum wage increased by 4.3%.
In 2014, the City of Seattle passed a new Minimum Wage Ordinance, which, when fully phased-in, increases the minimum wage within Seattle City boundaries to $15 an hour. The increase is implemented through several phase-in periods, and has different schedules for small and large employers, as well as for employers who pay tips or health benefits. In this paper, we study the first phase-in period of the Seattle Minimum Wage Ordinance (hereafter, the

Preliminary. Please do not cite without permission
8
Ordinance) during which the minimum wage rose from $9.47 to $11 for most businesses2 – a 16.2% increase.
The first phase-in period corresponds to the period between the 2nd and 4th quarters of 2015, and covers the first three quarters of the minimum wage increase. The next phase-in period started on January 1, 2016, when the minimum wage went up to $13.00 for large employers (see Table 1 for details).
[Insert Table 1 here]
This ordinance, which at the time would have raised Seattle’s minimum wage to the highest in the country, was part of the wave of local minimum wage laws passed in 2012-2016. Like most minimum wage policy, prior research on the minimum wage has thus been at the federal (Card 1992, Katz and Krueger 1992, Belman and Wolfson 2010) or state (Dube, Lester, Reich 2010; 2016, Card and Krueger 1994, Neumark and Wascher 1995, Meer and West 2016) level. This ordinance is one of the earliest city-wide minimum wages and provides an opportunity to study the minimum wage on a smaller geographic area with an integrated labor market that could allow businesses and workers flexibility to relocate. However, prior research on local minimum wage changes (Dube, Naidu, Reich 2007, Potter 2006, Schmitt and Rosnick 2011) have found small or no employment effects of the local wage policies, results consistent with the bulk of the minimum wage literature.
Data
We study the impact of Seattle’s Ordinance on employment using a unique dataset on payroll records from Washington State in 2005-2015. Washington’s Employment Security Department collects quarterly payroll records for all workers who received wages in Washington and are covered by Unemployment Insurance (UI) to administer the UI Program. Washington is one of four states in the US that collects not only data on wages, but also on hours worked during the quarter. Employers are required to report actual hours worked for those employees whose hours are tracked (i.e. hourly workers), and report either actual hours worked or total number of hours assuming a 40 hour work week for those employees whose hours are not tracked (i.e. salaried workers).
This unique dataset allows us to identify jobs that would be affected by an increase in the minimum wage, and track trends in both employment counts and hourly wages. As a result, unlike the prior literature, we can identify low-wage jobs in industries that do not primarily rely on low-wage workers. Because we can identify low-wage jobs in all industries, we do not need to use proxies for the low-wage labor market such as the restaurant industry. . By distinguishing between low-wage and high-wage jobs within an industry (e.g., within restaurants), we are able to estimate the extent of attenuation bias that occurs in studies that base estimates of effects on the entire labor market for that industry. Additionally, we measure the impact of the minimum
2 Employers with fewer than 501 employees worldwide who provide health benefits or pay tips could pay a minimum wage of $10.00 if they contribute at least $1.00 towards tips and health benefits. Our data does not allow us to observe if a worker gets health benefits, but we do observe total compensation, which includes tips. We come back to this issue in greater detail when we discuss the data.

Preliminary. Please do not cite without permission
9
wage hike on all low-wage jobs in the entire economy, rather than jobs in a particular industry, providing particularly important information for policymakers.
The data also provide the street address of each business, which allows us to place jobs inside or outside of Seattle City boundaries3, and thus determine whether Seattle’s Ordinance covers the jobs. However, multi-site businesses can file a joint report with ESD covering all of their locations, and are not required to provide a breakdown of their employees by location. As a result, we cannot determine which jobs in these businesses are and are not covered by the Ordinance. Due to this limitation, we exclude multi-site businesses, and focus only on jobs in single-site businesses. In Washington State as a whole, single-site businesses employ about 60% of the workforce. We note that restricting our analysis to single-site businesses excludes large retail chains and restaurants that own their branches, but keeps in the sample all restaurants operating as a single-site franchise (i.e. most quick-service restaurants).
Another limitation of our data is that we do not observe jobs that are not covered by the UI program. In particular, our analysis excludes contractor jobs, which get 1099 forms instead of W-2s, and jobs in the informal economy paid with cash. If employers respond to the minimum wage by shifting some jobs under the table or outsourcing workers on payroll to contractor positions, we would attribute a decrease in jobs which we can no longer observe to job loss rather than to a change in contract relationship between a worker and a business. The consequence is that we may overstate the magnitude of employment response to the minimum wage using these data.
Most papers that analyze job response to minimum wage hikes in the US rely on data from the Quarterly Census of Employment and Wages, which in turn relies on information from the same data source as we do – payroll data on jobs covered by the Unemployment Insurance program. As a result, our estimates will be comparable to many results in the literature. As Washington State’s minimum wage was $9.32 at the time of the law passing, we trimmed wage rates that were less than $9 and greater than $500 per hour to avoid measurement error. In addition, we dropped observations of hours that were fewer than 10 per quarter or greater than 1,000 per quarter to exclude potentially faulty data.
Outcomes of Interest
We define low-wage jobs as jobs that pay less than $19 (in constant dollars as of the 2nd quarter of 2015). We chose the cutoff of $19 for two reasons. First, in a companion paper, when we compare the wage distributions during the quarters before and after the Ordinance went into effect, we see no differences for jobs paying more than $19 (The Seattle Minimum Wage Study Team, 2016), but with apparent visual evidence of cascading increases in the distribution above the statutory limit of $11 per hour. This result is confirmed in this study by evaluating impacts using higher cutoffs, which result in roughly the same change in aggregate employment (i.e., there do not appear to be additional cascading effects beyond $19). Second, in the years before the policy, a median Seattle worker earning the minimum wage worked about 1,040 hours per year (Klawitter, Long, and Plotnick, 2014). Using this figure, a family of two adults and one
3 To determine exact location of each business, we geocode mailing addressed provided by employers with their quarterly payroll reports and obtain exact coordinate of business location. We then use these data to determine if a business is located within Seattle, and to place businesses into PUMAs within Washington State. Appendix C provides details on geocoding.

Preliminary. Please do not cite without permission
10
child with one adult working 1,040 hours at a wage of $19 per hour, would have a family income of $19,760, which is right above the poverty threshold for such a family. Thus, $19 per hour is a practically important cut-off point.
We measure employment both as the number of jobs and the number of hours worked during the quarter. Because the data provide information on all jobs that were on payroll during a quarter, including jobs which lasted only for a few weeks or even days, we use the number of beginning-of-quarter jobs as our measure of the number of jobs, defined as follows. We define a job as an employer–person pair, which is a standard method applied to employer-employee matched datasets, and we define a beginning-of-quarter job as a job which existed both in the current and previous quarter.4 To measure the total number of hours worked during the quarter, we simply add up hours worked in all jobs (including part-time and temporary jobs) which paid less than $19 per hour.
Since most low-wage jobs are paid hourly, our ability to measure employment not only as jobs, but also as hours worked is essential to understanding the impacts of the minimum wage on low-wage labor market opportunities, as employers likely reduce both the number of jobs and hours worked in response to an increase in the cost of labor. The change in the total number of hours worked reflects adjustments on both margins. Therefore, the impact of the minimum wage on total hours worked in low-wage jobs in all industries is our preferred measure of the overall impact of the minimum wage on employment opportunities for low-wage workers.
We compute these outcomes for workers in all industries. We also compute them separately for the restaurant industry (defined as Food and Drinking Places industry, or NAICS code 722) because this proxy for the low-wage labor market has been used in much of the prior literature (Addison, Blackburn and Cotti, 2012, 2014; Dube, Lester and Reich, 2010; Dube, Lester and Reich, 2016; Neumark, Salas and Wascher, 2014; Totty, 2015; Allegretto, Dube, Lester and Reich, 2016).
Methodology
We estimate the impact of the minimum wage with a variety of methods to assess whether our results are robust to the choice of the estimation method.
To analyze employment in Seattle after the introduction of the Ordinance, we split the data into cohorts which start in the 2nd quarter of each year and follow them for six consecutive quarters (see Figure 1). We define as “treated” the Seattle cohort first observed in the 2nd quarter of 2014, when the Ordinance was passed, and follow it through the 4th quarter of 2015, which is the last period for which data are currently available. As a result, the treated cohort has data on three quarters before the Ordinance went into effect, and on three quarters after it went into effect.
[Insert Figure 1]
We define the 2nd quarter of each year as the baseline period for the corresponding cohort, and calculate the change in employment in subsequent quarters relative to the baseline
4 This definition is used by the Quarterly Workforce Indicators, based on the Longitudinal Employer Household Data (LEHD), and produces the total number of jobs comparable to the employment counts in the Quarterly Census of Employment and Wages.

Preliminary. Please do not cite without permission
11
period. Thus, we study impacts of the minimum wage hike on changes in employment between the current and baseline periods:
(1) 0Y Y Y rtq rtq rt
where denotes region (e.g. Seattle or comparison region), � denotes cohort, and denotes the number of quarters since the baseline period. For the treated cohort, = corresponds to the 2nd quarter of 2014, when the Minimum Wage Ordinance was passed; = 4 corresponds to the 2nd quarter of 2015, when the Minimum Wage Ordinance went into effect; and = 6 corresponds to the 4th quarter of 2015, which is the last period when the data are currently available.
We start our analysis with the traditional difference-in-differences specification, in which the outcomes of a treated region (Seattle in our case) are compared to the outcomes of a control region. We first compare growth rates in employment in Seattle to growth rates in King County, which encompasses Seattle. This comparison region can be thought of as equivalent to a contiguous county specification used by Dube, Lester and Reich (2010). Next, we compare growth rates in employment in Seattle to Snohomish, Kitsap, and Pierce Counties (abbreviated to SKP), which surround King County but do not share a border with Seattle (see Figure 2). Since a higher minimum wage might have a spillover effect on the parts of King County immediately adjacent to Seattle, we chose the counties which have similar local economic climates to Seattle’s, but are not immediately adjacent to Seattle, as our control region. We expect SKP to experience a smaller (if any) spillover effect of the Ordinance compared to King County, and thus yield a less attenuated estimate of its impact.
[Insert Figure 2]
In both cases, we estimate the following difference-in-differences specification:
(2) rtq rq tq q rt rtqY α ψ β T ε
,
where � � is an indicator for treated region and treated cohort (i.e. Seattle cohort of 2014), is a region-quarter fixed effect, and �� is a cohort-quarter fixed effect, is the treatment effect of the minimum wage, which can vary with the time since the passage of the Ordinance, and � � is an idiosyncratic shock.
The model in Equation 2 is a standard two-way fixed effect specification used in the literature (Neumark and Wascher, 2008). As pointed out in Bertrand, Duflo, and Mullainathan (2004), local economic outcomes in this model are not independent from each other, because they come from the same region. We account for this correlation by clustering the standard errors at the region and cohort level.
Difference-in-differences specification requires that the treated and control region have the same trends in the absence of the policy (parallel trends assumption), and will generally fail to produce a consistent estimate of the treatment effect if this assumption is not true. It is prudent to be especially cautious about the parallel trends assumption given that this area was experiencing rapid economic growth coming out of the Great Recession, and such growth and recovery could be at different paces.

Preliminary. Please do not cite without permission
12
To overcome this concern, we estimate the impact of the minimum wage using methods which allow for flexible pre-policy trends in control and treated regions: the synthetic control estimator (Abadie and Gardeazabal, 2003) and the interactive fixed effects estimator (Bai, 2009). Both methods have been used in the regional policy evaluation literature before and applied to the minimum wage change as well (See Allegretto, Dube, Reich and Zipperer (2013) for an application of synthetic control, and Totty (2015) for an application of interactive fixed effects).
Both methods assume that the changes in employment in each region can be represented as a composition of � unobserved linear factors � �:
(3) 1
K
rtq q rt rqk tqk rtqk
Y T
,
where � � is an unobserved factor, common across all regions in each year-quarter, and � is a region-specific factor loading, constant across time.
The unobserved factors can be thought of as common economic shocks which affect all the regions at the same time, such as an exchange rate shock, common demand shock or changes in weather. However, regions are allowed to have different sensitivity in response to these shocks. As a result, the treated and control regions are no longer required to have parallel trends.
Though both the synthetic control and interactive fixed effects estimators have the same underlying model, their implementation is quite different. The synthetic control estimator does not explicitly estimate the factors or factor loading, and uses pre-policy observations to find an optimal set of (weighted) control regions, which matches the pre-policy trend in the treated region. Denote Seattle by r = 1 and denote r = 2, ,R all potential control regions. Then the weights for synthetic control can be found by minimizing forecasting error in the pre-policy period:
(4)
22013 6
1, ,22005 1
min r
R
r t q r rtqw
rt q
Y w Y
,
subject to the constraints ∑ � = and ∀ � ≥ .5 Given a set of weights �̂ , the impact of the minimum wage is estimated as follows:
(5) 1, 2014, , 2014,
2
ˆ ˆ R
Synthq r t q r r t q
r
Y w Y
.
The interactive fixed effects approach estimates the factors and factor loadings in Equation 3 explicitly, by imposing normalization on the sum of the factors. Since the number of unobserved factors is not known, we estimate the model allowing for up to 40 unobserved factors, and pick the model with the optimal number of factors using the criterion developed in Bai and Ng (2002). We implement the interactive fixed effects estimator following Gobillon and Magnac (2016) who have developed a publicly-available program to estimate the treatment effects in the regional policy evaluation context.
5 We implement synthetic control estimator using the R programs provided by Gobillon and Magnac (2016).
Preliminary. Please do not cite without permission
13
Though the synthetic control and interactive fixed effects estimators generally perform similarly in Monte Carlo simulations (Gobillon and Magnac, 2016), analytic standard errors for interactive fixed effects estimator have been established, while standard errors for the synthetic control estimator are usually obtained using placebo estimates.
We provide the baseline standard errors for the synthetic control estimates using an approach of “placebo in time”, suggested by Abadie, Diamond, and Hainmueller (2014). We implement it by considering each of the 2005—2013 cohorts in Seattle as a “treated” cohort and estimating the placebo impact in that year. We then take the standard deviation of these estimated placebo impacts to be our estimate of the standard error6.
We implement the synthetic control and interactive fixed effects estimators by approximating Seattle’s economy using data on employment trends across Public Use Microdata Areas (PUMAs) in Washington State. A PUMA is a geographic unit defined by the U.S. Census Bureau, which has a population of at least 100,000 people and does not cross county boundaries. We include all PUMAs in Washington State, except those in King County, in the set of potential control regions. We exclude King County because of potential spillover effects of Seattle’s Ordinance on employment in King County. The rest of Washington includes 40 PUMAs (see Figure 3).
[Insert Figure 3]
Appendix A graphically shows the estimated weights chosen by the synthetic control estimator by outcome, industry, and for various wage cutoffs, as well as listing the PUMAs that get the highest weights. Appendix B shows the sensitivity of the interactive fixed effects estimates as a function of the number of factors that are used, as well as showing the choice of the optimal number of factors using the criterion developed in Bai and Ng (2002). The optimal number of factors is higher when evaluating higher wage cutoffs – this result makes sense because it is reasonable to expect a smaller number of factors affect low-wage employment relative to the number that would affect all jobs.
Results
Table 2 presents summary statistics on the number of jobs and total hours worked in Seattle’s single-location establishments for all industries and for food and drinking places by wage level for the quarter the Ordinance was passed (t = 0, including June 2014), the first three quarters after the law was passed (t = 1, 2, or 3, July 2014-March 2015), and the first three quarters after the law was in force (t = 4, 5, or 6, April-December 2015). These statistics portray a general image of the Seattle labor force over this time period and should not be interpreted as estimates of the causal impact of the Minimum Wage Ordinance.
[Insert Table 2]
6 We have also estimated the standard errors based on “placebo in space” approach. It is implemented by considering each of the PUMAs outside of King County as a treated region and estimating a placebo effect for this region. We then take the standard deviation of these estimated placebo effects as an estimate of the standard error. Standard errors using “placebo in space” approach are more conservative than the standard errors using “placebo in time” approach, but demonstrate the same qualitative results.

Preliminary. Please do not cite without permission
14
As shown in Panel A of Table 2, the number of jobs paying less than $11 per hour in all industries plummeted from 20,602 to 5,441( a decline of 15,161) – which can be taken as evidence the law worked as intended.7 Policymakers would hope that this reduction in lowest-wage employment would be fully offset by increasing employment counts at higher wages. Thus, more concerning is that the number of jobs paying less than $19 per hour fell from 93,007 to 87,219 (a decline of 5,788). Although these basic numbers suggest that the majority of lowest-wage jobs were paid higher wages after the Ordinance took effect, roughly 40% of the overall drop remains even when raising the low wage threshold to $19 - 173% of the statutory minimum. We also see that total hours worked in jobs paying less than $11 per hour fell by 4.6 million and that the reduction was still 2.5 million hours when raising the low wage threshold to $19 per hour.
During this same time, employment and hours at all jobs, regardless of wage level, were increasing in Seattle – consistent with the general impression of Seattle as enjoying a boom in technology and related sectors with relatively high skill requirements. Average wages at jobs paying less than $19 rose from $14.14 to $14.74 (a 4.2% increase), while wages at all jobs surged from $36.93 to $41.74 (a 13.0% increase).
Panel B of Table 2 examines Food and Drinking Places, which, respectively, comprised 32%, 23%, and 11% of jobs in Seattle’s single-location establishments paying less than $11, less than $19, and overall during the quarter the Ordinance was passed.
Interestingly, we see that both the number of jobs paying less than $19 per hour and total hours worked in Food and Drinking Places increased by over 4%. As we show below, this growth was unlikely to have been caused by the Ordinance, but was rather due to secular change (perhaps caused by the improving macroeconomy). We also see that all jobs and hours in Food and Drinking Places both increased by about 14% – thus, growth in jobs paying above $19 per hour exceeded growth in jobs paying less than $19. Put differently, the share of hours worked in Food and Drinking Places by those earning less than $19 per hour fell from 69% to 63% during this period. Average wages at Food and Drinking Places jobs paying less than $19 rose from $13.10 to $14.26 (an 8.8% increase), while wages at all jobs in Food and Drinking Places rose faster, from $17.77 to $19.83 (an 11.6% increase).
Table 3 presents our first estimates of the causal impact of the Ordinance. We begin in column 1 by using a simple difference-in-differences model contrasting changes in employment in single-location Food and Drinking Places in Seattle to the surrounding King County. This approach is the rough local analog to Card and Krueger’s (1994) examination of fast food employment in New Jersey and Pennsylvania in response to New Jersey’s increase in its minimum wage. During the quarters after the law was passed, but before the law was enforced, we do not find evidence of changes in employment – that is, we do not find anticipation effects.
7 We might not expect to see zero jobs paying less than $11 for a variety of reasons, including overestimation of hours by the employer, underreporting of tips, a $10 minimum wage for smaller businesses, and a subminimum wage set equal to 85% of the minimum for workers under 16 years old. We trimmed wage rates less than $9 per hour and greater than $500 per hour and dropped observations of hours that were fewer than 10 per quarter or greater than 1,000 per quarter to avoid measurement error.

Preliminary. Please do not cite without permission
15
However, in the second and third quarters after the law was in force we find that employment declined significantly by 4.0% and 2.5% respectively.
These estimates, however, are potentially attenuated because they evaluate impacts on all workers in the industry. When we restrict the analysis to workers earning less than $19 per hour, in column 2, we find much larger impacts that are statistically significant in the second and third quarters after enforcement began and peak in the second quarter after enforcement at -7.3%. The 2nd and 3rd quarter estimates in column 1 are attenuated by 45% and 54%, respectively, compared to the estimates in column 2. Thus, it appears that the conventional literature’s focus on all jobs in Food and Drinking Places rather than low-skill jobs potentially has led to a substantial underestimate of the impact of minimum wage increases on the target population.
[Insert Table 3]
As shown in column 3 of Table 3, the effects on hours are comparable to those shown in column 2 for jobs, but significant for all three post-implementation quarters. Thus, nearly all of the reduction in hours worked by low-wage workers in Food and Drinking Places is coming from a reduction in jobs rather than a reduction in hours worked by those who have such jobs. We consider hours a more relevant outcome to study as it better measures real labor market opportunities for workers. Thus, we focus on this outcome in subsequent analysis.
While the conventional literature may underestimate employment losses for low skill workers in Food and Drinking Places, Table 4 illustrates that specifications examining only that industry yield larger (in absolute value) point estimates than equivalent models including all industries. Column 1 of this table is a repeat of column 3 from Table 3. Column 2 presents estimates for impacts on hours for workers earnings less than $19 in all industries. The first and second quarter post-implementation estimates are about half the size of the estimated impacts for Food Service and Drinking Places, and peak at -4.5% in the second and third quarters after enforcement.
[Insert Table 4]
Columns 3, 4, and 5 of Table 4 use alternative control groups in place of King County. When we use the surrounding counties (Snohomish, Kitsap, and Pierce) as the control group in column 3, we find much larger estimates, peaking at -7.7% in the second quarter after enforcement. This result may indicate that effects of the ordinance on wages and employment in other parts of King County might be important.8 But it might also be the case that counties on the periphery of Seattle’s metropolitan region are experiencing faster population and employment growth than King County. Results using the synthetic control and interactive fixed effects methods, shown in columns 4 and 5, are similar to these in column 2, suggesting that the difference-in-differences estimates using King County as the control group might be reasonable.
Moving forward with the analysis, we will be highlighting the interactive fixed effects results, which appear to yield conservative impact estimates with small standard errors – these results suggest that the Ordinance caused hours worked by low-skilled workers to fall by 2.2% to 3.4% during the three quarters after enforcement and the loss of hours increased over time.
8 Our companion paper (Long et al., 2017), which is under development, examines this possibility of spillover and mechanisms for estimating spillovers in greater detail.

Preliminary. Please do not cite without permission
16
Recall from Table 2 that across all Seattle single-site firms there were 93,007 jobs earning less than $19 per hour and 37.4 million hours worked in these jobs in the quarter the law was passed. Averaging our interactive effects estimates for the three quarters after implementation, we estimate that the Ordinance resulted in a loss of approximately 2,400 jobs and 1.0 million hours worked. These estimates are conservative relative to other estimation methods and robust to cutoffs other than $19.9
The traditional manner of scaling these employment effects is to compute an elasticity – a comparison of effects on employment to effects on wages. It is customary in the minimum wage literature to use the statutory change in minimum wage rate as the magnitude of the increase on wages. In a simplified model where all workers earn the minimum at baseline, this approach is sensible. In a more realistic model, where many affected workers were earning more than the minimum, this approach may overestimate the impact of law changes on wages and thus underestimate the elasticity of employment with respect to wages.
Figure 4 presents a series of estimates of the impact of the Ordinance on hourly wages in low-wage jobs, using definitions of low-wage employment that range from jobs paying under $12 in inflation-adjusted dollars to those paying under $25. We present estimates for two difference-in-difference estimators, as well as synthetic controls and interactive fixed effects. Vertical axes are scaled in terms of percent.
Estimates using all methodologies indicate that the Ordinance raised wages in jobs paying under $12 by between 2.5 and 3 percent. This estimate is fairly small relative to the 16.2% statutory increase in the minimum wage for large businesses. The discrepancy reflects several factors. Most workers paid under $12/hour at baseline earned well over $9.47/hour. Businesses providing medical benefits or where workers are tipped were permitted to pay a lower minimum wage of $10/hour. And in at least some cases, the minimum wage may have had compression effects that pushed employees above the $12 threshold entirely, suggesting that our estimate of the wage impact may be biased downward.
To address this last issue, consider the results of models using escalating low-wage job thresholds, up to and including $25/hour, more than twice the statutory minimum. Estimates tend to decline as the threshold increases, consistent with the notion that the minimum wage would have smaller impacts, if any, on jobs paying well above the minimum at baseline. Across methodologies, our estimated wage impacts stabilize between 0.5% and 1.5% for all thresholds above $15.
Figures 5 and 6 replicate the analyses of Figure 4 for beginning-of-quarter jobs and hours worked respectively. These figures show point estimates of employment impacts that are relatively large and negative at low wage thresholds, but stabilize at smaller negative levels as the threshold increases. This pattern, combined with the evidence above, supports an intuitive explanation. Using low wage thresholds, the estimated wage and employment effects are large – employers must raise wages the most in these selected samples, and disemployment effects
9 In additional specifications, we conducted falsification tests by treating the 2nd quarter of 2012 as the baseline, assuming the existence of a “pseudo” minimum wage increase in the last three quarters of 2013, and using only 2005-2013 data for the analysis. These falsification tests did produce some spurious results in traditional difference-in-difference specifications, but not in synthetic control or interactive fixed effects models.
Preliminary. Please do not cite without permission
17
should be concentrated among these jobs. As the threshold is increased, both employment and wage effects moderate.
[Insert Figure 4-6]
These employment and wage effects can be used to compute the labor elasticity of demand, using exogenous shifts in wages brought about by the minimum wage increase. Table 5 uses the relatively conservative interactive effects results to compute the elasticity of hours with respect to the change in wages induced by the Ordinance. Elasticity estimates are then computed as the ratio of the effects on employment (or hours) to the effects on wages. Column 1 repeats column 5 from Table 4. Column 2 adds an estimate of the impact of the Ordinance on average wages earned by low-skilled workers. We find that these worker’s wages rose by 0.6% to 0.8% during these three quarters. Given the baseline average wage of $14.14, as shown in Table 2, this impact corresponds to an average wage increase of $0.09 to $0.12 per hour. Particularly during the second and third quarter after enforcement, the positive impact of the Ordinance on average wage rates of low-skilled workers was substantially less than the negative impact on their hours. Thus, as shown in column 3, the elasticity of hours with respect to wages is greater, in absolute value, than 1, ranging from -3.1 to -4.1 during the three quarters after enforcement. This result implies that, on average, earnings declined for these jobs.10
[Insert Table 5]
These very large elasticities are not artifacts of examining jobs going all of the way up to $19 per hour. If we use under $12 as the cutoff, across the three post-implementation quarters, we find wages increased by 2.5% to 2.9%, yet hours fell 10.0% to 18.3%. These estimates yield elasticities ranging from -3.0 to -5.9. For any other whole dollar cut-point between $12 and $19, the smallest (in absolute value) elasticity for any of the post-implementation quarters is -2.3. The robustness of these large estimated elasticities are shown in Figures 7 and 8.
[Insert Figures 7 & 8]
Prior studies compute the elasticity by dividing the percentage change in employment by the percentage change in the statutory minimum wage, which in this case would be 16.2% (i.e., ($11-$9.47)/$9.47). The conventional method for estimating impacts on wages overestimates the actual impact given that many workers’ wages are above the old minimum wage but below the new minimum wage. Those methods are also unsuitable for evaluating the impacts on workers who began over the new minimum wage but are nonetheless affected by cascading wage increases (which we define as the range $11 to $19 per hour). In column 4 of Table 5, we use the conventional approach for computing these elasticities and find estimates in the range of -0.14 to -0.21. This range is high but not outside of the range of estimates found in prior literature (see Appendix Table 1). Thus, our method of computing the elasticity based on the Ordinance’s impact on actual average wages suggests that the conventional method may yield substantial underestimates.
10 For example, suppose that a low-wage worker worked 40 hours at the average wage of $14.14, for total earnings of $565.60 prior to the Ordinance. The estimates imply that in the third post-enforcement quarter, total earnings would be 40*(1 - .034)*(14.14 + .12) = $551.01 – a decline of 2.6%.

Preliminary. Please do not cite without permission
18
Because prior studies focused on changes in employment, the lower panel of Table 5 presents parallel results for jobs instead of hours. Elasticities computed using the actual change in wages range from -1.9 to -3.7, somewhat smaller than the range for the hours elasticity, but still much larger than those obtained with the conventional method. The conventional method applied to our job impacts yields elasticities in the range of -.07 to -.19, which is comfortably within the range from prior studies (Appendix 1).
Finally, Table 6 presents elasticity estimates, computed in the standard way (i.e., relative to the statutory change in the minimum wage) for the 2nd quarter after enforcement, while varying industry (all versus restaurants), labor market measure (employment versus hours), and sample (all jobs versus low-wage (under $19) jobs). This table makes a few points. First, elasticity estimates are highly attenuated, and sometimes erroneously positive, when using all jobs, whereas the elasticity estimates are consistently negative when the analysis is conducted specifically on low-wage jobs.
Second, the elasticity estimates are substantially higher when based on restaurant jobs compared to all jobs. Our elasticity estimates for the impact on jobs earning less than $19 per hour in restaurants range from -0.25 to -0.62. This range is completely above the range of estimates from the literature (shown in Appendix Table 1), possibly as a result of attenuation bias or because we are evaluating a local rather than state minimum wage law. Third, the effects on hours are only mildly larger than the effects on employment – thus, most of the disemployment effect is coming from a loss of jobs rather than a loss of hours in jobs that remain.
Conclusion
Evaluating the impacts of minimum wage laws is often challenging. Because these policies are not randomly assigned to cities or states, researchers need to work hard to identify the counterfactual, leading to a variety of estimation methods. Additionally, researchers often lack the data needed to carefully distinguish treatment from control individuals or jobs. In those situations, researchers resort to using proxies for low-wage workers by examining particular industries that employ higher concentrations of low-wage labor or by restricting the analysis to teenagers.
This paper demonstrates, not surprisingly, that such strategies likely misstate the true impact of minimum wage policies on opportunities for low-skilled workers. As it happens, these misstatements come close to canceling each other out in our analysis. Using all workers in a low-wage industry rather than low-wage workers in that industry produces attenuated estimates of impacts on that industry. Further, and on the other hand, we show that estimated impacts on low-wage workers within the restaurant industry are higher than estimated impacts on low-wage workers in all industries. Similar to previous literature, we show that estimates using difference-in-difference methods strongly resemble those using synthetic control or interactive fixed effects models.
We base these conclusions on our study of the impact of the first phase-in of the Seattle Minimum Wage Ordinance, which raised the minimum wage from $9.47 to $11 per hour. Our preferred estimates suggest that the Ordinance caused hours worked by low-skilled workers (i.e., those earning under $19 per hour) to fall by 2.2% to 3.4% during the three quarters after enforcement and the loss of hours increased over time, resulting in a loss of approximately 2,400 jobs and 1.0 million hours worked per calendar quarter. These estimates are conservative

Preliminary. Please do not cite without permission
19
relative to other estimation methods and robust to cutoffs other than $19. Importantly, the lost income associated with the million hours reduction exceeds the gain associated with the net wage increase of under 1%. There were roughly 35 million hours worked for wages under $19/hour in our sample in the fourth quarter of 2015. In this quarter, we infer that low-wage workers gained roughly $5 million in extra wages (1% of the average wage times 35 million), but lost approximately three times that amount in the form of reduced work opportunities. The ordinance thus reduced total income paid to low-wage workers at single-location firms in the city by roughly $10 million – on the order of $100 per employee -- over three months.
The estimates are much larger than those reported in prior minimum wages studies for two reasons. First, theory suggests that labor demand elasticity would generally be larger for a small, open economy such as Seattle than for a state or the nation. Second, rather than using the statutory change in the minimum wage as the denominator in an elasticity computation, we use the change in actual wage rates for low-skill workers, which we can estimate from the Washington data. Because the actual change is necessarily smaller than the statutory change, the arithmetic of elasticity computation leads to larger estimated elasticities than those derived using conventional methods of computing the elasticity of demand for low-skill workers with respect to changes in wages induced by minimum wage increases. The problem is that the conventional method uses the percentage change in the statutory minimum wage, which is much larger than the percentage change in the wages earned.
We find that wages in jobs that paid less than $19 rose by 0.6% to 0.8%, yielding elasticities ranging from -3.1 to -4.1, and these large elasticity estimates are robust to other cutoffs. Since the positive impact of the Ordinance on average wage rates of low-skilled workers was substantially less than the negative impact on their hours, our results suggest a decline in earnings in these jobs.
A few cautions should be noted. Our analysis is restricted to firms reporting employment at specific locations, as we cannot properly locate employment for those multi-location firms that do not report employment separately by location. It may be the case that the labor demand elasticity of single-site firms is larger than that of multi-site firms who do not report employment at specific locations. On the other hand, if multi-site firms' wage impact was the same as reported here but their hours impact was zero, the elasticity would still be high compared to earlier work – between -1.9 and -2.5 (as single-site businesses employ about 60% of the workforce). Also, we lack data on contractor jobs which get 1099 forms instead of W-2s and on jobs in the informal economy paid with cash. If the Ordinance prompted a shift in low-wage workers to be paid as contractors or under the table, our results would overstate the effect on hours worked. However, such a move would not be without consequence for the workers, who would lose protections from the Unemployment Insurance and Worker’s Compensation systems, and be required to pay the full amount of taxes for Social Security and Medicare. In addition, some employers may have shifted jobs out of Seattle but kept them within the metropolitan area, in which case the job losses in Seattle overstate losses in the local labor market.
The net average changes in wages and hours attributed to the Minimum Wage Ordinance are modest here, and there may be important forms of effect heterogeneity across workers. Some workers may well have experienced significant wage increases with no reduction in hours; others may have encountered significantly greater difficulty in securing any work at all. From a welfare perspective, it is critical to understand how this heterogeneity plays out across low-skilled

Preliminary. Please do not cite without permission
20
workers in varying life circumstances. Such an exploration is beyond the scope of this paper, which uses a data resource that identifies no pertinent information about individual workers. Future work will take advantage of linkages across administrative data resources within Washington state to understand how the minimum wage’s impacts on workers in varying demographic categories, or with a history of reliance on means-tested transfer programs.
Finally, the restriction to single-site firms leaves open the possibility that employment shifted from single- to multi-site firms at the time the ordinance was implemented. We note that such a shift would have to coincide fairly precisely with the implementation of the law in the second calendar quarter of 2015.

Preliminary. Please do not cite without permission
21
References
Abadie, A. and J. Gardeazabal. 2003. The Economic Costs of Conflict: A Case Study of the Basque Country. American Economic Review 93 (2003), 113–132.
Abadie, A., Diamond. A., and J. Hainmueller. 2014. Comparative Politics and the Synthetic Control Method. American Journal of Political Science 59(2): 495-510.
Addison, J., Blackburn, M., and C. Cotti. 2008. New Estimates of the Effects of Minimum Wages in the U.S. Retail Trade Sector. IZA Discussion Paper No. 3597.
Addison, J., Blackburn, M., and C. Cotti. 2012. The Effect of Minimum Wages on Labour Market Outcomes: County-Level Estimates from the Restaurant-and-Bar Sector. British Journal of Industrial Relations. 50(3), 412-435.
Addison, J., Blackburn, M., and C. Cotti. 2014. On the Robustness of Minimum Wage Effects: Geographicially-Disparate Trends and Job Growth Equations. IZA Discussion Paper No. 8420.
Allegretto, S., Dube, A., Reich, M., and B. Zipperer. 2016. Credible Research Designs for Minimum Wage Studies: A Response to Neumark, Salas and Wascher. Working Paper. Washington Center for Equitable Growth.
Allegretto, S., Dube, A., Reich, M., and B. Zipperer. 2013. Credible Research Designs for Minimum Wage Studies. IRLE Working Paper No. 148-13
Allegretto, S., Dube, A., and M. Reich. 2011. Do Minimum Wages Really Reduce Teen Employment? Accounting for Heterogeneity and Selectivity in State Panel Data Industrial Relations 50(2): 205-240.
Bai, J. 2009. Panel Data Models With Interactive Fixed Effects. Econometrica 77(4): 1229-1279.
Bai, J. and S. Ng. 2002. Determining the number of factors in approximate factor models. Econometrica 70, no. 1: 191-221.
Belman, D. and P.J. Wolfson. 2010. The effect of legislated minimum wage increases on employment and hours: A dynamic analysis. Labour 24, no. 1: 1-25.
Bertrand, M., Duflo, E. and Mullainathan, S., 2004. How Much Should We Trust Differences-in-Differences Estimates? Quarterly journal of economics, 119(1), pp.249-275.
Card, D. 1992. Using Regional Variation in Wages to Measure the Effects of the Federal Minimum Wage. Industrial and Labor Relations Review, 46(1): 22-37.
Card, D. and A. B. Krueger 1994. Minimum Wages and Employment: A Case Study of the Fast-Food Industry in New Jersey and Pennsylvania. The American Economic Review 84(4): 772-793
Dube, A., S. Naidu, and M. Reich. 2007. The Economic Effects of a Citywide Minimum Wage Industrial & Labor Relations Review 60: 522-543.

Preliminary. Please do not cite without permission
22
Dube, A., T. W. Lester and M. Reich 2010. Minimum wage effects across state borders: Estimates using contiguous counties. The Review of Economics and Statistics 92(4): 945-964.
Dube, A., T. W. Lester and M. Reich 2016. Minimum wage shocks, employment flows, and labor market frictions. Journal of Labor Economics. 34(3): 663-704.
Gobillon, L. and T. Magnac (2016). Regional Policy Evaluation: Interactive Fixed Effects and Synthetic Controls. Review of Economics and Statistics, 98(3): 535-551.
Katz, L., and A. Krueger. 1992. The Effect of the Minimum Wage on the Fast-Food Industry. Industrial and Labor Relations Review 46(1): 6–21.
Kim, T. and L. Taylor. 1995. The Employment Effect in Retail Trade of California's 1988 Minimum Wage Increase. Journal of Business & Economic Statistics 13(2): 175-182.
Klawitter, M., M. Long, and R. Plotnick. 2014. Who Would be Affected by an Increase in Seattle’s Minimum Wage? Report for the City of Seattle, Income Inequality Advisory Committee. http://evans.uw.edu/sites/default/files/public/Evans_School_Min_Wage_report.pdf
Neumark, D. and W. Wascher. 2011. Does a Higher Minimum Wage Enhance the Effectiveness of the Earned Income Tax Credit? Industrial and Labor Relations Review 64(5) 712-746.
Long, M, R. Plotnick, E. Roshchina, E. van Inwegen, J. Vigdor, and H. Wething. 2017. The Extent of Local Minimum Wage Spillovers. Working Paper. University of Washington.
Neumark, D. and W. Wascher. 1994.“Employment Effects of Minimum and Subminimum Wages: Reply to Card, Katz and Krueger, Industrial and Labor Relations Review, pp. 497-512.
Neumark, D. and W. Wascher. 1995. Minimum Wages and Employment: A Case Study of the Fast-Food Industry in New Jersey and Pennsylvania: Comment. American Economic Review, 2000, vol. 90, issue 5, pages 1362-1396
Neumark, D., Salas, I and W. Wascher. 2004. The Influence of Labour Market Institutions on the Disemployment Effects of the Minimum Wage. CESifo Database for Institutional Comparisons in Europe, pp. 40-47.
Neumark, D. and W. Wascher. 2008. Minimum Wages. Cambridge: MIT Press.
Neumark, D., Salas, I and W. Wascher. 2014. Revisiting the Minimum Wage-Employment Debate: Throwing Out the Baby with the Bathwater? ILRReview 67(3): 608-648.
Pesaran, M. H. 2006. Estimation and Inference in Large Heterogenous Panels with Multifactor Error Structure. Econometrica 74: 967-1012.
Potter, N. 2006. Measuring the Employment Impacts of the Living Wage Ordinance Santa Fe, New Mexico. University of New Mexico, Bureau of Business and Economic Research. https://bber.unm.edu/pubs/EmploymentLivingWageAnalysis.pdf

Preliminary. Please do not cite without permission
23
Schmitt, J. and Rosnick, D. 2011. The Wage and Employment Impact of Minimum-Wage Laws in Three Cities. Center for Economic and Policy Research. http://www.cepr.net/documents/publications/min-wage-2011-03.pdf
The Seattle Minimum Wage Study Team. 2016. Report on the Impact of Seattle’s Minimum Wage Ordinance on Wages, Workers, Jobs, and Establishments Through 2015. Seattle. University of Washington. https://evans.uw.edu/sites/default/files/MinWageReport-July2016_Final.pdf
Totty, E.. 2015. The Effect of Minimum Wages on Employment: A Factor Model Approach. http://www.irle-demo.berkeley.edu/workingpapers/110-15.pdf

Preliminary. Please do not cite without permission
24
Tables and Figures
Table 1: Minimum Wage Schedule in Seattle under the Seattle Minimum Wage Ordinance
No benefits With benefits** No benefits or tipsBenefits ot tips***
$9.47 $9.47 $9.47 $9.47
$11.00 $11.00 $11.00 $10.00$13.00 $12.50 $12.00 $10.50$15.00 $13.50 $13.00 $11.00
$15.00 $14.00 $11.50$15.00 $12.00
$13.50$15.00
Notes: * A large employer employes 501 or more employers worldwide, including all franchises
associated with a franchise or a network of franchises ** Employers who pay towards medical benefits *** Employers who pay toward medical benefits and/or employees who are paid tips.
Total minimum hourly compensations (inluding tips and benefits) is the same as for small employers who do not pay towards medical benefits and/or tips
**** After the minimum wage raches $15.00 for each schedule, it is indexed to inflation usingCPI-W for Seattle-Tacoma-Bremerton Area.
January 1, 2010January 1, 2021
January 1, 2015
April 1, 2015January 1, 2016January 1, 2017January 1, 2018January 1, 2019
Large Employers* Small Employers(501 and more employees worldwide) (up to 500 employees worldwide)
Before Seattle MW Ordinance
After Seattle MW Ordinance****

Preliminary. Please do not cite without permission
25
Figure 1: Definition of Cohorts
……
2005 Q2 2005 Q4 2006 Q2 2006 Q4 2007 Q2 2007 Q4 … 2013 Q2 2013 Q4 2014 Q2 2014 Q4 2015 Q2 2015 Q4
Minimum wage ordinance passed
Minimum wage ordinance went in effect
2005 cohort
2006 cohort
2014 cohort
2013 cohort
2007 cohort
2012 cohort

Preliminary. Please do not cite without permission
26
Figure 2: Geography of Seattle and King, Snohomish, Kitsap, and Pierce Counties
Panel A: Seattle’s Water Boundaries
Source: https://www.google.com/maps/
Panel B: Difference-in-Difference Regions
Panel C: Population Density by Census Block, 2010
Source: http://www.ofm.wa.gov/pop/census2010/pl/maps/map05.asp

Preliminary. Please do not cite without permission
27
Figure 3: Geography of Washington’s PUMAs

Preliminary. Please do not cite without permission
28
Table 2: Number of Jobs, Total Hours, and Average Wages in Seattle, Before and After Enforcement of the Seattle Minimum Wage Ordinance
Panel A: All Industries
Jobs Jobs All Jobs Jobs Jobs All Jobs Jobs All JobsPassage Enforcement paying <$11 paying <$19 paying <$11 paying <$19 paying <$19
0 20,602 93,007 292,729 6,643 37,408 130,007 $14.14 $36.931 20,218 94,967 301,010 6,596 38,565 132,604 $14.15 $37.762 15,347 89,650 303,196 4,696 35,589 136,012 $14.37 $39.783 14,776 90,886 305,381 4,298 34,269 132,275 $14.41 $40.614 1 11,669 92,775 312,071 3,519 37,270 139,197 $14.48 $38.525 2 6,782 93,498 321,044 2,124 37,472 142,639 $14.58 $39.836 3 5,441 87,219 320,506 1,697 34,943 146,960 $14.74 $41.73
Panel B: Food and Drinking Places (NAICS 722)
Jobs Jobs All Jobs Jobs Jobs All Jobs Jobs All JobsPassage Enforcement paying <$11 paying <$19 paying <$11 paying <$19 paying <$19
0 6,628 21,812 32,661 2,240 8,198 11,938 $13.10 $17.771 6,835 22,623 34,366 2,285 8,685 12,787 $13.21 $18.002 5,673 22,401 34,823 1,752 8,276 12,514 $13.48 $18.763 5,462 22,540 34,907 1,597 7,912 12,006 $13.55 $18.914 1 3,893 22,251 35,102 1,155 8,380 12,758 $13.77 $18.745 2 2,062 22,782 36,619 610 8,806 13,668 $14.01 $19.136 3 1,670 22,710 37,227 476 8,561 13,577 $14.26 $19.83
Average Wages
Average WagesQuarters After:
Quarters After:
Number of Jobs Total Hours (000s)
Number of Jobs Total Hours (000s)

Preliminary. Please do not cite without permission
29
Table 3: Examining Jobs at All Wage Levels Yields Attenuated Estimates of the Impact of the Seattle Minimum Wage Ordinance
MethodControl Region
IndustrySample
Outcome
Passage Enforcement Coef. SE Sig. Coef. SE Sig. Coef. SE Sig.1 -0.006 0.009 -0.012 0.013 -0.016 0.0132 0.018 0.018 0.008 0.025 -0.007 0.0153 0.003 0.022 -0.007 0.024 -0.019 0.0134 1 0.001 0.025 -0.021 0.030 -0.041 0.018 ***5 2 -0.040 0.018 *** -0.073 0.020 *** -0.080 0.018 ***6 3 -0.025 0.023 -0.055 0.028* -0.043 0.021 **
Attenuation of the coefficients in Column (1) relative to this column
5 2 45% 49%6 3 54% 43%
Notes:DnD = Difference in DifferencesNAICS 722 = Food services and drinking places***, **, and * denote statistically significance using a two-tailed test with p ≤ 0.01, 0.05, and 0.10,
respectively.
Number of Jobs
(3)DnD
King CountyNAICS 722
Jobs Paying <$19Total Hours
Jobs Paying <$19
(1) (2)DnD
King CountyNAICS 722
Quarters After:
DnDKing CountyNAICS 722
All JobsNumber of Jobs

Preliminary. Please do not cite without permission
30
Table 4: Examining Food Service and Drinking Places, Rather than All Industries, Likely Yields Inflated Estimates of the Impact of the Seattle Minimum Wage Ordinance
MethodControl Region
IndustrySample
Outcome
Passage Enforcement Coef. SE Sig. Coef. SE Sig. Coef. SE Sig. Coef. SE Sig. Coef. SE Sig.1 -0.016 0.013 -0.006 0.010 -0.015 (0.007)** 0.001 (0.015) -0.003 (0.003)2 -0.007 0.015 0.005 0.007 -0.006 (0.009) -0.017 (0.015) -0.004 (0.003) *3 -0.019 0.013 -0.021 0.009*** -0.031 (0.008)*** -0.007 (0.018) 0.002 (0.006)4 1 -0.041 0.018*** -0.016 0.006*** -0.037 (0.011)*** -0.021 (0.021) -0.022 (0.005)***5 2 -0.080 0.018*** -0.045 0.013*** -0.077 (0.015)*** -0.025 (0.028) -0.022 (0.008)***6 3 -0.043 0.021** -0.045 0.009*** -0.066 (0.013)*** -0.016 (0.020) -0.034 (0.012)***
Attenuation of the coefficients in this column relative to Column (1)
4 1 39% 89% 52% 54%5 2 56% 97% 31% 28%6 3 103% 153% 38% 79%
Notes:DnD = Difference in DifferencesNAICS 722 = Food services and drinking placesSKP = Snohomish, Kitsap, and Pierce Counties***, **, and * denote statistically significance using a two-tailed test with p ≤ 0.01, 0.05, and 0.10, respectively.
SKPNAICS 722 All Industries All Industries
(1) (2) (3)DnD DnD DnD
Total Hours
Quarters After:
(4)Synthetic ControlWA excl. King Co.
All IndustriesJobs Paying <$19
Total HoursJobs Paying <$19 Jobs Paying <$19 Jobs Paying <$19
Total Hours Total Hours Total Hours
King County King County
(5)Interactive FE
WA excl. King Co.All Industries
Jobs Paying <$19

Preliminary. Please do not cite without permission
31
Figure 4: Estimated impact of minimum wage on average wage rate in the 2nd quarter after enforcement, by wage rate cutoff, all industries
Note: Vertical axes scaled in percent.

Preliminary. Please do not cite without permission
32
Figure 5: Estimated impact of minimum wage on the number of beginning-of-quarter jobs rate in the 2nd quarter after enforcement, by wage rate cutoff, all industries
Note: Vertical axes scaled in percent.

Preliminary. Please do not cite without permission
33
Figure 6: Estimated impact of minimum wage on the number of hours worked rate in the 2nd quarter after enforcement, by wage rate cutoff, all industries
Note: Vertical axes scaled in percent.

Preliminary. Please do not cite without permission
34
Table 5: Elasticity of Hours with Respect to Change in Wages Induced by the Seattle Minimum Wage Ordinance, Interactive Fixed Effects Models
(3) (4)Method Elasticity Elasticity
Control Region Defined as Defined asIndustry (1) / (2) (1) / Pct. ChangeSample in Min. Wage
Outcome
Passage Enforcement Coef. SE Sig. Coef. SE Sig. Coef. 1 -0.003 (0.003) -0.006 (0.002)*** 0.546 -0.0192 -0.004 (0.003) * -0.003 (0.002) * 1.532 -0.0273 0.002 (0.006) 0.002 (0.002) 1.390 0.0154 1 -0.022 (0.005)*** 0.007 (0.002) *** -3.098 -0.1375 2 -0.022 (0.008)*** 0.006 (0.002) *** -3.576 -0.1386 3 -0.034 (0.012)*** 0.008 (0.002) *** -4.110 -0.212
(3) (4)Method Elasticity Elasticity
Control Region Defined as Defined asIndustry (1) / (2) (1) / Pct. ChangeSample in Min. Wage
Outcome
Passage Enforcement Coef. SE Sig. Coef. SE Sig. Coef. 1 0.003 (0.004) -0.006 (0.002)*** -0.469 0.0172 0.000 (0.005) -0.003 (0.002) * 0.172 -0.0033 -0.009 (0.008) 0.002 (0.002) -5.422 -0.0584 1 -0.015 (0.008) * 0.007 (0.002) *** -2.046 -0.0915 2 -0.012 (0.006) ** 0.006 (0.002) *** -1.918 -0.0746 3 -0.031 (0.012)*** 0.008 (0.002) *** -3.739 -0.193
Notes:***, **, and * denote statistically significance using a two-tailed test with p ≤ 0.01, 0.05, and 0.10, respectively.The percentage change in the minimum wage that is used in Column (4) is equal to ($11-$9.47)/$9.47, or 16%.
Quarters After:
Number of Jobs Hourly Wages
WA excl. King Co. WA excl. King Co.All Industries All Industries
Jobs Paying <$19 Jobs Paying <$19
(1) (2)Interactive FE Interactive FE
Quarters After:
(1)
Hourly Wages
Interactive FEWA excl. King Co.
All IndustriesJobs Paying <$19
Total Hours
(2)Interactive FE
WA excl. King Co.All Industries
Jobs Paying <$19

Preliminary. Please do not cite without permission
35
Figure 7: Estimated elasticity of labor demand using number of beginning-of-quarter jobs. All industries.
Note: Vertical axes scaled in percent.
Figure 8: Estimated elasticity of labor demand using number of hours worked. All industries.
Note: Vertical axes scaled in percent.

Preliminary. Please do not cite without permission
36
Table 6: Elasticity Estimates Using the Conventional Calculation for 2nd Quarter after Enforcement of the Seattle Minimum Wage Ordinance
All Jobs Jobs <$19 All Jobs Jobs <$19
Panel A: All Industries
DnD relative to King County 0.16 -0.23 0.18 -0.28DnD relative to Snohomish, Kitsap, and Pierce Counties -0.05 -0.41 -0.02 -0.48Synthetic Control 0.04 -0.21 0.00 -0.15Interactive FE 0.08 -0.07 0.05 -0.14
Panel B: Food and Drinking Places (NAICS 722)
DnD relative to King County -0.25 -0.45 -0.34 -0.49DnD relative to Snohomish, Kitsap, and Pierce Counties -0.38 -0.62 -0.54 -0.76Synthetic Control -0.32 -0.51 -0.39 -0.58Interactive FE -0.18 -0.25 -0.15 -0.34
Notes: Elasticity defined as percentage change in outcome (i.e., employment or hours) / (($11-$9.47)/$9.47), or 16%.SKP = Snohomish, Kitsap, and Pierce Counties
Employment Hours

Preliminary. Please do not cite without permission
37
Appendix Table 1: Elasticity Estimates from Selected Literature
PaperLevel of
Government Industry and Outcome Years Method Elasticity
Totty, 2015 State Restaurant Employment 1990-2010 Interactive FE -0.04All Jobs Common Correlated Effects-Pooled Estimator -0.01
Common Correlated Effects-Mean Group Estimator -0.01NSW, 2014 State Restaurant Employment 2000-2011 DnD (State and Time FE) -0.12
All Jobs Synthetic Matching Estimator -0.06DLR, 2010 State Restaurant Employment 1990-2006 DnD (Census division-by-period fixed effects and County FE) -0.02
All Jobs + State linear trend -0.04Contiguous Border County Pair Sample (County and Quarter FE) -0.11Contiguous Border County Pair Sample (County-pair × period FE) 0.02
DLR, 2016 State Restaurant Employment 2000-2011 DnD (County and Quarter FE) -0.07All Jobs DnD (Contiguous County-Pair Quarter FE + County FE) -0.02
ABC, 2014 State Restaurant Employment 1990-2005 DnD (County and Quarter Fixed Effects) -0.10All Jobs + Linear County Trends -0.01
+ Quadratic County Trends -0.05+ Cubic County Trends -0.04+ Quartic County Trends -0.06+ Fifth-order County Trends -0.05
Restaurant Employment 1990-2012 DnD (County and Quarter FE) 0.00All Jobs + Linear County Trends -0.04
+ Quadratic County Trends -0.02+ Cubic County Trends -0.04+ Quartic County Trends -0.02+ Fifth-order County Trends -0.01
ALDRZ, 2016 State Restaurant Employment 1990-2014 DnD relative to All Counties (County and Quarter FE) -0.24All Jobs DnD Contiguous Border County Pair with (County and Quarter FE)-0.18
DnD Contiguous Border County Pair with (County-pair × Quarter FE) 0.02
Unweighted Average -0.05Unweighted Standard Deviation 0.06
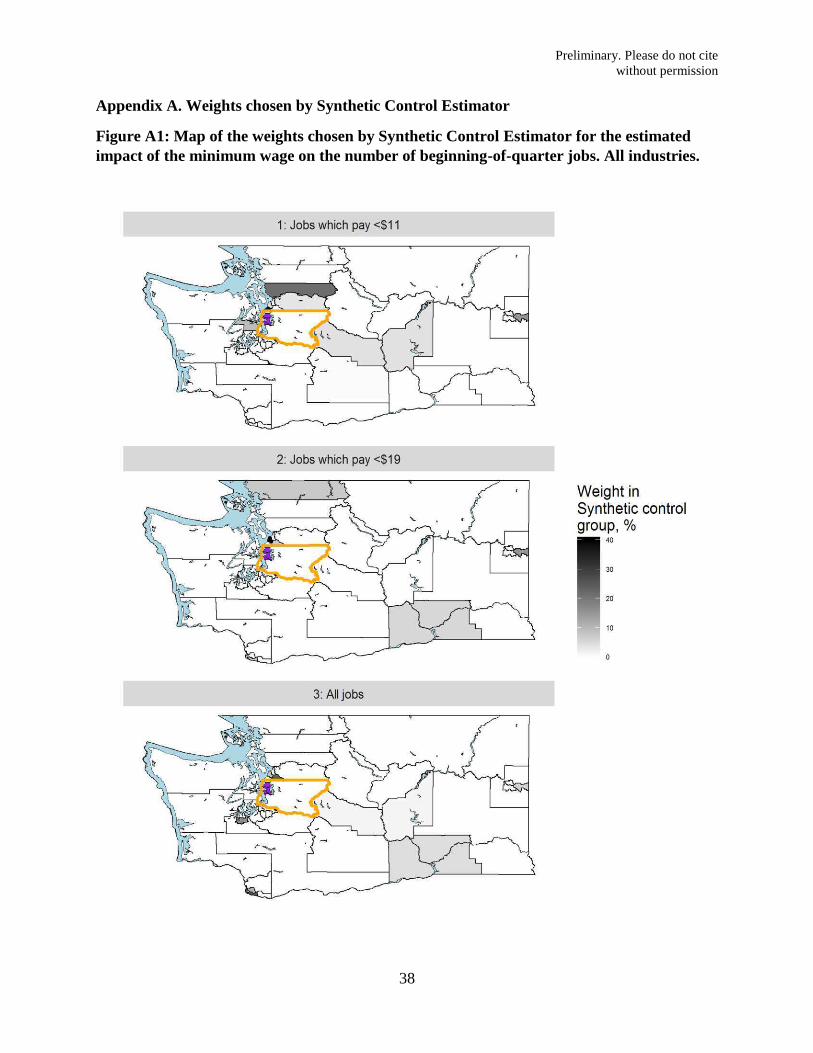
Preliminary. Please do not cite without permission
38
Appendix A. Weights chosen by Synthetic Control Estimator
Figure A1: Map of the weights chosen by Synthetic Control Estimator for the estimated impact of the minimum wage on the number of beginning-of-quarter jobs. All industries.
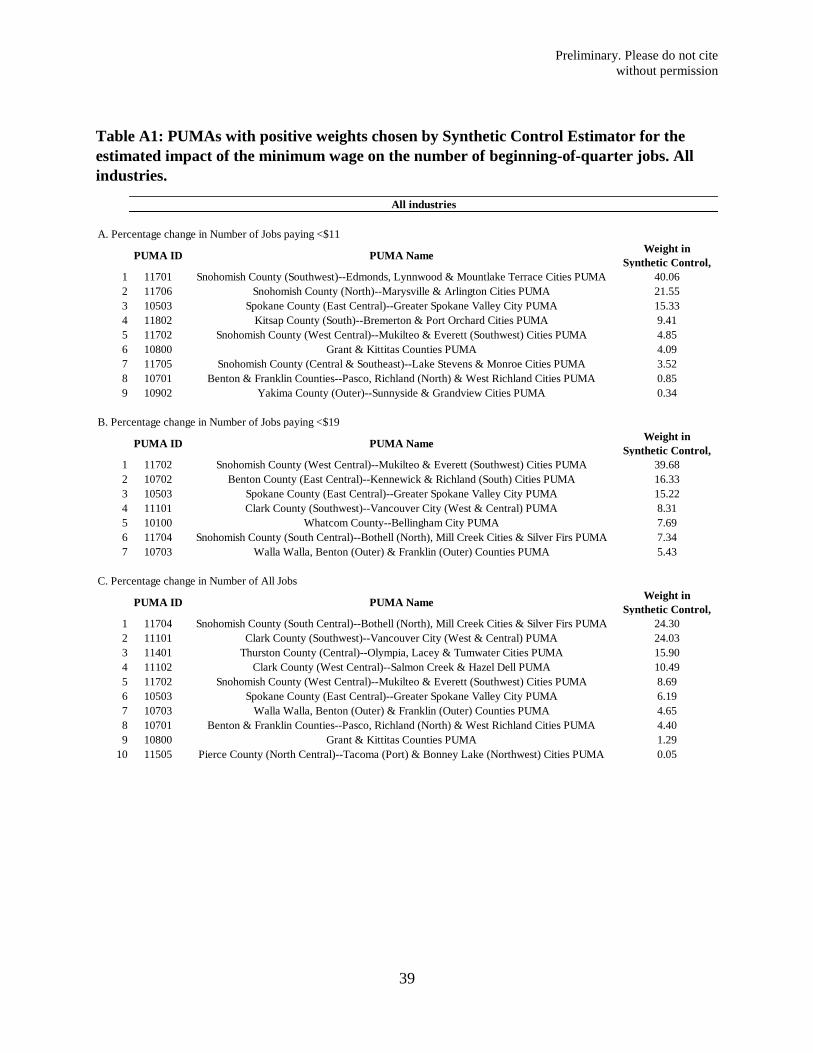
Preliminary. Please do not cite without permission
39
Table A1: PUMAs with positive weights chosen by Synthetic Control Estimator for the estimated impact of the minimum wage on the number of beginning-of-quarter jobs. All industries.
A. Percentage change in Number of Jobs paying <$11
PUMA ID PUMA NameWeight in
Synthetic Control, 1 11701 Snohomish County (Southwest)--Edmonds, Lynnwood & Mountlake Terrace Cities PUMA 40.062 11706 Snohomish County (North)--Marysville & Arlington Cities PUMA 21.553 10503 Spokane County (East Central)--Greater Spokane Valley City PUMA 15.334 11802 Kitsap County (South)--Bremerton & Port Orchard Cities PUMA 9.415 11702 Snohomish County (West Central)--Mukilteo & Everett (Southwest) Cities PUMA 4.856 10800 Grant & Kittitas Counties PUMA 4.097 11705 Snohomish County (Central & Southeast)--Lake Stevens & Monroe Cities PUMA 3.528 10701 Benton & Franklin Counties--Pasco, Richland (North) & West Richland Cities PUMA 0.859 10902 Yakima County (Outer)--Sunnyside & Grandview Cities PUMA 0.34
B. Percentage change in Number of Jobs paying <$19
PUMA ID PUMA NameWeight in
Synthetic Control, 1 11702 Snohomish County (West Central)--Mukilteo & Everett (Southwest) Cities PUMA 39.682 10702 Benton County (East Central)--Kennewick & Richland (South) Cities PUMA 16.333 10503 Spokane County (East Central)--Greater Spokane Valley City PUMA 15.224 11101 Clark County (Southwest)--Vancouver City (West & Central) PUMA 8.315 10100 Whatcom County--Bellingham City PUMA 7.696 11704 Snohomish County (South Central)--Bothell (North), Mill Creek Cities & Silver Firs PUMA 7.347 10703 Walla Walla, Benton (Outer) & Franklin (Outer) Counties PUMA 5.43
C. Percentage change in Number of All Jobs
PUMA ID PUMA NameWeight in
Synthetic Control, 1 11704 Snohomish County (South Central)--Bothell (North), Mill Creek Cities & Silver Firs PUMA 24.302 11101 Clark County (Southwest)--Vancouver City (West & Central) PUMA 24.033 11401 Thurston County (Central)--Olympia, Lacey & Tumwater Cities PUMA 15.904 11102 Clark County (West Central)--Salmon Creek & Hazel Dell PUMA 10.495 11702 Snohomish County (West Central)--Mukilteo & Everett (Southwest) Cities PUMA 8.696 10503 Spokane County (East Central)--Greater Spokane Valley City PUMA 6.197 10703 Walla Walla, Benton (Outer) & Franklin (Outer) Counties PUMA 4.658 10701 Benton & Franklin Counties--Pasco, Richland (North) & West Richland Cities PUMA 4.409 10800 Grant & Kittitas Counties PUMA 1.29
10 11505 Pierce County (North Central)--Tacoma (Port) & Bonney Lake (Northwest) Cities PUMA 0.05
All industries

Preliminary. Please do not cite without permission
40
Figure A2: Map of the weights chosen by Synthetic Control Estimator for the estimated impact of the minimum wage on the number of hours worked. All industries.

Preliminary. Please do not cite without permission
41
Table A2: PUMAs with positive weights chosen by Synthetic Control Estimator for the estimated impact of the minimum wage on the number of hours worked. All industries.
A. Percentage change in Hours Worked at Jobs paying <$11
PUMA ID PUMA NameWeight in
Synthetic Control, %
1 10502 Spokane County (South Central)--Spokane City (South) PUMA 25.322 10701 Benton & Franklin Counties--Pasco, Richland (North) & West Richland Cities PUMA 16.823 11704 Snohomish County (South Central)--Bothell (North), Mill Creek Cities & Silver Firs PUMA 16.294 11706 Snohomish County (North)--Marysville & Arlington Cities PUMA 10.905 11104 Clark County (North)--Battle Ground City & Orchards PUMA 10.856 11000 Lewis, Klickitat & Skamania Counties PUMA 6.847 11505 Pierce County (North Central)--Tacoma (Port) & Bonney Lake (Northwest) Cities PUMA 4.648 10503 Spokane County (East Central)--Greater Spokane Valley City PUMA 3.299 11402 Thurston County (Outer) PUMA 2.36
10 11501 Pierce County (Central)--Tacoma City (Central) PUMA 1.5411 11705 Snohomish County (Central & Southeast)--Lake Stevens & Monroe Cities PUMA 1.15
B. Percentage change in Hours Worked at jobs paying <$19
PUMA ID PUMA NameWeight in
Synthetic Control, %
1 11706 Snohomish County (North)--Marysville & Arlington Cities PUMA 20.402 11402 Thurston County (Outer) PUMA 19.543 10100 Whatcom County--Bellingham City PUMA 12.734 11702 Snohomish County (West Central)--Mukilteo & Everett (Southwest) Cities PUMA 11.565 10800 Grant & Kittitas Counties PUMA 8.016 11505 Pierce County (North Central)--Tacoma (Port) & Bonney Lake (Northwest) Cities PUMA 6.987 11507 Pierce County (Southeast)--Graham, Elk Plain & Prairie Ridge PUMA 5.608 10300 Chelan & Douglas Counties PUMA 4.619 11501 Pierce County (Central)--Tacoma City (Central) PUMA 4.57
10 11704 Snohomish County (South Central)--Bothell (North), Mill Creek Cities & Silver Firs PUMA 2.1511 11703 Snohomish County (Central)--Everett City (Central & East) & Eastmont PUMA 1.9912 11102 Clark County (West Central)--Salmon Creek & Hazel Dell PUMA 1.0113 10503 Spokane County (East Central)--Greater Spokane Valley City PUMA 0.85
C. Percentage change in Hours Worked at All Jobs
PUMA ID PUMA NameWeight in
Synthetic Control, %
1 11401 Thurston County (Central)--Olympia, Lacey & Tumwater Cities PUMA 35.082 11704 Snohomish County (South Central)--Bothell (North), Mill Creek Cities & Silver Firs PUMA 19.503 11505 Pierce County (North Central)--Tacoma (Port) & Bonney Lake (Northwest) Cities PUMA 16.894 10701 Benton & Franklin Counties--Pasco, Richland (North) & West Richland Cities PUMA 13.845 11102 Clark County (West Central)--Salmon Creek & Hazel Dell PUMA 7.396 11402 Thurston County (Outer) PUMA 6.157 10800 Grant & Kittitas Counties PUMA 0.978 10100 Whatcom County--Bellingham City PUMA 0.19
All industries
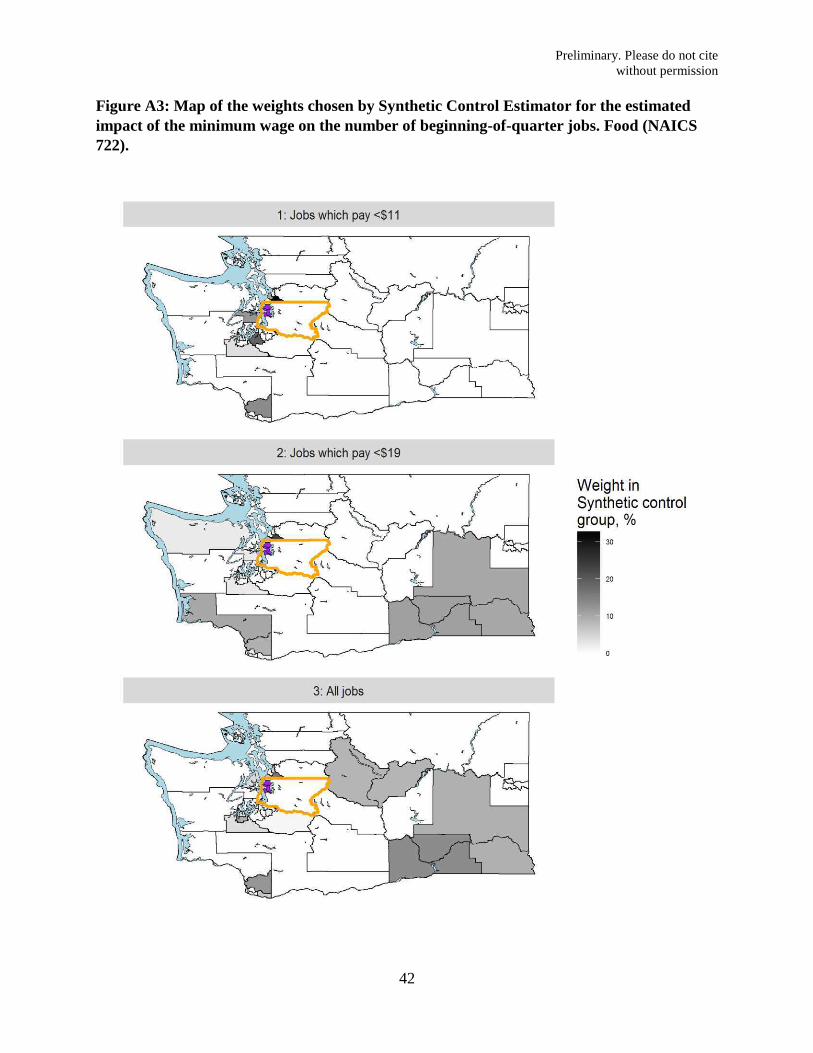
Preliminary. Please do not cite without permission
42
Figure A3: Map of the weights chosen by Synthetic Control Estimator for the estimated impact of the minimum wage on the number of beginning-of-quarter jobs. Food (NAICS 722).

Preliminary. Please do not cite without permission
43
Table A3: PUMAs with positive weights chosen by Synthetic Control Estimator for the estimated impact of the minimum wage on the number of beginning-of-quarter jobs. Food and Drinking Places (NAICS 722).
A. Percentage change in Number of Jobs paying <$11
PUMA ID PUMA NameWeight in
Synthetic Control, 1 11704 Snohomish County (South Central)--Bothell (North), Mill Creek Cities & Silver Firs PUMA 32.552 11503 Pierce County (West Central)--Lakewood City & Joint Base Lewis-McChord PUMA 18.843 11104 Clark County (North)--Battle Ground City & Orchards PUMA 13.584 11802 Kitsap County (South)--Bremerton & Port Orchard Cities PUMA 12.225 11702 Snohomish County (West Central)--Mukilteo & Everett (Southwest) Cities PUMA 10.706 10702 Benton County (East Central)--Kennewick & Richland (South) Cities PUMA 8.617 11402 Thurston County (Outer) PUMA 3.49
B. Percentage change in Number of Jobs paying <$19
PUMA ID PUMA NameWeight in
Synthetic Control, 1 11704 Snohomish County (South Central)--Bothell (North), Mill Creek Cities & Silver Firs PUMA 23.482 10702 Benton County (East Central)--Kennewick & Richland (South) Cities PUMA 11.713 10703 Walla Walla, Benton (Outer) & Franklin (Outer) Counties PUMA 10.934 10600 Whitman, Asotin, Adams, Lincoln, Columbia & Garfield Counties PUMA 10.045 11200 Cowlitz, Pacific & Wahkiakum Counties PUMA 9.996 11104 Clark County (North)--Battle Ground City & Orchards PUMA 9.027 11701 Snohomish County (Southwest)--Edmonds, Lynnwood & Mountlake Terrace Cities PUMA 8.548 10901 Yakima County (Central)--Greater Yakima City PUMA 4.099 11102 Clark County (West Central)--Salmon Creek & Hazel Dell PUMA 2.52
10 11900 Clallam & Jefferson Counties PUMA 2.2111 11802 Kitsap County (South)--Bremerton & Port Orchard Cities PUMA 2.2112 11402 Thurston County (Outer) PUMA 2.2113 11703 Snohomish County (Central)--Everett City (Central & East) & Eastmont PUMA 1.5614 11103 Clark County (Southeast)--Vancouver (East), Camas & Washougal Cities PUMA 1.49
C. Percentage change in Number of All Jobs
PUMA ID PUMA NameWeight in
Synthetic Control, 1 11704 Snohomish County (South Central)--Bothell (North), Mill Creek Cities & Silver Firs PUMA 15.732 10703 Walla Walla, Benton (Outer) & Franklin (Outer) Counties PUMA 13.453 11104 Clark County (North)--Battle Ground City & Orchards PUMA 12.314 11401 Thurston County (Central)--Olympia, Lacey & Tumwater Cities PUMA 9.195 10600 Whitman, Asotin, Adams, Lincoln, Columbia & Garfield Counties PUMA 9.106 10300 Chelan & Douglas Counties PUMA 8.457 11701 Snohomish County (Southwest)--Edmonds, Lynnwood & Mountlake Terrace Cities PUMA 6.928 11103 Clark County (Southeast)--Vancouver (East), Camas & Washougal Cities PUMA 6.219 11703 Snohomish County (Central)--Everett City (Central & East) & Eastmont PUMA 5.13
10 11801 Kitsap County (North)--Bainbridge Island City & Silverdale PUMA 4.1011 11402 Thurston County (Outer) PUMA 3.6812 10702 Benton County (East Central)--Kennewick & Richland (South) Cities PUMA 2.4613 11506 Pierce County (East Central)--Puyallup City & South Hill PUMA 2.3214 11507 Pierce County (Southeast)--Graham, Elk Plain & Prairie Ridge PUMA 0.94
Food and Drinking places (NAICS 722)

Preliminary. Please do not cite without permission
44
Figure A4: Map of the weights chosen by Synthetic Control Estimator for the estimated impact of the minimum wage on the number of hours worked. Food and Drinking Places (NAICS 722).

Preliminary. Please do not cite without permission
45
Table A4: PUMAs with positive weights chosen by Synthetic Control Estimator for the estimated impact of the minimum wage on the number of hours worked. Food and Drinking Places (NAICS 722).
A. Percentage change in Hours Worked at Jobs paying <$11
PUMA ID PUMA NameWeight in
Synthetic Control, 1 11706 Snohomish County (North)--Marysville & Arlington Cities PUMA 27.982 11701 Snohomish County (Southwest)--Edmonds, Lynnwood & Mountlake Terrace Cities PUMA 22.043 11200 Cowlitz, Pacific & Wahkiakum Counties PUMA 19.934 11704 Snohomish County (South Central)--Bothell (North), Mill Creek Cities & Silver Firs PUMA 16.115 11702 Snohomish County (West Central)--Mukilteo & Everett (Southwest) Cities PUMA 6.636 11501 Pierce County (Central)--Tacoma City (Central) PUMA 3.797 11402 Thurston County (Outer) PUMA 2.018 11703 Snohomish County (Central)--Everett City (Central & East) & Eastmont PUMA 1.51
B. Percentage change in Hours Worked at jobs paying <$19
PUMA ID PUMA NameWeight in
Synthetic Control, 1 10702 Benton County (East Central)--Kennewick & Richland (South) Cities PUMA 19.292 11701 Snohomish County (Southwest)--Edmonds, Lynnwood & Mountlake Terrace Cities PUMA 16.373 11503 Pierce County (West Central)--Lakewood City & Joint Base Lewis-McChord PUMA 12.824 11704 Snohomish County (South Central)--Bothell (North), Mill Creek Cities & Silver Firs PUMA 12.165 10703 Walla Walla, Benton (Outer) & Franklin (Outer) Counties PUMA 11.746 11506 Pierce County (East Central)--Puyallup City & South Hill PUMA 6.997 11505 Pierce County (North Central)--Tacoma (Port) & Bonney Lake (Northwest) Cities PUMA 6.918 11703 Snohomish County (Central)--Everett City (Central & East) & Eastmont PUMA 5.669 11104 Clark County (North)--Battle Ground City & Orchards PUMA 4.67
10 11200 Cowlitz, Pacific & Wahkiakum Counties PUMA 3.39
C. Percentage change in Hours Worked at All Jobs
PUMA ID PUMA NameWeight in
Synthetic Control, 1 11505 Pierce County (North Central)--Tacoma (Port) & Bonney Lake (Northwest) Cities PUMA 17.202 11704 Snohomish County (South Central)--Bothell (North), Mill Creek Cities & Silver Firs PUMA 15.543 11506 Pierce County (East Central)--Puyallup City & South Hill PUMA 14.124 10702 Benton County (East Central)--Kennewick & Richland (South) Cities PUMA 13.485 11701 Snohomish County (Southwest)--Edmonds, Lynnwood & Mountlake Terrace Cities PUMA 12.486 11503 Pierce County (West Central)--Lakewood City & Joint Base Lewis-McChord PUMA 12.407 11104 Clark County (North)--Battle Ground City & Orchards PUMA 7.888 10703 Walla Walla, Benton (Outer) & Franklin (Outer) Counties PUMA 2.989 11702 Snohomish County (West Central)--Mukilteo & Everett (Southwest) Cities PUMA 2.13
10 11507 Pierce County (Southeast)--Graham, Elk Plain & Prairie Ridge PUMA 1.7411 11402 Thurston County (Outer) PUMA 0.06
Food and Drinking places (NAICS 722)

Preliminary. Please do not cite without permission
46
Appendix B. Sensitivity of the Interactive Fixed Effects Estimates
Figure B1: Estimated impact of the minimum wage on the number of beginning-of-quarter jobs, six quarters after the baseline (three quarters after the minimum wage hike). All industries.

Preliminary. Please do not cite without permission
47
Figure B2: Estimated impact of the minimum wage on the hours worked, six quarters after the baseline (three quarters after the minimum wage hike). All industries.

Preliminary. Please do not cite without permission
48
Figure B3: Estimated impact of the minimum wage on the number of beginning-of-quarter jobs, six quarters after the baseline (three quarters after the minimum wage hike). Food and Drinking Places (NAICS 722).

Preliminary. Please do not cite without permission
49
Figure B4: Estimated impact of the minimum wage on the hours worked, six quarters after the baseline (three quarters after the minimum wage hike). Food and Drinking Places (NAICS 722).