evidence report: risk of inadequate human-computer interaction · 13-06-2013 · the risk of...
TRANSCRIPT

Human Research Program
Space Human Factors and Habitability
Approved for Public Release: June 13, 2013
National Aeronautics and Space Administration
Lyndon B. Johnson Space Center
Houston, Texas
Evidence Report:
Risk of Inadequate Human-Computer Interaction
Kritina Holden, Ph.D. Lockheed Martin, NASA Johnson Space Center
Neta Ezer, Ph.D. Futron Corporation, NASA Johnson Space Center
Gordon Vos, Ph.D. Wyle Life Sciences, NASA Johnson Space Center

2
TABLE OF CONTENTS
I. RISK OF INADEQUATE HUMAN-COMPUTER INTERACTION .. . . . . . 3
II. EXECUTIVE SUMMARY ... . . . . . . . . . . . . . . . . . . . . . . . . . . . . . . . . . . . . . . . . . . . . . . . . . . . . . . . . . . . . . . . 3
III. INTRODUCTION .. . . . . . . . . . . . . . . . . . . . . . . . . . . . . . . . . . . . . . . . . . . . . . . . . . . . . . . . . . . . . . . . . . . . . . . . . . . . . 4
A. Risk Statement ............................................................................................................... 4
B. Risk Overview ................................................................................................................ 4
C. Dependencies & Interrelationships with other Risks ................................................. 6
D. Levels of Evidence .......................................................................................................... 7
IV. EVIDENCE .. . . . . . . . . . . . . . . . . . . . . . . . . . . . . . . . . . . . . . . . . . . . . . . . . . . . . . . . . . . . . . . . . . . . . . . . . . . . . . . . . . . . . . 8
A. Contributing Factor 1: Requirements, Policies, and Design Processes .................... 9
B. Contributing Factor 2: Informational Resources/Support ...................................... 12
C. Contributing Factor 3: Allocation of Attention ........................................................ 17
D. Contributing Factor 4: Cognitive Overload .............................................................. 20
E. Contributing Factor 5: Environmentally Induced Perceptual Changes ................ 22
F. Contributing Factor 6: Misperception/Misinterpretation of Displayed Information........................................................................................................................................ 24
G. Contributing Factor 7: Spatial Disorientation .......................................................... 28
H. Contributing Factor 8: Design of Displays and Controls ......................................... 30
V. COMPUTER BASED MODELING AND SIMULATION .. . . . . . . . . . . . . . . . . . . 33
VI. RISK IN CONTEXT OF EXPLORATION MISSION OPERATIONAL SCENARIOS .. . . . . . . . . . . . . . . . . . . . . . . . . . . . . . . . . . . . . . . . . . . . . . . . . . . . . . . . . . . . . . . . . . . . . . . . . . . . . . . . . . 34
VII. RESEARCH GAPS .. . . . . . . . . . . . . . . . . . . . . . . . . . . . . . . . . . . . . . . . . . . . . . . . . . . . . . . . . . . . . . . . . . . . . . . . . 35
VIII. CONCLUSION .. . . . . . . . . . . . . . . . . . . . . . . . . . . . . . . . . . . . . . . . . . . . . . . . . . . . . . . . . . . . . . . . . . . . . . . . . . . . . . . 36
IX. REFERENCES .. . . . . . . . . . . . . . . . . . . . . . . . . . . . . . . . . . . . . . . . . . . . . . . . . . . . . . . . . . . . . . . . . . . . . . . . . . . . . . . 37
X. TEAM ... . . . . . . . . . . . . . . . . . . . . . . . . . . . . . . . . . . . . . . . . . . . . . . . . . . . . . . . . . . . . . . . . . . . . . . . . . . . . . . . . . . . . . . . . . . 45
XI. LIST OF ACRONYMS .. . . . . . . . . . . . . . . . . . . . . . . . . . . . . . . . . . . . . . . . . . . . . . . . . . . . . . . . . . . . . . . . . . . . 46
3
I. RISK OF INADEQUATE HUMAN-COMPUTER INTERACTION
The Risk of Inadequate Human-Computer Interaction is identified by the National Aeronautics and Space Administration (NASA) Human Research Program (HRP) as a recognized risk to human health and performance in space. The HRP Program Requirements Document defines these risks. This Evidence Report provides a summary of the evidence that has been used to identify and characterize this risk.
II. EXECUTIVE SUMMARY
Human-computer interaction (HCI) encompasses all the methods by which humans and computer-based systems communicate, share information, and accomplish tasks. When HCI is poorly designed, crews have difficulty entering, navigating, accessing, and understanding information.
HCI has rarely been studied in an operational spaceflight context, and detailed performance data that would support evaluation of HCI have not been collected; thus, we draw much of our evidence from post-spaceflight crew comments, and from other safety-critical domains like ground-based power plants, and aviation. Additionally, there is a concern that any potential or real issues to date may have been masked by the fact that crews have near constant access to ground controllers, who monitor for errors, correct mistakes, and provide additional information needed to complete tasks. We do not know what types of HCI issues might arise without this “safety net”. Exploration missions will test this concern, as crews may be operating autonomously due to communication delays and blackouts. Crew survival will be heavily dependent on available electronic information for just-in-time training, procedure execution, and vehicle or system maintenance; hence, the criticality of the Risk of Inadequate HCI. Future work must focus on identifying the most important contributing risk factors, evaluating their contribution to the overall risk, and developing appropriate mitigations.
The Risk of Inadequate HCI includes eight core contributing factors based on the Human Factors Analysis and Classification System (HFACS): 1) Requirements, policies, and design processes, 2) Information resources and support, 3) Allocation of attention, 4) Cognitive overload, 5) Environmentally induced perceptual changes, 6) Misperception and misinterpretation of displayed information, 7) Spatial disorientation, and 8) Displays and controls.

4
III. INTRODUCTION
A. Risk Statement
Given that HCI and information architecture (IA) designs must support crew tasks, and given the greater dependence on HCI in the context of long-duration spaceflight operations, there is a risk that critical information systems will not support crew tasks effectively, resulting in flight and ground crew errors and inefficiencies, failed mission and program objectives, and an increase in crew injuries.
B. Risk Overview
HCI is a discipline that studies and describes how humans and computer-based systems communicate, share information, and accomplish tasks. IA is the categorization of information into a coherent, intuitive, usable structure. When HCI or IA is poorly designed, crews have difficulty entering, navigating, accessing, and understanding information.
Information is presented most effectively when the user’s interests, needs, and knowledge are considered in design. If information displays are not designed with a fully developed operations concept, fine-grained task analysis, and knowledge of human information processing capabilities and limitations, the format, mode, and layout of the information may not optimally support task performance. This may result in users misinterpreting, overlooking, or ignoring the original intent of the information, leading to task completion times that impact the mission timeline, necessitating costly replanning and rescheduling, and/or task execution errors, which endanger mission goals, crew safety, and mission success.
The communication delays expected on long-duration missions will likely result in much greater crew dependence on computer-provided information. Crews will have to rely solely on available electronic information for just-in-time training, task procedures, and maintenance more than ever before. The "safety net" of calling ground control for questions, workarounds, and forgotten procedural steps will no longer be as feasible, and in certain circumstances may not be available at all.
Although much is known about designing systems that provide adequate HCI, exploration missions bring new challenges and risks. Whereas the space shuttle had hundreds of hard switches and buttons, exploration vehicles will feature primarily glass-based interfaces,
5
requiring crew to rely on an input device to interact with software displays and controls (Ezer, 2011). Due to mass restrictions, the real estate for displayed information is likely to be limited, but the amount of information available for display will be greatly increased, posing challenges for information design and navigation schemes. Future vehicles will also fly many new technologies that must be usable with pressurized gloves, in microgravity, and under vibration.
Inadequate HCI can lead to a wide range of potential consequences. There is a significant risk of errors or failure of mission objectives when the crew cannot perform a task because they can neither see nor hear needed information, when wrong information is displayed, when data is unavailable, or when the presented information is confusing. These information-related impacts may be due to IA issues (related to the logical organization of information, allowing users to quickly or easily assimilate data, including what data to display) or related to information presentation (the format of how the information is displayed to the user). There are also risks associated with the design of human interfaces when crewmembers cannot reach controls, have difficulty manipulating them, if controls have unexpected behaviors, are poorly labeled or confusing, or are not available when needed. Additional problems arise when there is improper function allocation between the human and the system, or when the means of interaction with the system is confusing, inefficient, or difficult to learn. These problems are exacerbated when procedures are poor, timelines are challenging or environments are unpredictable or dynamic (e.g., lighting, vibration).
Poor HCI can also reduce efficiency and undermine the added value of computer functionality by imposing overhead tasks on the user. Overhead tasks manifest themselves when poor HCI design requires the user to expend cognitive resources on something other than the task at hand (i.e., navigating or managing the user interface, or performing the additional task of reorganizing the information prior to proceeding with the task). Overhead can also occur when the information presentation aspects of the interface are dissonant with the proper cognitive strategy for executing the task. Overhead can also occur when there is a need to integrate information from multiple sources or when controlling the interface necessitates use of significant attentional resources. Unfortunately, these sources of overhead are not easy to detect or to control, often leaving them uncontrolled. These sources of uncontrolled overhead are a risk to users as well as mission objectives. Usability is therefore inversely related to HCI task overhead, and designers should try to minimize overhead when possible (Zhang and Walji, 2011).
Consequences become potentially far more serious in dynamic flight phases such as launch, docking and landing, when there is very little time available for correcting mistakes. As mission length increases, and ground support decreases, the availability of ground-assisted

6
workarounds will decrease and consequences will increase to a possible failure to achieve mission objectives or potentially loss of mission/loss of crew.
C. Dependencies & Interrelationships with other Risks
The Risk of Inadequate HCI is highly related to several other Space Human Factors Engineering (SHFE) risks, including the Risk of Inadequate Critical Task Design (TASK), the Risk of Inadequate Design of Human and Automation / Robotic Integration (HARI), and the Risk of Performance Errors Due to Training Deficiencies (TRAIN). In the HCI risk, emphasis is primarily on the structure of information, how it is presented to the user, and the methods by which the user interacts with the information. Allocation of attention, cognitive overload, environmentally induced perceptual changes, misperception or misinterpretation of displayed data, and spatial disorientation all fall under this risk. It is particularly characterized by its emphasis on design of displays and controls.
The HARI risk focuses on those issues that are specifically related to semi-autonomous systems – robotics and automation. Since interfaces with such systems are instances of HCI, they rely on HCI to address broad issues that are not specific to robotics and automation. HARI specifically focuses on the assignment of human and automation resources (function allocation) and designs for automation, with emphasis on providing adequate system state information, and over-confidence or lack of trust of automation. Its overall focus is on coordination of humans with robots and automation: the design, function, reliability and use of robotic or automated systems.
The TASK risk is concerned with tasks, schedules and procedures. Most tasks are performed using human-computer interfaces, thus there is a heavy interaction between the TASK and HCI risks. The emphasis in TASK is on factors related to the flow of the work: operational tempo and workload; procedural guidance; training for specific procedural knowledge; and reduction of task overhead. Because of their inherent dependence on the task design, situation awareness (SA) and usability are both considered under this risk, though these are also part of HCI. An integral component of task design is the concept of efficiency. Tasks that are efficient minimize the number of steps required to accomplish their goals, while reducing overhead work and the need for tapping limited resources. Counterbalancing this is the need to provide enough information for accomplishing the task, and to do so without limiting the user’s authority to execute the task. Efficiency is therefore a critical component of task design, one that is closely linked to HCI and usability, including the design of displays and controls, IA, and information presentation (Wesson and Greunen, 2002). Another key factor in task design is the effective

7
management of information and technology from the standpoint of complexity. Some tasks have an inherent complexity involved in their execution due to multidisciplinary interactions, valuation of information, and knowledge management, an issue that has been dealt with extensively in the field of health informatics. Spaceflight, including space medicine, entails many tasks and activities which share this inherent complexity, and careful consideration of these concepts will be key in not only developing mitigation strategies for the TASK risk, but also in its interaction with the IA aspects of HCI design (Norris, 2002).
The TRAIN risk interacts with HCI in two important ways: 1) systems with poor HCI design may be non-intuitive, and require more training, and 2) the adequacy of computer-based training systems depends heavily on the design of the HCI. The research under TRAIN addresses best methods of training for different purposes, including individual and team activities, for skills and knowledge.
SHFE risks also interact with risks from other Elements. For example, within Behavioral Health and Performance, there are risk contributing factors of sleep loss, work overload, cognitive impairment due to medical conditions, operational/task related stressors, and communication. These contributing factors impact crews’ ability to communicate and share information, and interact effectively with computer-based systems, and thus have a potential impact on the HCI risk. SHFE also shares the contributing risk factor of Impaired Manual Control with the Human Health Countermeasures Element. Microgravity, vibration, and deconditioning can affect crews’ ability to perform fine motor control tasks. Fine motor control impairment will impact crews’ ability to interact with computer-based devices, such as cursor control devices.
D. Levels of Evidence
HRP has established four Categories to describe Levels of Evidence, as shown below:
Evidence Category I: At least one randomized, controlled trial.
Evidence Category II: At least one controlled study without randomization, including cohort, case-control, or subject operating as own control.
Evidence Category III: Non-experimental observations or comparative, correlation, and case or case-series studies.
Evidence Category IV: Expert committee reports or opinions of respected authorities based on clinical experiences, bench research, or “first principles.”

8
Evidence for the Risk of Inadequate HCI encompasses lessons learned from 50 years of spaceflight experience, aviation, and ground-based research. A large majority of the evidence comes from crew reports and accident investigation reports. As these include summaries of subjective experience, expert opinions, and non-experimental observations, they are classified as Evidence Categories III and IV.
Much of the evidence comes from aviation research and accident reports because the number of commercial, military, and private flights each year far exceeds the number of spaceflights. It should be noted that some evidence in this chapter is derived from the Flight Crew Integration (FCI) International Space Station (ISS) Life Sciences Crew Comments Database and Shuttle External Crew Reports. Although summaries of ISS and Shuttle crew comments are presented as evidence, the FCI ISS Life Sciences Crew Comments Database is protected and not publicly available, due to the sensitive nature of the raw crew data it contains. Data is also presented from the Crew Office approved Space Shuttle Crew Reports. These reports are not publicly available.
IV. EVIDENCE
The primary focus of integrated human-system design is the integration of human considerations in systems design to reduce costs and optimize system performance, thus leading to improved safety, efficiency, and mission success. This chapter focuses on identifying the causes of risk associated with error due to inadequate HCI, and addressing information presentation standards for reducing operator errors in spaceflight through adequate assessment of the causes. Evidence relevant to the risk of error due to inadequate HCI illustrates that effective information presentation and interaction are critical to mission success.
The purpose of the Space Human Factors discipline is to create and maintain a safe and productive environment for spaceflight crewmembers. One method to achieve this is through adequate provision and presentation of information necessary for task execution. Spaceflight crew performance is heavily influenced by the way in which crews are able to obtain SA and safely and effectively perform tasks. Current and future missions will require crews to perform a wide variety of tasks under dramatically different conditions: 1-g, hypergravity, microgravity, unsuited, suited, and pressurized. Mission success will require a more complete understanding of information essential for successful task performance and how this information is best presented, acquired, and processed. As such, it is necessary that the risk of inadequate HCI be thoroughly assessed such that mitigation strategies can be developed and implemented. This evidence is the basis for analysis of the risk likelihood and consequence, and may provide information needed to eventually develop standards for reducing operator errors in spaceflight through adequate understanding of the causes and mitigations of operator errors due to inadequate HCI.

9
The risk of inadequate HCI includes eight core contributing factors: 1) Requirements, policies, and design processes, 2) Information resources/support, 3) Allocation of attention, 4) Cognitive overload, 5) Environmentally induced perceptual changes, 6) Misperception/misinterpretation of displayed information, 7) Spatial disorientation, and 8) Design of displays and controls. The contributing factors were derived from the Department of Defense (DoD) Human Factors Analysis and Classification System, the industry standard for human error categorization. (DoD, 2005; Shappell & Wiegmann, 2000). All of these contributing factors can prevent successful accomplishment of tasks or task objectives by impacting the user’s ability to properly utilize information to make correct decisions regarding the human-computer interface.
A. Contributing Factor 1: Requirements, Policies, and Design Processes
Requirements, policies and design processes are a factor when the processes through which vehicle, equipment or logistical support are acquired allow inadequacies, or when design deficiencies create an unsafe situation. In the SHFE domain, the key process is the Human-Centered Design (HCD) Lifecycle process. The HCD lifecycle is characterized by three primary phases of activities: Understanding the User and their Domain, Visualizing the Design Solution, and Evaluating the Design (Holden, Malin, and Thronesbery, 1998; ISO TR 18529, 2000). Understanding the User and their Domain involves activities such as task analysis to ensure products are effective and meet user needs; Visualizing the Design Solution involves iterative concept prototyping to mature design alternatives, and Evaluating the Design involves formal usability testing of the designs to ensure usability, efficiency, and acceptance by the users. For information-based products, all phases of the HCD lifecycle focus on ensuring quality IA: the correct information presented intuitively, in the proper format, within a logical organization, easily accessible by the users. When human-centered processes and policies are not in place, the likelihood of inadequate HCI can be significant. The use of some form of the HCD process is standard and widely accepted throughout industry and the DoD. Lifecycle costs for products developed with an HCD process are significantly lower than costs for products developed without such a process. Good process leads to reduced need for expensive redesign and re-certification late in the lifecycle, since major design issues are identified and corrected early rather than late in the lifecycle. There is also a reduced need for training, since a good process helps ensure that learnability and usability are given consideration early.
HCD has been only recently gaining attention and acceptance at NASA. While in the past, development may have been centered around the human (in this case, the crew), the process was often relatively unstructured, relying on crew acceptance comments rather than the more formal HCD methods that involve task-based evaluations and objective data. The result has been a mixture of well-designed and not so well-designed products. Many of the negative
10
consequences of this lack of HCD process have been masked in missions to date because of easy access to the ground for questions and workarounds. This approach will not be feasible for long-duration missions.
At NASA, many HCI-related issues are informally discussed or complained about, but not formally investigated or pursued, perhaps partially due to the crew culture of – “I can figure it out – it’s workable”. Accepting error-prone products deemed workable by highly confident users is taking unnecessary risk. It is difficult to find documented investigations that consider process-related causes. One exception is described below.
A NASA report in 2000 (NASA Office of Inspector General, 2000) clearly identifies lack of proper process as a causal factor for poorly designed ISS portable computer system (PCS) displays. The importance of this finding is evident in the report: “The PCS and the display development process is a recognized area of concern for the ISS program since PCS displays are the primary crew interface or window into ISS systems.” Also, from the report: “There are numerous usability issues that affect the cost and schedule of the display development process and may have a safety impact. These issues affect cost and schedule because additional training and software releases could be required.” Some of the specific concerns cited were: no formal display requirements, weak software engineering practices, lack of prototyping, and lack of human factors engineering. Detailed findings identify display design issues such as missing indicators, erroneous information, inconsistencies, and cumbersome navigation. Although some modifications were made based on this report, poor usability of these displays has resulted in many of the displays being controlled by ground personnel instead of onboard crew.
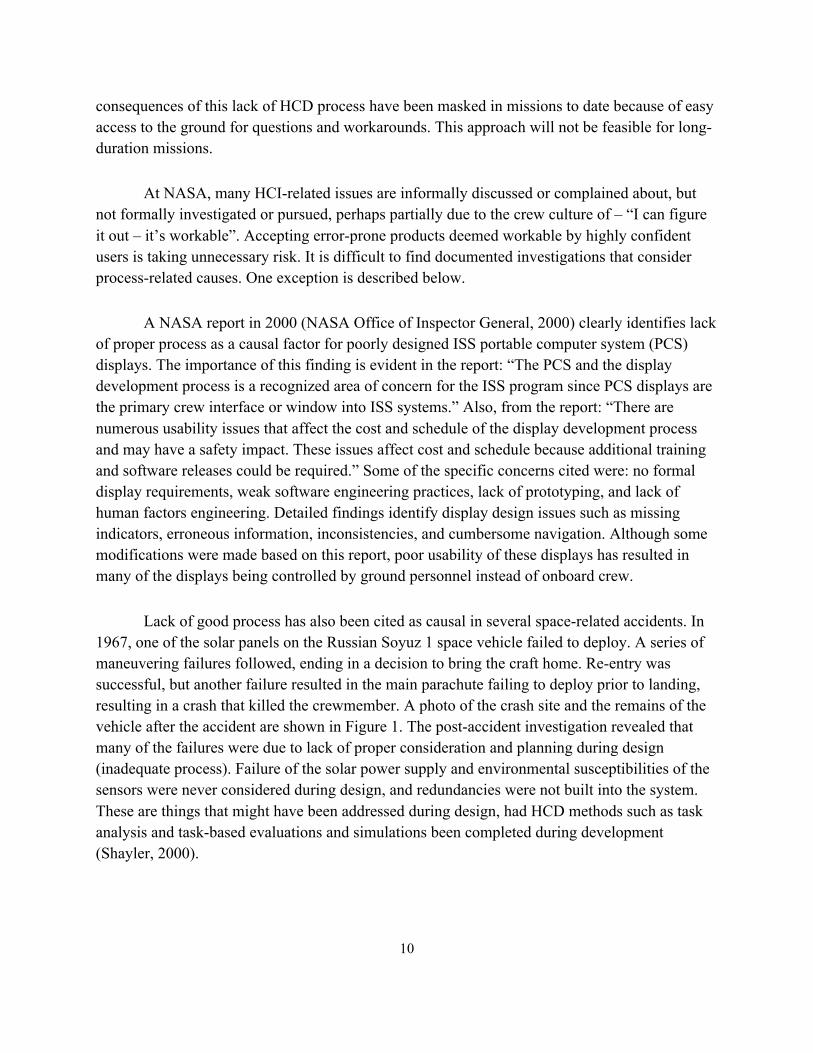
Lack of good process has also been cited as causal in several space-related accidents. In 1967, one of the solar panels on the Russian Soyuz 1 space vehicle failed to deploy. A series of maneuvering failures followed, ending in a decision to bring the craft home. Re-entry was successful, but another failure resulted in the main parachute failing to deploy prior to landing, resulting in a crash that killed the crewmember. A photo of the crash site and the remains of the vehicle after the accident are shown in Figure 1. The post-accident investigation revealed that many of the failures were due to lack of proper consideration and planning during design (inadequate process). Failure of the solar power supply and environmental susceptibilities of the sensors were never considered during design, and redundancies were not built into the system. These are things that might have been addressed during design, had HCD methods such as task analysis and task-based evaluations and simulations been completed during development (Shayler, 2000).

11
Figure 1. Photo of the 1967 Soyuz 1 crash site and the remains of the Soyuz vehicle after the accident (NASA, 2008).
In 1998, the NASA Mars Climate Orbiter was launched to study the Martian climate and atmosphere, and serve as a communications relay for other missions. The orbiter entered the Martian atmosphere earlier than planned, was travelling too fast, and was ultimately destroyed, at a loss of $328 million dollars. The incident was due to a lack of standards across development teams - commands were sent to the Orbiter in English units and the system was expecting metric units. This lack of standardization is indicative of a lack of policy and process (Stephenson, 1999).
Another standards-related accident occurred in 1983. Air Canada Flight 143 ran out of fuel at 41,000 feet, halfway through its flight to Edmonton, Canada. A metric to English units conversion error caused the plane to be loaded with insufficient fuel prior to flight. No one noticed the insufficient fuel condition until it was at a critical level (Reason, 2000).
Lack of human factors considerations during the design stage and violation of regulations has been cited as one of the primary causes of the 1986 Chernobyl nuclear reactor disaster. Before the accident happened, normal reactor operations had been suspended in order to perform an experiment. Operators were poorly trained, standard regulations were not followed, and the system design did not take into consideration the need for safeguards. The explosion was caused when operators made critical errors that the system was not designed to prevent (Meshkati, 1991). Adequate design processes may have prevented what has been called the worst reactor disaster in history. Although still under investigation, the nuclear reactor meltdown that occurred recently at the Fukushima Daiichi nuclear power plant in Japan, after it was hit by a tsunami, may have also had causal factors associated with requirements, policies and design processes (Makhijani, 2011).

12
There are examples documented in the Space Shuttle Crew Reports in which poor requirements, policies, and design processes may have resulted in loss of mission. On one Shuttle flight, a rendezvous was made more challenging because the ground commands for orienting an object for capture by the robotic arm were not performed. Later analysis revealed that communication parameters were not properly configured. This lack of procedural coordination required the flight crew to perform an unplanned attitude flyout to put the object in the correct attitude in relationship to the orbiter.
At the beginning of an Extravehicular Activity (EVA), the video stream was disrupted when ISS mission control requested the use of two of the six available video trunk lines for routing of EVA wireless video to the ground. Reconfiguration of the on-orbit routing after loss of these lines caused minor delays in the EVA timeline. The crew had not expected the new configuration and had not trained with it.
On another Shuttle flight, there was a four-inch delta between the zero reference used in the flight software and the zero reference used in the pre-flight training software. Neither the crew nor the flight control team was aware of this discrepancy. The process for validating and certifying flight software failed to ensure that differences between the flight software and pre-flight training software were fully understood and reflected in procedures.
When development teams find that established requirements, processes, or policies are unworkable because they are not practical or are too expensive for use in the real-world, these requirements, processes and policies are often ignored or waivers are sought. This is most common with development efforts involving a human-computer interface. It is relatively straightforward to determine that a switch has been developed to function adequately; it is much less straightforward to ensure that a complex human-computer interface has been developed to function adequately. Thus, there is still a need for verifiable HCI-related requirements, and HCD processes and policies that are feasible, practical, and cost-efficient.
B. Contributing Factor 2: Informational Resources/Support
Informational resources/support is a factor when task information, operational planning material, or other information necessary for safe operations are not available. This factor is in play when the user does not have the information needed to perform a task because the information cannot be observed, is not provided, is not understandable, or is incorrect. This is also a factor when crew-to-crew or crew-to-ground communication issues arise. Informational resources include displayed information, auditory information, procedures, schematics, and crew communication. These informational resources are considered required resources when the task

13
cannot be completed without them. When a user attempts a task without required information, they are at risk of failing to successfully complete the task.
When information is presented in the wrong format and excessive time and effort is needed to derive the meaning, there is increased risk. For example, if the crewmember needs to know velocity, but only position and time are displayed, the crewmember is required to do mental subtraction to estimate the rate of change; if the temperature is digitally displayed, but the necessary information is the trend of the temperature, the crewmember does not have the information needed. Knowledge about human capabilities and limitations tells us that computers are much better suited for these types of mathematical operations, while humans are better suited for more complex analysis and decision making (Kantowitz & Sorkin, 1987). Allocation of functions should be done accordingly.
Also related is the concept of information granularity. Information granularity refers to the level of detail contained in a data store or the number of data fields required to accomplish a given task. This concept becomes problematic when executing a task requires the integration of information from multiple sources, databases, or channels of information, each of which may have a different level of granularity and provide varying quantities of information. Finely grained data are highly detailed and divided into multiple fields, while coarsely grained data are summarized at a higher level and have fewer data fields. The relationship of this concept to informational resources is integral to mitigation of HCI risks. If a task requires different courses of action to be taken based on small detailed subtleties in contextual data, then providing such details in separate fields to the user may enhance their ability to detect the differences. In this case, if data is provided to the user in a rolled-up and summarized fashion, they may miss necessary details and incorrectly execute the task. On the other hand, constantly inundating users with highly detailed data even when they do not need it can result in problems as well since their mental attention resources can become saturated and cognitive overload and confusion can occur. Thus proper management of information granularity is key, as human cognition and the successful execution of tasks is tightly integrated with information granulation (Zadeh, 1998).
There are numerous examples of incidents from a variety of domains caused by lack of information in the required format or lack of critical status information. In 1969, on Apollo 10, mode confusion caused by poor mode information display and crew communication issues resulted in the capsule spinning out of control. If not corrected, the capsule would have impacted the moon, killing all onboard (Shayler, 2000).
In 1987, 188 people were killed in a ferryboat accident in Zeebrugge, Belgium. When leaving the dock, the bow doors had been accidentally left open, and the ferry filled with water and sank. In addition to poor assumptions about whose responsibility it was to ensure the doors

14
were closed, the captain had no status indicator on his console indicating the status of the doors, and the doors were not visible from his location. This accident was clearly the result of lack of informational resources (Casey, 1993; Pijnenburg & Van Duin, 1991).
In 1985, a Galaxy Airlines aircraft crashed when ground crew failed to secure an air-start equipment door on the airliner wing prior to takeoff. During flight, the door came loose, but pilots were unaware of the problem because there was no indicator in the cockpit. The plane became unstable and ultimately crashed, killing 70 passengers (Chiles, 2002; National Transportation Safety Board [NTSB], 1986).
In 1994, Aeroflot Flight 593 stalled and crashed, killing 75 people. The autopilot had been accidentally disengaged by the pilot’s 15-year-old son sitting in the cockpit. Indicators and/or safeguards were not in place to prevent the accident (Accident Description - Aeroflot Russian International Airlines, Airbus A310-304, 2004).
In 1983, Korean Air Lines Flight 007 deviated more than 200 miles from its intended flight route into Soviet territory and was shot down with no survivors (Degani, 2001). The deviation from its flight route was primarily related to pilots’ use of automated systems, in which the autopilot provided inadequate information about its mode transition logic and did not provide adequate information to flight crew about its active and armed modes. The autopilot displays were incomplete in that they did not accurately represent the currently engaged mode. In this case, poor IA, information presentation, functional logic, and the pilot’s inadequate understanding and model of the system interacted to create a disastrous condition.
Critical information often involves more than just visual displays. In 1999, during London’s morning rush hour, a commuter train collided with a high-speed train, killing 31 people. An investigation revealed two HCI-related issues: 1) minor warnings and critical events both had the same type of auditory alarm, and 2) when the pilot acknowledged the alarms, the system cancelled them altogether, eliminating a layer of protection) (Cullen, 2001; Lawton & Ward, 2005). In this case, there was lack of information regarding severity of the event (since alarms used the same tone), and there was lack of information regarding a continuing threat, since the system allowed the user to essentially disable the warning system by acknowledging the warning.
In one of the worst industrial accidents on record, the 1984 Union Carbide India Limited pesticide plant in Bhopal, India experienced a toxic gas release that killed an estimated 3800 people at the time of the incident, and thousands more since then from gas-related diseases. Investigations have shown that a highly critical pressure gauge that should have warned operators of an impending problem was missing from the control room (Casey, 1993). This

15
gauge was located somewhere else on the plant site and was required to be monitored manually. In addition, another critical panel had been removed from the control room, perhaps for maintenance. Many of the gauges that were in the control room were reported to be consistently broken, malfunctioning, off-scale, and unreliable. Training was poor and signs and procedures were written in English, when many of the operators only spoke Hindi. This is a clear example of lack of informational resources such as proper displays, procedures, and communication leading to a catastrophe.
Communication was also an issue in 1995 in the crash of American Airlines Flight 965 to Cali, Colombia. The crew had a number of difficulties including loss of waypoints from the navigation computer, and inconsistent/unfamiliar labeling on charts. The air traffic controller noted that some of the pilots’ requests did not make sense, but they did not know enough non-aviation English to convey this. Navigation and communication issues resulted in the aircraft hitting a mountain, killing 159 passengers and crew (Ladkin, 1996).
Avianca Flight 52 was delayed en route numerous times by weather and was dangerously low on fuel as it approached New York in January, 1990. Air traffic controllers were unaware of the low-fuel situation and the plane crashed in Long Island. Seventy-three passengers and crew were killed. Miscommunication with air traffic control was a primary contributing factor to the crash (NTSB, 1991).
Inadequate procedural information can result in crews not having the information they need to perform a task. Captain “Sully” Sullenberger, the U.S. Airways pilot that guided 155 passengers and crew to an emergency water landing in the Hudson River in 2009 highlighted the need for emergency procedures with just the right level of information in his keynote address at the 2010 Human Factors and Ergonomics Society meeting in San Francisco, CA. Captain Sullenberger said that in the critical moment, he wished he had procedures that could collapse to contain just the key four or five steps required for emergency landing (Sullenberger, 2010).
The ISS is one of the most complex human/machine systems ever created and informational/resource support challenges are a continuous concern. Several communication issues, documented in the FCI ISS Life Sciences Crew Comments Database, have been reported during ISS expeditions including miscommunications, unrealistic demands, ineffective interpersonal communication techniques, and a lack of understanding of on-orbit life. Deficient communication between the ground and crew can cause frustration and negatively affect performance. This can be due to ground operators having difficulty identifying information related to task duration, which in turn frustrates the crew and ground personnel because the perception of task duration is different between those developing timelines and those executing the task. Many times crewmembers have not been able to identify information regarding what

16
the ground could assist with and what tasks could be automated to facilitate crew productivity (Rando, Baggerman, & Duvall, 2005).
ISS crews have consistently commented that procedures are too complex, lengthy, and difficult to follow: too much information is provided, there is a lack of diagrams and schematics to illustrate necessary information, and multiple links in the procedures results in confusion and missed steps. These issues have caused crewmembers frustration and have directly affected task performance, since the information needed for a given task has not always been presented in a usable format. Progress is currently being made on improving procedures and enhancing crewmembers’ abilities to acquire information by including more graphic content. The goal is to improve the procedures so that they better reflect how operations are actually conducted (Rando, et al., 2005).
As documented in Space Shuttle Crew Reports, many commercial applications are installed on the Payload and General Support Computers (PGSC) such as Microsoft Word and Outlook. Crewmembers are familiar with these applications from using them for administrative office tasks. However, some PGSC applications are less commonly used or are proprietary and relatively inaccessible to crews other than during simulations and on training laptops. This increases preflight training requirements or impacts on-orbit operations. For example, on one mission, crewmembers had difficulty on orbit using a graphics viewer/editor. Additionally, the operating system would unexpectedly reconfigure PGSC settings. This caused significant problems with some software applications. Shuttle crewmembers have reported that they are not provided with sufficient training to diagnose or correct this problem. Thus poor informational resources and support for learning to use and troubleshoot problems with PGSC software, has led to crew frustration.
While industry standards exist regarding information content and presentation, there are obviously still challenges with implementing them, as evidenced by the incidents described above. A complicating factor for NASA is that most of these standards have not been written with the operating environment of a space mission in mind, particularly one that involves a long-duration journey with greatly increased autonomy from the ground. That is an operational scenario that has not been experienced to date. For these exploration missions, we do not know how to replicate the resources of a mission control onboard a space vehicle so that crew can operate autonomously. How much information of what type and what format will be required? How should automation be used to mitigate the need for information or to adapt the information to the need at hand? These are questions that remain to be explored.

17
C. Contributing Factor 3: Allocation of Attention
Allocation of attention is a factor when there is a lack of a state of alertness or readiness to process immediately available information due to a sense of security, boredom, or a perceived absence of threat from the environment. Inappropriate allocation of attention may occur when an individual focuses attention on a limited number of cues, such that additional cues of equal or higher importance are ignored or not used appropriately. This channelization of attention, called cognitive tunneling or attentional tunneling, can lead to an unsafe situation in which the individual is unable to develop comprehensive awareness of the situation and thus respond appropriately to critical events. Research on heads-up displays, three-dimensional displays, and fault management, for example, demonstrated that users may focus attention on some aspects of the task (e.g., visually compelling display elements) to the detriment or complete obliviousness to other aspects or events (Wickens, 2005). In other situations, the nature of the task or reliance on automation may result in a failure by the individual to redirect their attention, recognize an automation failure, or seek out additional information that could improve decision making (Sarter, Woods, & Billings, 1997).
There are several examples of poor design leading users to inappropriately allocate their attention to resolving issues. In 1995, pilots aboard American Airlines Flight 965 mistakenly cleared their approach waypoint from their navigation computer. The pilots attempted to reenter the waypoints, but due to an inconsistency in the landing site designation, entered the wrong site designation. The autopilot turned the aircraft, but at that point the aircraft was in a valley parallel to the desired one and on a collision path with a mountain. The pilots were unable to clear the mountain when the ground proximity warning system (GPWS) annunciated, approximately twelve seconds before the plane collided with the tree-line, killing 159 people aboard. In a report by Aeronáutica Civil (Ladkin, 1996), one of the probable causes cited included “poor attention of the crew to vertical navigation, proximity to terrain, and location of critical radio aids”. Flight crew did not try to terminate the descent, although the airplane deviated from the published approach course. Nor did they retract the speedbrakes while performing an escape maneuver following the GPWS annunciation. The investigation committee concluded that had the speedbrakes been retracted, it is likely that the plane would have cleared the mountain. Poor allocation of attention by the flight crew was partially due to the crew trying to make up time due to delays before departure. In their hurried state, they performed an inadequate review of critical information and their attention was diverted from flight instrumentation. In the critical time after the GPWS annunciated an approaching collision, the pilots may have been unable to redirect their attention to the situation and may have experienced cognitive tunneling that prevented them from realizing that the speedbrakes were still engaged.
18
In 1986, the passenger plane Aeroméxico Flight 498 collided mid-air with a privately held jet over Cerritos, California, killing all passengers and crew on both aircraft and an additional 15 people on the ground. The plane had flown into a controlled area without clearance. The air traffic controller at that time had his attention focused on another plane that had also entered the controlled area without clearance. There was no warning system for the air traffic controllers about impending mid-air collisions. The NTSB (1987), in their investigation of the incident, concluded that the pilots of the two aircraft could have visually made contact through their out-the-window views, but did not. Thus, not only had the air traffic controllers’ attention been diverted away from the position of the private jet, but the pilots’ attention may been diverted from their out-the-window views, which would have allowed them to see each other’s planes and possibly avoid the collision.
In other incidents, inappropriate allocation of attention to faulty flight instruments or indicators has resulted in inadvertent activation or disengagement of critical systems. For example, the flight crew aboard Eastern Air Lines 401 became distracted while trying to fix a landing gear indicator light that did not illuminate, which led them to accidently switch autopilot modes. Without the pilot’s attention to altitude indicators, the plane descended and crashed into the Florida Everglades (NTSB, 1973). In a similar situation, the flight crew aboard Adam Air Flight 574 inadvertently disengaged the autopilot while trying to fix a problem with the inertia reference system. The pilot became preoccupied with troubleshooting the system and did not attend to information about the plane’s increasing speed. By the time the situation became apparent, the pilot could not recover the aircraft in time and the plane experienced structural failure (National Transportation Safety Committee [NTSC], 2008). In both the Eastern Air Lines 401 and Adam Air Flight 574 cases, the pilot and copilots’ attentional resources were focused on salient, but faulty, indicators that distracted their attention from flight instrumentation they would otherwise nominally monitor. The changes in altitude and speed when autopilot was disengaged or put into an alternate mode were not noticeable enough to warrant the pilots to redirect their attention to these flight instruments.
Failure to properly attend to automation has also been cited as probable causes for other incidents. In 2009, Turkish Airlines Flight 1951 crashed into a field near Amsterdam during landing. As the plane was approaching the runway, a faulty radio altimeter triggered the autothrottle to decrease engine thrust. The flight crew did not notice the reduced airspeed until it was too late. They were not monitoring airspeed or altitude, and instead were relying on autopilot to land the plane. An investigation by the Dutch Safety Board [DSB] (2010) found that the pilots did not disengage the autothrottle and take over manual thrust to increase it. The crew was not aware of and failed to respond to decreased airspeed and “impending onset of the stick shaker” although there were several indications. Cues that they could have used included a box around airspeed that turned amber and flashed for 10 seconds on the displays, aural and haptic

19
feedback, and a red-dashed “barber pole” stall warning indication, among other indications. If the pilots had noticed these cues, it would have provided them sufficient time to recover and perform corrective action. The pilots, however, may have been distracted by having to perform a landing checklist below 1000 feet, when crew attention should have been on the flight instruments. Furthermore, the pilot did not communicate to the co-pilot that his altimeter was malfunctioning. Thus, the pilots failed to allocate attention to numerous pieces of information that would have indicated to them an approaching stall, and failed to direct each other’s attention to faulty instrumentation.
Cognitive tunneling in spaceflight is a real possibility during a difficult fault management problem (McCann & McCandless, 2003). In a Shuttle ascent for example, which lasts approximately 8.5 minutes, the crew perform checks of various time-critical parameters and flight instruments; they must act quickly to assess and react to a fault (Huemer, Hayashi, Renema, Elkins, McCandless, & McCann, 2005). In human-in-the-loop evaluations of displays for a future crewed space vehicle, participant errors due to inappropriate allocation of attention between electronic procedures and system displays have been observed (Ezer, 2011). The decision support system provided by the electronic procedure engine, which cues up displays and commands for crewmembers, may lead to over-reliance on procedures. Design concepts are being considered that will encourage crewmembers to allocate their attention equally between procedures and associated system displays.
There are examples documented in the Space Shuttle Crew Reports that describe how the design and placement of computer systems can affect appropriate allocation of attention. In one instance, crewmembers using the Dynamic Ubiquitous On-Board Graphics (DOUG) Program for dual-arm operations had a near-miss between the Space Station Remote Manipulator System (SSRMS) and an ultra-high frequency antenna. Although the Shuttle Remote Manipulator System (SRMS) joint angles were fed real-time into the program, the SSRMS positions had to be input manually, a task which required attentional resources. If real-time SSRMS joint angle information had been supplied to the program, then the near-miss between the SSRMS and antenna might have been avoided. Additionally, crewmembers suggested that a warning on DOUG when a robotic arm gets close to structures would have helped them focus their attention on tasks to prevent a collision.
One of the biggest challenges is anticipating what problems may occur due to improper allocation of attention on long-duration missions. Our current experience with ISS has been that crewmember time is generally overbooked, given that so much crew time is required to maintain the ISS and keep equipment functioning. The simpler volume of a long-duration spacecraft will create a very different operational tempo. There will be dynamic phases of flight that require focused attention, and then long periods of time during the transit where the needs for crew

20
attention will be greatly decreased. We must be sure that attention can be focused when necessary, such as during a caution and warning event.
D. Contributing Factor 4: Cognitive Overload
Cognitive overload is a factor when the quantity of information an individual must process in the time available exceeds their cognitive or mental resources. Individuals have limited cognitive resources for sensing, perceiving, interpreting, and acting upon information in the world. The amount of information that an individual is able to acquire and process may be affected by stress, fatigue, time constraints, and the modality of that information (visual, auditory, etc.). Confusion can occur when the individual is unable to maintain a cohesive and orderly awareness of events and required actions and experiences, a state characterized by bewilderment, lack of clear thinking, or disorientation. Lack of transparency or predictability of a given task can lead to situations where users do not have a true understanding of the state of the system, which can also contribute to task overhead and confusion (Dix et al., 2004). During periods of confusion, an individual’s performance on one or multiple tasks may be considerably reduced (Wickens, 1991).
Cognitive overload and confusion have been cited as causal reasons for several aviation accidents. In the American Airlines Flight 965 incident, as described previously, high pilot workload due to a failure in automation demanded excessive crew resources during a critical phase of flight (Ladkin, 1996). In 1976, a mid-air collision occurred between British Airways Flight 476 and Inex-Adria Aviopromet Flight 550. All passengers and crew on both planes were killed. The air traffic controller responsible for directing the planes was overloaded with information in a congested airspace. The controller was working alone without an assistant controller. Upon realizing the collision course (which would have actually been a near-miss), the air traffic controller started talking in his native Croatian language, likely due to extreme stress, and did not realize the British Airways pilot could not understand. The controller accidently directed the planes into a collision course (Air Accidents Investigation Branch [AAIB], 1977).
Embrey, Blackett, Marsden, and Peachey (2006) describe a number of maritime incidents that have also resulted from cognitive overload. In 2004, the ferryboat Catherine Legardeur ran aground due to a combination of factors resulting in cognitive overload. The master of the vessel was used to navigating using visual references, and when fog reduced his visibility, he had to struggle with the use of navigation instruments with which he was not familiar. This high cognitive workload resulted in his loss of control of the ferry. In 2005, the skipper of the Hannah Lee was busy making continuous adjustments to an autopilot system that was not integrated with the electronic chart system. Spray on the wheelhouse windows partially obscured the skipper’s visibility. The limited visibility and the high cognitive load of the continuous adjustment task

21
resulted in the skipper being unable to maintain a proper visual lookout; ultimately the Hannah Lee collided with another vessel, the Spartia.
A NASA example of cognitive overload comes from the collision in June 1997 between the Russian spacecraft Progress 234 and the Mir Space Station, which caused the pressure hull to rupture and nearly led to the Mir being abandoned. High workload and stress of the crew due to repeated system failures likely contributed to reduced vigilance (Ellis, 2000). Another example of system design that may result in cognitive overload comes from the Space Shuttle Crew Reports. According to crewmembers, ISS PGSC system components are obsolete and the network design is overly complex. There are three PGSC hardware configurations, three operating systems, and three data network types distributed across 11 laptops. The crew time for training and in-flight setup and maintenance are considered excessive (i.e., in-flight troubleshooting has been approximately 10 hours; setup/reconfiguration time could have saved six hours with a simpler PGSC system).
Cognitive underload can also have an impact on performance and safety. Embrey et al. (2006) describe several maritime examples. In 1999, the Baltic Champ vessel was anchored and the master was not engaged in any activity. He was rested and on watch alone in the wheelhouse. He appropriately walked around and checked radars to try and keep alert; however, because of the low activity level, he did not notice that the vessel was drifting. The Baltic Champ ran aground before the master could take action to prevent it. In another maritime example from 2002, the master of the Stellanova, acting as the officer of the watch, was doing administrative tasks while traveling through a narrow channel. When the Stellanova suddenly sheered to port, the master was unprepared for the higher cognitive load task of collision avoidance. He was unsuccessful in assessing the situation in time to avoid the disaster and the Stellanova collided with the Canadian Prospector in the narrow channel.
Cognitive underload may be a concern for crewmembers on a long-duration space transit. When crews do not have a steady flow of maintenance or other tasks to be performed, such as on the ISS, they may become bored, which can result in stress, fatigue, and reduced alertness. Hence their readiness to perform or respond to an emergency situation may be compromised.
We need to understand what constitutes an “adequate” cognitive load for crewmembers on a space mission and ensure that future spacecraft systems are designed accordingly. This will be particularly important since exploration missions will be largely autonomous, and crew access to ground assistance will be greatly decreased. Crews may have to perform complex duties after a long uneventful transit, where stress, fatigue, potential deconditioning, and time constraints will be factors.

22
E. Contributing Factor 5: Environmentally Induced Perceptual Changes
Environmentally induced perceptual changes are a factor when stimuli in the environment cause an erroneous perception of orientation, motion, or acceleration. When crewmembers experience altered perceptions of orientation, motion, or acceleration, this can affect their ability to interact with systems, namely read displays and manipulate controls. Much of the information we have about this factor is anecdotal; there is little formally documented evidence.
The Space Shuttle Crew Reports have documented that during proximity operation, pilots have reported that ISS has appeared closer and the closing rate faster than was indicated by state vectors. Crewmembers commented on the large size and the high apparent closure rate with the ISS. The effect may due to environmentally induced perceptual changes.
Space Shuttle crewmembers have provided a mix of comments regarding the ability to see Shuttle displays during launch vibration, with some crewmembers claiming to have no difficulties, and others saying there were points in time during which the displays were unreadable. Vibration became a high priority when Orion spacecraft development began. There were concerns that the Ares rocket would result in vibration levels much greater than that experienced on shuttle; the astronaut office was vehement that levels should be no greater than Shuttle vibration levels. Only recently were Shuttle vibration levels systematically measured (NASA, 2009). Some aircraft have documented issues with vibration during evasive maneuvers or system failures. During a British Midland Airways flight in 1991, the aircraft suffered a significant degradation of performance and propeller icing, accompanied by severe vibration that rendered the electronic flight instruments partially unreadable. The aircraft stalled, but control was regained and the flight ended safely (AAIB, 1992).
There has been very limited research on the effects of vibration and acceleration on human performance; studies typically require highly specialized, expensive test facilities. Due to the interest in vibration during Orion development, a number of studies were completed by NASA.
From June 2008 through August 2010, Ames Research Center (ARC) and Johnson Space Center researchers investigated whole-body vibration impacts on human cognitive and manual performance (Adelstein, et al., 2009a, b, c; 2010; McCann, 2009; Sándor, et al., 2010). All studies involved unsuited, semi-supine observers, representative of the body posture of stack-architecture launch, receiving single-axis vibration in the chest-to-spine direction, the expected dominant component of Ares-Orion thrust oscillation inputs. Most of these studies focused on

23
the ability to read text on a display under vibration, while one focused on the use of cursor control devices (CCDs) under vibration.
Objective measures indicate that text readability is not significantly impaired at vibration levels up to 0.3-g (0-peak) for 10- and 14-point Lucida Console font for viewing distances of 18-20 inches. Corresponding subjective measures indicate that display usability and workload are not significantly impacted at this vibration level. Vibration at higher levels may significantly impact visual performance; more research remains to be done.
Observations from centrifuge and fixed-base vibration chairs indicate that observers’ visual performance is degraded more by vibration superimposed on a 3.8-g chest-to-spine bias than a 1-g bias. Increasing font size from 10 to 14 points or larger may further improve text readability or permit acceptance of higher seat vibration levels. Incorporating appropriately designed, vibration-resistant graphic formats, as opposed to small-font dense text displays, may also improve readability. Additionally, countermeasures such as appropriately designed display strobing may allow greater vibration tolerance for both text and graphics formats.
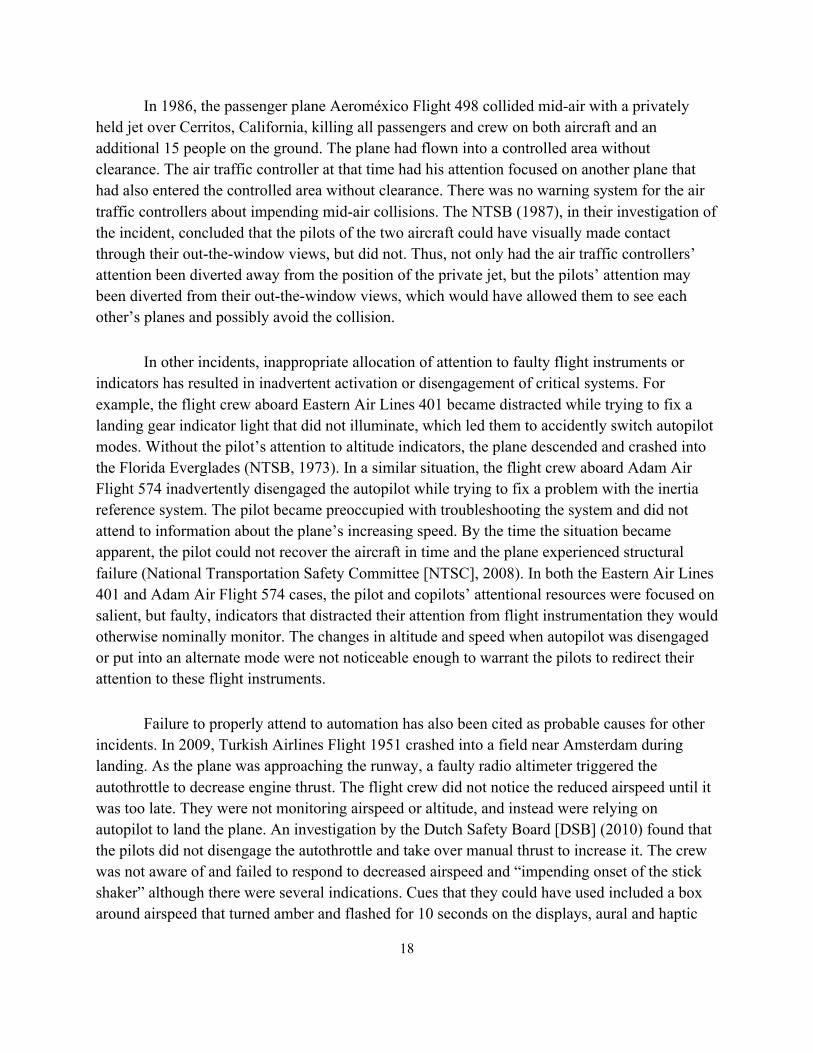
A study was performed in the ARC Vibration Facility to determine characteristics of cursor control devices that perform well or are problematic under different levels of vibration (Sándor, et al., 2010). The vibration platform provided one axis of vibration (X-axis/chest to spine) at various amplitudes and frequencies. Displays for the CCD tasks were shown on a monitor mounted in a fixed position at viewing distance above the participant’s head; the monitor did not vibrate. CCDs were mounted on the chair for left-handed use as planned for Orion (Figure 2).
Figure 2. Cursor control device being tested in vibration chair.

24
A trackball was tested in continuous and 4-way discrete mode, a castle switch in 2- and 4-way discrete mode, and a rocker switch in 2-way discrete mode. For all devices, the vibration conditions with higher amplitudes (3Hz 0.17g, 6Hz 0.35g and 12Hz 0.70g) affected device performance. Lower amplitude vibrations did not cause a significant decrement in device performance. Response times for the 2-way devices were negatively impacted by vibration, while 4-way and continuous modes were not. Further research is warranted to confirm/clarify these results.
A Short Duration Bioastronautics Investigation (SDBI) 1904 investigation was carried out during launch onboard Shuttle flights STS-119 and STS-128 in conjunction with Detailed Technical Objective (DTO) 695. The goal of DTO 695 was to quantify hitherto unmeasured tri-axial vibration for Shuttle seats during launch (Adelstein, 2010, in preparation). SDBI 1904 investigated the vibration effects on visual performance during launch by having the mid-deck crew examine a spacecraft system display printed on a placard. The crew examined four font sizes to evaluate readability at five phases of vibration (Thompson et al., 2010).
Results from the shuttle evaluations, not surprisingly, show that as vibration increased, larger font sizes were required for acceptable visual performance. Seat headrest vibration in x- and y-axis appears to be the main contributor, with seat vibration in the z-axis having less of an impact on visual performance (Thompson et al., 2010). As propulsion technologies change with the advent of new space vehicles, we may need to investigate the effects of new vibration profiles on crew ability to read and operate human-computer interfaces.
Another unexplored area of potential concern is the impact of gravitational force transitions that will occur during a planetary landing. It is not known if or how these transitions may affect crew ability to read displays, judge distances, or provide accurate inputs in a software-based cockpit.
F. Contributing Factor 6: Misperception/Misinterpretation of Displayed Information
Misperception or misinterpretation of displayed information is a factor when an individual misreads or fails to recognize the significance of visual, auditory or tactile information within the performance envelope or other operational conditions. According to Salvendy (2006), misperception or misinterpretation of information can be a result of the way the information is presented, the context of the situation, or the way an individual’s expectations are used for recognition of the information. Although an individual may register (i.e., sense) information, they may fail to encode or cognitively process the information for appropriate decision making. During decision making, humans often make decisions that are “good enough” for the situation. They may only seek or interpret information they perceived to be the most relevant or that

25
supports their already established beliefs or decisions. This is often referred to as “confirmation bias”.
Misperception or misinterpretation of information can also impact an individual’s SA, which can be defined as a person’s “perception of the elements in the environment within a volume of time and space, the comprehension of their meaning, and the projection of their status in the near future” (Endsley, 1988). As stated by Jones and Endsley (1996), SA-related human errors are recognized as a significant factor in many aviation incidents. Indeed, in a review of aviation incidents between January 1986 through May 1992, over 143 documented aviation incidents were found to be related to SA errors, often with multiple errors occurring per incident (262 total SA errors were found in 143 incidents). SA errors can be classified as level 1 SA errors (failure to perceive or misperception), level 2 errors (improper integration or comprehension of information, i.e. misinterpretation), and level 3 errors (incorrect projection of future actions). Of the 262 SA errors evaluated, 8.7% were explicitly associated with level 1 errors of misperception while 21.1% of pilot SA errors and 17.2% of air traffic controller SA errors were level 2 errors associated with misinterpretation of information (Jones and Endsley, 1996).
Aviation accidents provide numerous examples of pilots misperceiving or misinterpreting displayed information. In 1996, AeroPeru Flight 603 crashed into the Pacific Ocean near Lima, Peru after the flight crew misinterpreted that the aircraft was at a safe altitude, despite conflicting instrument readings. After cleaning the aircraft, maintenance workers had accidently left masking tape over some of the static points, leading to false altitude and speed readings. The crew misinterpreted a ground-proximity warning as a false alarm, although the warning was correct. Contributing to the accident were inconsistencies in airspeed indicators. The first officer’s instrumentation indicated slowed airspeed to the point of a stall warning stick shaker activation, while the captain’s airspeed indicated overspeed and a warning was sounded (Ladkin, 1997).
Also in 1996, Birgenair Flight 301 crashed soon after take-off in the Dominican Republic, killing all onboard. During the takeoff, the captain’s air speed indicator was malfunctioning but the captain decided to continue with the flight. The co-pilot’s indicator was showing accurate readings. Shortly thereafter, the captain’s air speed indicator showed the plane was going too fast. This resulted in the autopilot reducing power and pitching up the plane’s attitude to try to reduce speed. The captain misinterpreted the speed of the plane, and assumed it was going too fast, although the copilot’s airspeed indicator showed that the plane’s speed was decreasing. The flight crew failed to interpret the activation of the stall warning stick shaker as indication of an imminent stall. The left engine stalled and the plane inverted and crashed into the Atlantic Ocean (Flight Safety Foundation – Accident Prevention, 1999). The voice flight
26
recorder revealed that the co-pilot had made “subtle suggestions” to the pilot that the plane was slowing down in a nose-up attitude (Walters & Sumwalt, 2000). The captain, however, misperceived and misinterpreted the instrumentation and warnings on his side of the vehicle as correct and may have not been compelled by the suggestions of the copilot that these indications were wrong.
In other incidents, misinterpretations by flight crew were attributed to inconsistencies in representation of information by two different information sources. In 2005, Airbus A321-231 attempted an approach in Sudan during a dust storm. For this type of approach, autopilot needed to use an approach path defined within a navigation database. The captain’s approach charts, however, came from a different supplier than the navigation database. The charts incorrectly indicated the final descent point five nautical miles from the runway, whereas the flight management and guidance system’s navigational database had been updated with correct information. While the plane was in autopilot, the captain misinterpreted the final descent as beginning too late, leading him to interpret the aircraft as being too high for the approach. The captain changed the autopilot mode to increase the rate of descent. Neither the captain nor the copilot established a visual reference for landing, with each thinking the other was watching the runway approach lights. When they realized the confusion, they aborted the landing and attempted another approach. After another failed approach, the plane was diverted to another airport without incident. One of the critical causal factors cited for this incident was that the flight crew did not perceive the discrepancy between parameters on the approach charts and those in the navigation database (Civil Aviation Authority [CAA], 2007).
The Airbus A321-231 incident was not the only event in which discrepancies between two sources of information led the flight crew to misperceive or misinterpret information. In the American Airlines flight 965 crash described earlier, the stored waypoints on the onboard computer did not identify the next approach waypoint “Rozo” as “R”, as it was represented on the flight crew’s charts, but instead as a beacon called “Romeo,” 130 km away. When the captain selected “R” from the navigation database, autopilot started flying a course to Bogotá, causing the plane to be on a collision course with a mountain (Ladkin, 1996).
In 2001, Air Transat Flight 236 was flying over the Atlantic Ocean when the flight crew noticed an imbalance in the fuel levels in the left and right wings of the plane. They did not know that a pipe on the right engine had fractured and was leaking fuel at a fast rate. The flight crew saw off-nominal oil temperature and pressure readings for the right engine, but did not interpret these as related to a fuel leak. At some time later, a fuel imbalance warning was shown to the crew. Thinking they could perform a fuel balancing procedure from memory, they opened the cross-feed valve, transferring fuel from the operational left wing to the leaking right wing. They had not suspected a fuel leak but had instead assumed that a fuel monitoring system was

27
malfunctioning. Without fuel, the right engine flamed out and the plane lost its main hydraulic power system that operated flaps, brakes, and other critical systems. Fortunately, the pilots were able to glide the plane to a landing with no fatalities and only minor injuries to passengers (Ladkin, 2004).
In 2005, the flight crew of Helios Airways flight 522, en route from Cyprus to Athens, had failed to set the cabin pressurization setting to “Auto” prior to takeoff. Shortly after takeoff, a warning for pressurization annunciated; however, this was misinterpreted by the flight crew as a configuration warning that was intended to alert crew to configuration problems before takeoff. At approximately 14,000 ft, the oxygen masks in the cabin deployed and a panel light in the cockpit illuminated to indicate this deployment. This was followed a few minutes later by a master caution light. The flight crew continued to misinterpret the situation and believed that the caution light had illuminated because of overheating and failure of the electronic cooling system. The loss of cabin pressure and resulting hypoxia eventually rendered the flight crew unconscious. The plane ran out of fuel and crashed, killing all onboard (Air Accident Investigation and Aviation Safety Board [AAIASB], 2006).
An incident with an X-15 jet in 1967 provides a NASA example of misperception and misinterpretation of displayed information. The attitude indicator in the cockpit showed that a roll to the right was needed, but pilot Major Adams may have misinterpreted the needles as a slideslip rather than as a roll angle. The attitude indicator, critical to maintaining controlled flight, departed from conventional design because it could display either sideslip or roll angle. Major Adams yawed to the right, which further increased heading deviation. He lost control of the plane, which spun out of control and broke apart. The accident investigation board concluded that the two modes of presenting information on the attitude indicator may have contributed to the accident and suggested that deviations from conventional attitude indicators should be avoided (Dydek, Annaswamy, & Lavretsky, 2010; Jenkins, 2000).
In the Space Shuttle Crew Reports, crewmembers on one mission reported that during grappling of the robotic arm, several messages were annunciated because the software did not see a full rigidization due to a low load cell reading. The latching end effecter was manually rigidized and the remainder of the installation proceeded without any error messages. During the unberthing, some lateral motion was seen. The first attempt to correct this lateral error was incorrectly applied because the camera views were different from what the crew was expecting. Crewmembers misinterpreted the camera view due to their expectations. Once the camera situation was resolved, the remainder of unberthing went smoothly with very little unwanted payload motion.

28
The challenge for long-duration missions is that we really don’t know how big a role ground control plays in avoiding and correcting misperceptions and misinterpretations. Mission controllers on the ground currently serve as an extra pair of eyes, constantly monitoring, checking, and verifying crewmember actions. More research needs to be done with autonomous crews before we can know what design safeguards need to be in place to avoid serious errors due to misperception and misinterpretation.
G. Contributing Factor 7: Spatial Disorientation
Spatial disorientation is a factor when a person’s cognitive awareness of time, attitude, position, velocity, direction of motion, or acceleration varies from reality, resulting in improper or inadequate control inputs. Spatial orientation is different from geographical disorientation (i.e., getting lost). It is also distinct from physiological sensations such as dizziness, light-headedness, or nausea. Although these symptoms may accompany spatial disorientation, fatal aviation accidents have occurred in which pilots have likely not been aware that their actual and perceived orientations differed.
Previc and Ercoline (2004) described three types of spatial disorientation:
1. Pilots are not actively aware that there is a difference between their orientation in the world and their orientation as presented on an instrument panel. For example, a pilot may not realize their instrumentation is malfunctioning and may think that the plane is responding well to control inputs.
2. Pilots perceive some spatial disorientation due to conflict between what he or she feels the aircraft is doing and what flight instruments are showing. Conflict may also be present between orientation and out-the-window views. There is a risk that a pilot may rely on compromised sensations and perception of orientation, rather than flight instruments.
3. Pilots are psychologically incapacitated, rendering them incapable of interpreting instrumentation or providing control inputs. Pilots may have high stress, a distorted perception of time, or a feeling that they are physically separated from the aircraft.
Spatial disorientation may occur due to absent, inaccurate, or misleading visual or vestibular cues. In spaceflight, gravity-based cues used on Earth cannot be used, and orientation cues can be ambiguous. This may result in changes in perception of orientation relative to the cabin and environment, including inversion illusions or perceptions of tilt at a constant rotation velocity. Experiments in zero gravity have demonstrated that individuals may experience perception errors associated with their motion and position relative to the space vehicle

29
(Glasauer & Mittelstaedt, 1998). Crewmembers in both US and Russian space programs have reported feeling continuously inverted (Clement, Moore, Raphan, & Cohen, 2001). Crewmembers aboard Skylab experienced space motion sickness, likely due to spatial disorientation due to weightlessness (Homick, 1979).
Spatial disorientation has been implicated as a possible causal factor in numerous aviation accidents (Braithwaite, Durnford, Crowley, Rosado, & Albano, 1998; Cheung, Money, Wright, & Bateman, 1995). In 2004, Flash Airlines Flight 604 crashed into the Red Sea shortly after takeoff. A possible cause was the captain having spatial disorientation, as there was no evidence of malfunctions or failures, and the airplane responded appropriately to flight crew inputs. There was evidence to suggest that the captain lost spatial orientation on takeoff and guided the plane into an overbanked, nose-down attitude. The darkness of the night, misleading vestibular cues, flight crew distraction, and inappropriate control inputs were all potential factors leading to loss of spatial orientation. There was nothing within the out-the-window views that the flight crew could have used as a visual reference. Because the plane’s bank angle was below a level of perception, it was unlikely that the flight crew’s vestibular system would have provided them with an indication of a right bank. When the plane went into a right overbank, vestibular sensations may have underrepresented actual bank angles and the flight crew may have even interpreted these sensations as a left bank angle. Control inputs suggest the captain experienced a delay in interpreting his spatial relationship to the Earth (Egyptian Ministry of Civil Aviation, 2006).
In response to the X-15 incident described earlier, NASA and the United States Air Force convened an accident board that concluded that after an electrical disturbance deactivated the automatic reaction control system, Major Adams inadvertently initiated, then increased right drift off his required aircraft heading. This inadvertent initiation may have been a result of distraction, misinterpretation of the attitude indicator, and possible vertigo. The plane went into an incorrect angle of attack, leading to a spin and then post-spin limit-cycle oscillation that resulted in severe pitch and yaw forces for approximately fifteen seconds until the airframe broke apart. Likely due to high g-forces, Major Adams was unable to gain control of his aircraft or to eject. The investigation report concluded that Major Adams likely suffered from vertigo because of his seeming lack of awareness of his heading deviation. It was known in advance, based on an earlier vertigo test in 1963, that Major Adams was unusually susceptible to vertigo. Despite this, he was considered to be physically qualified for test pilot duties (Dydek et al., 2010; Jenkins, 2000).
The Space Shuttle Crew Reports provide an example of crewmembers having spatial disorientation. In one mission, both SSRMS operators experienced some unintended inputs to the hand controllers on orbit, which did not happen during ground training. When pushing or pulling

30
the translational hand controller (i.e., ± X), it was very easy to add some Y, which they learned to watch for and actively compensate. At least once, an additional rotational hand controller input was also added. The crewmembers believed that both were caused by the less stable platform of a microgravity environment, compared to 1-g ground operations.
We need to identify which real-time control tasks may be most vulnerable to spatial disorientation and develop design mitigations that can help crews improve performance in these situations. Mitigations may take the form of real-time task aids to help crews properly orient, or some form of semi-automation of the task to improve performance when disorientation occurs.
H. Contributing Factor 8: Design of Displays and Controls
Design of displays and controls is a factor when the visual, auditory, or tactile aspects of the design, reliability, lighting, location, symbology or size are inadequate. Since displays and controls are the primary interfaces with which crewmembers interact to control vehicles and habitats, the design of these components is critical. When an HCD process is not used during development, the design of displays and controls can be inconsistent, ineffective, inefficient, and unacceptable to crews.
Inadequate design of displays and controls can directly lead to lack of proper understanding of a given scenario due to inadequate external representation and its impact upon a user’s problem solving capability. Zhang and Norman (1994) discuss Representations in Distributed Cognitive Tasks, where distributed cognitive tasks are defined as tasks that require the processing of information distributed across the internal mind and the external environment. This activity includes both internal and external representations. Internal representations occur in the mind as propositions, productions, schemas, mental images, etc., while external representations include physical symbols (e.g. letters, numbers, beads of abacuses) or external rules, constraints or relations embedded in physical configurations (e.g., spatial relations of written digits, visual and spatial layout of diagrams). In their paper, they discuss the representational structure of the Tower of Hanoi problem and how different problem representations can have a dramatic impact on problem difficulty even if the formal structures are the same. In the same way, the design of displays and controls can dramatically impact task difficulty based solely upon representation. This effect is discussed further by Zhang in his 1997 article on “The Nature of External Representations in Problem Solving.”
Fitts and Jones (1947) interviewed 100 pilots to identify errors made during reading and interpreting instruments. They found that the two most common errors were reversal errors, in which interpretation of instrument readings, such as heading, were reversed, and errors in interpreting instruments that had multiple rotations, such as altimeters. Several pilots reported

31
misreading the altimeter by 1,000 ft. Other frequent errors involved lack of instrument legibility and substitution errors in which the wrong instrument was looked at. One pilot reported that he was unable to fly a new model of an airplane during a Japanese bomber attack because of the inconsistency between the displays and controls of the new and old models.
In 1998, Swissair Flight 111 crashed into the Atlantic Ocean near Nova Scotia, killing all on board. The Transportation Safety Board of Canada (TSB) concluded that emergency gauges were in awkward positions for the pilots, requiring them to turn around to read them. Additionally, emergency instruments were located in multiple, different locations, which prevented pilots from getting all needed information with a single visual scan. The safety board recommended that the design and location of emergency gauges in the industry be reviewed (TSB, 2001).
In 1977, a system operator for the power control center in New York City accidently cut all power to the city when he turned a dial to the wrong setting. Lightning had taken down several electric lines, causing a power surge on the remaining lines. The operator was unaware of which lines were functional and not functional because his console did not adequately present information about overall system status. In a stressed state, the operator accidently turned a trip protection dial in the wrong direction – into the “Frequency Control” mode rather than the “Trip/Reclose” mode. Although these two settings were on the same dial, they had very different functions. Without trip protection, the remaining power lines over-surged and Manhattan’s entire power grid collapsed and could not be restored for 25 hours (Casey, 1993).
Several high-profile accidents have been attributed to inadequate displays and controls. The poor design of the controls in John Denver’s Adrian Davis Long-EZ experimental aircraft played a role in the crash that took his life in 1997. The crash was determined to be due to the aircraft builder’s decision to locate the unmarked fuel selector handle in a hard-to-access position; the fuel quantity sight gauges were also unmarked. Although partially due to the pilot’s inexperience and lack of training, this accident may not have happened if the controls had not been so poorly designed (NTSB, 1998).
Perhaps the most famous event attributable to poor display and control design is the 1979 Three Mile Island nuclear power plant accident. This accident provides an example of how poor HCI nearly resulted in a nuclear disaster by causing a human error. Many of the controls and display system lights were poorly designed: 1) the information necessary for operating the power plant was difficult to find, and 2) the controls and lights conveyed either incorrect information or confusing information to the user (Meshkati, 1991).

32
At NASA, when display or control designs have been less than adequate, ground control has typically been able to assist. During Apollo 11, the Lunar Module used a computer system that displayed output only in codes and lacked an intuitive interface. Many codes were encountered and memorized through training and simulation on the ground, but in the case of the real first landing, a code appeared that had not previously been encountered in simulation. A decision had to be made whether to proceed with landing or abort, and so the ground was consulted. After a short pause, the ground responded that the code was a non-critical alarm code and that the crew should proceed with landing. Thankfully, the landing was a success (Jones, 2012). However, this incident highlights a critical concern as we move toward more autonomous missions where there will be communication delays or in some cases blackouts. Computer interfaces for long-duration exploration missions must provide enough detail, context, and priority to allow crew to autonomously make safety- and mission-critical judgment calls.
The FCI ISS Life Sciences Crew Comments Database documents several cases where usability issues have occurred that are associated with the use of displays that lack a common overall infrastructure and layout to promote ease of use and understanding of intended operations. Valuable ISS crew time has been lost as crewmembers struggle to understand the use of disparate ISS displays. These differences in ISS displays have led to incorrect data entry, navigational errors, or inaccurate interpretation of the data in the displays. The use of many of the displays has been turned over to ground control because they are so difficult to use. When display interfaces are dissimilar and information is not presented consistently, crewmembers may require additional training and time to master the use of the displays. The crew also may revert to an uncomplimentary skill base from another display design. This natural human tendency may override training and lead to errors. These errors can compromise crew safety, especially in the event of an emergency.
The Space Shuttle Crew Reports reveal instances in which the design of display hardware was insufficient for the environmental conditions encountered. For example, on one mission, crewmembers reported that the sun shining through the overhead windows and the sun’s reflection off the Earth through those windows resulted in the flight deck monitors being almost totally washed out and unusable. Small light shades, designed to prevent this occurrence, were insufficient. The monitors were used to maintain the proper corridors during rendezvous, determining drift and drift rates, and enable target reading to determine if a fly-out is required. A crewmember was required to constantly hold a large cue card over the monitors in order to block the reflection enough to allow the screens to be read.
During the approach and rendezvous of another Shuttle mission, crewmembers reported that the display on Monitor 1 was fairly dim. They rotated the brightness knob to “Full” and set the contrast knob at a position to give them an optimal view of the target from the centerline

33
camera. At approximately five feet from contact, a shadow appeared on the docking target displayed on Monitor 1. This caused the displayed image to become dark enough that no alignment information was visible. Even with the brightness set to full, the display on this monitor was unusable. About two seconds later, the automatic iris function of the camera caused the target in the display to become visible again. Although the target image could not be seen on the monitor when the shadow appeared, postflight analysis shows that the video image recorded directly from Monitor 1 was dim but visible when viewed on the V-10 recorder. Crewmembers on a different mission reported that the manual iris control on the display and control panel was not user-friendly. When a crewmember attempted to manually close the iris, the video brightness “actually bloomed”. After crewmembers put the camera back into “Auto”, the video returned to the previous picture. During the postflight debriefing, it was pointed out that manual iris control also reverts shutter speed and gain to default settings. To optimize the video, all three must be set together. However, shutter speed and gain could only be commanded through the display. This problem was thus attributed to poor user interface design.
We know how to design adequate displays and controls for terrestrial applications, but space applications require special consideration. The design of displays and controls must ultimately mitigate the effects of all of the HCI contributing factors described in the sections above. Displays must provide all of the information needed by crew to operate autonomously and in a form that is intuitive and promotes proper attention and cognitive load. Displays must also be usable in the variety of environmental conditions expected during the mission. Controls must be designed to provide automation when needed to compensate for the effects of the space environment. Research is needed to determine how displays and controls can be designed to serve this complex mitigation role.
V. COMPUTER BASED MODELING AND SIMULATION
Computer-based modeling and simulation can be used to complement user-based research early in the design process. Formal methods of modeling and evaluation use existing data about physical and cognitive activities to estimate human task completion times, workload, and errors, among other performance measures. Formal modeling methods include the Cognitive Model Interface Evaluation tool (Ritter, Van Rooy, & Amant, 2002), Keystroke-Level Model (Card, Moran, Newell, 198), and the Goals, Operations, Methods, and Selection (GOMS); (John & Kieras, 1996; Card, Moran, & Newell, 1983) family of modeling techniques. Matessa & Remington (2005) used GOMs to predict astronaut gaze durations on controls and displays in the Shuttle cockpit during fault management. The researchers used data from non-spaceflight experiments to predict gaze times for tasks such as reading a key on a keyboard, reading a fault message, reading data from instrumentation, reading labels on a switch, and reading a procedure. They compared the output of the predicted gaze times from the GOMS model with eye-tracking

34
data from novices (i.e., commercial airline pilots) and experts (i.e., Shuttle Astronauts). Although the correlation between the model and actual gaze duration was high, the average error percentage was 22% between the model and pilots and 29% between the model and astronauts. Differences between the model and actual gaze patterns included astronauts looking less at procedures and more at data and pilots looking more at procedures and switches than the model predicted.
The Improved Performance Research Integration Tool (IMPRINT) is a network modeling tool for human-system tasks. The tool can be used to compare function allocation between humans and computers and to predict mission effectiveness, mental workload, human performance in extreme environments, and human performance based on skill (Allender, 2000). For example, Hunn and Heuckeroth (2006) used IMPRINT to model the distribution of operator workload for an unmanned aerial vehicle.
Understanding and predicting human-system performance and identifying risks that may be inherent in a concept or a design is often achieved via computer-based modeling or simulation. The use of human performance models can result in significant lifecycle cost savings as compared to repeated human-in-the-loop evaluations, but accurately modeling the human is extremely difficult. In the SHFE domain, modeling and human-in-the-loop evaluations must be used in concert. We do not have high-fidelity human performance models, and most have not been sufficiently validated or certified. Accordingly, models must be used in a limited fashion to help determine the critical areas that should be addressed through the more costly, but more representative, human-in-the-loop evaluations.
VI. RISK IN CONTEXT OF EXPLORATION MISSION OPERATIONAL SCENARIOS
While standards and requirements for spacecraft crew interfaces exist that are appropriate for operational environments similar to ISS, exploration vehicles are anticipated to have very different crew interface characteristics and operate under different environmental constraints than ISS. In these exploration vehicles, crews will have to effectively interact with displays and controls under conditions of vibration, acceleration, and changing gravity levels.
Future exploration missions will increase in length, thus requiring newer technologies not yet proven in the space environment and an increase in autonomy. Near-Earth Object missions will provide a substantial set of independent lessons learned, experiences, and more definitive knowledge gaps that will apply to Mars exploration. Crews will face the challenges of physical deconditioning, prolonged isolation and confinement, significant communication latencies, environmental stressors, and increased responsibility and autonomy. Effective design solutions

35
for vehicles, habitats, and missions need to allow crew to manage and control all aspects of exploration mission operational scenarios.
We have very little HCI performance data from our spaceflight experiences to date. Data are anecdotal and indirect, i.e., in general, mission objectives have been successfully accomplished with existing crew interfaces. However, this statement must be qualified with the clause – with timely assistance from ground control personnel. The autonomous nature of future exploration missions makes them very dissimilar to Shuttle and ISS operations. Consequently, there is uncertainty regarding the adequacy of the current state-of the-art of HCI for exploration missions involving autonomous operations. We will be better able to assess the Risk of Inadequate HCI once HCI-related data are collected during ISS-6, ISS-12, Lunar and Near-Earth Asteroid missions, and once more detailed Mars Design Reference Missions are developed.
VII. RESEARCH GAPS
Evidence supports the claim that inadequate HCI leads to inefficiencies and potential safety concerns in spaceflight. Therefore, it is critical that all of the contributing factors are well-understood and considered in HCI design. Potential research gaps related to inadequate HCI include, but are not limited to:
• Methods for improving HCD activities and processes
• Operationally feasible methods of assessing the adequacy of HCI on long-duration missions in terms of effectiveness, efficiency, and crew satisfaction
• Tools to improve HCI, information presentation/acquisition/processing, and decision making for a highly autonomous environment
• Tools, methods, and metrics which support allocation of attention and multitasking for individuals and teams
• Methods for identifying, understanding, and mitigating task overhead associated with human-computer interface use, particularly with regard to transparency (interface predictability and logical flow) and efficiency (reduction of time on task).
• Understanding and mitigating the effects of long-duration microgravity on human performance, in particular, cognitive overload, perceptual changes and spatial disorientation.
• Validation methods for human performance models
A summary of all SHFE gaps can be found in the Human Research Roadmap Content Management System at http://sa.jsc.nasa.gov/hrrcms/.

36
VIII. CONCLUSION
The safety and efficiency of the crew throughout a mission depends to a large extent on their ability to acquire, process, and make adequate decisions using the computer-based information they are provided with while living and working on-orbit. For this to occur, the crew must be presented with the appropriate format and quantity of information needed to allow them to successfully complete assigned tasks. In addition, the information must be provided in a clear, concise, and timely manner, and the method of interaction with the information must be compatible with human capabilities and limitations. Mission planners, procedure writers, and hardware/software designers must be cognizant of this when designing systems that will interact with a human operator.
This chapter has focused on the factors contributing to a risk of error due to inadequate HCI. If these contributing factors can be better characterized through research, and if there is an awareness of these factors and mitigations in place, the risk of human error will be reduced significantly. The evidence presented in this chapter provided various examples from spaceflight, aviation, maritime, and ground-based research to illustrate the effects of several contributing factors to the risk of inadequate HCI. In some cases, incidents resulted when contributing factors were not considered in design. In other cases, research indicates there is an awareness of the factors that contribute to the risk, and attempts are being made to prevent or mitigate potential errors. It should be noted that often there is a combination of contributing factors at work – we must better understand the combined effects in order to develop effective mitigations. Further research is needed to develop transparent methods of measuring HCI on long-duration missions, as well as tools to improve information presentation, acquisition, processing, and decision making in the increasingly autonomous environment of long-duration missions. Without these improvements, errors due to inadequate HCI will continue to pose a risk to mission success.

37
IX. REFERENCES
AAIASB. (2006). Aircraft Accident Report - Helios Airways Flight HCY522, Boeing 737-31S at
Grammatiko, Hellas on 14 August 2005: Air Accident Investigation and Aviation Safety
Board, Hellenic Republic, Ministry of Transport & Communications.
AAIB. (1977). Aircraft Accident Report 5/77 - British Airways Trident G-AWZT Inex Adria DC9
YU-AJR, Report on the collision in the Zagreb area, Yugoslavia, on 10 September 1976.
London: Federal Civil Aviation Administration, Aircraft Accident Investigation
Commission.
AAIB. (1992). Aircraft Accident Report 4/92 - Report on the incident to British Aerospace ATP,
G-BMYK, 10 miles north of Cowly near Oxford, on 11 August 1991. London: Air
Accidents Investigation Branch, Department of Transport.
Accident Description - Aeroflot Russian International Airlines, Airbus A310-304. (2004, 1
August 2004). Aviation Safety Network Retrieved July 25, 2011, from http://aviation-
safety.net/database/record.php?id=19940323-0
Adelstein, B., Beutter, B., Kaiser, M., McCann, R., Stone, L., Holden, K., and Root, P. (2009c).
Determining Subjective Thresholds for Display Usability Under Combined Whole-Body
Vibration Plus G-Loading. SHFE Information Presentation DRP report.
Adelstein, B., Beutter, B., Kaiser, M., McCann, R., Stone, L., Anderson, M., Renema, F., &
Paloski, W. (2009b). Influence of Combined Whole-Body Vibration Plus G-Loading on
Visual Performance. NASA/TM 2009-215386.
Adelstein, B., Beutter, B., Kaiser, M., McCann, R., & Stone, L. (2009a) Effects of Transverse
Seat Vibration on Near-Viewing Readability of Alphanumeric Symbology. NASA/TM
2009-215385.
Allender, L. (2000). Modeling Human Performance: Impacting System Design, Performance,
and Cost. In M. Chinni (Ed.) Proceedings of the Military, Government and Aerospace

38
Simulation Symposium, 2000 Advanced Simulation Technologies Conference (pp. 139-
144). Washington, D.C.
Braithwaite, M. G., Durnford, S. J., Crowley, J. S., Rosado, N. R., & Albano, J. P. (1998).
Spatial disorientation in US Army rotary-wing operations. Aviation, space, and
environmental medicine.
CAA. (2007). Follow-up Action on Occurance Report, Accident to Airbus A321-231, G-MEDG,
At Khartom Airport, Sudan on 11 March 2007: Safety Regulation Group, Safety
Information and Data Department, Civil Aviation Authority.
Card, S. K., Moran, T. P., & Newell, A. (1980). The keystroke-level model for user performance
time with interactive systems. Communications of the ACM, 23, 396-410.
Card, S. K., Moran, T. P., & Newell, A. (1983). The psychology of human-computer
interaction. Hillsdale, NJ: Lawrence Erlbaum Associates.
Casey, S. M. (1993). Set phasers on stun: And other true tales of design, technology, and human
error. Aegean: Santa Barbara, CA.
Cheung, B., Money, K., Wright, H., & Bateman, W. (1995). Spatial disorientation-implicated
accidents in Canadian forces, 1982-92. Aviation, space, and environmental medicine,
66(6), 579-585.
Chiles, J. R. (2002). Inviting disaster: Lessons from the edge of technology: An inside look at
catastrophes and why they happen. New York: Harper Paperbacks.
Clement, G., Moore, S. T., Raphan, T., & Cohen, B. (2001). Perception of tilt (somatogravic
illusion) in response to sustained linear acceleration during space flight. Experimental
brain research, 138(4), 410-418.
Cullen, W. (2001). The Ladbroke Grove Rail Inquiry - Part 2. London: HSE Books.
Department of Defense. (2005). Department of Defense human factors analysis and
classification system, a mishap investigation and data analysis tool.Washington, D.C.

39
Degani, A. (2001). Korean Air Lines Flight 007: Lessons from the Past and Insights for the
Future. Ames Research Center, NASA.
Dix, A., Finlay, J., Abowd, G., and R. Beale (2004). Human Computer Interaction, 3rd Edition.
Pearson Education Limited: Essex, England.
DSB. (2010). Crashed during approach, Boeing 737-800, near Amsterdam Schipol Airport, 25
February 2009: Dutch Safety Board.
Dydek, Z. T., Annaswamy, A. M., & Lavretsky, E. (2010). Adaptive control and the NASA X-15
program: A concise history, lessons learned, and a provably correct design.
Egyptian Ministry of Civil Aviation (2006). Final Report of the Accident Investigation - Flash
Airlines Flight 604, January 3, 2004, Boeing 737-300 SU-ZCF, Red Sea off Sharm El-
Sheikh, Egypt. (2004).
Ellis, S. R. (2000). Collision in space. Ergonomics in Design: The Quarterly of Human Factors
Applications, 8(1), 4-9.
Embrey, D., Blackett, C., Marsden, P, & Peachey, J. (2006). Development of a Human
Cognitive Workload Assessment Tool: MCA Final Report. Retrieved from:
http://www.dft.gov.uk/mca/research_report_546.pdf
Endsley, M.R. (1998). Design and evaluation for situation awareness enhancement.
Proceedings of the Human Factors Society 32nd Annual Meeting: Santa Monica, CA.
Human Factors Socieity, 1988:97-101.
Ezer, N. (2011). Human interaction within the “Glass Cockpit”: Human Engineering of Orion
display formats. Proceedings from the 18th IAA Humans in Space Symposium (#2324).
Houston, TX.
Fitts, P.M. & Jones, R.E. (1947) Analysis of Factors Contributing to 460 "Pilot-Error"
Experiences in Operating Aircraft Controls. Memorandum Report TSEAA-694-12. Aero
Medical Laboratory. Air Material Command. Wright-Patterson Air Force Base, Dayton,
Ohio, July 1, 1947

40
Flight Safety Foundation (1999). Erroneous Airspeed Indications Cited in Boeing 757 Control
Loss. (1999). Alexandria, VA.
Glasauer, S., & Mittelstaedt, H. (1998). Perception of spatial orientation in microgravity. Brain
research reviews, 28(1-2), 185-193.
Holden, K.L., Malin, J.T., and Thronesbery, C. Guide to Designing Usable Software Systems in
Advanced Technology Environments. NASA Technical Report: JSC-28517.
Homick, J. (1979). Space motion sickness. Acta Astronautica, 6(10), 1259-1272.
Hunn, B. P. & Heuckeroth, O. H. (2006). A Shadow unmanned aerial vehicle (UAV) improved
performance research integration tool (IMPRINT) model supporting future combat
systems (No. ARL-TR-3731). Aberdeen Proving Ground, MD: Army Research
Laboratory.
ISO TR 18529 (2000). Ergonomics of human system interaction – human-centred lifecycle
process descriptions.
Jenkins, D. (2000). Hypersonics before the Shuttle. Washington, DC: National Aerospace and
Space Administration, 2000.
John, B. E. & Kieras, D. E. (1996). The GOMS family of user interface analysis techniques:
Comparison and contrast. ACM Transactions on Computer-Human Interaction, 3, 320–
351.
Jones, D.G., & M.R. Endsley (1996). Sources of Situation Awareness Errors in Aviation.
Aviation, Space, and Environmental Medicine. Vol. 67, No. 6, pp. 507-512.
Jones, E.M. (2012). The First Lunar Landing – Communications Transcript, Apollo 11 Lunar
Surface Journal. Original posted 1995, Revised Dec. 7th, 2012.
http://www.hq.nasa.gov/office/pao/History/alsj/a11/a11.html
Kantowitz, B. H., & Sorkin, R. D. (1987). Allocation of functions. In B. H. Salvendy (Ed.),
Handbook of Human Factors (pp. 355-369). Oxford, England: Wiley.

41
Ladkin, P. (1996). AA965 Cali Accident Report. University of Bielefeld. Retreived July 22, 2011,
from http://www.skybrary.aero/bookshelf/books/1056.pdf
Ladkin, P. B. (1997). News and comment on the Aeroperu B757 accident: Aeroperu flight 603, 2
October 1996. Retrieved from http://www.rvs.uni-
bielefeld.de/publications/Reports/aeroperu-news.html
Ladkin, P. B. (2004). Air Transat Flight 236: The Azores Glider. Retrieved from
http://www.rvs.uni-
bielefeld.de/cms/publications/compendium/incidents_and_accidents/Ladkin-
AirTransat.pdf
Lawton, R., & Ward, N. J. (2005). A systems analysis of the ladbroke grove rail crash. Accident
Analysis & Prevention, 37(2), 235-244.
Makhijani, A. (2011). Post-tsunami situation at the Fukushima Daiichi nuclear power plant in
Japan: Facts, Analysis, and some potential outcomes. Retrived August 24, 2011, from
http://www.ieer.org/comments/Daiichi-Fukushima-reactors_IEERstatement.pdf. Takoma
Park, MD: Institute for Energy and Environmnetal Research.
Matessa, M., & Remington, R. (2005). Eye movemnets in human performance modeling of
Space Shuttle operations. In Proceedings of the Human Factors and Ergonomics Soicety
49th Annual Meeting. Santa Momica, CA: Human Factors and Ergonomics Society.
McCann, R., Adelstein, B., Beutter, B., Kaiser, M., Root, P., Godfroy, M., Renema, F.,
Anderson, M., & Verborgh T. (2009). Effects of Thrust Oscillation Vibration on
Maintaining Situation Awareness and Assuming Manual Flight Control. SHFE
Information Presentation DRP report.
McCann, R.S. and McCandless, J. (2003). Human-machine teaming for dynamic fault
management in next-generation launch vehicles. In Proceedings of the Joint Army-Navy-
NASA-Air Force 3rd Modeling and Simulation Meeting, Colorado Springs, FL,
Meshkati, N. (1991). Human factors in large-scale technological systems' accidents: Three Mile
Island, Bhopal, Chernobyl. Organization & Environment, 5(2), 133.

42
NASA Office of Inspector General (OIG). (2000). Assessment of the Portable
Computer System and the Data Display Process, G-99-010A (Memo):
Assistant, Inspector General for Inspections, Administrative Investigations
and Assessments.
NASA (2008). Human Space Flight Gallery [photos on the Internet; cited 2008
Jan 26]. Available from: http://spaceflight.nasa.gov/gallery/index.html.
NASA (2009). Crew Seat DTO Project Documentation. Retrieved July 22, 2011, 2011, from
http://ea.jsc.nasa.gov/webapp/gfedoc/searchdoc.asp?project=crew_seat_dto&curator=sus
an.reno-1&rno=nathan.wells-1
Norris, A.C. (2002). Current trends and challenges in health informatics. Health Informatics
Journal, SAGE Publications. 8, 205-213.
NTSB. (1973). Aircraft Accident Report- Eastern Air Lines, Inc. L-1011, N310EA, Miami,
Florida, December 29, 1972 (No. NTSB-AAR-73-14). Washington, D.C.
NTSB. (1986). Aircraft Accident Report, Galaxy Airlines, Inc. Lockheed Electra-L-188C (No.
NTSM/AAR-86/01). Washington, D.C.
NTSB. (1987). Aircraft Accident Report - Midair Collision of Aeronaves De Mexico, S.A.,
McDonnell Douglas DC-9-32, XA-JED and Piper PA-28-181, N4891F, Cerritos,
California August 31,1986 (No. NTSB/AAR-87/07). Washington, D.C.
NTSB. (1991). Aircraft Accident Report - Avianca, The Airline of Colombia Boeing 707-321 B
(No. NTSB/AAR-9 l/04). Washington, D.C.
NTSB. (1998). LAX98FA008. Washington, D.C.: National Transportation Safety Board.
NTSC. (2008). Aircraft Accident Investigation Report - Boeing 737-4Q8, PK-KKW, Makassar
Strait, Sulawesi, Republic of Indonesia, 1 January 2007 (No. KNKT/07.01/08.01.36):
National Transportation Safety Committee, Ministry of Transportation, Republic of
Indonesia.

43
Pijnenburg, B., & Van Duin, M. J. (1991). The Zeebrugge ferry disaster. Elements of a
communication and information processes scenario. In U. Rosenthal & B. Pijnenburg
(Eds.), Crisis management and decision making: simulation oriented scenarios (pp. 45):
Springer.
Previc, F. H., & Ercoline, W. R. (2004). Spatial disorientation in aviation. Reston, VA:
American Institute of Aeronautics.
Rando, C. M., Baggerman, S. D., & Duvall, L. E. (2005). Habitability in space. Proceedings of
the Human Factors and Ergonomics Society 49th Annual Meeting. Santa Monica, CA:
Human Factors and Ergonomics Society
Reason, J. (2000). Heroic compensations: The benign face of the human factor.
Ritter, F., Van Rooy, D., & Amant, R. (2002). A user modeling design tool based on a cognitive
architecture for comparing interfaces. In C. Kolski, J. & Vanderdonckt (Eds.),
Computer-Aided Design of User Interfaces III, Proceedings of the 4th International
Conference on Computer-Aided Design of User Interfaces (CADUI’2002; pp. 111-118).
Dordrecht, The Netherlands: Kluwer Academics Publisher.
Sándor, A., Holden, K., Thompson, S., Pace, J., Adelstein, B., Beutter, B., McCann, R., &
Anderson, M. (2010). Performance with continuous and discrete cursor control device
under vibration frequencies and amplitudes. SHFE Information Presentation DRP report.
Salvendy, G. (2006). Handbook of Human Factors and Ergonomics. Hoboken, NJ: Wiley.
Sarter, N. B., Woods, D. D., & Billings, C. E. (1997). Automation surprises. In G. Salvendy
(Ed.) Handbook of human factors and ergonomics (2nd ed., pp. 1926-1943). New York:
Wiley.
Shappell, S.A., & Wiegmann, D.A. (2000). “The Human Factors Analysis and Classification
System – HFACS”, Report DOT/FAA/AM-00/7, February 2000. Available:
http://www.nifc.gov/fireInfo/fireInfo_documents/humanfactors_classAnly.pdf.
44
Shayler D.J. (2000) Lunar module checkout-mode error. In: J. Mason (Ed.), Disasters and
accidents in manned spaceflight (pp. 216-22). Chichester, U.K.:Springer-Praxis.
Stephenson, A. (1999). Mars Climate Orbiter: Mishap Investigation Board Report. NASA,
November, 10.
Sullenberger, C. B. (2010). Preparing for Excellence: Leading Your Team to Success, Opening
Plenary Session of the Human Factors and Ergonomics Society 54th Annual Meeting.
San Francisco, CA.
Thompson, S., Holden, K., Ebert, D., Root, P., Adelstein, B., & Jones, J. (2010). Short Duration
Bioastronautics Investigation (SDBI) 1904: Human Factors Assessment of Vibration
Effects on Visual Performance During Launch. Poster presented at the 2010 Human
Factors & Ergonomics Society Houston Chapter Meeting, Houston, TX.
TSB (2001). Aviation Investigation Report – In-Flight Fire Leading to Collision with Water,
Swissair Transport Limited, McDonnell Douglas MD-11 HB-IWF, Peggy’s Cove, Nova
Scotia 5 nm SW, 2 September 1998 (Report number A98H0003). Gatineau, Quebec,
Canada: Transportation Safety Board of Canada.
Walters, J. M., & Sumwalt, R. L. (2000). Aircraft accident analysis: Final reports: New York:
McGraw-Hill.
Wesson, J., & Van Greunen, D. (2002). Visualisation of usability data: measuring task
efficiency. In Proceedings of the 2002 annual research conference of the South African
institute of computer scientists and information technologists on Enablement through
technology (SAICSIT '02). South African Institute for Computer Scientists and
Information Technologists, Republic of South Africa, 11-18.
Wickens, C. D. (1991). Processing resources and attention. In: D. L. Damos (Ed.) Multiple-task
performance (pp. 3-34). Bristol, PA: Taylor & Francis.
Wickens, C. D. (2005). Attentional Tunneling and Task Management (No. AHFD-05-23/NASA-
05-10). Urbana-Champaign: Aviation Human Factors Division, Institute of Aviation,
University of Illinois.

45
Zadeh, L.A. (1998). Information Granulation and its Centrality in Human and Machine
Intelligence. Chapter in Rough Sets and Current Trends in Computing. Polkowski, L.
(Ed.), Springer Berlin Heidelberg, pp. 35-36.
Zhang, J., & Norman, D.A. (1994). Representations in distributed cognitive tasks. Cogn Sci., 18,
pp. 87–122.
Zhang, J. (1997). The nature of external representations in problem solving. Cogn. Sci., 21, pp. 179–217.
Zhang, J., & Walji, M. (2011). TURF: Toward a unified framework of EHR usability. J. Biomed. Inform. Arch., 44(6), pp. 1056-1067.
X. TEAM
The authors are indebted to Vicky Byrne and Susan Schuh for their efforts locating and assembling the evidence.

46
XI. LIST OF ACRONYMS
AAIASB Air Accident Investigation and Aviation Safety Board (Greece) AAIB Air Accidents Investigation Branch (United Kingdom) ARC Ames Research Center CAA Civil Aviation Authority (United Kingdom) CCD Cursor Control Device DoD Department of Defense DOUG Dynamic Ubiquitous On-Board Graphics DSB Dutch Safety Board DTO Detailed Technical Objective EVA Extra Vehicular Activity FCI Flight Crew Integration g Gravity GOMS Goals, Operations, Methods, and Selection GPWS Ground Proximity Warning System HARI Risk of Inadequate Design of Human and Automation / Robotic Integration HCD Human-Centered Design HCI Human-Computer Interaction HFACS Human Factors Analysis and Classification System HRP Human Research Program IA Information Architecture IMPRINT Improved Performance Research Integration Tool ISS International Space Station NASA National Aeronautics and Space Administration NTSB National Transportation Safety Board NTSC National Transportation Safety Committee (Indonesia) PCS Portable Computer System PGSC Payload and General Support Computers SA Situation Awareness SDBI Short Duration Bioastronautics Investigation SHFE Space Human Factors Engineering SRMS Shuttle Remote Manipulator System SSRMS Space Station Remote Manipulator System TASK Risk of Inadequate Critical Task Design TRAIN Risk of Performance Errors Due to Training Deficiencies TSB Transportation Safety Board