evidence review: wildfire smoke and public health risk and forms... · evidence review: wildfire...
TRANSCRIPT
Environmental Health Services 655 12th Ave W Vancouver BC V5Z 4R4 Tel 604.707.2443 Fax 607.707.2441 www.bccdc.ca
Evidence Review:
Wildfire smoke and public health risk
March 31, 2014
Author: Sandra Durán Expert Reviewers: Mike Flannigan
Fabienne Reisen
Editors: Catherine Elliott Karen Rideout
Evidence Review: Wildfire smoke and public health risk 1
Key points
• Combustion and fuel characteristic such as heat (completeness of combustion), fire intensity, fuel load, fuel type, and dryness all influence smoke production and composition.
• Duration of smoke production can be affected by vegetation types, and the kind and frequency of natural and anthropogenic disturbances in the forest. In general, tropical forests and forest peatlands possess higher fuel loads than other biomes.
• Plume distribution and duration in populated areas can be affected by meteorological conditions such as temperature, wind speed and direction, and topography.
• Two forms of combustion characterize wildfires: flaming and smoldering. Flaming is the rapid oxidization of the flame, which occurs rapidly releasing mainly carbon dioxide and water. Smoldering is a slow process where there is a high conversion of fuel to toxic compounds, such as carbon monoxide, non-methane organic compounds, and aerosols.
• Climatic conditions affect the behaviour, size, and intensity of wildfires. Longer burning periods result from increases in temperature and drought.
• Emission factors—the quantity of a pollutant emitted per dry mass burned—vary among biomes. Savannas produce more carbon dioxide than others; boreal forests produce more carbon monoxide, methane, and fine particulate matter than other biomes; and tropical forests tend to produce more coarse particulate matter.
• The main components of wildfire smoke are particulate matter, carbon monoxide, volatile organic compounds, mercury, ozone, and pollutant mixtures.
• Health effects associated with wildfire smoke range from eye, nose, or throat irritation to reduced lung function, bronchitis, exacerbation of asthma, and increased risk of death (Refer to evidence review on Health Effects for further detail).
• Effects of mercury emissions, as well as emitted pollutant mixes, may be detrimental to human health, but current data is insufficient to fully understand the health impacts of these components.
Evidence gaps
• There is still considerable uncertainty in emission inventories of components such as VOCs, non-methane hydrocarbons (NMHC), and mercury, as well as in the potential health effects of these components derived from wildfire smoke. In addition, substantial uncertainty still remains in validating standard levels of some smoke components (e.g., NO2, SO2, VOCs) recommended by the WHO that inform public health decisions.
• Future research should focus on the effects of smoke exposure from wildfires in tropical regions. Most research has focused on temperate forests, but tropical forests have the highest fuel load and tend to produce more PM10 than other types of vegetation. Thus, by increasing the knowledge of wildfires in tropical regions, insights into the potential effects of PM10 exposure can also be obtained; since most research has focused on the effects of PM2.5.
• Great uncertainty persists in determining plume distribution, but satellite data and remote sensing tools for forecasting smoke conditions near populated areas are continually being developed and improved (see evidence review on Smoke Surveillance).

Evidence Review: Wildfire smoke and public health risk 2
1. Introduction
Large wildfire catastrophes in recent years have led to a growing concern about the potential impacts of smoke events, especially since there is evidence that fire activity may be increasing in some parts of the world, as in the Western U.S. forests, Canada, Australia, and Russia with exceptionally intense fire events (1-3). These increases can be attributed to extreme weather conditions, forest management practices, climate change, and a rise in human population density near fire-prone areas (4). Scientific efforts have shown that the emissions from biomass burning represent a large perturbation in global atmospheric chemistry (3, 5).
The smoke produced from wildfires can release large amounts of particulate matter (PM), carbon monoxide (CO), and gases such as nitrogen oxides (NOx) and volatile organic compounds (VOCs) into the atmosphere (6). Emissions from wildfires may be either primary pollutants (e.g., PM, CO, NOx, VOCs) or constituents of secondary pollutants (e.g., ozone (O3), secondary organic aerosols). When VOCs and NOx undergo photochemical processing (7) the results can be detrimental to air quality. This can occur at regional and local scales by increasing concentrations of PM, constituting a serious threat for human health (8).
Hazardous emissions in wildfire smoke include carcinogenic compounds such as polycyclic aromatic hydrocarbons (PAHs), benzene, and free radicals (4). PM from smoke is associated with respiratory illnesses such as bronchitis, pneumonia, asthma, and cardiovascular problems (9). Fire emissions are important contributors to global mortality rates with an average estimation of 339,000 deaths each year (260,000–600,000 deaths annually) attributed to exposure to landscape fire (10), which has become a serious problem with a high cost to society, although the real economic costs are still unknown (11).
Compared to the abundance of research examining human health impacts from urban PM, relatively few studies have evaluated the health impacts of air pollution resulting from the burning of biomass and wildfire effects (4). This may be due to the fact that wildfires are short-lived opportunistic events, which makes it more challenging to conduct epidemiological studies. There is a need to better understand smoke characteristics from wildfires, and their potential effects for human health in order to improve the response among residents exposed to smoke during a wildfire event (11).
The purpose of this review is to summarize scientific findings from studies at global and regional levels of the main combustion factors that influence smoke production from wildfires, the main types of wildfires and the main components of smoke that can have potential health impacts. Thus, it will describe the toxicity of different pollutants in smoke, and it will identify the main features of smoke that need to be considered when assessing public health risk. This will inform the development of evidence-based guidelines for public health response to wildfire smoke events.
This study is organized into four main sections. This first section introduces the subject and describes main gaps in the literature of wildfires and its health effects. The second section describes the study methodology. The third section reviews general factors that influence smoke production, ways to characterize wildfires and detection of wildfire smoke components. The fourth section summarises the literature related to the main components of wildfire smoke and their health impacts. Specifically, the health effects of components such as PM, trace gases, VOCs, mercury, CO, O3 and toxic pollutant mixes are examined.
Evidence Review: Wildfire smoke and public health risk 3
2. Methods
Three databases of scientific literature were searched: Web of Science, BIOSIS Previews, and MEDLINE. Combinations of the following keywords were used to search for relevant studies: “wildfire”, “forest fire”, “wildland fires”, “tropical forests fire”, “fire intensity”, “fire severity”, “combustion factors”, “combustion efficiency”, “wildfire smoke”, “particulate matter”, “wildfire smoke health effects”, “toxicity pollutants”, “pollutant mixes”, “trace gases”, “volatile organic compounds”, “biomass burning”, “smoke plume”, “smoke transport”, and “mercury”.
The search included global and regional studies that provided information on the main components derived from wildfires smokes and their potential health effects. Most of the information relevant to health effects from wildfires comes from regional studies, which assessed short term effects of smoke exposure in rural and semirural areas near fire occurrence. Regional studies include temperate and tropical forests in Canada, Europe, and South America. Studies evaluating health effects in urban areas were excluded, since results from these studies can have confounding factors of health effects generated by air pollution. These factors are not necessarily applicable to or extrapolated for assessing effects of wildfire smoke, as health effects in urban areas result from long term exposure. Similarly, research evaluating effects on human health from using biomass burning as a fuel (e.g., wood burning stoves and fire places) were also excluded, despite the fact that these studies can provide some information about long term effects on human health from wood smoke. Information from web pages and technical reports was only included for the section on available tools for monitoring and forecasting smoke and plume distribution.
3. General factors that influence smoke production and detection of wildfire smoke components
The common factors that influence smoke production and composition from wildfires are determined by the type of fire, as well as weather and climate conditions. Similarly, physical and chemical processes during combustion and fuel type, load, and moisture determines the frequency and severity of fires, plume distribution, and plume composition (3).
3.1 Types of fires
Fires can be characterized according to the type of biomass burning. The length, intensity, size and extent of the fire vary with the type of plant biomass that is burned. Characterizing fires in terms of each vegetation type is useful to determine the impacts of biomass burning in different regions and estimate the amount of toxic compounds released by wildfires.
Wildfires can be initiated naturally by lightning strikes, although most fires are intentionally set for land-use practices (3). For example, many of the tropical wildfires can be the result of land clearing (12). Also, prescribed fires are often used as a tool for land management to restore or maintain the natural, beneficial role of fire; reducing fire risk by consuming accumulated fuels under preferred weather conditions (13). Many fire-adapted ecosystems depend on the regular occurrence of fire for survival (14). In these ecosystems, land managers may implement prescribed burning every 1–4 years under conditions when fuel consumption can be limited and smoke dispersion can be partially controlled. Wildfires, in contrast, consume very large amounts of fuel with few or no options for reducing smoke impacts on populated areas (13).
Forests, savannas and grasslands are among the important vegetation types susceptible to wildfires. Tropical forests cover 6.25 million km2 (5% of global land surface) in America, Africa, and Asia. The boreal forests and woodlands (45–70° North) cover an extension of 9–14 million km2, representing

Evidence Review: Wildfire smoke and public health risk 4
about 6–9% of global land surface and 30% of the world’s terrestrial carbon storage (3). Savannas composed of a mixture of trees and grasses ranging from open woodland to grassland, cover about 33 million km2 (22% of global land surface). Temperate forests occupy the smallest area of the forest-covered land surface with only 0.75 million km2 and 0.5% of the global land surface.
According to (5) the consumption of burned dry matter is higher in savannas with 3160 Tg per year. In tropical forest 1330 Tg are consumed per year and 640 Tg per year in extratropical forest (boreal and temperate forests). CO2, CO and CH4 are the main compounds released in wildfires in these types of vegetation (15). After a fire in a boreal forest, released carbon will be recaptured slowly and gradually because the post-fire growth rate of boreal vegetation is very slow. In turn, tropical climates with high temperatures, sufficient rainfall, and long periods of sunlight will allow for more rapid vegetation growth (forest or savanna) and thus the carbon emitted from tropical savannas has a shorter atmospheric residence time (3).
Fires in savannas are less intense and have short duration because fire passes relatively rapidly through the underbrush and the thick bark protects the trees from the fire (16). Tropical fires are low intensity compared to those in boreal forests, where intensity can range from 500–2000 k/Wm during surface fires and to >4000 k/Wm in continuous crown fires and can even exceed 100,000 k/Wm in extreme situations (17). Nonetheless, average fire intensities in recurrent wildfires in rainforests can be ten times greater (30 versus 307 kW/m) and can spread twice as fast (0.25 versus 0.52 m/min) depending of the landscape-level interactions among multiple fires and local weather conditions (12).
3.2 Combustion factors
The processes that take place in combustion of biomass have been described in detail in the literature (5, 18). The focus here is on identifying how combustion influences the products released from fire smoke. A combustion factor is the fraction of biomass exposed to a fire that is actually consumed. Estimations of total combusted biomass can be obtained given biomass consumption per unit area and an estimate of the area burned (15). Combustion of biomass proceeds through a sequence of stages: ignition, flaming, smoldering and extinction, each with different chemical processes that result in different emissions (5).
The organic composition of the emissions is determined by the temperature and the rate of temperature increase (19). When ignition begins, temperature in the fuel bed can rise from 450 to 800 K, and a complex mixture of tar and gas products are released, which, when diluted with air, form a flammable mixture (5). When this mixture ignites, flaming combustion occurs, releasing carbon dioxide (CO2) and water (20). According to Koppmann et al. (19), the principle fuel components in the flaming phase are:
• Cellulose (a complex carbohydrate) and hemicelluloses (polysaccharides): the main constituents of the cell wall (50–65%)
• Lignin: a complex non-carbohydrate polymer that binds to cellulose fibers and strengthens the cell walls (16–35%)
• Extractives: organic species that are not part of the cellular structure of the biomass and that can be dissolved (0.2%–15%) and trace minerals.
At low temperatures (typically <400 K), the polysaccharides and functional groups of hemicelluloses and lignin decompose. In this stage of the fire, methanol, light aldehydes, and formic and acetic acid are the dominant emissions (18). Once over 450 K, the polymer structure of the wood is decomposed. In this

Evidence Review: Wildfire smoke and public health risk 5
stage of the fire, about 80% of the material is thermally decomposed and large amounts of gaseous compounds are emitted (18).
Once most of the volatiles have been released from the fuel, flaming combustion ceases and smoldering begins (~800–1000 K) (18). Smoldering is a slow, low-temperature, flameless form of combustion. In general, smoldering yields a substantially higher conversion of a fuel to toxic compounds than does flaming, but this occurs more slowly and thus constitutes a pathway to flaming that can be started by heat sources much too weak to directly produce a flame (5).
Flaming combustion (~1400 K) converts the C, H, N, and S in the fuel into highly oxidized gases such as CO2, H2O, NOx, and sulfur dioxide (SO2), respectively, and produces most of the black (or elemental) carbon particles (15). NO, NO2, N2O, and molecular N2 are released predominantly during flaming combustion (5). Smoldering produces most of the CO, CH4, non-methane organic compounds (NMOC), and primary organic aerosol (15). Also, ammonia (NH3), amines and nitriles are associated with smoldering combustion (20). The methyl halides, CH3Cl, CH3Br, and CH3I, are formed predominantly in the smoldering stage, probably due to the reaction between methanol and hydrochloric acid (HCl) catalyzed at glowing char surfaces (5).
Wildfires are dominated by flaming combustion in the earlier part of the fire, and smoldering during the later part. Smoldering combustion is limited to situations where the fuel is consumed by non-flaming processes and can persist for days or even weeks and is constituted as a serious health hazard because releases several times more fine particles than flaming combustion (though at a slower rate) (5). The proportion of flaming and smoldering depends on fuel conditions, fire weather, and terrain slope (3).
3.3 Fuel characteristics
Biomass is described as primary live or dead plant material, while “fuel” refers to only that portion of biomass that normally burns under specified fire conditions (15). The amount and composition of fire emissions will depend on the properties of the fuel, such as fuel type, load and moisture. Fuel load is typically expressed as the mass of fuel or biomass per unit area on a dry weight basis (19). Fuel moisture determines what biomass is likely to burn. Large natural variability in fuel moisture causes large variability in the relative amount of biomass consumption by flaming and smoldering combustion (15). The duration of the smoldering phase can be extended with increasing fuel loads and increasing moisture content, thus increasing the amount of emitted aldehydes (19).
The amount of fuel load depends on the vegetation type, climate, soil type, time since last fire, and other disturbances (16). The most important types of biomass burning in the world are savannas and grasslands, tropical and boreal forest, domestic biofuel burning, charcoal production and combustion, and agricultural waste burning (5, 15). Boreal forests also contain large amounts of fuel, both above and below ground; while fuel loads in savannas are lower (21). Tropical forest ecosystems have the highest fuel loads, especially if the forest is grown on peat (22).
Fuel properties can markedly affect both the amount of smoldering combustion and the overall mixture of emissions. On savannas, for example, 90% of the vegetation may be consumed through flaming combustion. In contrast, in other vegetation types such as peat, rotten logs, or rotten wood residues, 90% would be consumed through smoldering combustion (16). It should be noted that the combustion of peat can consume over 17 metric tons/ha-cm, which translates into as much as 1.5 metric tons of CO/ha-cm of peat depth consumed by fire (depending on the density of the biomass) (23).
Changes in fuel size and moisture are often manifest in a change in the combustion efficiency.

Evidence Review: Wildfire smoke and public health risk 6
Combustion efficiency (CE), the fraction of fuel carbon emitted by the fire that is completely oxidized to CO2, depends strongly on the relative contribution of flaming and smoldering combustion. When CE surpasses ∼90%, a fire is typically in the flaming phase and combustion temperatures are high enough such that flames are clearly visible around the fuel. When CE is less than ∼85%, combustion is in the smoldering phase (19). The CE is highest for tropical savannas and temperate rangelands and lowest for tropical forests. The high CE of savannas and rangeland vegetation reflects the dominance of flaming combustion in the herbaceous fuels (15). General models of CE are developed based on the fact that more than 90% of carbon combusted in a fire is released as CO2 and CO, and less than 10% of carbon is released as hydrocarbons and PM (19).
3.4 Emission factors
Characterization of emission factors (EF) is useful to determine the impact wildfires have in terms of amount of toxic compounds released to the atmosphere. EFs are defined as the amount of aerosol particles that are emitted per kg of dry fuel mass burned (5). To estimate the impact of emissions from biomass burning, it requires the knowledge of either the total emission of a compound per unit area or the total emission of a compound per unit mass of the burnt material.
Emission factors (EF) are estimated using the carbon mass balance method developed by (24), which assumes that all of the carbon combusted is emitted into the measurable portions of a smoke plume in five forms: CO2, CO, CH4, non-methane hydrocarbons, and PM in smoke particles. Thus, the emission factor of a species is then calculated as:
Where [x] is the concentration of species x in the smoke, and the [CO2], [CO], [CH4], hydrocarbons and PM are the concentrations of each component in the smoke, respectively and Cfuel is the mass fraction of carbon in the fuel, which is generally assumed to be 50% (19).
The emission factors can be quite different between biomes and they vary during seasons due to the alterations in water content and weather conditions (25). However, this variability has not been considered for vegetation fire emission inventories (16). Savannas produce more CO2 than other types of vegetation, and boreal forests produce more CO, CH4 and PM2.5 than other types of vegetation. Tropical forests tend to produce more PM10 than other types of vegetation (Table 1, Appendix).
These species are important due to their direct and/or indirect impacts on climate or on human health. The greenhouse gases CO2, CO, methane (CH4), N2O, total non-methane hydrocarbons (TNMHC), NMOC, and NOx may be released (7, 26). Other components that introduce health hazards include PM, CO, CO2, NOx, ammonia, SO2, aldehydes, and VOCs (4). Based on health studies conducted in polluted regions, mainly urban cities, the World Health Organization (WHO) has established some standards levels for different air pollutants (Table 2, Appendix). Higher levels of these may result in deleterious effects for human health, depending on time of exposure.
3.5 Weather and climate conditions
Weather and climate conditions affect the behaviour of wildfires because they influence the size of the fires, the frequency, the exposure time, plume distribution and composition. Higher temperatures and other extreme weather conditions may increase the length of fire seasons and result in longer burning periods.
Evidence Review: Wildfire smoke and public health risk 7
Places that lack water due to drought contain drier biomass that is more easily burned, causing intense fires (3). Late in the fire season, drier fuels result in more complete combustion (e.g., savannas) (21). However, some arid places may also have limited fuel stored on the ground so it may be difficult for fires to spread. Places with high precipitation and high CO2 levels can accelerate biomass growth, producing higher fuel loads for future fire seasons (3).
Natural phenomena associated with sea surface temperature anomalies and extended droughts can also influence the frequency and intensity of wildfires. For instance, El Niño (ENSO) in the tropical, subtropical and some boreal regions, produces warming in the Pacific Ocean sea surface, causing dry conditions in the western Pacific and rainfall in the normally dry eastern Pacific (27). El Niño is associated with more droughts and intense fires, and it has been associated with greater risks of human mortality attributable to smoke from wildfires (10). The Indian Ocean Dipole (IOD) (Indonesia) or Indian Niño is also an irregular oscillation of sea-surface temperatures in which the western Indian Ocean becomes warmer and tends to cause droughts in adjacent land areas of Indonesia and Australia (28). In 1997 IOD triggered intense fires over Indonesia, causing a regional ozone increase (28). The North Atlantic Oscillation (NAO) during positive (high) phases, causes increased precipitation and temperatures over northern Europe and southeastern USA and dry anomalies in the Mediterranean region (27).
Weather patterns also influence the movement of smoke plumes and dispersion of pollutants in the atmosphere via wind currents, vertical mixing, and rainfall (29). Air pollution episodes can occur with atmospheric conditions that limit both vertical and horizontal dispersion (29). Also, during dry weather conditions, and for large injection heights, the aerosol particles can be transported by winds over thousands of kilometres before they are removed from the atmosphere by wet deposition (16).
Under the climate change scenario, warmer temperatures and precipitation changes are expected to be the main climate drivers for fires by altering the frequency and the intensity (3). Some analyses using regional climate models suggest that climate change caused by increasing greenhouse gases may contribute to a future increase in burned area as well as fire intensity and frequency (1). Projections of future atmospheric CO2 concentrations suggest that wildfire activity will increase, possibly doubling the burned area by the end of the 21st century in areas such as Canada (30) and Portugal (31).
Emissions to the atmosphere are also expected to increase. Modelling studies for Portugal, for example, indicate that future wildfire activity will increase the O3 concentrations to roughly 23 µg/m3 by 2100, as well as increases in PM10 concentrations over Portugal up to 20 µg/m3 (31). Another projection shows that temperature increases will increase the annual mean burned area in the western United States by 54% by the 2050s (2). According to Spracklen et al. (2), changes in the burned area are ecosystem dependent, with the forests of the Pacific Northwest and Rocky Mountains experiencing the greatest increases of 78% and 175% respectively. An increase in the burned area results in doubling of wildfire carbonaceous aerosol emissions by mid-century.
3.6 Plume distribution near populated areas
The plumes formed from the smoke of burned biomass contain high concentrations of aerosols, CO, and O3. The plumes can be transported over thousands of kilometers in the tropics (32) and in boreal forests, affecting the air quality in regions with large anthropogenic emissions that are thousands of kilometers away from the fires (33). Intact smoke plumes have been traced with satellite data, with distances exceeding 1600 km from wildfires (Figure 1) (34).

Evidence Review: Wildfire smoke and public health risk 8
Elevation and topography can also affect smoke accumulation and plume distribution. For example, when mountain slopes are warmed by the sun, air is heated and can move upslope bringing smoke and fire with it. When the terrain cools (e.g., at night) the air begins to descend, creating a different airflow that can alter the smoke dispersal pattern during the day (35). In valleys and small basins, temperature inversions are common, for example, the air near the ground is cooler than the air above, which prevents upward air movement and can favour smoke and pollutant accumulation for several weeks (36). These smoke accumulations can reduce roadway visibility and cause adverse health effects in near populated areas as a result of longer exposure.
Some examples of plumes reaching populated areas have been seen in Russia. In 2010 an unprecedented intensive heat wave provoked thousands of wildfires during summer, impacting severely the air quality in Moscow, where concentrations of CO and PM10 exceeded 10 mg/m3 and 700 μg/m3 respectively (37). The changes in air quality were caused by transport of smoke from intensive fires in the north of Ryazan (city situated at ~180 km south-east of Moscow) (37). Another example was reported in 2002 when a dramatic increase in wildfire activity in the province of Quebec, Canada, produced a PM episode that reached Baltimore city in Maryland (located more than 1500 km from the source). In this episode, PM2.5 concentrations reached 86 μg/m3 exceeding the 24-h national ambient air quality standard (38). Another study in Quebec found that concentrations of PM2.5, mercury (Hg), and carbon oxides increased after a wildfire, reducing the visibility in Quebec City, Montreal, and Ottawa, as well as other rural areas located more than 250 km away from the fire (39).
Fresh fire plumes show low O3 levels due to titration from emitted NOx. Ageing of plumes enables the build-up of secondary pollutants, ozone, and more oxygenated species such as secondary aerosols (sulfates, nitrates, and organics) (40). Aged smoke particles show enhanced cloud condensation activity due to coating by water soluble material; condensation of VOCs with multiple functional groups emitted during burning appears to be a major component of secondary organic aerosol (3).
The combined effects of urban pollution with wildfire smoke should also be considered because pollutant concentrations may change when wildfire smoke reaches urban areas. For example, in Mexico City, emissions from wildfires in the pine-savannas from the surrounding mountains near the city increased the concentrations of NOx and hydrogen cyanide twice as much than the normally observed concentrations from forest burning alone (41). The nitrogen enrichment in the fire emissions may be due to deposition of nitrogen-containing pollutants in the outflow from the urban area. This effect can possibly also be occurring in other parts of the world, when biomass burning coexists with large urban areas (e.g., the tropics, southeastern US, Los Angeles Basin) (41).
Effects of fire smoke can also be exacerbated in highly polluted cities. In 2004, extensive areas in Alaska (2.7 million hectares) and Canada (3.1 million hectares) were burned, resulting in a huge plume of smoke that eventually settled in Houston (42). Houston, a highly polluted city in the southern USA, is routinely affected by above-average ozone levels due to numerous petrochemical production plants. Nonetheless, ozone concentrations after the wildfire increased 50 to 100% due to the combined effects of urban pollution and wildfire smoke, resulting in the highest 8-hour maximum ozone levels ever recorded for a July day in a 5-year period that year (42).
Weather and climate conditions influence the movement of smoke plumes and dispersion of pollutants in the atmosphere. This affects the air quality not only in rural regions but also in regions with urban emissions that are thousands of kilometers away from the fires. These gaseous and particulate emissions from wildfires substantially modify the atmospheric chemical composition and degrade air quality.
Evidence Review: Wildfire smoke and public health risk 9
3.7 Tools available for monitoring and forecasting
One of the main challenges in smoke management is predicting the magnitude and location of smoke effects. Thus, new studies are developing a variety of tools in order to predict smoke effects after a wildfire. Models for predicting smoke effects of forest fires consist of four main components: (1) describe the emissions source, (2) determine plume rise through assessing meteorological, (3) track the actual movement of the smoke, and (4) identify the chemical transformations that may occur as smoke components react with each other (43, 44).
The main challenges to develop tools for forecasting wildfires are to predict plume distribution; some of the initial models have failed because they have mistakenly assume that smoke travels in a straight line under homogeneous conditions, and have failed to consider other important factors such as wind, topography, and metereological conditions, which vary in space and time and influence plume trajectory (43). The newest approaches are based on modeling frameworks that can be adapted to regional conditions and specific situations by enabling simulations of cumulative smoke impacts from fires in forest and agricultural areas (43). These approaches allow plume structure to embody a range of different behaviours characteristic of forests and the myriad plume structures to ultimately improve the predictive power of the model (43). Different models, their assumptions and limitations are described in Smoke Surveillance.
4. Main components of wildfire smoke and their health impacts
This section provides information about the components of wildfire smoke most relevant for human health, their characteristics and main components. Potential health effects of each component are outlined, but detailed information on health outcomes associated with wildfire smoke are discussed in detail in Health Effects of Smoke. The major smoke constituents are PM, trace gases, VOCs, Hg, CO, O3 and toxic pollutant mixes.
4.1 Particulate matter
Particulate matter (solid or liquid particles suspended in air) is directly emitted from fires, but can also be formed through secondary processes that may involve VOCs (15). Biomass burning usually produces fine particles less than 2.5 μm in aerodynamic diameter (PM2.5), with a peak in the size distribution between 0.15 and 0.4 μm (4). PM is composed of organic carbon and black carbon components and small contributions from inorganic species (4).
Particle size and particle composition are important factors to consider for health effects, because the size defines where the particles deposit in the lungs and the composition defines what type of toxic effect they can exert. According to Table 1 (Appendix), which is based on the emission factors from wildfires (15), boreal and temperate forests produced more PM2.5 compared to other vegetation types,
and tropical forests tend to produce more PM101
PM2.5 and the ultrafine fraction PM1 are formed in smoke and within the smoke plume as a result of chemical reactions and physical processes in the plume. The differences in the particle size depend on the type of fuels burned, combustion phase, and aging of the smoke (
. Detailed information on the health effects of PM exposure is provided in Health Effects of Smoke.
45). There is also an increase in particle size with increasing time and distance from the original source, although this depends on the
1 PM less than 10 µm in aerodynamic diameter.

Evidence Review: Wildfire smoke and public health risk 10
concentration of aerosols in the plume, therefore fine particle growth should reach a maximum at the highest concentrations (45). In spite of this, PM still remains small enough to remain in the air for extended periods and can be transported over large distances.
PM2.5 from wildfire smoke has been strongly associated with respiratory effects (exacerbations of obstructive lung disease, bronchitis and pneumonia) in numerous epidemiologic studies (9). Associations with other health outcomes (e.g., mortality, cardiovascular disease, lower birth weight) have been demonstrated, but with less consistency. Higher long term mortality risk (15%) has been associated with PM levels of 35 µg/m3 and 70 µg/m3 for PM2.5 and PM10 respectively. Thus, an average annual concentration of 10 µg/m3 has been chosen as the long term guideline, since it is below the mean for most likely effects (46). Guidelines on effect of short term exposure have also been established for the 24-hour mean in order to protect against peaks of pollution that can lead to increases in mortality (Table 2, Appendix).
4.2 Trace gases and volatile organic compounds
Trace gases and VOCs are by-products of incomplete combustion directly emitted to the atmosphere from biomass burning. Vapor pressure at atmospheric temperature is a major parameter to determine the extent of gas/particle partitioning. Compounds with high vapor pressures primarily exist as gases, while compounds with lower vapor pressures are found as particles (47). VOCs include non-methane hydrocarbons (NMHC) such as CH4, NH3, and oxygenated NMHC (e.g., NOx, alcohols, aldehydes and organic acids) (7). VOCs are released in different phases of combustion. In general, NOx, molecular N2 and SO2 are released during flaming combustion, whereas NH3, amines, and nitriles are associated with smoldering combustion (5).
Trace gases and VOCs have short atmospheric lifetimes (from day to months) and small direct impact on radiative forcing. VOCs can influence climate through their production of organic aerosols such as O3 (7). Due to the short lifetime of VOCs, understanding how VOCs from biomass burning impact the atmosphere is still developing (13). Similarly, potential health effects from VOCs are inferred from knowledge of some of their components.
Among the VOCs, one of the few classes established for regulatory purposes are polycyclic aromatic hydrocarbons (PAHs), which are usually present as both gases and particles (Table 2). VOCs and PAHs are disseminated from their sources over regional areas and can be transported over global distances by wind currents (47). VOCs and PAHs include hydrocarbons (e.g., methane, benzene), halocarbons (e.g., chloromethane), and oxygenates (e.g., formaldehyde, acetaldehyde). CH4 is a greenhouse gas and non-methane hydrocarbons (NMHCs) are precursors to ozone formation. These components are known carcinogens, irritants for skin, eye, nose and throat. Benzene is another component known as human carcinogen and there are some studies that suggest a link between benzene exposure and childhood cancer (48).
NOx is other important VOC that can have adverse effects on human health. For short term exposures, concentrations of NO2 >200 µg/m3 can constitute a toxic gas (Table 2, Appendix). For example, concentrations in excess of 500 µg/m3 have a direct effect on pulmonary function in asthmatics population (46). For long term exposures, epidemiological studies from polluted areas have shown an association between annual NO2 concentrations and bronchitis symptoms and reduced lung function growth in children (23). These associations, however, cannot be completely explained by NO2, and other components in the mixture such as PM and nitrous acid vapour may also contribute to adverse health effects.

Evidence Review: Wildfire smoke and public health risk 11
Similar to NO2, SO2 has also been associated with changes in pulmonary function and respiratory problems after periods of exposure as short as 10 minutes. SO2 levels in 24 hours have been associated with daily mortality rate in 12 Canadian cities, with average concentrations of only 5 µg/m3. Nonetheless, other studies based on hospital admissions in cities such as Hong Kong and London has not shown impacts on health at 24-hour concentrations of 5–40 µg/m3 (49). Moreover, exposure of SO2 depends on the conditions of local sources and meteorological conditions, thus it is difficult to establish a standard level of exposure where health effects cannot be expected, but current guidelines for long term exposures have been established by selecting a value of 20 µg/m3 (Table 2, Appendix) which is below current average values at which health impacts have been registered (46).
4.3 Mercury
Mercury can be a serious contaminant of ecosystems with subsequent consequences to human health. Vegetation accumulates Hg via atmospheric deposition, foliar accumulation of depositions, or uptake from roots when close to a natural or anthropogenic source of Hg (50). Hg concentration within plants varies and is highest in leaves, bark and roots.
There are three atmospheric Hg species that contribute to inorganic mercury accumulation in vegetation: gaseous elemental mercury (Hg°), reactive gaseous mercury (Hg (II)), and particle-bound mercury (Hg (p)) (51). The concentrations of (Hg (II)) and (Hg (p)) may be more substantially influenced by wildfires compared to Hg° (50). Hg emissions from wildfires also include re-suspension of industrial Hg emissions that were deposited on trees and the soil within the forest (50). Hg emitted from burning biomass reaches an elevated percentage (97–99%), which means that a complete transfer of Hg from vegetation to atmosphere is done during combustion (50). According to (52), wildfires produce an estimation of 200–1000 mg Hg per year globally.
Emissions of Hg are dominated by gaseous elemental Hg, although approximately 15% of Hg emitted from wildfires is in particulate form. Elemental Hg has a lifetime of about 1 year before redeposition, while particulate Hg lasts from days to weeks (53). Emissions of Hg from small and large fires in boreal forests ranged from 0.4 to 116.8 metric tons, with an average of 22.8 ± 7.5 metric tons per year (54). Fire emissions from boreal peatlands ranged from 1.5 to 7.0 mg Hg/m2. Including estimation from upland and peatland soils indicated that approximately 340 metric tons of Hg per year could be emitted across the circumboreal region (53).
Very little is known about the possible health effects of Hg released from wildfires. Current knowledge of health effects from Hg are derived from studies of populations leaving close to mining areas or power plants. Based on these studies, the recommended concentration for Hg in air is 1 μg/m3 per year (23). The inhalation of Hg vapor can produce harmful effects on the nervous, digestive and immune systems, lungs and kidneys, with increases risks in cardiovascular disease and severe neurological damage to humans (55).
4.4 Carbon monoxide
CO is an odourless, colourless and tasteless inorganic gas produced when incomplete combustion occurs. It is transported over great distances. Biomass burning is believed to be the most important source of CO in the tropics (40). Changes in oxidizing capacity relating to CO variability could alter the growth rates of many greenhouse gases. CO has a long life span in the troposphere, thus CO from biomass burning can be distributed over a wide area and can be used as a tracer of biomass burning plumes in the troposphere (56). CO is produced more abundantly from smoldering combustion of forest fuels. Maximum levels of CO are produced immediately following the cessation of flaming combustion.

Evidence Review: Wildfire smoke and public health risk 12
Based on the emission factors from wildfires (15). Table 1 (Appendix), boreal forest produced more CO than other types of vegetation.
CO is a gas that binds to hemoglobin with an affinity 250 times that of oxygen, thereby interfering with the systemic delivery of oxygen to tissues. In general, a level of 5% carboxyhemoglobin results from 3–4 hours exposure to CO concentraions of 35 ppm and may cause disorientation or fatigue in people (23). Given current ambient CO concentrations in the world, it is likely that, in most circumstances, this pollutant serves more as an indicator of combustion-related pollution than as a direct toxicant. In addition, most studies have shown that ground concentrations of CO in plumes are generally within existing standards (57). However, in some situations (e.g., insufficiently ventilated structures, areas close to fires), CO could attain concentrations sufficient to lead to physiologically meaningful effects (58).
Concentrations of CO related to wildfire smoke do not pose a significant hazard, except to some firefighters and to individuals with cardiovascular disease, who can experience chest pain and cardiac arrhythmias at lower levels of CO (15). At higher levels (those registered in major structural fires, Table 1, Appendix), exposure to CO can cause headache, dizziness, disorientation and visual impairment (23).
4.5 Ozone
O3 is formed in the troposphere, mainly by reactions that occur in polluted air in the presence of sunlight (29). Wildfire emissions create chemical reactions which lead to ozone formation. O3 is produced as a reaction from nitrogen dioxide and hydrocarbons through VOC–NOx photochemistry. This process occurs on time scales of hours to days, and O3 is then transported from local to intercontinental distances (4, 7). Ozone can also be formed through photochemical reactions when smoke emissions are trapped for several days in valleys or basins (36).
Because ozone formation increases with greater sunlight and higher temperatures, it reaches unhealthy levels primarily during the warm half of the year (29). In the tropical and subtropical regions during dry seasons, high ozone concentrations have been observed in smoke plumes approximately three times higher than standard conditions of a fire-free atmosphere (40). Recirculation over the Indonesian maritime continent allows smoke to accumulate and tropical tropospheric ozone to increase in periods without smoke (Keywood et al., 2013). Climate change predictions suggest causation for higher concentrations of ozone and larger relative increases in the near (29)
Concentrations of O3 that are high enough to be of concern are not expected close to fires. Nonetheless, long term exposure to ozone may impact human health. Time-series studies on effects of air pollution have revealed positive, although small, associations between daily mortality and ozone levels in North America and Europe (23). There is considerable variation in response to O3, but based on current evidence, health effects can appear at concentrations greater than 120 µg/m3 (Table 2, Appendix). Increases of O3 above the recommended levels can occur in places where concentrations are already high due to anthropogenic activities. In these areas, numerous health effects such as reductions in lung function, lung inflammation and fatigue can be found at the population level even among young and healthy individuals (23).
4.6 Toxic pollutant mixes
Pollutant mixes from wildfires can be originated by physical and chemical process that lead to transformation or removal of different compounds. These transformations can occur during transport of compounds, as the physical characteristics and concentration in the air can change the chemical composition of compounds. The primary controlling factor for pollutant mix formation is transformation
Evidence Review: Wildfire smoke and public health risk 13
or destruction of components by the hydroxyl radical (OH). For example, NMHCs such as C2–C4 alkenes and alkanes are typically lost over a few hours or few days respectively (46). Other pollutant mixes include the transformation of NMHC–VOCs through photochemical processing initiated by reaction with OH, which leads to oxidation of NMVOCs with the subsequent formation of secondary pollutants such as O3 and secondary organic aerosols (SOA) (7). The formation of SOA can be quite rapid: wildfire aerosol mass has been observed to increase by a factor of 1.5–2 over a period of a few days. This mixture is highly reactive as demonstrated by the relatively short atmospheric lifetimes of many of these compounds with respect to gas phase reaction or photolysis (3).
Biomass burning plumes can also be mixed with materials from other sources, thereby strengthening their impact on air quality. For instance, over and downwind of Africa, aged biomass burning aerosol plumes are often mixed with desert dust (3). In an ageing plume a rapid increase in light scattering and formation of peroxyacetylnitrate (PAN), hydrogen peroxide, formic acid, and peroxyacetic acid along with loss of NOx, HONO, C2H4, C3H6, and NH3. The highly reactive nature of wildfires emissions gives these fires a significant potential to influence tropospheric chemistry and degrade air quality (15). Some studies indicate that some SOA and aged particles have the potential to impact the heat balance of a specific region, because formation of cloud droplets increases on aerosol particles and aged particles, which reduces chances of precipitation and increases cloud coverage (40).
Although, the impacts of pollutant mixes on human health are not quite yet understood, a number of compounds produced by photochemical oxidation such as aldehydes and formaldehydes (HCHO) are of potential interest from a human health standpoint. Aldehydes are extremely irritating to the mucous membranes of the human body, formaldehyde are also potentially carcinogenic and in combination with other irritants may cause an increased risk of carcinogenesis (46). Other components within the pollutant mixes such as formic acid, and NMHCVOCs may have health effects, since they are asphyxiant, highly irritant and odourous and some are known as carcinogens. Nonetheless, the synergistic or additive effects of these components from the mixture of pollutants are still unknown (7).
5. Evidence gaps
• There is still considerable uncertainty in emission inventories of components such as VOCs, NMHC, and mercury, as well as in the potential health effects of these components derived from wildfire smoke. In addition, substantial uncertainty still remains in validating standard levels of some smoke components (e.g., NO2, SO2, VOCs) recommended by the WHO that inform public health decisions.
• Future research should focus on the effects of smoke exposure from wildfires in tropical regions. Most research has focused on temperate forests, but tropical forests have the highest fuel load and tend to produce more PM10 than other types of vegetation. Thus, by increasing the knowledge of wildfires in tropical regions, insights into the potential effects of PM10 exposure can also be obtained; since most research has focused on the effects of PM2.5.
• Great uncertainty persists in determining plume distribution, but satellite data and remote sensing tools for forecasting smoke conditions near populated areas are continually being developed and improved (see evidence review on Smoke Surveillance).
6. Summary and conclusions
In this review, the available literature related to health effects from wildfires smoke are summarized, main indicators and pollutants of wildfires smoke are listed and their main health effects identified. The common factors that influence smoke production and composition from wildfires are determined by the

Evidence Review: Wildfire smoke and public health risk 14
physical and chemical processes during the combustion and by fuel composition, fuel moisture and fuel load.
• Fires can be described based on fuel characteristics, fire intensity, fuel load, fuel type, fire length and size. To estimate the amount of toxic compounds release by wildfires, it is necessary to differentiate among vegetation types. Overall, tropical peatlands and tropical forests constitute the highest fuel loads of biomass burning worldwide.
• Wildfires are characterized by two stages of combustion: flaming and smoldering. Flaming occur in the earlier part of the fire, is a rapid process and most products released in this stage are carbon dioxide and water. Smoldering combustion is a slower process, which lasts from days to weeks, and releases more toxic compounds than the flaming phase. These phases vary across biomes, with savannas characterized mainly by flaming combustion and peatland forests typically consumed through smoldering combustion.
• Characterization of emission factors from biomass combustion is critical to determine impacts of wildfires. These emission factors vary depending on vegetation types, dry season length, moisture content in vegetation, and metereological conditions. For example, across biomes combustion in tropical forests produces more PM10 than other biomes, while combustion in savannas produces more carbon dioxide.
• Duration of smoke production from wildfires is affected by fuel type, load and fuel intensity. Smoke can travel over thousands of kilometers depending on plume distribution. Weather conditions such as temperature, wind speed, elevation and topography affect the velocity and distance that a plume from a wildfire can reach.
• PM is one of the main contaminants from wildfire fire smoke. PM is formed in smoke, and also within the smoke plume as a result of chemical reactions and physical processes, and it is mainly composed of organic carbon and black carbon. PM2.5 is the principle public health threat from short term exposure to wildland fires because particles can reach deeper parts of the human respiratory track where they may have a range of health effects due to their physical, chemical, toxicological and carcinogenic nature. Adverse health effects of PM2.5 include respiratory and cardiovascular disease and increased mortality.
• The main components of wildfire smoke are particulate matter, carbon monoxide, volatile organic compounds, mercury, ozone and pollutant mixtures. Trace gases include CO, O3 and NOx. CO is an inorganic gas produced when incomplete combustion occurs and it is transported over great distances in smoke plumes. Gaseous VOCs are gases with high vapor pressures, including hydrocarbons, halocarbons, and oxygenates.
• Hg can be a very dangerous contaminant that can increase the risk of cardiovascular disease and cause severe neurological damage, but evidence linking exposure to Hg from wildfires and human health is still lacking.
• Overall effects of wildland fires on human health range from headache, dizziness, fatigue to obstructive lung disease, bronchitis, pneumonia, cardiovascular disease, asthma, reduced lung function growth, and increases risk of mortality.
• The main points to be considered for public health response include main components present in smoke, time of exposure (from days to months), local factors influencing plume distribution (e.g., strong winds, topography).

Evidence Review: Wildfire smoke and public health risk 15
References
1. Amiro BD, Stocks BJ, Alexander ME, Flannigan MD, Wotton BM. Fire, climate change, carbon and fuel management in the Canadian boreal forest. International Journal of Wildland Fire. 2001;10(4):405.
2. Spracklen DV, Mickley LJ, Logan JA, Hudman RC, Yevich R, Flannigan MD, et al. Impacts of climate change from 2000 to 2050 on wildfire activity and carbonaceous aerosol concentrations in the western United States. Journal of Geophysical Research. 2009;114(D20):D20301.
3. Keywood M, Kanakidou M, Stohl A, Dentener F, Grassi G, Meyer CP, et al. Fire in the Air: Biomass Burning Impacts in a Changing Climate. Critical Reviews in Environmental Science and Technology. 2013 2013/01/01;43(1):40-83.
4. Naeher LP, Brauer M, Lipsett M, Zelikoff JT, Simpson CD, Koenig JQ, et al. Woodsmoke health effects: a review. Inhal Toxicol. 2007 Jan;19(1):67-106.
5. Andreae MO, Merlet P. Emission of trace gases and aerosols from biomass burning. Global Biogeochemical Cycles. 2001;15(4):955-66.
6. Hodzic A, Madronich S, Bohn B, Massie S, Menut L, Wiedinmyer C. Wildfire particulate matter in Europe during summer 2003: meso-scale modeling of smoke emissions, transport and radiative effects. Atmospheric Chemistry and Physics. 2007;7(15):4043-64.
7. Urbanski SP, Hao WM, Baker S. Chapter 4 Chemical Composition of Wildland Fire Emissions. In: Andrzej Bytnerowicz MJAARR, Christian A, editors. Developments in Environmental Science: Elsevier; 2008. p. 79-107.
8. Bowman DM, Johnston FH. Wildfire smoke, fire management, and human health. EcoHealth. 2005;2(1):76-80.
9. Henderson SB, Brauer M, MacNab YC, Kennedy SM. Three measures of forest fire smoke exposure and their associations with respiratory and cardiovascular health outcomes in a population-based cohort. Environmental health perspectives. 2011;119(9):1266.
10. Johnston FH, Henderson SB, Chen Y, Randerson JT, Marlier M, DeFries RS, et al. Estimated global mortality attributable to smoke from landscape fires. Environmental health perspectives. 2012 May;120(5):695.
11. Kochi I, Donovan GH, Champ PA, Loomis JB. The economic cost of adverse health effectsfrom wildfire-smoke exposure: a review. International Journal of Wildland Fire. 2010;19(7):803-17.
12. Cochrane MA. Fire science for rainforests. Nature. 2003 Feb 27;421(6926):913-9.
13. Yokelson RJ, Burling IR, Gilman JB, Warneke C, Stockwell CE, de Gouw J, et al. Coupling field and laboratory measurements to estimate the emission factors of identified and unidentified trace gases for prescribed fires. Atmospheric Chemistry and Physics. 2013;13(1):89-116.
14. Keeley JE, Aplet GH, Christensen NL, Conard SG, Johnson EA, Omi PN, et al. Ecological foundations for fire management in North American forest and shrubland ecosystems: DIANE Publishing; 2011.
15. Akagi SK, Yokelson RJ, Wiedinmyer C, Alvarado MJ, Reid JS, Karl T, et al. Emission factors for open and domestic biomass burning for use in atmospheric models. Atmospheric Chemistry and Physics. 2011;11(9):4039-72.

Evidence Review: Wildfire smoke and public health risk 16
16. Langmann B, Duncan B, Textor C, Trentmann J, van der Werf GR. Vegetation fire emissions and their impact on air pollution and climate. Atmospheric Environment. 2009 1//;43(1):107-16.
17. Smith T, Dalziel B, Routledge RG. A proposed method to rank the intensity of boreal forest fires in Ontario using post-fire high-resolution aerial photographs: Ontario Forest Research Institute; 2008.
18. Yokelson RJ, Susott R, Ward DE, Reardon J, Griffith DWT. Emissions from smoldering combustion of biomass measured by open-path Fourier transform infrared spectroscopy. Journal of Geophysical Research. 1997;102(D15):18865.
19. Koppmann R, von Czapiewski K, Reid JS. A review of biomass burning emissions, part I: gaseous emissions of carbon monoxide, methane, volatile organic compounds, and nitrogen containing compounds. Atmospheric Chemistry and Physics Discussions. 2005;5(5):10455-516.
20. Yokelson RJ, Griffith DWT, Ward DE. Open-path Fourier transform infrared studies of large-scale laboratory biomass fires. Journal of Geophysical Research. 1996;101(D15):21067.
21. van der Werf GR, Randerson JT, Giglio L, Collatz GJ, Kasibhatla PS, Arellano Jr A. Interannual variability in global biomass burning emissions from 1997 to 2004. Atmospheric Chemistry and Physics. 2006;6(11):3423-41.
22. Page SE, Siegert F, Rieley JO, Boehm HD, Jaya A, Limin S. The amount of carbon released from peat and forest fires in Indonesia during 1997. Nature. [Journal]. 2002 Nov 7;420(6911):61-5.
23. World Health Organization. WHO Air quality guidelines for particulate matter, ozone, nitrogen dioxide and sulfur dioxide: global update 2005: summary of risk assessment. World Health Organization; 2006.
24. Ward D, Sandberg D, Ottmar R, Anderson J, Hofer G, Fitzsimmons C. Measurements of smokes from two prescribed tires in the Pacific Northwest, Seventy-Fifth Annual Meeting of the Air Pollution Control Association. Available from DE Ward USD A Forest Service Intermountain Fire Science Laboratory, Missoula, MT. 1982;59807.
25. Korontzi S, Justice CO, Scholes RJ. Influence of timing and spatial extent of savanna fires in southern Africa on atmospheric emissions. Journal of Arid Environments. 2003 6//;54(2):395-404.
26. IPCC. Climate change 2007-the physical science basis: Working group I contribution to the fourth assessment report of the IPCC. Climate Change: Working Group I; 2007.
27. Stenseth NC, Ottersen G, Hurrell JW, Mysterud A, Lima M, Chan KS, et al. Review article. Studying climate effects on ecology through the use of climate indices: the North Atlantic Oscillation, El Nino Southern Oscillation and beyond. Proc Biol Sci. 2003 Oct 22;270(1529):2087-96.
28. Thompson AM, Witte JC, Hudson RD, Guo H, Herman JR, Fujiwara M. Tropical tropospheric ozone and biomass burning. Science. 2001 Mar 16;291(5511):2128-32.
29. Kinney PL. Climate change, air quality, and human health. Am J Prev Med. 2008 Nov;35(5):459-67.
30. Amiro BD, Cantin A, Flannigan MD, de Groot WJ. Future emissions from Canadian boreal forest fires. Canadian Journal of Forest Research. 2009 2009/02/01;39(2):383-95.
31. Carvalho A, Monteiro A, Flannigan M, Solman S, Miranda A, Borrego C. Forest fires in a changing climate and their impacts on air quality. Atmospheric Environment. 2011;45(31):5545-53.

Evidence Review: Wildfire smoke and public health risk 17
32. Watson CE, Fishman J, Reichle HG. The significance of biomass burning as a source of carbon monoxide and ozone in the southern hemisphere tropics: A satellite analysis. Journal of Geophysical Research. 1990;95(D10):16443.
33. Wotawa G, Trainer M. The influence of canadian forest fires on pollutant concentrations in the united states. Science. 2000 Apr 14;288(5464):324-8.
34. Scala JR, Hain C, MacKenzie Jr WM, Bachmeier S, editors. Meteorological Conditions Associated With The Rapid Transport Of Canadian Wildfire Products Into The Northeast During 5-8 July 2002. International Geoscience and Remote Sensing Symposium of the American Meteorological Society, Boston, MA Retrieved February; 2002.
35. Robock A. Enhancement of surface cooling due to forest fire smoke. Science(Washington). 1988;242(4880):911-3.
36. Achtemeier GL. Planned Burn-Piedmont. A local operational numerical meteorological model for tracking smoke on the ground at night: model development and sensitivity tests. International Journal of Wildland Fire. 2005;14(1):85-98.
37. Konovalov IB, Beekmann M, Kuznetsova IN, Yurova A, Zvyagintsev AM. Atmospheric impacts of the 2010 Russian wildfires: integrating modelling and measurements of an extreme air pollution episode in the Moscow region. Atmospheric Chemistry and Physics. 2011;11(19):10031-56.
38. Sapkota A, Symons JM, Kleissl J, Wang L, Parlange MB, Ondov J, et al. Impact of the 2002 Canadian forest fires on particulate matter air quality in Baltimore city. Environ Sci Technol. 2005 Jan 1;39(1):24-32.
39. Wang Y, Huang J, Zananski TJ, Hopke PK, Holsen TM. Impacts of the Canadian forest fires on atmospheric mercury and carbonaceous particles in Northern New York. Environ Sci Technol. 2010 Nov 15;44(22):8435-40.
40. Crutzen PJ, Andreae MO. Biomass burning in the tropics: impact on atmospheric chemistry and biogeochemical cycles. Science. 1990 Dec 21;250(4988):1669-78.
41. Yokelson RJ, Urbanski SP, Atlas EL, Toohey DW, Alvarado EC, Crounse JD, et al. Emissions from forest fires near Mexico City. Atmospheric Chemistry and Physics. 2007;7(21):5569-84.
42. Morris GA, Hersey S, Thompson AM, Pawson S, Nielsen JE, Colarco PR, et al. Alaskan and Canadian forest fires exacerbate ozone pollution over Houston, Texas, on 19 and 20 July 2004. Journal of Geophysical Research. 2006;111(D24):D24S03.
43. Goodrick SL, Achtemeier GL, Larkin NK, Liu Y, Strand TM. Modelling smoke transport from wildland fires: a review. International Journal of Wildland Fire. 2013;22(1):83-94.
44. Yao J, Brauer M, Henderson SB. Evaluation of a wildfire smoke forecasting system as a tool for public health protection. Environmental health perspectives. 2013;121(10):1142-7.
45. Eck TF, Holben BN, Reid JS, O'Neill NT, Schafer JS, Dubovik O, et al. High aerosol optical depth biomass burning events: A comparison of optical properties for different source regions. Geophysical Research Letters. 2003;30(20):2035.
46. World Health Organization. WHO Air quality guidelines for particulate matter, ozone, nitrogen dioxide and sulfur dioxide: global update 2005: summary of risk assessment. 1999.
47. Mauderly JL, Chow JC. Health effects of organic aerosols. Inhal Toxicol. 2008 Feb;20(3):257-88.

Evidence Review: Wildfire smoke and public health risk 18
48. Raaschou-Nielsen O, Hertel O, Thomsen BL, Olsen JH. Air Pollution from Traffic at the Residence of Children with Cancer. American Journal of Epidemiology. 2001 March 1, 2001;153(5):433-43.
49. Wong CM, Atkinson RW, Anderson HR, Hedley AJ, Ma S, Chau PY, et al. A tale of two cities: effects of air pollution on hospital admissions in Hong Kong and London compared. Environ Health Perspect. 2002 Jan;110(1):67-77.
50. Pirrone N, Mahaffey KR. Dynamics of Mercury Pollution on Regional and Global Scales: Atmospheric Processes and Human Exposures Around the World: Springer; 2005.
51. Schroeder WH, Munthe J. Atmospheric mercury—an overview. Atmospheric Environment. 1998;32(5):809-22.
52. Gustin M, Lindberg S. Terrestial Hg Fluxes: Is the Next Exchange Up, Down, or Neither? In: Pirrone N, Mahaffey K, editors. Dynamics of Mercury Pollution on Regional and Global Scales:: Springer US; 2005. p. 241-59.
53. Turetsky MR, Harden JW, Friedli HR, Flannigan M, Payne N, Crock J, et al. Wildfires threaten mercury stocks in northern soils. Geophysical Research Letters. 2006;33(16).
54. Friedli HR, Radke LF, Prescott R, Hobbs PV, Sinha P. Mercury emissions from the August 2001 wildfires in Washington State and an agricultural waste fire in Oregon and atmospheric mercury budget estimates. Global Biogeochemical Cycles. 2003 May 2;17(2):1039.
55. Diez S. Human health effects of methylmercury exposure. Rev Environ Contam Toxicol. 2009;198:111-32.
56. McMillan WW, McCourt ML, Revercomb HE, Knuteson RO, Christian TJ, Doddridge BG, et al. Tropospheric carbon monoxide measurements from the Scanning High-Resolution Interferometer Sounder on 7 September 2000 in southern Africa during SAFARI 2000. Journal of Geophysical Research: Atmospheres. 2003;108(D13):8492.
57. Ambient Air Quality Criteria A. Ontario's ambient air quality criteria. In: Ontario Sdb, editor.: Ministry of the Environment PIBS; 2012.
58. Brook RD, Franklin B, Cascio W, Hong Y, Howard G, Lipsett M, et al. Air pollution and cardiovascular disease: a statement for healthcare professionals from the Expert Panel on Population and Prevention Science of the American Heart Association. Circulation. 2004 Jun 1;109(21):2655-71.
59. Naeher LP, Brauer M, Lipsett M, Zelikoff JT, Simpson CD, Koenig JQ, et al. Woodsmoke health effects: a review. Inhalation toxicology. 2007;19(1):67-106.

Evidence Review: Wildfire smoke and public health risk 19
Appendix
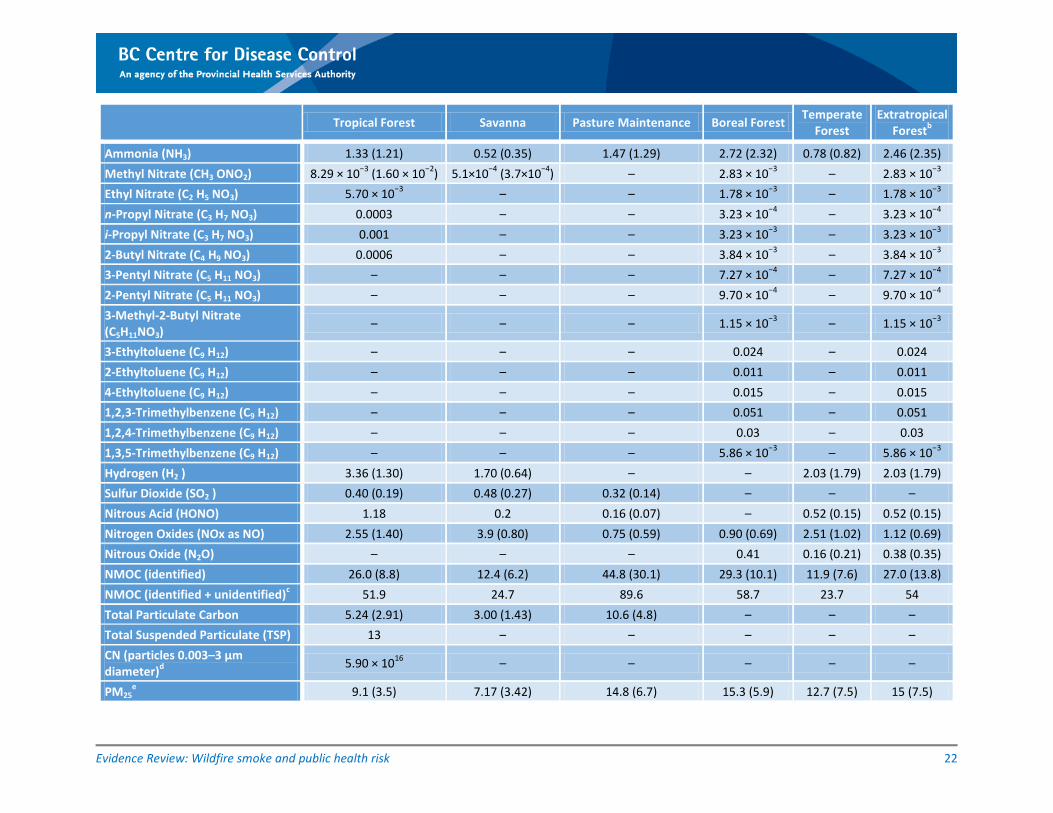
Table 1. Emission factors (EF) (g/kg) for species emitted from different types of biomass burninga. Adapted from Akagi et al. 2011 (15).
Tropical Forest Savanna Pasture Maintenance Boreal Forest
Temperate Forest
Extratropical Forestb
Carbon Dioxide (CO2) 1643 (58) 1686 (38) 1548 (142) 1489 (121) 1637 (71) 1509 (98)
Carbon Monoxide (CO) 93 (27) 63 (17) 135 (38) 127 (45) 89 (32) 122 (44)
Methane (CH4) 5.07 (1.98) 1.94 (0.85) 8.71 (4.97) 5.96 (3.14) 3.92 (2.39) 5.68 (3.24)
Acetylene (C2H2) 0.44 (0.35) 0.24 (0.10) 0.21 (0.29) 0.18 (0.10) 0.29 (0.10) 0.19 (0.090)
Ethylene (C2H4) 1.06 (0.37) 0.82 (0.35) 1.28 (0.71) 1.42 (0.43) 1.12 (0.35) 1.38 (0.42)
Ethane (C2H6) 0.71 (0.28) 0.66 (0.41) 0.95 (0.43) 1.79 (1.14) 1.12 (0.67) 1.70 (1.05)
Propadiene (C3H4) 0.016 (0.0066) 0.012 (0.005) 0.020 (0.009) – – –
Propylene (C3H6) 0.64 (0.43) 0.79 (0.56) 0.85 (0.66) 1.13 (0.60) 0.95 (0.54) 1.11 (0.61)
Propyne (C3H4) – – – 0.059 – 0.059
Propane (C3H8) 0.126 (0.060) 0.10 (0.067) 0.22 (0.10) 0.44 0.26 (0.11) 0.42 (0.18)
n-Butane (C4H10) 0.038 (0.023) 0.016 (0.013) 0.040 (0.018) 0.12 0.083 (0.10) 0.12 (0.14)
i-Butane (C4H10) 0.011 (0.009) 0.0043 (0.0027) 0.014 (0.0063) 0.042 – 0.042
1-Butene (C4H8) 0.079 (0.024) 0.043 (0.022) 0.17 (0.077) 0.16 – 0.16
i-Butene (C4H8) 0.11 (0.051) 0.024 (0.0051) 0.11 (0.05) 0.11 – 0.11
1,3-Butadiene (C4H6) 0.039 0.052 (0.028) – 0.14 – 0.14
trans-2-Butene (C4H8) 0.029 (0.013) 0.011 (0.0055) 0.050 (0.023) 0.04 – 0.04
cis-2-Butene (C4H8) 0.024 (0.010) 0.0084 (0.0043) 0.040 (0.018) 0.03 – 0.03
n-Pentane (C5H12) 8.03 × 10⁻³ (8.03 × 10⁻³) 0.0032 (0.0032) 0.0056 (0.0025) 0.085 – 0.085
i-Pentane (C5H12) 0.010 (0.010) 0.0022 (0.0032) 0.0074 (0.0033) 0.038 – 0.038
trans-2-Pentene (C5H10) 3.30 × 10⁻³ 0.0045 (0.0028) – – – –
cis-2-Pentene (C5H10) 1.90 × 10⁻³ 0.0025 (0.0018) – – – –
3-Methyl-1-Butene (C5H10) 3.80 × 10⁻³ 0.0051 (0.0034) – – – –
2-Methyl-2-Butene (C5H10) 4.00 × 10⁻³ 0.0048 (0.0035) – – – –
2-Methyl-1-Butene (C5H10) 4.40 × 10⁻³ 0.0059 (0.0037) – – – –
Isoprene (C5H8) 0.13 (0.056) 0.039 (0.027) 0.12 (0.055) 0.15 – 0.15
Cyclopentane (C5H10) – – – – – –

Evidence Review: Wildfire smoke and public health risk 20
Tropical Forest Savanna Pasture Maintenance Boreal Forest
Temperate Forest
Extratropical Forestb
2+3-Methylpentane (C6H14) – – – 0.036 – 0.036
2-Methyl-1-Pentene (C6H12) 2.80 × 10⁻³ 0.0035 (0.0021) – – – –
n-Hexane (C6H14) 0.01 0.013 (0.0074) – 0.055 – 0.055
Heptane (C7H16) 5.60 × 10⁻³ 0.0070 (0.0072) – 0.048 – 0.048
Benzene (C6H6) 0.39 (0.16) 0.20 (0.084) 0.70 (0.32) 1.11 – 1.11
Toluene (C6H5CH3) 0.26 (0.13) 0.080 (0.058) 0.34 (0.15) 0.48 – 0.48
Xylenes (C8H10) 0.11 (0.082) 0.014 (0.024) 0.11 (0.050) 0.18 – 0.18
Ethylbenzene (C8H10) 0.050 (0.036) 0.006 (0.010) 0.067 (0.030) 0.051 – 0.051
n-Propylbenzene (C9H12) – – – 0.018 – 0.018
α-Pinene (C10H16) – – – 1.64 – 1.64
β-Pinene (C10H16) – – – 1.45 – 1.45
Ethanol (CH3CH2OH) – – – 0.055 – 0.055
Methanol (CH3OH) 2.43 (0.80) 1.18 (0.41) 5.84 (3.42) 2.82 (1.62) 1.93 (1.38) 2.70 (1.75)
Phenol (C6H5OH) 0.45 (0.088) 0.52 (0.36) 1.68 (3.34) 2.96 0.33 (0.38) 2.60 (3.00)
Formaldehyde (HCHO) 1.73 (1.22) 0.73 (0.62) 1.90 (1.11) 1.86 (1.26) 2.27 (1.13) 1.92 (1.14)
Glycolaldehyde (C2H4O2) 2.84 0.81 (0.38) – 0.77 0.25 (0.45) 0.70 (1.26)
Acetaldehyde (CH3CHO) 1.55 (0.75) 0.57 (0.30) 2.40 (1.08) – – –
Acrolein (C3H4O) 0.65 (0.23) – – – – –
Furaldehydes 0.29 (0.0010) – – – – –
Propanal (C3H6O) 0.10 (0.026) – 0.16 (0.074) – – –
Methyl Propanal (C4H8O) 0.18 (0.075) – 0.33 (0.15) – – –
Hexanal (C6H12O) 0.01 (0.005) – 0.034 (0.015) – – –
Acetone (C3H6O) 0.63 (0.17) 0.16 (0.13) 1.05 (0.47) 0.75 – 0.75
Methyl Vinyl Ether (C3H6O) – 0.16 (0.045) – – – –
Methacrolein (C4H6O) 0.15 (0.045) – 0.40 (0.18) 0.087 – 0.087
Crotonaldehyde (C4H6O) 0.24 (0.068) – 0.60 (0.27) – – –
2,3-Butanedione (C4H6O2) 0.73 (0.22) – 1.58 (0.71) – – –
Methyl Vinyl Ketone (C4H6O) 0.39 (0.11) – 1.00 (0.45) 0.2 – 0.2

Evidence Review: Wildfire smoke and public health risk 21
Tropical Forest Savanna Pasture Maintenance Boreal Forest
Temperate Forest
Extratropical Forestb
Methyl Ethyl Ketone (C4H8O) 0.50 (0.21) – 0.94 (0.42) 0.22 – 0.22
2-Pentanone (C5H10O) 0.08 (0.024) – 0.17 (0.077) – – –
3-Pentanone (C5H10O) 0.03 (0.011) – 0.08 (0.034) – – –
Furan (C4H4O) 0.41 (0.10) 0.17 (0.058) 1.02 (0.43) 0.80 (0.50) 0.20 (0.21) 0.72 (0.62)
3-Methylfuran (C5H6O) 0.59 (0.20) – 1.41 (0.64) – – –
2-Methylfuran (C5H6O) 0.08 (0.028) – 0.20 (0.091) – – –
Other substituted furans 1.21 (0.016) – – – – –
C6 Carbonyls 0.24 (0.11) – 0.61 (0.28) – – –
Acetol (C3H6O2) 1.13 (0.12) 0.45 (0.24) 6.18 (5.60) – – –
Acetonitrile (CH3CN) 0.41 (0.10) 0.11 (0.058) 0.55 (0.25) 0.61 – 0.61
Propenenitrile (C3H3N) 0.04 (0.01) 0.051 (0.022) – – – –
Propanenitrile (C3H5N) 0.09 0.031 (0.014) – – – –
Pyrrole (C4 H5 N) 0.12 (0.038) – – – – –
Formic Acid (HCOOH) 0.79 (0.66) 0.21 (0.096) 0.2 (0.64) 0.57 (0.46) 0.35 (0.33) 0.54 (0.47)
Acetic Acid (CH3 COOH) 3.05 (0.90) 3.55 (1.47) 10.4 (6.8) 4.41 (2.66) 1.97 (1.66) 4.08 (2.99)
Hydrogen Cyanide (HCN) 0.42 (0.26) 0.41 (0.15) 0.46 (0.45) 1.52 (0.82) 0.73 (0.19) 1.41 (0.60)
Dimethyl Sulfide (C2 H6 S) 1.35 × 10⁻³ (1.71 × 10⁻³) 0.0013 (0.0011) – 4.65 × 10⁻³ – 4.65 × 10⁻³
Carbonyl Sulfide (OCS) 0.025 – – 0.46 (0.47) – 0.46 (0.47)
Chloromethane(CH3 Cl) 0.053 (0.038) 0.055 (0.036) 0.29 (0.13) 0.059 – 0.059
Dibromomethane (CH2 Br2) – – – 8.28 × 10⁻⁵ – 8.28 × 10⁻⁵
1,2-Dichloroethane (C2 H4 Cl2) – – – 1.29 × 10⁻³ – 1.29 × 10⁻³
Methyl Bromide (CH3 Br) 2.83 × 10⁻³ (2.38 × 10⁻³) 8.53 × 10⁻⁴
(8.62 × 10⁻⁴) 5.71 × 10⁻³ (2.57× 10⁻³)
3.64 × 10⁻³ – 3.64 × 10⁻³
Methyl Iodide (CH3 I) 2.50 × 10⁻³(3.45 × 10⁻³) 5.06 × 10⁻⁴
(3.88 × 10⁻⁴) 3.48×10⁻³
(1.56 × 10⁻³) 7.88 × 10⁻⁴ – 7.88 × 10⁻⁴
Trichloromethane (CHCl3) 2.94 × 10⁻⁴ (6.75× 10⁻³) 0.012 (0.020) 6.32× 10⁻⁴(2.84 × 10⁻⁴) – – –
Dichlorodifluoromethane (CCl2 F2) 2.80 × 10⁻³ – – – – –
Ethylchloride (C2 H5 Cl) – –
7.47 × 10⁻⁴ – 7.47 × 10⁻⁴
Evidence Review: Wildfire smoke and public health risk 22
Tropical Forest Savanna Pasture Maintenance Boreal Forest
Temperate Forest
Extratropical Forestb
Ammonia (NH3) 1.33 (1.21) 0.52 (0.35) 1.47 (1.29) 2.72 (2.32) 0.78 (0.82) 2.46 (2.35)
Methyl Nitrate (CH3 ONO2) 8.29 × 10⁻³ (1.60 × 10⁻²) 5.1×10⁻⁴ (3.7×10⁻⁴) – 2.83 × 10⁻³ – 2.83 × 10⁻³
Ethyl Nitrate (C2 H5 NO3) 5.70 × 10⁻³ – – 1.78 × 10⁻³ – 1.78 × 10⁻³
n-Propyl Nitrate (C3 H7 NO3) 0.0003 – – 3.23 × 10⁻⁴ – 3.23 × 10⁻⁴
i-Propyl Nitrate (C3 H7 NO3) 0.001 – – 3.23 × 10⁻³ – 3.23 × 10⁻³
2-Butyl Nitrate (C4 H9 NO3) 0.0006 – – 3.84 × 10⁻³ – 3.84 × 10⁻³
3-Pentyl Nitrate (C5 H11 NO3) – – – 7.27 × 10⁻⁴ – 7.27 × 10⁻⁴
2-Pentyl Nitrate (C5 H11 NO3) – – – 9.70 × 10⁻⁴ – 9.70 × 10⁻⁴
3-Methyl-2-Butyl Nitrate (C5H11NO3)
– – – 1.15 × 10⁻³ – 1.15 × 10⁻³
3-Ethyltoluene (C9 H12) – – – 0.024 – 0.024
2-Ethyltoluene (C9 H12) – – – 0.011 – 0.011
4-Ethyltoluene (C9 H12) – – – 0.015 – 0.015
1,2,3-Trimethylbenzene (C9 H12) – – – 0.051 – 0.051
1,2,4-Trimethylbenzene (C9 H12) – – – 0.03 – 0.03
1,3,5-Trimethylbenzene (C9 H12) – – – 5.86 × 10⁻³ – 5.86 × 10⁻³
Hydrogen (H2 ) 3.36 (1.30) 1.70 (0.64) – – 2.03 (1.79) 2.03 (1.79)
Sulfur Dioxide (SO2 ) 0.40 (0.19) 0.48 (0.27) 0.32 (0.14) – – –
Nitrous Acid (HONO) 1.18 0.2 0.16 (0.07) – 0.52 (0.15) 0.52 (0.15)
Nitrogen Oxides (NOx as NO) 2.55 (1.40) 3.9 (0.80) 0.75 (0.59) 0.90 (0.69) 2.51 (1.02) 1.12 (0.69)
Nitrous Oxide (N2O) – – – 0.41 0.16 (0.21) 0.38 (0.35)
NMOC (identified) 26.0 (8.8) 12.4 (6.2) 44.8 (30.1) 29.3 (10.1) 11.9 (7.6) 27.0 (13.8)
NMOC (identified + unidentified)c 51.9 24.7 89.6 58.7 23.7 54
Total Particulate Carbon 5.24 (2.91) 3.00 (1.43) 10.6 (4.8) – – –
Total Suspended Particulate (TSP) 13 – – – – –
CN (particles 0.003–3 µm diameter)d
5.90 × 10¹⁶ – – – – –
PM25e 9.1 (3.5) 7.17 (3.42) 14.8 (6.7) 15.3 (5.9) 12.7 (7.5) 15 (7.5)

Evidence Review: Wildfire smoke and public health risk 23
Tropical Forest Savanna Pasture Maintenance Boreal Forest
Temperate Forest
Extratropical Forestb
PM10 18.5 (4.1) – 28.9 (13.0) – – –
Black Carbon (BC) 0.52 (0.28) 0.37 (0.20) 0.91 (0.41) – – 0.56 (0.19)f
Organic Carbon (OC) 4.71 (2.73) 2.62 (1.24) 9.64 (4.34) – – 8.6–9.7f
Oxylate (C2 O4) 0.04 (0.034) 0.0055 (0.0055) 0.040 (0.018) – – –
Nitrate (NO3) 0.11 (0.050) 0.016 (0.013) 0.14 (0.063) – – –
Phosphate (PO4) 5.56 × 10⁻³ (8.99 × 10⁻³) 0.0045 (0.0060) 1.07 × 10⁻³ (4.80 × 10⁻⁴) – – –
Sulfate (SO4) 0.13 (0.088) 0.018 (0.009) 0.19 (0.086) – – –
Ammonium (NH4) 5.64 × 10⁻³ (1.72 × 10⁻²) 0.0035 (0.0035) 3.97 × 10⁻³ (1.79 × 10⁻³) – – –
Cl 0.15 (0.16) 0.23 (0.055) 0.24 (0.11) – – –
Ca 0.085 (0.089) 0.021 (0.018) 0.020 (0.009) – – –
Mg 0.040 (0.034) 0.016 (0.007) 0.030 (0.014) – – –
Na 6.37 × 10⁻³ (5.46 × 10⁻³) 0.0055 (0.0045) 0.030 (0.014) – – –
K 0.29 (0.28) 0.23 (0.053) 0.34 (0.15) – – –
a EF are shown with an estimate of the natural variation in parenthesis, when available.
b EF calculated from a weighted average of boreal and temperate forest EF based on biomass consumption estimates.
c Estimated.
d Number of particles per kg of fuel burned.
e PM1–PM5 categorized as PM2.5.

Evidence Review: Wildfire smoke and public health risk 24
Table 2. Major health-damaging pollutants from biomass combustion; recommended concentrations by the WHO and the Ambient Air Quality Criteria (AAQC) are indicated for each component.
Compound Examples Concentration
allowed by WHO and AAQCs
Mode of toxicity
Particulate matter (PM)
Respirable particles (PM2.5) 25 µg/m3 24 Hours Can cause or aggravate cardiovascular and lung diseases, heart attacks and
arrhythmias, affect the central nervous system, the reproductive system and
cause cancer. The outcome can be premature death.
Fine particles (PM>2.5)
Inorganic gases
Carbon monoxide (CO) 30 mg/m3 1 Hour Can lead to heart disease and damage to
the nervous system and cause headaches, dizziness and fatigue.
Ozone (O3) 120 µg/m3 8 Hours Can decrease lung function; aggravate
asthma and other lung diseases. Can lead to premature mortality.
Sulphur dioxide (SO2) 20 µg/m3 24 Hours
Aggravates asthma and can reduce lung function and inflame the respiratory tract. Can cause headache, general
discomfort and anxiety.
Nitrogen dioxide (NO2) 200 µg/m3 1 Hour
Can affect the liver, lung, spleen and blood. Can aggravate lung diseases
leading to respiratory symptoms and increased susceptibility to respiratory
infection.
Hydrocarbons
Unsaturated: e.g.,1,3-butadiene
10 µg/m3 24 hours Irritant, carcinogenic, mutagenic
Saturated: e.g., n-hexane 2,500 µg/m3 24
Hours Irritant, neurotoxicity
Polycyclic aromatic hydrocarbons (PAH)
0.00005 µg/m3 24 Hours
Carcinogenic. Other effects may be irritation of the eyes, nose, throat and
bronchial tubes.
Mono aromatics: e.g.,
benzene 2.3 µg/m3 24 hours
A human carcinogen, which can cause leukaemia and birth defects. Can affect the central nervous system and normal
blood production, and can harm the immune system.
styrene 400 µg/m3 24
Hours Carcinogenic, mutagenic

Evidence Review: Wildfire smoke and public health risk 25
Compound Examples Concentration
allowed by WHO and AAQCs
Mode of toxicity
Oxygenatated organics
Aldehydes: e.g., acrolein 0.4 µg/m3 24
Hours Irritant, carcinogenic, mutagenic
formaldehyde 65 µg/m3 24 Hour
Organic alcohols and acids: e.g., methanol
4,000 µg/m3 24 Hours
Irritant, teratogenic Acetic acid
2,500 µg/m3 24 Hours
Phenols: e.g., cresol 75 µg/m3 24 Hours Irritant, carcinogenic, mutagenic,
teratogenic
Quinones 15 µg/m3 24 Hours Irritant, allergenic, oxidative stress and
inflammation, redox active, possibly carcinogenic
Chlorinated organics
Methylene chloride 220 µg/m3 24
Hours Central nervous system depressant (methylene chloride), possible
carcinogens Methyl chloride 320 µg/m3 24
Hours
Free radicals Semiquinone type radicals
Redox active, cause oxidative stress and inflammatory response, possibly
carcinogenic
Source: Naeher et al., 2007 (59); the WHO air quality guidelines 2006 (23) , the Ambient Air Quality Criteria 2012 (57).

Evidence Review: Wildfire smoke and public health risk 26
Figure 1. Satellite images of wildfires smoke in British Columbia on August 14, 2013 (top) and an overview of plume distribution in Alberta in 2011 (bottom). Source: NASA MODIS satellite.