evident effects long term of breastfeeding
DESCRIPTION
Evident Effects Long Term of BreastfeedingTRANSCRIPT

i
Evidence on the long-termeffects of breastfeeding
SYSTEMATIC REVIEWS AND META-ANALYSES
Bernardo L. Horta, MD, PhD
Universidade Federal de Pelotas, Pelotas, Brazil
Rajiv Bahl, MD, PhD
Department of Child and Adolescent Health and Development,World Health Organization, Geneva, Switzerland
José C. Martines, MD, PhD
Department of Child and Adolescent Health and Development,World Health Organization, Geneva, Switzerland
Cesar G. Victora, MD, PhD
Universidade Federal de Pelotas, Pelotas, Brazil

ii EVIDENCE ON THE LONG-TERM EFFECTS OF BREASTFEEDING: SYSTEMATIC REVIEWS AND META-ANALYSES
WHO Library Cataloguing-in-Publication Data
Evidence on the long-term effects of breastfeeding : systematic review and meta-analyses /
Bernardo L. Horta ... [et al.].
1.Breast feeding. 2.Blood pressure. 3.Diabetes mellitus. 4.Cholesterol. 5.Obesity. I.Horta,
Bernardo L. II.World Health Organization.
ISBN 978 92 4 159523 0 (NLM classification: WS 125)
© World Health Organization 2007
All rights reserved. Publications of the World Health Organization can be obtained from WHO
Press, World Health Organization, 20 Avenue Appia, 1211 Geneva 27, Switzerland (tel.:
+41 22 791 3264; fax: +41 22 791 4857; e-mail: [email protected]). Requests for
permission to reproduce or translate WHO publications – whether for sale or for noncommercial
distribution – should be addressed to WHO Press, at the above address (fax: +41 22 791
4806; e-mail: [email protected]).
The designations employed and the presentation of the material in this publication do not
imply the expression of any opinion whatsoever on the part of the World Health Organization
concerning the legal status of any country, territory, city or area or of its authorities, or concerning
the delimitation of its frontiers or boundaries. Dotted lines on maps represent approximate
border lines for which there may not yet be full agreement.
The mention of specific companies or of certain manufacturers’ products does not imply that
they are endorsed or recommended by the World Health Organization in preference to others
of a similar nature that are not mentioned. Errors and omissions excepted, the names of
proprietary products are distinguished by initial capital letters.
All reasonable precautions have been taken by the World Health Organization to verify the
information contained in this publication. However, the published material is being distributed
without warranty of any kind, either expressed or implied. The responsibility for the
interpretation and use of the material lies with the reader. In no event shall the World Health
Organization be liable for damages arising from its use.
The named authors alone are responsible for the views expressed in this publication.
iii
Contents
Executive summary 1
I. Introduction 3
II. General methodological issues in studies of the long-term effects of breastfeeding 4
Study design 4
Factors affecting the internal validity of individual studies 4
Main sources of heterogeneity among studies 6
III. Search methods 8
Selection criteria for studies 8
Types of outcome measures 8
Search strategy 8
IV. Review methods 9
Assessment of study quality 9
Data abstraction 9
Data analysis 9
V. Results and discussion 11
Review 1 – Breastfeeding and blood pressure in later life 11
Review 2 – Breastfeeding and blood cholesterol in later life 20
Review 3 – Breastfeeding and the risk of overweight and obesity in later life 25
Review 4 – Breastfeeding and the risk of type-2 diabetes 34
Review 5 – Breastfeeding and school achievement/intelligence levels 36
VI. Conclusions 40
References 42

iv EVIDENCE ON THE LONG-TERM EFFECTS OF BREASTFEEDING: SYSTEMATIC REVIEWS AND META-ANALYSES

1
Background: Breastfeeding presents clear short-term benefits for child health, mainly protection
against morbidity and mortality from infectious diseases. On the other hand, there is some
controversy on the long-term consequences of breastfeeding. Whereas some studies reported that
breastfed subjects present a higher level of school achievement and performance in intelligence
tests, as well as lower blood pressure, lower total cholesterol and a lower prevalence of overweight
and obesity, others have failed to detect such associations.
Objectives: The primary objective of this series of systematic reviews was to assess the effects of
breastfeeding on blood pressure, diabetes and related indicators, serum cholesterol, overweight and
obesity, and intellectual performance.
Search strategy: Two independent literature searches were conducted at the World Health
Organization in Geneva, Switzerland, and at the University of Pelotas in Brazil, comprising the
MEDLINE (1966 to March 2006) and Scientific Citation Index databases.
Selection criteria: We selected observational and randomized studies, published in English, French,
Portuguese and Spanish, assessing the effects of breastfeeding on blood pressure, obesity/overweight,
total cholesterol, type-2 diabetes, and intellectual performance. Studies that restricted the measurement
of outcomes to infancy were excluded from the meta-analyses. The type of comparison group used
(e.g. never breastfed or breastfed for less than x months) did not constitute a selection criterion.
Data extraction and analysis: Two reviewers independently evaluated study quality, using a
standardized protocol, and disagreement was resolved by consensus rating. Fixed and random-effects
models were used to pool the effect estimates, and a random-effects regression was used to assess
several potential sources of heterogeneity.
Effect on blood pressure: We included 30 and 25 estimates for systolic and diastolic blood pressure,
respectively. In a random-effects model, systolic (mean difference: -1.21 mmHg; 95% confidence
interval (CI): -1.72 to -0.70) and diastolic blood pressures (mean difference: -0.49 mm Hg; 95% CI:
-0.87 to -0.11) were lower among breastfed subjects. Publication bias was evident, with smaller
studies reporting a greater protective effect of breastfeeding. However, even among studies with
>1000 participants a statistically significant effect of breastfeeding was observed (mean difference
in systolic blood pressure: -0.59 mmHg; 95% CI: -1.00 to -0.19). Adjustment for confounding was
also a source of heterogeneity between study results, but even among those studies controlling for
several socioeconomic and demographic variables, systolic (mean difference: -1.19; 95% CI: -1.70 to
-0.69) and diastolic (mean difference: -0.61; 95% CI: -1.12 to -0.10) blood pressures were lower
among breastfed subjects. Publication bias and residual confounding may be responsible for part
(but not all) of the observed effect of breastfeeding on blood pressure.
Effect on serum cholesterol: Breastfed subjects presented lower mean total cholesterol in adulthood
(mean difference: -0.18; 95% CI: -0.30 to -0.06 mmol/L), whereas for children and adolescents the
association was not statistically significant. Age at assessment of cholesterol explained about 60% of
the heterogeneity between studies, whereas study size, control for confounding, year of birth and
Executive summary
2 EVIDENCE ON THE LONG-TERM EFFECTS OF BREASTFEEDING: SYSTEMATIC REVIEWS AND META-ANALYSES
categorization of breastfeeding duration did not play a significant role. The evidence suggests that
breastfeeding is related to lower cholesterol levels and this association is not due to publication bias
or residual confounding.
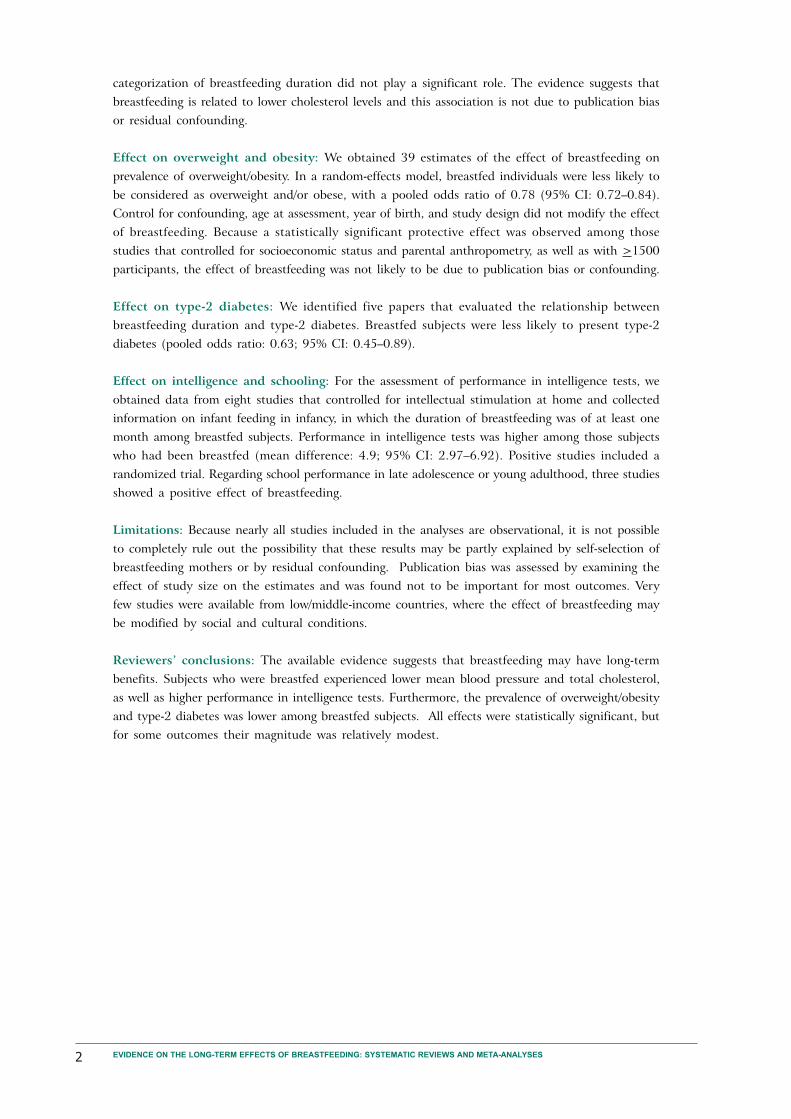
Effect on overweight and obesity: We obtained 39 estimates of the effect of breastfeeding on
prevalence of overweight/obesity. In a random-effects model, breastfed individuals were less likely to
be considered as overweight and/or obese, with a pooled odds ratio of 0.78 (95% CI: 0.72–0.84).
Control for confounding, age at assessment, year of birth, and study design did not modify the effect
of breastfeeding. Because a statistically significant protective effect was observed among those
studies that controlled for socioeconomic status and parental anthropometry, as well as with >1500
participants, the effect of breastfeeding was not likely to be due to publication bias or confounding.
Effect on type-2 diabetes: We identified five papers that evaluated the relationship between
breastfeeding duration and type-2 diabetes. Breastfed subjects were less likely to present type-2
diabetes (pooled odds ratio: 0.63; 95% CI: 0.45–0.89).
Effect on intelligence and schooling: For the assessment of performance in intelligence tests, we
obtained data from eight studies that controlled for intellectual stimulation at home and collected
information on infant feeding in infancy, in which the duration of breastfeeding was of at least one
month among breastfed subjects. Performance in intelligence tests was higher among those subjects
who had been breastfed (mean difference: 4.9; 95% CI: 2.97–6.92). Positive studies included a
randomized trial. Regarding school performance in late adolescence or young adulthood, three studies
showed a positive effect of breastfeeding.
Limitations: Because nearly all studies included in the analyses are observational, it is not possible
to completely rule out the possibility that these results may be partly explained by self-selection of
breastfeeding mothers or by residual confounding. Publication bias was assessed by examining the
effect of study size on the estimates and was found not to be important for most outcomes. Very
few studies were available from low/middle-income countries, where the effect of breastfeeding may
be modified by social and cultural conditions.
Reviewers’ conclusions: The available evidence suggests that breastfeeding may have long-term
benefits. Subjects who were breastfed experienced lower mean blood pressure and total cholesterol,
as well as higher performance in intelligence tests. Furthermore, the prevalence of overweight/obesity
and type-2 diabetes was lower among breastfed subjects. All effects were statistically significant, but
for some outcomes their magnitude was relatively modest.

3
Breastfeeding brings clear short-term benefits
for child health by reducing mortality and mor-
bidity from infectious diseases. A collaborative
reanalysis of studies conducted in middle/low-
income countries reported a reduced risk of
mortality from infectious diseases among
breastfed infants, up to the second birthday (1).
Kramer et al (2) reviewed the evidence on the
effects on child health and growth of exclusive
breastfeeding for 6 months. Infants who were
exclusively breastfed for 6 months presented
lower morbidity from gastrointestinal and al-
lergic diseases, while showing similar growth
rates to non-breastfed children.
Based on such evidence, WHO (3) and
UNICEF (4) now recommend that every infant
should be exclusively breastfed for the first six
months of life, with continued breastfeeding for
up to two years or longer. In this review we ad-
dress the long-term consequences of breastfeeding
on adult health and intellectual development.
Current interest in the long-term conse-
quences of early life exposures has been fuelled
by the original finding of Barker et al (5) that
size at birth and in infancy was related to the
development of adult diseases – including dia-
betes, hypertension and cardiovascular condi-
tions. These findings led to the fetal origin hy-
pothesis, which postulates that adverse intrau-
terine conditions would be responsible for fetal
malnutrition and low birthweight, a process that
would also increase the susceptibility to chronic
diseases in adulthood. Indeed, epidemiological
studies in several countries have reported in-
creased risks of chronic diseases (6-8) among
adults who were small at birth.
Because many studies on the long-term con-
sequences of intrauterine growth may be affected
by confounding variables – particularly socioeco-
nomic status – and by inappropriate statistical
analyses, some authors challenge whether or not
these associations are causal (9). On the other
hand, Lucas et al (10) pointed out that meth-
odological flaws in studies of intrauterine growth
may have deflected attention from important post-
natal exposures – such as infant growth and feed-
ing patterns – that could also be related to the
development of chronic diseases.
The notion that nutrition during early phases
of human development can alter organ function,
and thereby predispose – or programme – indi-
viduals to a later onset of adult disease, is an
area of considerable interest to researchers and
of great concern to public health. This idea origi-
nates from the more general concept in devel-
opmental biology which was defined by Lucas
as “programming” (11). This is defined as the
process whereby a stimulus or insult applied at
a critical or sensitive period of development re-
sults in a long-term or permanent effect on the
structure or function of the organism. This hy-
pothesis is currently described as the “develop-
mental origins of health and disease” (12).
Over 400 scientific publications are avail-
able on the association between breastfeeding
and health outcomes beyond infancy. Some re-
searchers claim that the benefits of breastfeeding
include increased school achievement or per-
formance in intelligence tests, reduced mean
blood pressure, lower total cholesterol, and a
lower prevalence of overweight and obesity. On
the other hand, other studies have failed to de-
tect such associations. The evidence on long-
term effects of breastfeeding may be important
for further promotion of this healthy practice
throughout the world.
The Department of Child and Adolescent
Health and Development in the World Health
Organization commissioned the present system-
atic review of the available evidence on long-
term consequences of breastfeeding. The follow-
ing long-term outcomes of public health impor-
tance were examined: blood pressure, diabetes
and related indicators, serum cholesterol, over-
weight and obesity, and intellectual performance.
These outcomes are of great interest to research-
ers, as evidenced by the number of publications
identified. This report describes the methods,
results and conclusions of this review.
I. Introduction

4 EVIDENCE ON THE LONG-TERM EFFECTS OF BREASTFEEDING: SYSTEMATIC REVIEWS AND META-ANALYSES
II. General methodological issues in studiesof the long-term effects of breastfeeding
Study design
The strength of scientific inference depends on
the internal validity of the study. Randomized
controlled trials, if properly designed and con-
ducted, are considered as the gold standard of
design validity, being less susceptible than other
designs to selection and information bias, as well
as to confounding (13). Furthermore, there are
clearly defined standards for conducting and
reporting on randomized clinical trials, all in-
tended to increase the validity of their results
and interpretation (14).
As mentioned previously, breastfeeding has
clear short-term benefits – i.e. it reduces mor-
bidity and mortality from infectious diseases (1)
– and it is now unethical to randomly allocate
infants to breastmilk or formula. However, about
20 years ago the evidence supporting breastfeed-
ing was not so clear-cut and randomized trials
could be carried out. In a British study from
1982, pre-term infants were randomly assigned
to formula or banked breastmilk; recent follow-
up of these subjects has provided an opportu-
nity to assess whether breastfeeding can pro-
gramme the later occurrence of risk factors for
cardiovascular diseases (15).
Most recently, in the Promotion of
Breastfeeding Intervention Trial (16) in Belarus,
maternal hospitals and their corresponding poly-
clinics were randomly assigned to implement or
not to implement the Baby-Friendly Hospital
Initiative. Duration and exclusivity of
breastfeeding were higher in the intervention
group (16). Because breastfeeding promotion
was randomized, rather than breastfeeding per
se, the trial was ethically sound. Follow-up of
these children will provide an excellent oppor-
tunity for studying the long-term effects of
breastfeeding. It should be noted, however, that
the Belarus study has relatively low statistical
power because compliance with breastfeeding
promotion was far from perfect.
Search for evidence on the long-term conse-
quences of breastfeeding should not be restricted
to randomized trials, because of their small
number. It must involve tracking down the best
available studies with rigorous design; prospec-
tive birth cohort studies should be considered
as the next best design in terms of strength of
evidence. It has been shown that the results of
meta-analysis of well-designed observational
studies, with either cohort or case-control de-
sign, can be remarkably similar to that of
randomized controlled trials on the same topic
(17). Nevertheless, birth cohort studies are sus-
ceptible to self-selection and confounding, is-
sues that will be discussed below.
In the next section, the main methodologi-
cal issues affecting these studies will be de-
scribed, as well as the strategies used to mini-
mize the impact of these limitations on the find-
ings of the present review.
Factors affecting the internalvalidity of individual studies
In the context of studies on long-term conse-
quences of breastfeeding, the following issues
should be considered.
Losses to follow-upA major source of bias in cohort studies as well
as randomized controlled trials with long-term
outcomes relates to the need for follow-up of
individuals for a period of time after exposure
in order to assess the occurrence of the out-
comes of interest. If a large proportion of sub-
jects are lost during follow-up, the study’s valid-
ity is reduced. Baseline data, such as breastfeed-
ing status, should be examined to determine
whether there are systematic differences be-
tween subjects who were followed up and those
who were not; if the losses are similar accord-
ing to the baseline characteristics, selection bias
is unlikely (18).

5
MisclassificationWhen the methods used for obtaining informa-
tion on either infant feeding or the outcomes
are inaccurate, misclassification may occur. This
may take two forms: differential and non-dif-
ferential misclassification.
Misclassification of breastfeeding duration
is more likely in retrospective than in prospec-
tive designs. Huttly et al (19), in a prospective
study, compared the actual breastfeeding dura-
tion with the duration reported retrospectively
by the mothers. They observed a systematic bias
towards reporting longer durations of
breastfeeding for wealthier and more educated
mothers, while those from low socioeconomic
status families did not tend to err more in one
direction than in the other. Because high socio-
economic status is related to a lower prevalence
of cardiovascular diseases, such differential
misclassification would exaggerate the long-term
benefits of breastfeeding.
On the other hand, in nondifferential
misclassification, measurement error is inde-
pendent of exposure or outcome status. This
leads to a dilution of the actual effect, because
some breastfed subjects are classified as non-
breastfed and vice-versa. Consequently, one is
less likely to detect an association, even if one
really exists.
Confounding by socioeconomicstatusSocioeconomic status is one of the most im-
portant confounders in studies on the long-term
effects of breastfeeding. In most societies,
breastfeeding rates differ among social groups
(20). The direction of confounding by socio-
economic status may vary between high-income
and low/middle-income populations. In high-in-
come countries, breastfeeding mothers tend to
be of higher educational and socioeconomic sta-
tus (21); other things being equal, their offspring
will have a lower prevalence of cardiovascular
risk factors and higher educational attainment
because they belong to the upper social classes.
Consequently, confounding by socioeconomic
status may overestimate the beneficial effects
of breastfeeding.
On the other hand, in low/middle-income set-
tings breastfeeding is often more common
among the poor (22). Thus, confounding by so-
cioeconomic status may underestimate the ben-
eficial effects of breastfeeding – for example, on
educational attainment – because breastfed sub-
jects will tend to be poorer. Depending on the
association between cardiovascular risk factors
and wealth in these societies, confounding can
act in either direction. For example, if high cho-
lesterol levels are more frequent among the rich,
the protective effect of breastfeeding will be
overestimated.
Even if confounding factors are controlled
through multivariable analyses, there is a possi-
bility of residual confounding. Inaccurate meas-
urement of confounders, as well as incorrect
specification of statistical models, may preclude
full adjustment for confounding and lead to es-
timates of the impact of breastfeeding that are
biased. For example, if information on family
income is not precise, control for this imper-
fect variable will not fully account for the con-
founding effect of true income.
As discussed above, the direction of residual
confounding may vary between high-income and
less developed settings. These differences will
be explored when analysing the results of this
review for each outcome.
Self-selectionEven within the same social group, mothers who
breastfeed are likely to be more health-conscious
than those who do not breastfeed. This may also
lead them to promote other healthy habits
among their children, including prevention of
overweight, promotion of physical exercise and
intellectual stimulation. This may be particu-
larly true in high-income populations. Because
these maternal attributes are difficult to meas-
ure, it is not possible to include them in the
analyses as confounding factors. Nevertheless,
this possibility should be taken into account
when interpreting the study’s results.
Adjustment for potential mediatingfactorsSeveral studies on the long-term consequences
of breastfeeding have adjusted their estimates
for variables that may represent mediating fac-
tors, or links, in the causal chain leading from
breastmilk to the outcomes. Adjustment for
GENERAL METHODOLOGICAL ISSUES IN STUDIES OF THE LONG-TERM EFFECTS OF BREASTFEEDING
6 EVIDENCE ON THE LONG-TERM EFFECTS OF BREASTFEEDING: SYSTEMATIC REVIEWS AND META-ANALYSES
mediating factors will tend to underestimate the
overall effect of breastfeeding, e.g. adjusting for
weight at the time of blood pressure measure-
ment when evaluating the association between
breastfeeding and blood pressure in later life.
The “adjusted” estimate will reflect the residual
effect of breastfeeding which is not mediated
by current weight (23).
Main sources of heterogeneityamong studies
Current epidemiological practice places limited
value on the findings of a single study. Evidence is
built by pooling the results from several studies,
if possible from different populations, either
through systematic reviews or meta-analyses.
A major concern regarding systematic re-
views and meta-analyses is the extent to which
the results of different studies can be pooled.
Heterogeneity of studies is unavoidable, and may
even be positive as it enhances generalizability.
The question is not whether heterogeneity is
present, but if it seriously undermines the con-
clusions being drawn. Rigorous meta-analyses
should incorporate a detailed investigation of
potential sources of heterogeneity (24). In the
present meta-analyses, the following possible
sources of heterogeneity were considered for all
reviews.
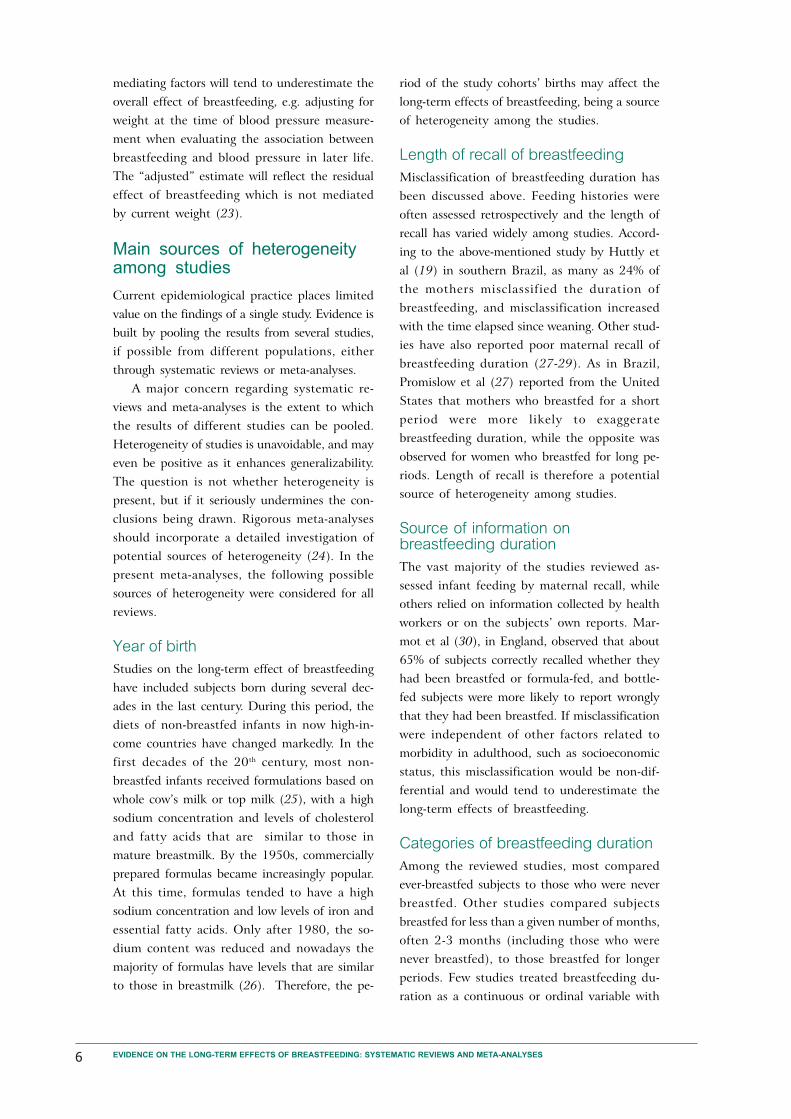
Year of birthStudies on the long-term effect of breastfeeding
have included subjects born during several dec-
ades in the last century. During this period, the
diets of non-breastfed infants in now high-in-
come countries have changed markedly. In the
first decades of the 20th century, most non-
breastfed infants received formulations based on
whole cow’s milk or top milk (25), with a high
sodium concentration and levels of cholesterol
and fatty acids that are similar to those in
mature breastmilk. By the 1950s, commercially
prepared formulas became increasingly popular.
At this time, formulas tended to have a high
sodium concentration and low levels of iron and
essential fatty acids. Only after 1980, the so-
dium content was reduced and nowadays the
majority of formulas have levels that are similar
to those in breastmilk (26). Therefore, the pe-
riod of the study cohorts’ births may affect the
long-term effects of breastfeeding, being a source
of heterogeneity among the studies.
Length of recall of breastfeedingMisclassification of breastfeeding duration has
been discussed above. Feeding histories were
often assessed retrospectively and the length of
recall has varied widely among studies. Accord-
ing to the above-mentioned study by Huttly et
al (19) in southern Brazil, as many as 24% of
the mothers misclassified the duration of
breastfeeding, and misclassification increased
with the time elapsed since weaning. Other stud-
ies have also reported poor maternal recall of
breastfeeding duration (27-29). As in Brazil,
Promislow et al (27) reported from the United
States that mothers who breastfed for a short
period were more likely to exaggerate
breastfeeding duration, while the opposite was
observed for women who breastfed for long pe-
riods. Length of recall is therefore a potential
source of heterogeneity among studies.
Source of information onbreastfeeding durationThe vast majority of the studies reviewed as-
sessed infant feeding by maternal recall, while
others relied on information collected by health
workers or on the subjects’ own reports. Mar-
mot et al (30), in England, observed that about
65% of subjects correctly recalled whether they
had been breastfed or formula-fed, and bottle-
fed subjects were more likely to report wrongly
that they had been breastfed. If misclassification
were independent of other factors related to
morbidity in adulthood, such as socioeconomic
status, this misclassification would be non-dif-
ferential and would tend to underestimate the
long-term effects of breastfeeding.
Categories of breastfeeding durationAmong the reviewed studies, most compared
ever-breastfed subjects to those who were never
breastfed. Other studies compared subjects
breastfed for less than a given number of months,
often 2-3 months (including those who were
never breastfed), to those breastfed for longer
periods. Few studies treated breastfeeding du-
ration as a continuous or ordinal variable with

7
several categories, thus allowing dose-response
analyses. Furthermore, breastfeeding patterns
(exclusive, predominant, or partial) have rarely
been assessed.
Studies comparing ever versus never breast-
fed subjects may be subject to misclassification.
The study by Huttly et al (19) showed that
mothers who had actually breastfed for up to 4
weeks often reported, at a later time, that they
never breastfed.
The comparison of ever versus never
breastfed makes sense if the early weeks of life
are regarded as a critical period for the pro-
gramming effect of breastfeeding on adult dis-
eases (31). On the other hand, if there is no
critical window and breastfeeding has a cumu-
lative effect, comparisons of ever versus never
breastfed infants will lead to substantial under-
estimation of the effect of breastfeeding.
Study settingNearly all studies on the long-term consequences
of breastfeeding have been conducted in high-
income countries and in predominantly Cauca-
sian populations. The findings from these stud-
ies may not hold for other populations exposed
to different environmental and nutritional con-
ditions, such as ethnic minorities in high-in-
come countries (32) or populations from less
developed countries.
Among studies carried out in the last few
decades, the type of milk fed to non-breastfed
infants would have varied substantially between
high-income countries (where most babies re-
ceive industrialized formulas) and those from
low- and middle-income countries (where whole
or diluted animal milk is often used).
In this sense, lack of breastfeeding is an unu-
sual variable in epidemiological studies. For ex-
posures to, for example, smoking, alcohol or en-
vironmental risks, the reference category is
made up of those who are unexposed. In the
case of breastfeeding, however, those “unex-
posed” to it are themselves exposed to a number
of other foodstuffs, including animal milk, in-
dustrialized or home-made formulas, or tradi-
tional weaning foods. Because alternative foods
vary markedly from one setting to another, the
effects of breastfeeding may be particularly af-
fected by where the study was carried out. The
location (area, country) of the study is there-
fore a potential modifier of the effect of
breastfeeding.
Adjustment for potential mediatingfactorsThis issue has been discussed above. Inappro-
priate adjustment was investigated as a poten-
tial source of heterogeneity among studies.
GENERAL METHODOLOGICAL ISSUES IN STUDIES OF THE LONG-TERM EFFECTS OF BREASTFEEDING

8 EVIDENCE ON THE LONG-TERM EFFECTS OF BREASTFEEDING: SYSTEMATIC REVIEWS AND META-ANALYSES
III. Search methods
Selection criteria for studies
In the present meta-analyses, we selected obser-
vational and randomized studies, published in
English, French, Spanish or Portuguese, examin-
ing the long-term effects of breastfeeding on the
following outcomes: blood pressure, overweight
or obesity, cholesterol, type-2 diabetes, and in-
tellectual performance. Studies restricted to
outcome measurement in infants were excluded
from the meta-analyses.
Only those studies with internal compari-
son groups were included. The type of compari-
son group used (never breastfed, breastfed for
less than x months, etc.) did not constitute an
eligibility criterion, but, as discussed above, the
way in which breastfeeding was categorized was
investigated as a potential source of heteroge-
neity among the studies.
Types of outcome measures
According to the objectives of the present re-
view, we looked for studies with the following
outcomes:
blood pressure: mean difference (in mmHg)
in systolic and diastolic blood pressure;
cholesterol: mean difference (in mg/dl) in
total cholesterol;
overweight and obesity: odds ratio compar-
ing breastfed and non-breastfed subjects;
type-2 diabetes: odds ratio comparing
breastfed and non-breastfed subjects (or
alternatively, mean difference in blood
glucose levels);
intellectual performance: mean attained
schooling and performance scores in de-
velopmental tests.
Search strategy
In order to prevent selection bias (33) by cap-
turing as many relevant studies as possible, two
independent literature searches were conducted:
one at the Department of Child and Adolescent
Health and Development in the World Health
Organization (R.B.) and another at the Federal
University of Pelotas in Brazil (B.L.H.).
Medline (1966 to March 2006) was searched
using the following terms for breastfeeding du-
ration: breastfeeding; breast feeding; breastfed;
breastfeed; bottle feeding; bottle fed; bottle feed;
infant feeding; human milk; formula milk; for-
mula feed; formula fed; weaning.
We combined the breastfeeding terms, with
the following terms for each of the studied out-
comes:
Cholesterol: cholesterol; LDL; HDL;
triglycerides; or blood lipids.
Type-2 diabetes: diabetes; glucose; or glyc-
emia.
Intellectual performance: schooling; develop-
ment; or intelligence.
Blood pressure: blood pressure; hyperten-
sion; systolic blood pressure; or diastolic
blood pressure.
Overweight or obesity: overweight; obesity;
body mass index; growth; weight; height;
child growth.
In addition to the electronic search, the ref-
erence lists of the articles initially identified were
searched, and we also perused the Scientific
Citation Index for papers citing the articles iden-
tified. Attempts were made to contact the au-
thors of all studies that did not provide suffi-
cient data to estimate the pooled mean effects.
We also contacted the authors to clarify any
queries on the study’s methodology.

9
IV. Review methods
Assessment of study quality
Eligible studies were evaluated for methodologi-
cal quality prior to consideration of their re-
sults. The following a priori criteria for quality
assessment were used:
a. Losses to follow-up (%)
b. Type of study
(0) Observational
(1) Randomized
c. Birth cohort
(0) No
(1) Yes
d. Length of recall of breastfeeding duration
(0) >3 years
(1) <3 years
e. Source of information on breastfeeding
(0) Records
(1) Interviews with subjects
(2) Mothers
f. Control for confounding
(0) None
(1) Socioeconomic or demographic
variables
(2) Socioeconomic and demographic
variables
(3) Socioeconomic, demographic
variables and maternal
anthropometry
g. Control for possible mediating variables
(0) Yes
(1) No
Data abstraction
Data from each study were extracted using a
standardized protocol to assess the mode of feed-
ing, outcome, potential sources of heterogene-
ity and assessment of study quality. With re-
spect to the assessment of study quality, each
study was independently evaluated by two re-
viewers for each of the quality items, with disa-
greements resolved by consensus rating.
Data analysisPooled effect estimateEffect measures were reported as i) weighted
mean differences and their 95% confidence in-
terval (CI) for continuous outcomes, and ii)
pooled odds ratios and 95% CI for dichotomous
outcomes. Subjects were classified as either
breastfed or non-breastfed, according to the
specific classification used in each study. For
the continuous outcomes, a negative mean dif-
ference denoted a lower value among breastfed
subjects, whereas for dichotomous outcomes an
odds ratio <1 denoted that breastfed subjects
presented lower odds of the outcome.
Fixed or random-effects modelFixed-effect models assume that each study es-
timates the same true population value for the
effect of interest, and thus that differences be-
tween their results can be fully accounted for
by sampling variation; in this model, individual
studies are simply weighted by their precision
(34). On the other hand, random-effects mod-
els assume that population effects also vary, and
thus need to be accounted for as an additional
source of variation. The random-effects model
(35) gives greater weight to smaller studies, re-
sulting in a wider confidence interval than fixed-
effects models. In the latter, an important sta-
tistical question is whether variability among
studies is greater than would be expected with
the play of chance. In the present meta-analy-
ses, the Q-test was used to assess the heteroge-
neity among studies (36); if significant, the be-
tween-studies variability was higher than ex-
pected by chance, and this required the use of a
random-effects model (35).
Publication biasStudies showing statistically significant associa-
tions are more likely to appear in print, to be
published in English, and to be cited by others

10 EVIDENCE ON THE LONG-TERM EFFECTS OF BREASTFEEDING: SYSTEMATIC REVIEWS AND META-ANALYSES
papers. Therefore, such articles are more likely
to be identified and included in a meta-analysis.
Publication bias is more likely to affect small
studies, since the greater amount of time and
money spent in larger studies makes them more
likely to be published, even when the results are
not statistically significant (34).
In the present meta-analyses, funnel plot and
Egger’s test were employed to assess whether
there was any evidence of publication bias (37).
We did not use the Begg test (38) because the
regression method (Egger’s test) showed a bet-
ter performance for detection of funnel plot
asymmetry (39). Furthermore, we stratified the
analyses according to study size, in order to as-
sess the potential impact of publication bias on
the pooled estimate.
Assessing heterogeneityThe next step after obtaining pooled results is
to assess whether certain study characteristics
may explain the variability between results. In
the present meta-analyses we used a random-
effects regression model developed by Berkey et
al (40) for evaluation of sources of heterogene-
ity. In this approach, if the data are homogene-
ous or if heterogeneity is fully explained by the
covariates, the random-effects model is reduced
to a fixed-effect. This analysis was performed
using the METAREG command within STATA.
In these random-effects regression (meta-regres-
sion) models, each of the items used to assess
study quality was considered as a covariate, in-
stead of using an overall quality score. This al-
lows the identification of aspects of the study
design, if any, which may be responsible for the
heterogeneity between studies (41). Further-
more, the following study characteristics were
also included as covariates in random-effects
regression:
a. Definition of breastfeeding
b Birth year
c Age at outcome assessment:
(0) 1–9 years
(1) 10–19 years
(2) >19 years
d. Study size (n)
e. Provenance (high-income country /
middle/low-income country).
As discussed in the Introduction, the present
review was aimed at assessing the long-term
consequences of breastfeeding on five different
outcomes. This resulted in five separate meta-
analyses which are described below.

11
V. Results and discussion
High blood pressure in adulthood is associated
with increased risk of ischaemic heart disease
and stroke (42,43). It has been suggested that
adult blood pressure is influenced by early life
exposures, such as intrauterine growth, catch-
up growth, and infant feeding (44).
Biological plausibility
Three possible biological mechanisms for a pos-
sible programming effect of breastfeeding on
blood pressure have been proposed.
Differences in sodium content be-tween breastmilk and formulaAs previously discussed (section on general
methodological issues), until the 1980s the so-
dium content of breastmilk in Western coun-
tries was much lower than that of formulas (26).
Because low sodium intake is related to lower
blood pressure (45), it has been suggested that
differences in sodium content between breast-
milk and formula would be one of the mecha-
nisms for the programming of later blood pres-
sure.
However, evidence on the existence of an
effect of early salt intake on later blood pres-
sure is controversial. Whitten & Stewart (46)
reported that blood pressure at eight years of
age was not correlated with sodium intake at
the age of eight months. In another study,
Singhal et al (47) followed pre-term infants who
had been randomly assigned to receive two dif-
ferent types of infant formulas which differed
greatly in salt content. Blood pressure at age
13-16 years was independent of the type of for-
mula the subject had received, but was lower
among the breastfed subjects. On the other
hand, Geleijnse et al (48) reported that adjusted
systolic blood pressure at age of 15 years was
3.6 mmHg (95% CI: -6.6 to -0.5) lower in chil-
dren assigned to a low sodium diet in the first 6
months of life. Therefore, there is no consensus
on whether the sodium content of infant diets
may lead to higher blood pressure in the future.
Fatty acid content of breastmilkLong-chain polyunsaturated fatty acids are
present in breastmilk, but not in most brands
of formula (49); these substances are important
structural components of tissue membrane sys-
tems, including the vascular endothelium (50).
Evidence suggests that dietary supplementation
with long-chain polyunsaturated fatty acids low-
ers the blood pressure in hypertensive subjects
(51). Furthermore, Forsyth et al (52) reported
that blood pressure at 6 years was lower among
formula-fed children who had been assigned to
a formula supplemented with long-chain poly-
unsaturated fatty acids than among those
randomized to a standard formula. This is, there-
fore, a potential mechanism for a possible ef-
fect of breastfeeding.
ObesityThe effect of early infant feeding on blood pres-
sure might also be mediated by overweight or
obesity in adulthood, as this is a risk factor for
hypertension (53). On the other hand, as dis-
cussed below, the evidence suggests that
breastfeeding has only a small protective effect
against excess weight. Whether or not this small
effect may influence blood pressure levels re-
mains to be proven.
In conclusion, of the three postulated mecha-
nisms, only the fatty acid content of breastmilk
appears to be supported by the literature, but
there may well be other mechanisms that are
currently unknown.
Review 1 - Breastfeeding and blood pressure in later life
12 EVIDENCE ON THE LONG-TERM EFFECTS OF BREASTFEEDING: SYSTEMATIC REVIEWS AND META-ANALYSES
Specific methodological issues
General methodological issues affecting studies
of the long-term consequences of breastfeeding
were addressed above. An additional issue is that
several studies included adjustment for current
weight, body mass index or ponderal index in
their multivariate analyses. Had breastfeeding
been associated with adult weight, adjustment
for the latter would lead to an underestimation
of its true effect on blood pressure. However, as
discussed in section 1.3 above, there is no strong
evidence of a breastfeeding effect on adult
weight, and therefore one would not expect ad-
justment for weight to change the association
with blood pressure.
Overview of the existing meta-analyses
We reviewed two existing meta-analyses on the
influence of breastfeeding on blood pressure in
later life (54,55).
The meta-analysis by Owen et al in 2003 (54)
obtained information from 25 studies, includ-
ing those in which blood pressure was meas-
ured in infancy. Meta-regression analysis was
used to evaluate whether there were differences
in the mean effect of breastfeeding according
to the subject’s age, year of birth, study size,
length of recall for information on breastfeeding
duration (for retrospective studies), and adjust-
ment for current body size.
The meta-analysis by Martin et al in 2005
(55) included 15 studies that related breastfeed-
ing to blood pressure measured after the age of
12 months. Meta-regression analysis was used
to evaluate whether the mean effect of
breastfeeding varied according to the subject’s
age when the blood pressure was measured, year
of birth, study size, length of recall of
breastfeeding duration, follow-up rates, and
whether or not confounding variables were ad-
justed for.
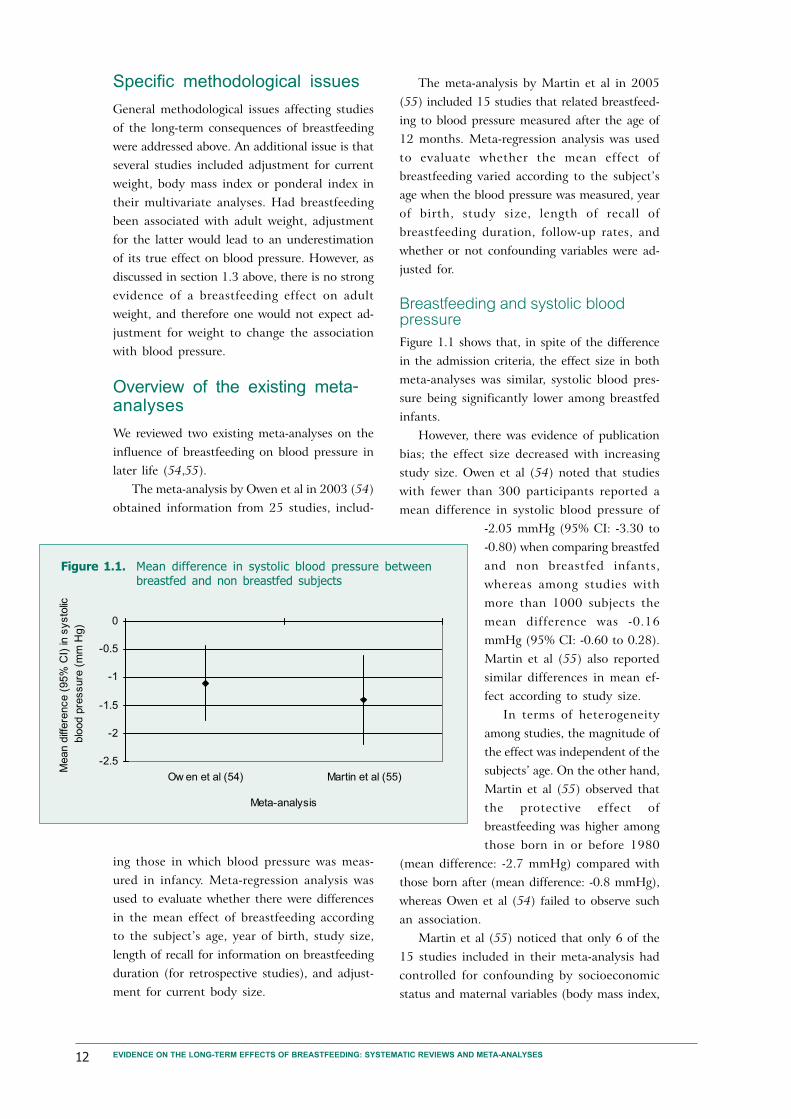
Breastfeeding and systolic bloodpressureFigure 1.1 shows that, in spite of the difference
in the admission criteria, the effect size in both
meta-analyses was similar, systolic blood pres-
sure being significantly lower among breastfed
infants.
However, there was evidence of publication
bias; the effect size decreased with increasing
study size. Owen et al (54) noted that studies
with fewer than 300 participants reported a
mean difference in systolic blood pressure of
-2.05 mmHg (95% CI: -3.30 to
-0.80) when comparing breastfed
and non breastfed infants,
whereas among studies with
more than 1000 subjects the
mean difference was -0.16
mmHg (95% CI: -0.60 to 0.28).
Martin et al (55) also reported
similar differences in mean ef-
fect according to study size.
In terms of heterogeneity
among studies, the magnitude of
the effect was independent of the
subjects’ age. On the other hand,
Martin et al (55) observed that
the protective effect of
breastfeeding was higher among
those born in or before 1980
(mean difference: -2.7 mmHg) compared with
those born after (mean difference: -0.8 mmHg),
whereas Owen et al (54) failed to observe such
an association.
Martin et al (55) noticed that only 6 of the
15 studies included in their meta-analysis had
controlled for confounding by socioeconomic
status and maternal variables (body mass index,
Figure 1.1. Mean difference in systolic blood pressure betweenbreastfed and non breastfed subjects
-2.5
-2
-1.5
-1
-0.5
0
Ow en et al (54) Martin et al (55)
Meta-analysis
Mean d
iffere
nce (
95%
CI)
in s
ysto
lic
blo
od p
ressure
(m
m H
g)
13
smoking). In a clear demonstration of the im-
portance of adjustment for confounding, in two
of the three studies that reported crude and
adjusted estimates, adjustment reduced the
crude estimates in more than 30% (Table 1.1).
With regard to control for possible mediating
factors, Owen et al (54) reported that control
for body size at the time of blood pressure as-
sessment had no effect in the results of 10 stud-
ies (12 observations) that included such analy-
ses. This is in agreement with our earlier argu-
ment that – given the weak association between
breastfeeding and adult weight – such control
would not affect the final results.
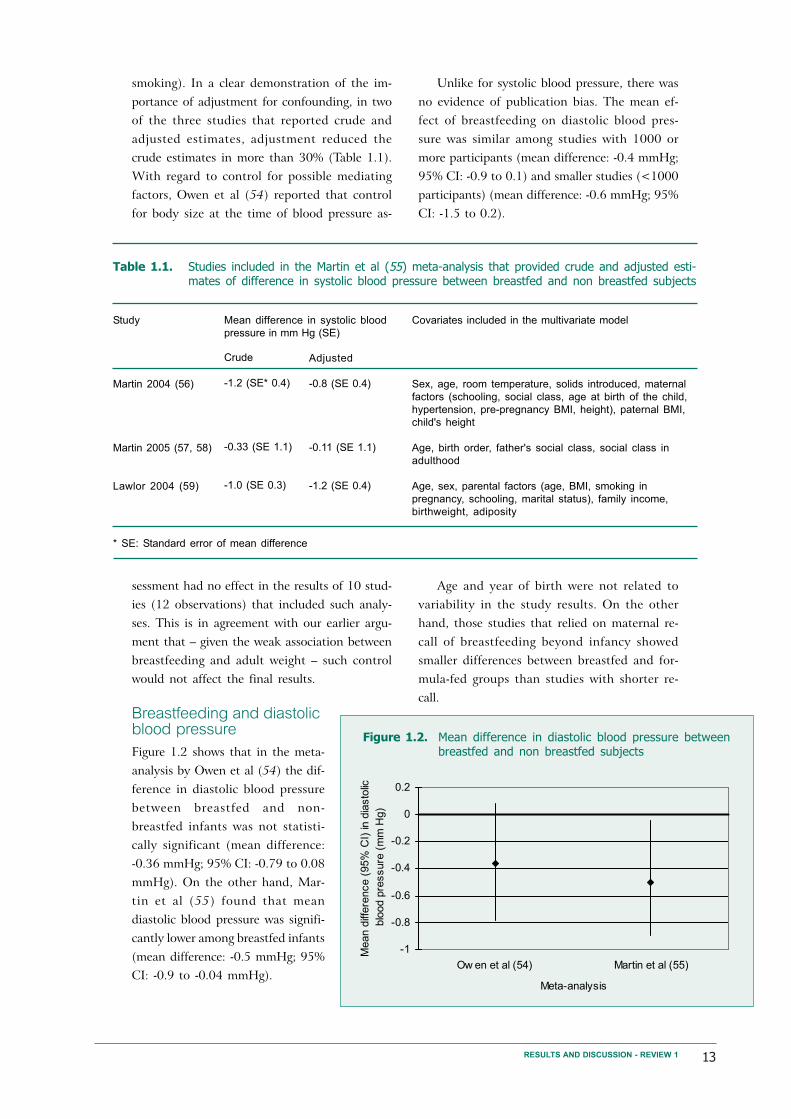
Breastfeeding and diastolicblood pressureFigure 1.2 shows that in the meta-
analysis by Owen et al (54) the dif-
ference in diastolic blood pressure
between breastfed and non-
breastfed infants was not statisti-
cally significant (mean difference:
-0.36 mmHg; 95% CI: -0.79 to 0.08
mmHg). On the other hand, Mar-
tin et al (55) found that mean
diastolic blood pressure was signifi-
cantly lower among breastfed infants
(mean difference: -0.5 mmHg; 95%
CI: -0.9 to -0.04 mmHg).
Unlike for systolic blood pressure, there was
no evidence of publication bias. The mean ef-
fect of breastfeeding on diastolic blood pres-
sure was similar among studies with 1000 or
more participants (mean difference: -0.4 mmHg;
95% CI: -0.9 to 0.1) and smaller studies (<1000
participants) (mean difference: -0.6 mmHg; 95%
CI: -1.5 to 0.2).
Age and year of birth were not related to
variability in the study results. On the other
hand, those studies that relied on maternal re-
call of breastfeeding beyond infancy showed
smaller differences between breastfed and for-
mula-fed groups than studies with shorter re-
call.
RESULTS AND DISCUSSION - REVIEW 1
Figure 1.2. Mean difference in diastolic blood pressure betweenbreastfed and non breastfed subjects
-1
-0.8
-0.6
-0.4
-0.2
0
0.2
Ow en et al (54) Martin et al (55)
Meta-analysis
Mean d
iffere
nce (
95%
CI)
in d
iasto
lic
blo
od p
ressure
(m
m H
g)
Table 1.1. Studies included in the Martin et al (55) meta-analysis that provided crude and adjusted esti-mates of difference in systolic blood pressure between breastfed and non breastfed subjects
Study
Martin 2004 (56)
Martin 2005 (57, 58)
Lawlor 2004 (59)
Crude
-1.2 (SE* 0.4)
-0.33 (SE 1.1)
-1.0 (SE 0.3)
Adjusted
-0.8 (SE 0.4)
-0.11 (SE 1.1)
-1.2 (SE 0.4)
Mean difference in systolic blood
pressure in mm Hg (SE)
Covariates included in the multivariate model
Sex, age, room temperature, solids introduced, maternal
factors (schooling, social class, age at birth of the child,
hypertension, pre-pregnancy BMI, height), paternal BMI,
child's height
Age, birth order, father's social class, social class in
adulthood
Age, sex, parental factors (age, BMI, smoking in
pregnancy, schooling, marital status), family income,
birthweight, adiposity
* SE: Standard error of mean difference
14 EVIDENCE ON THE LONG-TERM EFFECTS OF BREASTFEEDING: SYSTEMATIC REVIEWS AND META-ANALYSES
Studies not included in the pre-vious meta-analyses
We have identified four recently published stud-
ies that have not been included in the published
meta-analyses. Below are summarized the find-
ings from these studies.
Martin et al (57) studied a cohort of 1580
men living in Caerphilly, South Wales, who were
aged 45-59 years when examined between 1979
and 1983. Information on breastfeeding dura-
tion was obtained from the subjects’ mothers
or a close female relative. Difference in systolic
blood pressure between breastfed and bottle-fed
subjects was -0.11 mmHg (95% CI: -2.28 to 2.06)
and for diastolic blood pressure -0.21 mmHg
(95% CI: -1.67 to 1.25).
Martin et al also studied (58) a historic co-
hort based on a follow-up of the subjects who
participated in a 1-week survey of diet and health
when aged 0 to 19 years, between 1937 and
1939. This study was conducted in 16 centres
in England and Scotland. Information on
breastfeeding duration was obtained from the
subject’s mother at the time of the survey on
diet and health. Differences between breastfed
and non-breastfed subjects were -1.62 mmHg
(95% CI: -6.66 to 3.41) and -0.74 mmHg (95%
CI: -3.06 to 1.57) for systolic and diastolic blood
pressure, respectively.
Lawlor et al (60) evaluated random samples
of schoolchildren aged 9 years and similar sam-
ples of 15-year-olds from Estonia (n=1174) and
Denmark (n=1018). Even after controlling for
possible confounding variables, the systolic blood
pressure was lower among those children who
had ever been exclusively breastfed (difference:
-1.7 mmHg; 95% CI: -3.0 to -0.5).
In a recently published paper, Horta et al
(61) observed in a cohort of over 1000 15-year-
olds in Pelotas (Brazil) that breastfeeding was
not related to systolic (difference -1.31 mmHg;
95% CI: -3.92 to 1.30) or diastolic blood pres-
sure (difference -0.64 mmHg; 95% CI: -2.91 to
1.63).
Update of existing meta-analysis
A new meta-analysis was carried out which in-
cluded the four recently published studies de-
scribed above, all the papers in previously pub-
lished meta-analyses, and those identified by the
two independent literature searches at WHO
and at the University of Pelotas. It was possible
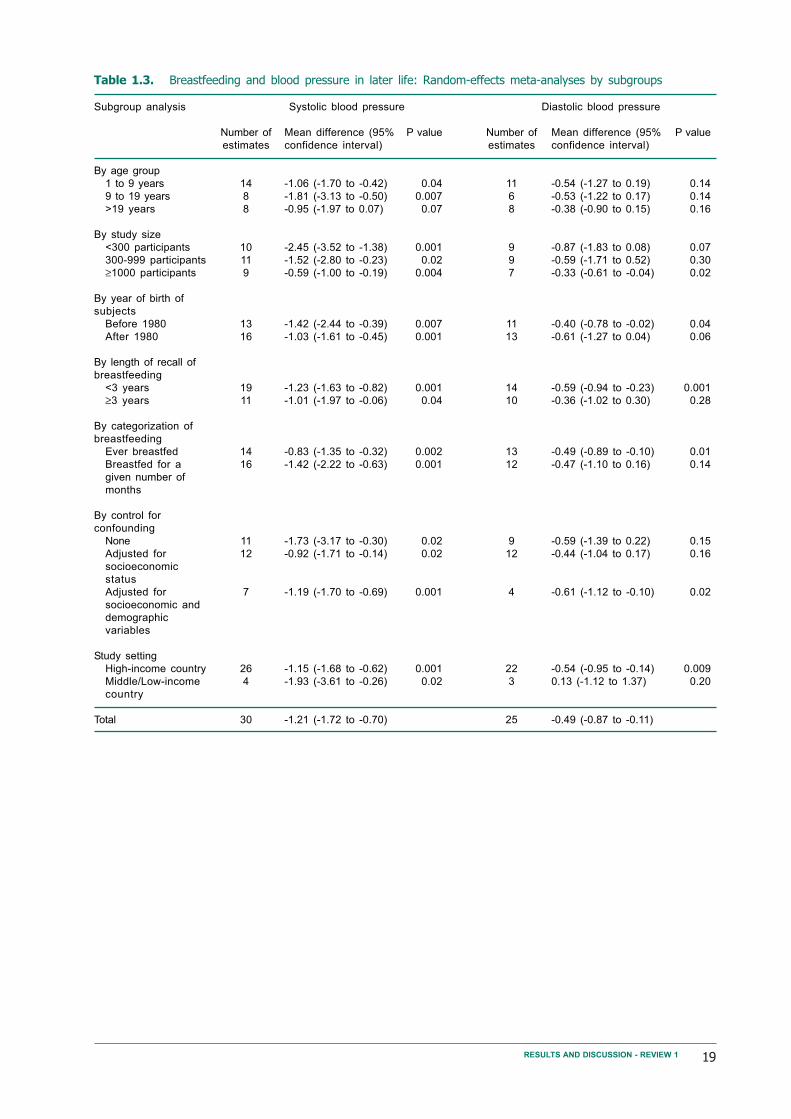
to include 30 estimates on the effect of
breastfeeding on systolic blood pressure, and 25
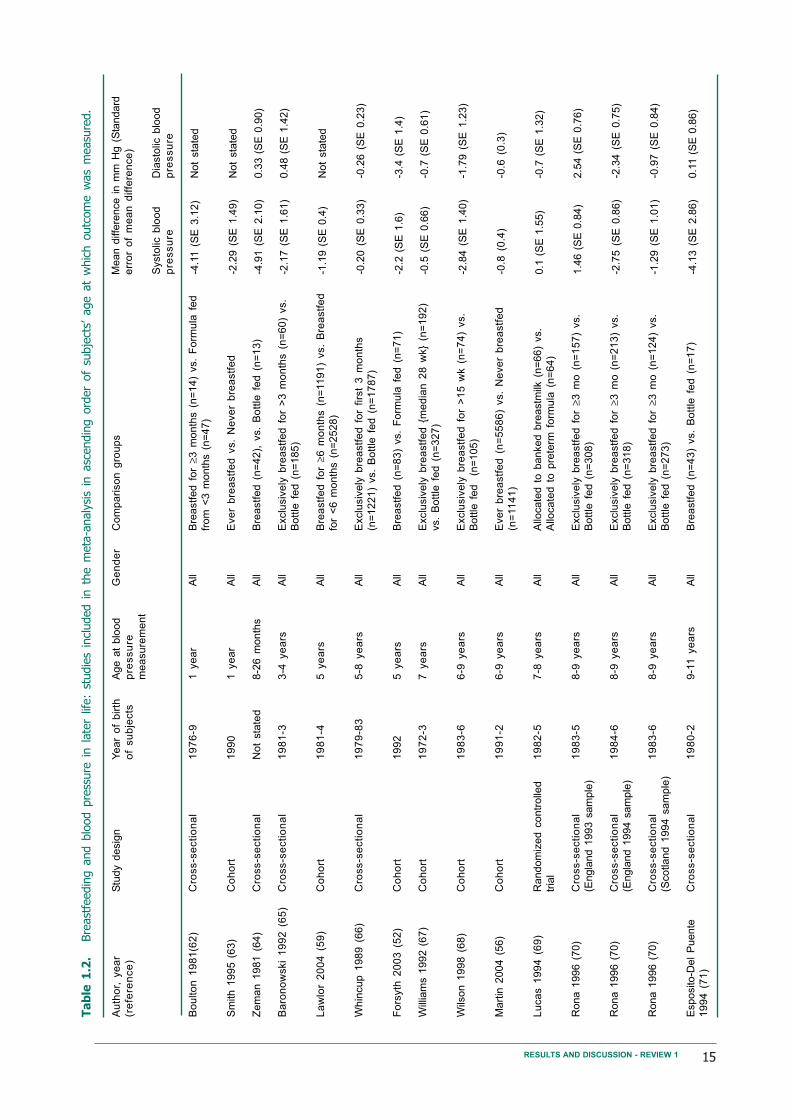
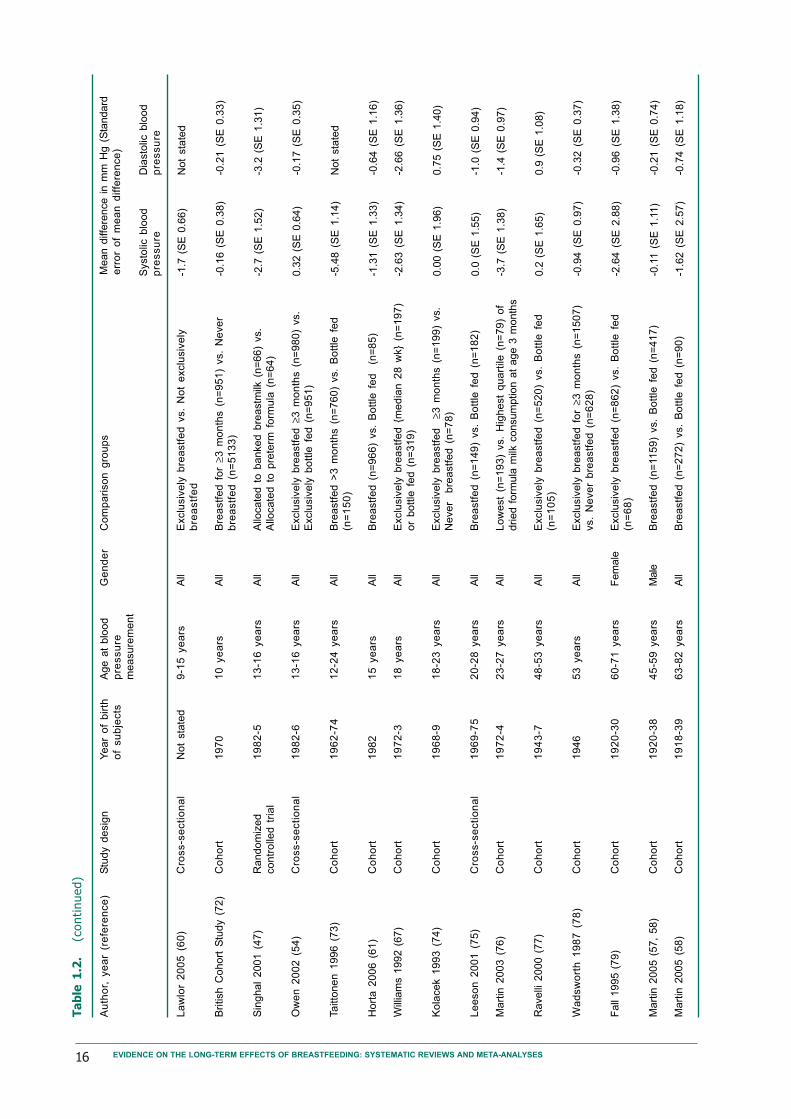
on diastolic blood pressure (Table 1.2). Fig. 1.3
and 1.4 show the forest plot for systolic and
diastolic blood pressures, respectively. Systolic
(mean difference: -1.21 mmHg; 95% CI: -1.72
to -0.70) and diastolic blood pressures (mean
difference: -0.49 mmHg; 95% CI: -0.87 to -0.11)
were both lower among those subjects who had
been breastfed. Random-effects models were
used in both analyses because heterogeneity
among studies was statistically significant.
Similar to the previously published meta-
analyses, publication bias was clearly present.
Table 1.2 shows that the mean difference was
inversely related to the study size, with larger
studies reporting a smaller protective effect of
breastfeed-ing. This was more marked for
systolic than for diastolic blood pressure. This
is confirmed by examination of the funnel plots
which are clearly asymmetrical, with small stud-
ies reporting a higher protective effect of
breastfeeding. (Fig. 1.5 and 1.6)
Conclusion
According to Owen et al (54), the association
between breastfeeding and lower blood pressure
was mainly due to publication bias, and any ef-
fect of breastfeeding was modest and of limited
clinical or public health relevance. In spite of
not being able to exclude residual confounding
and publication bias, Martin et al (55) concluded
that breastfeeding was negatively associated with
blood pressure. They argued that even a small
protective effect of breastfeeding would be im-
portant from a public health perspective. For
example, a reduction in mean population blood
pressure of 2 mmHg could lower the prevalence
of hypertension by up to 17%, the number of
coronary heart disease events by 6%, and stroke
by 15%. Three large studies were published since
the last review, two of which found no associa-
tion and one found a protective effect of
breastfeeding.
Both meta-analyses may have been affected
by publication bias. Small studies with negative
results are less likely to be published, and this
15RESULTS AND DISCUSSION - REVIEW 1
Ta
ble
1.2
.Bre
ast
feedin
g a
nd b
lood p
ress
ure
in l
ate
r lif
e:
studie
s in
cluded i
n t
he m
eta
-analy
sis
in a
scendin
g o
rder
of
subje
cts’
age a
t w
hic
h o
utc
om
e w
as
measu
red.
Au
tho
r, y
ea
r
(re
fere
nce
)
Bo
ulto
n 1
98
1(6
2)
Sm
ith 1
995 (
63)
Ze
ma
n 1
98
1 (
64
)
Ba
ron
ow
ski
19
92
(6
5)
La
wlo
r 2
00
4 (
59
)
Wh
incu
p 1
98
9 (
66
)
Fo
rsyth
20
03
(5
2)
Will
iam
s 1
992 (
67)
Wils
on
19
98
(6
8)
Mart
in 2
004 (
56)
Lu
ca
s 1
99
4 (
69
)
Rona 1
996 (
70)
Rona 1
996 (
70)
Rona 1
996 (
70)
Esposito-D
el
Puente
19
94
(7
1)
Stu
dy d
esig
n
Cro
ss-s
ecti
on
al
Co
ho
rt
Cro
ss-s
ecti
on
al
Cro
ss-s
ecti
on
al
Co
ho
rt
Cro
ss-s
ecti
on
al
Co
ho
rt
Co
ho
rt
Co
ho
rt
Co
ho
rt
Ra
nd
om
ize
d c
on
tro
lled
tria
l
Cro
ss-s
ecti
on
al
(Engla
nd 1
993 s
am
ple
)
Cro
ss-s
ecti
on
al
(Engla
nd 1
994 s
am
ple
)
Cro
ss-s
ecti
on
al
(Sco
tla
nd
19
94
sa
mp
le)
Cro
ss-s
ecti
on
al
Ye
ar
of
bir
th
of
su
bje
cts
19
76
-9
19
90
Not
sta
ted
19
81
-3
19
81
-4
19
79
-83
19
92
19
72
-3
19
83
-6
19
91
-2
19
82
-5
19
83
-5
19
84
-6
19
83
-6
19
80
-2
Age a
t blo
od
pre
ssu
re
me
asu
rem
en
t
1 y
ea
r
1 y
ea
r
8-2
6 m
on
ths
3-4
ye
ars
5 y
ea
rs
5-8
ye
ars
5 y
ea
rs
7 y
ea
rs
6-9
ye
ars
6-9
ye
ars
7-8
ye
ars
8-9
ye
ars
8-9
ye
ars
8-9
ye
ars
9-1
1 y
ea
rs
Systo
lic b
loo
d
pre
ssu
re
-4.1
1 (
SE
3.1
2)
-2.2
9 (
SE
1.4
9)
-4.9
1 (
SE
2.1
0)
-2.1
7 (
SE
1.6
1)
-1.1
9 (
SE
0.4
)
-0.2
0 (
SE
0.3
3)
-2.2
(S
E 1
.6)
-0.5
(S
E 0
.66)
-2.8
4 (
SE
1.4
0)
-0.8
(0
.4)
0.1
(S
E 1
.55)
1.4
6 (
SE
0.8
4)
-2.7
5 (
SE
0.8
6)
-1.2
9 (
SE
1.0
1)
-4.1
3 (
SE
2.8
6)
Co
mp
ari
so
n g
rou
ps
Bre
astf
ed
fo
r ≥3
mo
nth
s (
n=
14
) vs.
Fo
rmu
la f
ed
from
<3 m
onth
s (
n=
47)
Eve
r b
rea
stf
ed
vs.
Ne
ve
r b
rea
stf
ed
Bre
astf
ed
(n
=4
2),
vs.
Bo
ttle
fe
d (
n=
13
)
Exclu
siv
ely
bre
astf
ed
fo
r >
3 m
on
ths (
n=
60
) vs.
Bo
ttle
fe
d (
n=
18
5)
Bre
astf
ed
fo
r ≥6
mo
nth
s (
n=
11
91
) vs.
Bre
astf
ed
for
<6
mo
nth
s (
n=
25
28
)
Exclu
siv
ely
bre
astf
ed
fo
r firs
t 3
mo
nth
s
(n=
12
21
) vs.
Bo
ttle
fe
d (
n=
17
87
)
Bre
astf
ed
(n
=8
3)
vs.
Fo
rmu
la f
ed
(n
=7
1)
Exclu
siv
ely
bre
astf
ed
{m
ed
ian
28
wk}
(n=
19
2)
vs.
Bo
ttle
fe
d (
n=
32
7)
Exclu
siv
ely
bre
astf
ed
fo
r >
15
wk (
n=
74
) vs.
Bottle
fed
(n=
105)
Eve
r b
rea
stf
ed
(n
=5
58
6)
vs.
Ne
ve
r b
rea
stf
ed
(n=
11
41
)
Allo
cate
d t
o b
anked b
reastm
ilk (
n=
66)
vs.
Allo
ca
ted
to
pre
term
fo
rmu
la (
n=
64
)
Exclu
siv
ely
bre
astf
ed
fo
r ≥3
mo
(n
=1
57
) vs.
Bo
ttle
fe
d (
n=
30
8)
Exclu
siv
ely
bre
astf
ed
fo
r ≥3
mo
(n
=2
13
) vs.
Bo
ttle
fe
d (
n=
31
8)
Exclu
siv
ely
bre
astf
ed
fo
r ≥3
mo
(n
=1
24
) vs.
Bo
ttle
fe
d (
n=
27
3)
Bre
astf
ed
(n
=4
3)
vs.
Bo
ttle
fe
d (
n=
17
)
Ge
nd
er
All
All
All
All
All
All
All
All
All
All
All
All
All
All
All
Mean d
iffe
rence i
n m
m H
g (
Sta
ndard
err
or
of
me
an
diffe
ren
ce
)
Dia
sto
lic b
loo
d
pre
ssu
re
Not
sta
ted
Not
sta
ted
0.3
3 (
SE
0.9
0)
0.4
8 (
SE
1.4
2)
Not
sta
ted
-0.2
6 (
SE
0.2
3)
-3.4
(S
E 1
.4)
-0.7
(S
E 0
.61)
-1.7
9 (
SE
1.2
3)
-0.6
(0
.3)
-0.7
(S
E 1
.32)
2.5
4 (
SE
0.7
6)
-2.3
4 (
SE
0.7
5)
-0.9
7 (
SE
0.8
4)
0.1
1 (
SE
0.8
6)
16 EVIDENCE ON THE LONG-TERM EFFECTS OF BREASTFEEDING: SYSTEMATIC REVIEWS AND META-ANALYSES
Ta
ble
1.2
.(c
onti
nued)
Au
tho
r, y
ea
r (r
efe
ren
ce
)
La
wlo
r 2
00
5 (
60
)
Bri
tish
Co
ho
rt S
tud
y (
72
)
Sin
ghal
2001 (
47)
Ow
en
20
02
(5
4)
Ta
itto
ne
n 1
99
6 (
73
)
Ho
rta
20
06
(6
1)
Will
iam
s 1
992 (
67)
Ko
lace
k 1
99
3 (
74
)
Le
eso
n 2
00
1 (
75
)
Mart
in 2
003 (
76)
Ravelli
2000 (
77)
Wa
dsw
ort
h 1
98
7 (
78
)
Fall
1995 (
79)
Mart
in 2
005 (
57,
58)
Mart
in 2
005 (
58)
Stu
dy d
esig
n
Cro
ss-s
ecti
on
al
Co
ho
rt
Ra
nd
om
ize
d
co
ntr
olle
d t
ria
l
Cro
ss-s
ecti
on
al
Co
ho
rt
Co
ho
rt
Co
ho
rt
Co
ho
rt
Cro
ss-s
ecti
on
al
Co
ho
rt
Co
ho
rt
Co
ho
rt
Co
ho
rt
Co
ho
rt
Co
ho
rt
Ye
ar
of
bir
th
of
su
bje
cts
Not
sta
ted
19
70
19
82
-5
19
82
-6
19
62
-74
19
82
19
72
-3
19
68
-9
19
69
-75
19
72
-4
19
43
-7
19
46
19
20
-30
19
20
-38
19
18
-39
Age a
t blo
od
pre
ssu
re
me
asu
rem
en
t
9-1
5 y
ea
rs
10
ye
ars
13
-16
ye
ars
13
-16
ye
ars
12
-24
ye
ars
15
ye
ars
18
ye
ars
18
-23
ye
ars
20
-28
ye
ars
23
-27
ye
ars
48
-53
ye
ars
53
ye
ars
60
-71
ye
ars
45
-59
ye
ars
63
-82
ye
ars
Systo
lic b
loo
d
pre
ssu
re
-1.7
(S
E 0
.66)
-0.1
6 (
SE
0.3
8)
-2.7
(S
E 1
.52)
0.3
2 (
SE
0.6
4)
-5.4
8 (
SE
1.1
4)
-1.3
1 (
SE
1.3
3)
-2.6
3 (
SE
1.3
4)
0.0
0 (
SE
1.9
6)
0.0
(S
E 1
.55)
-3.7
(S
E 1
.38)
0.2
(S
E 1
.65)
-0.9
4 (
SE
0.9
7)
-2.6
4 (
SE
2.8
8)
-0.1
1 (
SE
1.1
1)
-1.6
2 (
SE
2.5
7)
Co
mp
ari
so
n g
rou
ps
Exclu
siv
ely
bre
astf
ed
vs.
No
t e
xclu
siv
ely
bre
astf
ed
Bre
astf
ed
fo
r ≥3
mo
nth
s (
n=
95
1)
vs.
Ne
ve
r
bre
astf
ed
(n
=5
13
3)
Allo
cate
d t
o b
anked b
reastm
ilk (
n=
66)
vs.
Allo
ca
ted
to
pre
term
fo
rmu
la (
n=
64
)
Exclu
siv
ely
bre
astf
ed
≥3
mo
nth
s (
n=
98
0)
vs.
Exclu
siv
ely
bo
ttle
fe
d (
n=
95
1)
Bre
astf
ed
>3
mo
nth
s (
n=
76
0)
vs.
Bo
ttle
fe
d
(n=
15
0)
Bre
astf
ed
(n
=9
66
) vs.
Bo
ttle
fe
d
(n=
85
)
Exclu
siv
ely
bre
astf
ed
{m
ed
ian
28
wk}
(n=
19
7)
or
bo
ttle
fe
d (
n=
31
9)
Exclu
siv
ely
bre
astf
ed
≥3 m
on
ths (
n=
19
9)
vs.
Ne
ve
r b
rea
stf
ed
(n
=7
8)
Bre
astf
ed
(n
=1
49
) vs.
Bo
ttle
fe
d (
n=
18
2)
Lo
we
st
(n=
19
3)
vs.
Hig
he
st
qu
art
ile (
n=
79
) o
f
dried f
orm
ula
milk
consum
ption a
t age 3
month
s
Exclu
siv
ely
bre
astf
ed
(n
=5
20
) vs.
Bo
ttle
fe
d
(n=
10
5)
Exclu
siv
ely
bre
astf
ed
fo
r ≥3
mo
nth
s (
n=
15
07
)
vs.
Ne
ve
r b
rea
stf
ed
(n
=6
28
)
Exclu
siv
ely
bre
astf
ed
(n
=8
62
) vs.
Bo
ttle
fe
d
(n=
68
)
Bre
astf
ed
(n
=11
59
) vs.
Bo
ttle
fe
d (
n=
41
7)
Bre
astf
ed
(n
=2
72
) vs.
Bo
ttle
fe
d (
n=
90
)
Ge
nd
er
All
All
All
All
All
All
All
All
All
All
All
All
Fem
ale
Male
All
Mean d
iffe
rence i
n m
m H
g (
Sta
ndard
err
or
of
me
an
diffe
ren
ce
)
Dia
sto
lic b
loo
d
pre
ssu
re
Not
sta
ted
-0.2
1 (
SE
0.3
3)
-3.2
(S
E 1
.31)
-0.1
7 (
SE
0.3
5)
Not
sta
ted
-0.6
4 (
SE
1.1
6)
-2.6
6 (
SE
1.3
6)
0.7
5 (
SE
1.4
0)
-1.0
(S
E 0
.94)
-1.4
(S
E 0
.97)
0.9
(S
E 1
.08)
-0.3
2 (
SE
0.3
7)
-0.9
6 (
SE
1.3
8)
-0.2
1 (
SE
0.7
4)
-0.7
4 (
SE
1.1
8)

17RESULTS AND DISCUSSION - REVIEW 1
leads to an overestimate of the pooled mean
difference due to selective inclusion of small
positive studies.
Lack of control for confounding is another
methodological issue, as pointed out by Martin
et al (55). Most studies did not provide esti-
mates adjusted for confounding by socioeco-
nomic status and maternal characteristics; in
the studies that showed both adjusted and crude
results, the latter tended to overestimate the
protective effect of breastfeeding. The majority
of these studies are from developed countries,
and as previously discussed, the direction of con-
founding may vary according to the level of eco-
nomic development of the population.
In summary, the present updated meta-analy-
ses show that there are small but significant pro-
tective effects of breastfeeding on systolic and
diastolic blood pressure. Publication bias is un-
likely to explain this finding because a signifi-
cant protective effect was observed even among
the larger studies. However, residual confound-
ing cannot be excluded because of the marked
reduction in effect size after adjustment for
known confounders.
Boulton 1981 (M)
Zeman 1981 (A)
Baronowski 1992 (A)
Whincup 1989 (A)
Forsyth 2003 (A)
Williams 1992 (A)
Wilson 1998 (A)
Martin 2004 (A)
Lucas 1994 (A)
Rona 1996 (A)
Rona 1996 (A)
Rona 1996 (A)
Esposito-Del Puente 1994 (A)
British Cohort Study (A)
Singhal 2001 (A)
Owen 2002 (A)
Taittonen 1996 (A)
Williams 1992 (A)
Kolacek 1993 (A)
Leeson 2001 (A)
Martin 2003 (A)
Ravelli 2000 (A)
Wadsworth 1987 (A)
Fall 1995 (F)
Martin 2005 (A)
Martin 2005 (M)
Lawlor 2005 (A)
Lawlor 2004 (A)
Horta 2006 (A)
Smith 1995 (A)
Combined
Mean difference (mm Hg)
-10 -5 -1 0 1 5
Mean lower in breastfed Mean higher in breastfed
subjects subjects
Figure 1.3. Mean difference in systolic blood pressure in mm Hg (and its 95% confidence interval) betweenbreastfed and non-breastfed subjects in different studies. Whether the estimate was for males(M), females (F) and all (A) is indicated in parenthesis
12
1212
121212
1212
11
11
1212
11
11
1
1
1212
1212
11
1212
11
121212
12
1212
11
1212
11
12121212
11
1212
1
12121212
12
11
1212
12345671234567

18 EVIDENCE ON THE LONG-TERM EFFECTS OF BREASTFEEDING: SYSTEMATIC REVIEWS AND META-ANALYSES
Zeman 1981 (A)
Baronowski 1992 (A)
Whincup 1989 (A)
Forsyth 2003 (A)
Williams 1992 (A)
Wilson 1998 (A)
Martin 2004 (A)
Lucas 1994 (A)
Rona 1996 (A)
Rona 1996 (A)
Rona 1996 (A)
Esposito-Del Puente 1994 (A)
British Cohort Study (A)
Singhal 2001 (A)
Owen 2002 (A)
Williams 1992 (A)
Kolacek 1993 (A)
Leeson 2001 (A)
Martin 2003 (A)
Ravelli 2000 (A)
Wadsworth 1987 (A)
Fall 1995 (F)
Martin 2005 (A)
Martin 2005 (M)
Horta 2006 (A)
Combined
Mean difference (mm Hg)
-5 -1 0 1 5
Mean lower in breastfed Mean higher in breastfed
subjects subjects
Figure 1.4. Mean difference in systolic blood pressure in mm Hg (and its 95% confidence interval) betweenbreastfed and non-breastfed subjects in different studies. Whether the estimate was for males(M), females (F) and all (A) is indicated in parenthesis
Figure 1.5. Funnel plot showing mean differencein systolic blood pressure (mm Hg) bystandard error of mean difference
-10 -5 0 5 -4 -2 0 2 4
0
1
2
3
0
0.5
1
1.5
Mean difference (mm Hg) Mean difference (mm Hg)
Sta
nd
ard
err
or
Figure 1.6. Funnel plot showing mean differencein diastolic blood pressure (mm Hg) bystandard error of mean difference
19RESULTS AND DISCUSSION - REVIEW 1
Subgroup analysis
By age group
1 to 9 years
9 to 19 years
>19 years
By study size
<300 participants
300-999 participants
≥1000 participants
By year of birth of
subjects
Before 1980
After 1980
By length of recall of
breastfeeding
<3 years
≥3 years
By categorization of
breastfeeding
Ever breastfed
Breastfed for a
given number of
months
By control for
confounding
None
Adjusted for
socioeconomic
status
Adjusted for
socioeconomic and
demographic
variables
Study setting
High-income country
Middle/Low-income
country
Total
Number of
estimates
14
8
8
10
11
9
13
16
19
11
14
16
11
12
7
26
4
30
Mean difference (95%
confidence interval)
-1.06 (-1.70 to -0.42)
-1.81 (-3.13 to -0.50)
-0.95 (-1.97 to 0.07)
-2.45 (-3.52 to -1.38)
-1.52 (-2.80 to -0.23)
-0.59 (-1.00 to -0.19)
-1.42 (-2.44 to -0.39)
-1.03 (-1.61 to -0.45)
-1.23 (-1.63 to -0.82)
-1.01 (-1.97 to -0.06)
-0.83 (-1.35 to -0.32)
-1.42 (-2.22 to -0.63)
-1.73 (-3.17 to -0.30)
-0.92 (-1.71 to -0.14)
-1.19 (-1.70 to -0.69)
-1.15 (-1.68 to -0.62)
-1.93 (-3.61 to -0.26)
-1.21 (-1.72 to -0.70)
P value
0.04
0.007
0.07
0.001
0.02
0.004
0.007
0.001
0.001
0.04
0.002
0.001
0.02
0.02
0.001
0.001
0.02
Number of
estimates
11
6
8
9
9
7
11
13
14
10
13
12
9
12
4
22
3
25
Mean difference (95%
confidence interval)
-0.54 (-1.27 to 0.19)
-0.53 (-1.22 to 0.17)
-0.38 (-0.90 to 0.15)
-0.87 (-1.83 to 0.08)
-0.59 (-1.71 to 0.52)
-0.33 (-0.61 to -0.04)
-0.40 (-0.78 to -0.02)
-0.61 (-1.27 to 0.04)
-0.59 (-0.94 to -0.23)
-0.36 (-1.02 to 0.30)
-0.49 (-0.89 to -0.10)
-0.47 (-1.10 to 0.16)
-0.59 (-1.39 to 0.22)
-0.44 (-1.04 to 0.17)
-0.61 (-1.12 to -0.10)
-0.54 (-0.95 to -0.14)
0.13 (-1.12 to 1.37)
-0.49 (-0.87 to -0.11)
P value
0.14
0.14
0.16
0.07
0.30
0.02
0.04
0.06
0.001
0.28
0.01
0.14
0.15
0.16
0.02
0.009
0.20
Diastolic blood pressureSystolic blood pressure
Table 1.3. Breastfeeding and blood pressure in later life: Random-effects meta-analyses by subgroups

20 EVIDENCE ON THE LONG-TERM EFFECTS OF BREASTFEEDING: SYSTEMATIC REVIEWS AND META-ANALYSES
Concentrations of total cholesterol and LDL
cholesterol (low-density lipoprotein) are impor-
tant risk factors for coronary heart disease (80).
It has been suggested that total cholesterol and
LDL cholesterol may be programmed by early
life exposures, such as rapid early growth (81)
and infant feeding (82).
Biological plausibility
The cholesterol content is markedly higher in
breastmilk than in most commercially available
formulas. High cholesterol intake in infancy may
have a long-term programming effect on syn-
thesis of cholesterol by down-regulation of he-
patic hydroxymethylglutaryl coenzyme A (HMG-
CoA) (83). This hypothesis is supported by stud-
ies with animals, which showed that early expo-
sure to increased levels of cholesterol is associ-
ated with decreased cholesterol levels at a later
age. Indeed, Devlin et al (84) reported that
HMG-CoA reductase was higher (P < .05) in
formula-fed than in milk-fed piglets, whereas LDL
receptor mRNA was not independent of early
diet. HMG-CoA is the rate-limiting enzyme in
synthesis of cholesterol from acetate, and HMG-
CoA reductase inhibitors, the so-called statins,
have an important cholesterol-lowering effect
(85).
Therefore, nutritional programming by the
high cholesterol content of breastmilk has been
proposed as a potential mechanism for the as-
sociation between breastfeeding duration dur-
ing infancy and lower cholesterol levels in later
ages.
Specific methodological issues
General methodological issues affecting studies
of the long-term consequences of breastfeeding
were addressed in the Introduction. An addi-
tional issue affecting studies of cholesterol lev-
els is that four studies included in their
multivariate analyses an adjustment for weight,
body mass index or ponderal index measured at
the same time as cholesterol levels. Had
breastfeeding been associated with adult weight,
adjustment for the latter would lead to an un-
derestimation of its true effect on cholesterol.
However, as discussed in the review on the long-
term effects of breastfeeding on blood pressure,
the evidence suggests that the effect of
breastfeeding on adult weight is weak, and there-
fore one would not expect an adjustment for weight
to change the association with cholesterol.
Overview of the evidence
A previous meta-analysis (82) on this associa-
tion showed that mean total cholesterol in in-
fancy was higher among those breastfed (mean
difference: 0.64; 95% CI: 0.50 to 0.79 mmol/L),
whereas among adults the total cholesterol was
lower among those who had been breastfed
(mean difference -0.18; 95% CI: -0.30 to -0.06
mmol/L).
The electronic search carried out at WHO
yielded 37 potentially relevant publications, 23
of which provided data on the mean difference
in total cholesterol between breastfed and non-
breastfed subjects. From these 23 studies, 28
estimates of total cholesterol were derived, of
which 18 included both genders and two were
gender specific. No additional studies were iden-
tified by the independent search at the Univer-
sity of Pelotas. Table 2.1 presents a description
of the studies included in the present meta-analy-
sis, and Figure 2.1 shows the distribution of the
studies’ results. There was strong evidence of
heterogeneity between studies (P = 0.003), and
the mean difference using a random-effects
model was -0.03 (95% CI: -0.10 to 0.03), sug-
gesting no overall association between
breastfeeding and cholesterol levels.
However, Table 2.2 shows marked effect
modification by age group. In adults (>19 years),
breastfed subjects had mean total cholesterol
levels 0.18 mmol/L (95% CI: 0.06 to 0.30 mmol/
L) lower than those who were bottle-fed, and
there was no heterogeneity between studies (P
= 0.86). For children and adolescents, the asso-
ciation was not significant. Figure 2.2 shows the
forest plot for studies in adults.
Other subgroup analyses were carried out.
Studies with a length of recall of breastfeeding
duration >3 years resulted in lower mean total
Review 2 - Breastfeeding and blood cholesterol in later life

21RESULTS AND DISCUSSION - REVIEW 2
Ta
ble
2.1
.Bre
ast
feedin
g a
nd b
lood c
hole
stero
l in
late
r lif
e:
studie
s in
cluded i
n t
he m
eta
-analy
sis
in a
scendin
g o
rder
of
subje
cts'
age a
t w
hic
h o
utc
om
e w
as
measu
red
Au
tho
r, y
ea
r
(re
fere
nce
)
Jo
oste
19
91
(8
6)
Miz
e 1
995 (
87)
Fre
edm
an 1
992 (
88)
Friedm
an 1
975 (
89)
Ward
1980 (
90)
Routi 1
997 (
91)
Hu
ttu
ne
n 1
98
3 (
92
)
Ela
rab
y 1
98
5 (
93
)
Pla
ncoula
ine 2
000 (
94)
Cra
wfo
rd 1
98
1 (
95
)
Ho
dg
so
n 1
97
6 (
96
)
Fom
on 1
984 (
97)
Hro
mo
do
va
19
97
(9
8)
Ow
en
20
02
(8
2)
Sin
ghal
2004 (
99)
Friedm
an 1
975 (
89)
Stu
dy d
esig
n
Co
ho
rt
Co
ho
rt
Cro
ss-s
ecti
on
al
Cro
ss-s
ecti
on
al
Cro
ss-s
ecti
on
al
Co
ho
rt
Co
ho
rt
Cro
ss-s
ecti
on
al
Cro
ss-s
ecti
on
al
Co
ho
rt
Co
ho
rt
Co
ho
rt
Co
ho
rt
Cro
ss-s
ecti
on
al
Ra
nd
om
ize
d c
on
tro
lled
tria
l
Cro
ss-s
ecti
on
al
Ye
ar
of
bir
th
of
su
bje
cts
19
81
-6
Not
sta
ted
19
72
-90
Not
sta
ted
19
74
19
90
-2
19
75
Not
sta
ted
19
81
-7
19
69
-70
19
62
-5
19
66
-71
Not
sta
ted
19
82
-6
19
82
-5
Not
sta
ted
Ag
e a
t
ch
ole
ste
rol
me
asu
rem
en
t
1 y
ea
r
1 y
ea
r
1-4
ye
ars
1.5
-2 y
ea
rs
2.5
-3 y
ea
rs
3 y
ea
rs
5 y
ea
rs
5-1
0 y
ea
rs
5-1
1 y
ea
rs
6 y
ea
rs
7-1
2 y
ea
rs
8 y
ea
rs
12
-13
ye
ars
13
-16
ye
ars
13
-16
ye
ars
15
-19
ye
ars
Co
mp
ari
so
n g
rou
ps
Exclu
siv
ely
bre
astf
ed
(n
=11
0)
vs.
Fo
rmu
la f
ed
(n
=2
01
) fo
r th
e f
irst
3
mo
nth
s
Eve
r b
rea
stf
ed
(n
=2
3)
vs.
Fo
rmu
la f
ed
fro
m b
irth
(n
=3
3)
Eve
r b
rea
stf
ed
(n
=2
23
2)
vs.
Bo
ttle
fe
d (
n=
17
96
)
Bre
astf
ed
(n
=3
1)
vs.
Bo
ttle
fe
d (
n=
55
)
Bre
astf
ed
fo
r ≥1
mo
nth
(n
=2
8)
vs.
Bo
ttle
fe
d (
n=
46
)
Bre
astm
ilk o
nly
sourc
e o
f m
ilk a
t 7 m
onth
s (
n=
295)
vs.
Form
ula
only
sourc
e o
f m
ilk a
t 7 m
onth
s (
n=
324)
Exclu
siv
ely
bre
astf
ed
fo
r 6
mo
nth
s (
n=
35
) vs.
Fo
rmu
la f
ee
din
g
sta
rte
d b
etw
ee
n 1
to
6 m
on
ths (
n=
32
)
Bre
astf
ed
fo
r >
6 m
on
ths (
n=
50
) vs.
Art
ific
ially
fe
d (
n=
50
)
Bre
astf
ed
(n
=111
) vs.
Fo
rmu
la f
ed
(n
=1
31
)
Bre
astf
ed
(n
=1
01
) vs.
Fo
rmu
la f
ed
(n
=11
8)
Exclu
siv
ely
bre
astf
ed
(n
=3
2)
vs.
Exclu
siv
ely
fo
rmu
la-f
ed
(n
=1
6)
at
3
mo
nth
s
Exclu
siv
ely
bre
astf
ed
(n
= 1
2)
vs.
Fo
rmu
la f
ed
(n
=1
0)
for
the
fir
st
3
mo
nth
s
Exclu
siv
ely
bre
astf
ed
(n
= 1
8)
vs.
Fo
rmu
la f
ed
(n
=1
0)
for
the
fir
st
3
mo
nth
s
Bre
astf
ed
(n
=7
0)
vs.
Fo
rmu
la f
ed
(1
48
)
Bre
astf
ed
(n
=7
6)
vs.
Fo
rmu
la f
ed
(1
05
)
Bre
astf
ed
(n
=4
4)
vs.
Fo
rmu
la f
ed
(n
=1
3)
Exclu
siv
ely
bre
astf
ed
(n
= 6
20
) vs.
Exclu
siv
ely
fo
rmu
la f
ed
(n
=5
42
)
for
the f
irst
3 m
onth
s
Allo
cate
d t
o b
anked b
reastm
ilk (
n=
66)
vs.
Allo
cate
d t
o p
rete
rm
form
ula
(n
=6
4)
Bre
astf
ed
(n
=8
6)
vs.
bo
ttle
fe
d (
n=
94
)
Ge
nd
er
All
All
All
All
All
All
All
All
Male
Fem
ale
All
Male
Fem
ale
Male
Fem
ale
All
All
All
All
Me
an
diffe
ren
ce
in
tota
l ch
ole
ste
rol
mm
ol/L (S
E)
-0.0
7 (
SE
0.0
9)
0.3
5 (
SE
0.2
1)
0.0
3 (
SE
0.0
2)
0.0
2 (
SE
0.1
9)
0.2
5 (
SE
0.1
3)
0.1
2 (
SE
0.0
6)
0.2
(S
E 0
.11)
-0.5
7 (
SE
0.2
1)
-0.3
(S
E 0
.13)
0 (
SE
0.1
6)
-0.0
4 (
SE
0.2
0)
0.5
4 (
SE
0.3
4)
0.2
3 (
SE
0.2
7)
-0.1
3 (
SE
0.0
9)
0.0
3 (
SE
0.1
2)
-0.0
9 (
SE
0.2
7)
-0.0
2 (
SE
0.0
4)
-0.4
(S
E 0
.20)
0.0
3 (
SE
0.2
5)
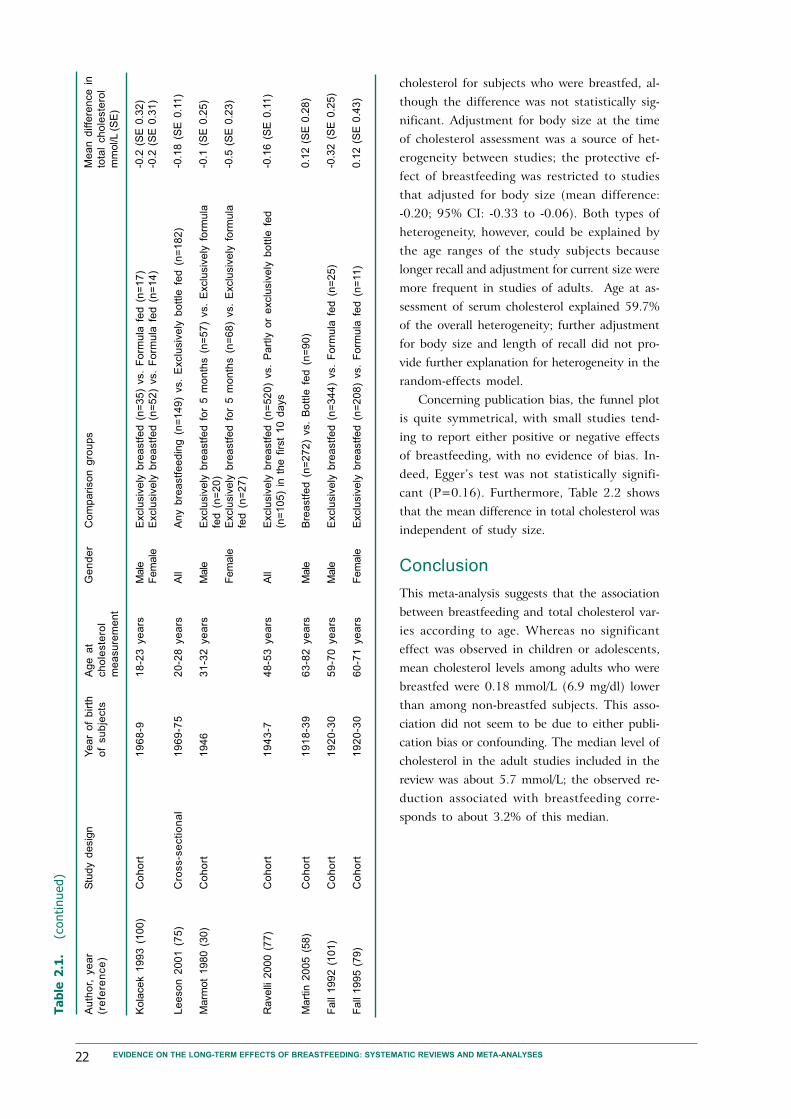
22 EVIDENCE ON THE LONG-TERM EFFECTS OF BREASTFEEDING: SYSTEMATIC REVIEWS AND META-ANALYSES
Ta
ble
2.1
.(c
onti
nued)
Au
tho
r, y
ea
r
(re
fere
nce
)
Ko
lace
k 1
99
3 (
10
0)
Le
eso
n 2
00
1 (
75
)
Marm
ot
1980 (
30)
Ravelli
2000 (
77)
Mart
in 2
005 (
58)
Fall
1992 (
101)
Fall
1995 (
79)
Stu
dy d
esig
n
Co
ho
rt
Cro
ss-s
ecti
on
al
Co
ho
rt
Co
ho
rt
Co
ho
rt
Co
ho
rt
Co
ho
rt
Ye
ar
of
bir
th
of
su
bje
cts
19
68
-9
19
69
-75
19
46
19
43
-7
19
18
-39
19
20
-30
19
20
-30
Ag
e a
t
ch
ole
ste
rol
me
asu
rem
en
t
18
-23
ye
ars
20
-28
ye
ars
31
-32
ye
ars
48
-53
ye
ars
63
-82
ye
ars
59
-70
ye
ars
60
-71
ye
ars
Ge
nd
er
Male
Fem
ale
All
Male
Fem
ale
All
Male
Male
Fem
ale
Co
mp
ari
so
n g
rou
ps
Exclu
siv
ely
bre
astf
ed
(n
=3
5)
vs.
Fo
rmu
la f
ed
(n
=1
7)
Exclu
siv
ely
bre
astf
ed
(n
=5
2)
vs.
Fo
rmu
la f
ed
(n
=1
4)
An
y b
rea
stf
ee
din
g (
n=
14
9)
vs.
Exclu
siv
ely
bo
ttle
fe
d (
n=
18
2)
Exclu
siv
ely
bre
astf
ed
fo
r 5
mo
nth
s (
n=
57
) vs.
Exclu
siv
ely
fo
rmu
la
fed
(n
=2
0)
Exclu
siv
ely
bre
astf
ed
fo
r 5
mo
nth
s (
n=
68
) vs.
Exclu
siv
ely
fo
rmu
la
fed
(n
=2
7)
Exclu
siv
ely
bre
astf
ed
(n
=5
20
) vs.
Pa
rtly
or
exclu
siv
ely
bo
ttle
fe
d
(n=
10
5)
in t
he
fir
st
10
da
ys
Bre
astf
ed
(n
=2
72
) vs.
Bo
ttle
fe
d (
n=
90
)
Exclu
siv
ely
bre
astf
ed
(n
=3
44
) vs.
Fo
rmu
la f
ed
(n
=2
5)
Exclu
siv
ely
bre
astf
ed
(n
=2
08
) vs.
Fo
rmu
la f
ed
(n
=11)
Me
an
diffe
ren
ce
in
tota
l ch
ole
ste
rol
mm
ol/L (S
E)
-0.2
(S
E 0
.32)
-0.2
(S
E 0
.31)
-0.1
8 (
SE
0.1
1)
-0.1
(S
E 0
.25)
-0.5
(S
E 0
.23)
-0.1
6 (
SE
0.1
1)
0.1
2 (
SE
0.2
8)
-0.3
2 (
SE
0.2
5)
0.1
2 (
SE
0.4
3)
cholesterol for subjects who were breastfed, al-
though the difference was not statistically sig-
nificant. Adjustment for body size at the time
of cholesterol assessment was a source of het-
erogeneity between studies; the protective ef-
fect of breastfeeding was restricted to studies
that adjusted for body size (mean difference:
-0.20; 95% CI: -0.33 to -0.06). Both types of
heterogeneity, however, could be explained by
the age ranges of the study subjects because
longer recall and adjustment for current size were
more frequent in studies of adults. Age at as-
sessment of serum cholesterol explained 59.7%
of the overall heterogeneity; further adjustment
for body size and length of recall did not pro-
vide further explanation for heterogeneity in the
random-effects model.
Concerning publication bias, the funnel plot
is quite symmetrical, with small studies tend-
ing to report either positive or negative effects
of breastfeeding, with no evidence of bias. In-
deed, Egger’s test was not statistically signifi-
cant (P=0.16). Furthermore, Table 2.2 shows
that the mean difference in total cholesterol was
independent of study size.
Conclusion
This meta-analysis suggests that the association
between breastfeeding and total cholesterol var-
ies according to age. Whereas no significant
effect was observed in children or adolescents,
mean cholesterol levels among adults who were
breastfed were 0.18 mmol/L (6.9 mg/dl) lower
than among non-breastfed subjects. This asso-
ciation did not seem to be due to either publi-
cation bias or confounding. The median level of
cholesterol in the adult studies included in the
review was about 5.7 mmol/L; the observed re-
duction associated with breastfeeding corre-
sponds to about 3.2% of this median.

23RESULTS AND DISCUSSION - REVIEW 2
Mean difference (mmol/L)
-5 -1 0 1 5
Mean lower in breastfed Mean higher in breastfed
subjects subjects
Figure 2.1. Mean difference in total cholesterol in mmol/L (and its 95% confidence interval) betweenbreastfed and non-breastfed subjects in different studies. Whether the estimate was for males(M), females (F) and all (A) is indicated in parenthesis
Jooste 1991 (A)
Mize 1995 (A)
Freedman 1992 (A)
Friedman 1975 (A)
Ward 1980 (A)
Routi 1997 (A)
Huttunen 1983 (A)
Plancoulaine 2000 (M)
Plancoulaine 2000 (F)
Crawford 1981 (A)
Hodgson 1976 (M)
Hodgson 1976 (F)
Hromodova 1997 (A)
Owen 2002 (A)
Friedman 1975 (A)
Kolacek 1993 (M)
Kolacek 1993 (F)
Leeson 2001 (A)
Marmot 1980 (M)
Marmot 1980 (F)
Ravelli 2000 (A)
Martin 2005 (A)
Fall 1992 (M)
Fall 1995 (F)
Singhal 2004 (A)
Elaraby 1985 (A)
Fomon 1984 (M)
Fomon 1984 (F)
Combined
Figure 2.2. Mean difference in total cholesterol in mmol/L (and its 95% confidence interval) betweenbreastfed and non-breastfed subjects during adult life. Whether the estimate was for males(M), females (F) and all (A) is indicated in parenthesis
Kolacek 1993 (M)
Kolacek 1993 (F)
Leeson 2001 (A)
Marmot 1980 (M)
Marmot 1980 (F)
Ravelli 2000 (A)
Martin 2005 (A)
Fall 1992 (M)
Fall 1995 (F)
Combined
Mean difference (mmol/L)
-1.5 -1 -0.5 0 0.5 1 1.5
Mean lower in breastfed Mean higher in breastfed
subjects subjects
123123123
123123
1234512345123451234512345
123123
123123123
123456123456123456123456123456 123
123123
123123123
1212
1234567812345678

24 EVIDENCE ON THE LONG-TERM EFFECTS OF BREASTFEEDING: SYSTEMATIC REVIEWS AND META-ANALYSES
Figure 2.3. Funnel plot showing mean difference in total choles-terol (mmol/L) by standard error of mean difference
-1 -0.5 0 0.5 1
0
1
2
3
4
Mean difference (mmol/L)
Sta
nd
ard
err
or
Subgroup analysis
By age group
1 to 9 years
9 to 19 years
>19 years
By study size
<300 participants
≥300 participants
By year at birth
Before 1980
After 1980
By study design
Cross-sectional
Cohort
By length of recall of breastfeeding
<3 years
≥3 years
By categorization of breastfeeding
Ever breastfed
Breastfed for a given number of months
By control for confounding
None
Adjusted for socioeconomic and
demographic variables
By control for current measure of body size
No
Yes
Total
Number of estimates
of total cholesterol
15
4
9
20
8
17
7
18
9
21
7
17
11
23
5
24
4
28
Mean difference (95%
confidence interval)
0.02 (-0.06 to 0.11)
-0.07 (-0.21 to 0.08)
-0.18 (-0.30 to -0.06)
-0.04 (-0.16 to 0.07)
-0.01 (-0.08 to 0.06)
-0.06 (-0.18 to 0.06)
-0.02 (-0.10 to 0.06)
-0.01 (-0.10 to 0.09)
-0.05 (-0.14 to 0.05)
0.00 (-0.07 to 0.08)
-0.13 (-0.27 to 0.01)
-0.07 (-0.16 to 0.01)
0.01 (-0.11 to 0.13)
-0.04 (-0.14 to 0.06)
-0.02 (-0.09 to 0.05)
-0.01 (-0.07 to 0.06)
-0.20 (-0.33 to -0.06)
-0.03 (-0.10 to 0.03)
P value
0.63
0.37
0.004
0.47
0.74
0.32
0.64
0.88
0.35
0.95
0.07
0.08
0.82
0.45
0.55
0.91
0.006
Table 2.2. Breastfeeding and blood cholesterol in later life: Random-effects meta-analyses of cho-lesterol levels by subgroup

25
It has been proposed that breastfeeding pro-
motion might be an effective way to prevent
the development of obesity (102).
Biological plausibility
Several possible biological mechanisms for a
protective effect of breastfeeding against over-
weight and obesity have been proposed.
Differences in protein intake and energy me-
tabolism may be one of the biological mecha-
nisms linking breastfeeding to later obesity.
Lower protein intake and reduced energy me-
tabolism were reported among breastfed infants
(103). Rolland-Cachera et al (104) observed that
higher protein intakes in early life, regardless of
the type of feeding, was associated with an in-
creased risk of later obesity.
Another possibility is that breastfed and for-
mula-fed infants have different hormonal re-
sponses to feeding, with formula feeding lead-
ing to a greater insulin response resulting in fat
deposition and increased number of adipocytes
(105).
Finally, limited evidence suggests that
breastfed infants adapt more readily to new foods
such as vegetables, thus reducing the caloric
density of their subsequent diets (106).
Specific methodological issues
General methodological issues affecting studies
of the long-term consequences of breastfeeding
were addressed in the Introduction. In addition,
the following methodological issues should be
taken into account when studying overweight/
obesity as the outcome.
Definition of overweight/obesityAlthough different criteria and percentiles have
been used in the definition of obesity, the re-
sults of the studies have been similar. Arenz et
al (107) reported no difference in mean effect
among studies using the 90th, 95th or 97th per-
centile to define obesity. Therefore, differences
in the definition of overweight/obesity should
not be considered as a major methodological
flaw in this meta-analysis. Existing cut-offs for
overweight/obesity will have to be reassessed in
the light of the new WHO Growth Standards.
Mean body mass index or preva-lence of overweight/obesityGrummer-Strawn suggested that breastfeeding
may be associated both with a lower prevalence
of overweight/obesity and with underweight in
later life, due to a smaller variance of weight-
related indices in subjects who were breastfed
(32). Therefore, the mean body mass index
would remain unchanged but breastfeeding
would still have an effect on the upper tail of
the body mass index distribution - that is, on
the prevalence of overweight/obesity.
Overview of existing meta-analyses
The protective effect of breastfeeding against
childhood obesity was initially proposed by
Kramer in 1981 (108). More recently, several
studies were published on this topic. We iden-
tified four systematic reviews on the relation-
ship between breastfeeding and overweight.
In 2004, Arenz et al (107) were the first to
publish a systematic review of the evidence con-
cerning the protective effect of breastfeeding
duration against childhood obesity. To be in-
cluded in their meta-analysis, the studies had
to fulfill the following criteria:
Analyses had to be adjusted for at least
three of the following possible confo-
unders: birth weight, parental overweight,
parental smoking, dietary factors, physi-
cal activity, and socioeconomic status.
Odds ratios or relative risks had to be
reported.
Age at the last follow-up had to be be-
tween 5 and 18 years.
Obesity had to be defined by body mass
index percentiles >90, 95 or 97.
Review 3 - Breastfeeding and the risk of overweight and obesityin later life

26 EVIDENCE ON THE LONG-TERM EFFECTS OF BREASTFEEDING: SYSTEMATIC REVIEWS AND META-ANALYSES
Only nine studies were included in this meta-
analysis; 19 were not eligible. The main reasons
for exclusion were failure to report adequately
adjusted estimates and a definition of obesity
that did not match the study criteria. Other
authors (see below) were more flexible in ac-
cepting different definitions of overweight, and
were able to include a larger number of studies
in their meta-analyses.
Analyses were stratified according to the fol-
lowing study characteristics: type of design, age
group, definition of breastfeeding, number of
variables included in the multivariable analysis,
and definition of obesity.
Their pooled odds ratio was 0.78 (95% CI:
0.71–0.85), and there was no sign of heteroge-
neity among the nine studies. The protective
effect of breastfeeding was independent of the
following study characteristics: study design (co-
hort or cross-sectional); age at obesity assess-
ment (<6 years or >6 years); definition of
breastfeeding (never vs. ever or other definition);
and definition of obesity (95th or 97th percen-
tile). On the other hand, the protective effect
of breastfeeding was slightly more pronounced
in studies that adjusted their estimates for less
than 7 variables (pooled odds ratio: 0.69; 95%
CI: 0.59–0.81), compared to those that adjusted
for 7 or more variables (pooled odds ratio: 0.78;
95% CI: 0.70–0.87).
The funnel plot was clearly asymmetric, with
small studies tending to report a higher protec-
tive effect of breastfeeding duration. This is a
strong suggestion of publication bias.
Owen et al published two meta-analyses. In
the first (109), the authors managed to obtain
odds ratio estimates from 28 of 61 studies re-
porting on the relationship between
breastfeeding and obesity. Unlike the Arenz
meta-analysis (107), Owen et al (109) included
studies that provided only crude odds ratios and
were flexible in terms of the definition of obes-
ity. Meta-regression analysis was used to inves-
tigate differences in the pooled odds ratio ac-
cording to study size, age group at outcome
measurement, year of birth and attrition rate,
definition of obesity, and length of recall
for information on breastfeeding duration.
Figure 3.1 shows that small studies
tended to report stronger protective effects
of breastfeeding (pooled odds ratio: 0.43;
95% CI: 0.33–0.55) than larger studies
(pooled odds ratio: 0.88; 95% CI: 0.86–
0.90).
This protective effect may be due to
confounding by socioeconomic status and
parental body composition. In developed
countries, women who breastfeed tend to
have higher socioeconomic status and may
therefore be more “nutrition-conscious”
(21). Owen et al (109) identified 6 studies
whose estimates were adjusted for the fol-
lowing confounders: socioeconomic status,
parental BMI, and maternal smoking. In
these studies, adjustment for confounding re-
duced the pooled odds ratio from 0.86 (95%
CI: 0.81–0.91) to 0.93 (95% CI: 0.88–0.99). This
suggests that at least part of the effect of
breastfeeding on body composition is due to
confounding by socioeconomic status and pa-
rental body composition, and that crude esti-
mates should not be included in the meta-analy-
sis. Even after adjustment for socioeconomic
status, the possibility of residual confounding
cannot be ruled out.
Other methodological characteristics of the
studies, such as obesity definition and maternal
recall of breastfeeding duration, were not re-
lated to differences in the studies’ results.
As in the meta-analysis by Arenz et al (107),
publication bias was evident with small studies
reporting a stronger protective effect of
Figure 3.1. Odds ratio of obesity according to study size,modified from Owen et al.
0.2
0.3
0.4
0.5
0.6
0.7
0.8
0.9
1
< 500 500 - 2500 > 2500
Number of participants
Odds o
f obesity
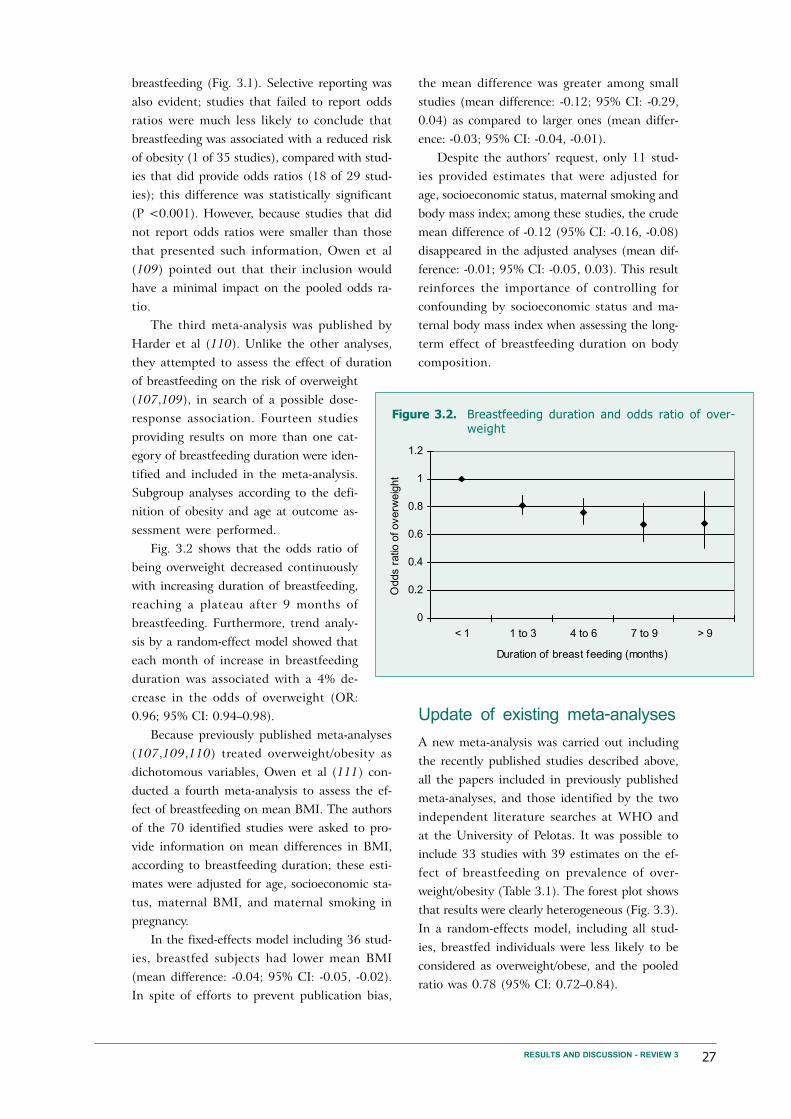
27
breastfeeding (Fig. 3.1). Selective reporting was
also evident; studies that failed to report odds
ratios were much less likely to conclude that
breastfeeding was associated with a reduced risk
of obesity (1 of 35 studies), compared with stud-
ies that did provide odds ratios (18 of 29 stud-
ies); this difference was statistically significant
(P <0.001). However, because studies that did
not report odds ratios were smaller than those
that presented such information, Owen et al
(109) pointed out that their inclusion would
have a minimal impact on the pooled odds ra-
tio.
The third meta-analysis was published by
Harder et al (110). Unlike the other analyses,
they attempted to assess the effect of duration
of breastfeeding on the risk of overweight
(107,109), in search of a possible dose-
response association. Fourteen studies
providing results on more than one cat-
egory of breastfeeding duration were iden-
tified and included in the meta-analysis.
Subgroup analyses according to the defi-
nition of obesity and age at outcome as-
sessment were performed.
Fig. 3.2 shows that the odds ratio of
being overweight decreased continuously
with increasing duration of breastfeeding,
reaching a plateau after 9 months of
breastfeeding. Furthermore, trend analy-
sis by a random-effect model showed that
each month of increase in breastfeeding
duration was associated with a 4% de-
crease in the odds of overweight (OR:
0.96; 95% CI: 0.94–0.98).
Because previously published meta-analyses
(107,109,110) treated overweight/obesity as
dichotomous variables, Owen et al (111) con-
ducted a fourth meta-analysis to assess the ef-
fect of breastfeeding on mean BMI. The authors
of the 70 identified studies were asked to pro-
vide information on mean differences in BMI,
according to breastfeeding duration; these esti-
mates were adjusted for age, socioeconomic sta-
tus, maternal BMI, and maternal smoking in
pregnancy.
In the fixed-effects model including 36 stud-
ies, breastfed subjects had lower mean BMI
(mean difference: -0.04; 95% CI: -0.05, -0.02).
In spite of efforts to prevent publication bias,
the mean difference was greater among small
studies (mean difference: -0.12; 95% CI: -0.29,
0.04) as compared to larger ones (mean differ-
ence: -0.03; 95% CI: -0.04, -0.01).
Despite the authors’ request, only 11 stud-
ies provided estimates that were adjusted for
age, socioeconomic status, maternal smoking and
body mass index; among these studies, the crude
mean difference of -0.12 (95% CI: -0.16, -0.08)
disappeared in the adjusted analyses (mean dif-
ference: -0.01; 95% CI: -0.05, 0.03). This result
reinforces the importance of controlling for
confounding by socioeconomic status and ma-
ternal body mass index when assessing the long-
term effect of breastfeeding duration on body
composition.
Update of existing meta-analyses
A new meta-analysis was carried out including
the recently published studies described above,
all the papers included in previously published
meta-analyses, and those identified by the two
independent literature searches at WHO and
at the University of Pelotas. It was possible to
include 33 studies with 39 estimates on the ef-
fect of breastfeeding on prevalence of over-
weight/obesity (Table 3.1). The forest plot shows
that results were clearly heterogeneous (Fig. 3.3).
In a random-effects model, including all stud-
ies, breastfed individuals were less likely to be
considered as overweight/obese, and the pooled
ratio was 0.78 (95% CI: 0.72–0.84).
RESULTS AND DISCUSSION - REVIEW 3
Figure 3.2. Breastfeeding duration and odds ratio of over-weight
0
0.2
0.4
0.6
0.8
1
1.2
< 1 1 to 3 4 to 6 7 to 9 > 9
Duration of breast feeding (months)
Odds r
atio
of overw
eig
ht

28 EVIDENCE ON THE LONG-TERM EFFECTS OF BREASTFEEDING: SYSTEMATIC REVIEWS AND META-ANALYSES
Ta
ble
3.1
.Bre
ast
feedin
g a
nd o
verw
eig
ht/
obesi
ty i
n l
ate
r lif
e:
studie
s in
cluded i
n t
he m
eta
-analy
sis
in a
scendin
g o
rder
of
subje
cts'
age a
t w
hic
h o
utc
om
e w
as
measu
red
Stu
dy d
esig
n
Co
ho
rt
Co
ho
rt
Ca
se
-co
ntr
ol
Co
ho
rt
Co
ho
rt
Cro
ss-s
ecti
on
al
Co
ho
rt
Co
ho
rt
Co
ho
rt
Cro
ss-s
ecti
on
al
Cro
ss-s
ecti
on
al
Co
ho
rt
Co
ho
rt
Co
ho
rt
Cro
ss-s
ecti
on
al
Cro
ss-s
ecti
on
al
Ye
ar
of
bir
th
of
su
bje
cts
Not
sta
ted
19
90
-4
19
89
-93
19
72
-3
19
95
-6
19
83
-91
19
88
-92
19
98
19
93
19
83
-87
Not
sta
ted
19
91
19
81
-4
Not
sta
ted
19
91
-2
Not
sta
ted
Ag
e m
ea
su
red
1-7
ye
ars
2-6
ye
ars
3-6
ye
ars
3 y
ea
rs
3 y
ea
rs
3-5
ye
ars
4 y
ea
rs
4 y
ea
rs
4 y
ea
rs
4-8
ye
ars
4-1
2 y
ea
rs
5 y
ea
rs
5 y
ea
rs
5 y
ea
rs
5-6
ye
ars
5-1
4 y
ea
rs
Co
mp
ari
so
n g
rou
ps
Bre
astf
ed
fo
r >
1 m
on
ths (
n=
74
1)
vs.
Bre
astf
ed
<2
we
eks
(n=
16
5)
Bre
astf
ed
fo
r ≥4
mo
nth
s v
s.
Ne
ve
r b
rea
stf
ed
(n
=9
23
)*
Bre
astf
ee
din
g v
s.
no
bre
astf
ee
din
g (
n=
46
5)*
Bre
astf
ed
fo
r >
6 m
on
ths v
s.
Ne
ve
r b
rea
stf
ed
(n
=6
77
)*
Exclu
siv
ely
bre
astf
ed
(n
=8
75
1)
vs.
Bo
ttle
fe
d a
t 6
-8
we
eks (
n=
23
44
9)
Eve
r b
rea
stf
ed
(n
=11
58
) vs.
Ne
ve
r b
rea
stf
ed
(n
=1
49
8)
Bre
astf
ed
fo
r ≥1
2 m
on
ths (
n=
29
3)
vs.
Ne
ve
r b
rea
stf
ed
(n=
70
84
)
Bre
astf
ed
fo
r ≥3
mo
nth
s (
n=
71
0)
vs.
Bre
astf
ed
fo
r <
3
mo
nth
s (
n=
74
0)
Eve
r b
rea
stf
ed
(n
=1
22
1)
vs.
Ne
ve
r b
rea
stf
ed
(n
=5
2)
Bre
astf
ed
fo
r >
9 m
on
ths (
n=
19
4)
vs.
Bre
astf
ed
<1
we
ek
(n=
50
5)
Not
sta
ted
Eve
r b
rea
stf
ed
(n
=1
24
) vs.
Ne
ve
r b
rea
stf
ed
(n
=2
3)
Eve
r b
rea
stf
ed
(n
=3
11
9)
vs.
Ne
ve
r b
rea
stf
ed
(n
=7
90
)
Eve
r b
rea
stf
ed
(n
=2
31
) vs.
Ne
ve
r b
rea
stf
ed
(n
=8
2)
Eve
r b
rea
stf
ed
(n
=5
18
4)
vs.
Ne
ve
r b
rea
stf
ed
(4
02
2)
Exclu
siv
ely
bre
astf
ed
fo
r >
12
we
eks (
n=
76
2)
vs.
Ne
ve
r
bre
astf
ed
(n
=1
95
5)
Ge
nd
er
All
All
All
All
All
All
All
All
All
All
All
All
All
All
All
All
Od
ds r
atio
(9
5%
co
nfid
en
ce
in
terv
al)
0.8
4 (
0.4
1–
1.7
2)
0.6
(0
.3–
1.3
)
1.1
8 (
0.9
1–
1.5
4)
0.8
6 (
0.4
4–
1.6
5)
0.7
2 (
0.6
5–
0.7
9)
0.6
3 (
0.4
1–
0.9
6)
0.8
4 (
0.6
2–
1.1
3)
0.7
2 (
0.6
5–
0.8
0)
1.0
(0
.7–
1.5
)
1.8
3 (
0.5
3–
6.2
8)
0.6
1 (
0.2
8–
1.3
2)
0.9
1 (
0.6
9–
1.2
1)
0.6
4 (
0.2
4–
1.7
0)
0.7
1 (
0.4
3–
1.2
5)
0.6
6 (
0.2
5–
1.7
8)
0.7
9 (
0.6
8–
0.9
3)
0.7
5 (
0.5
7–
0.9
8)
0.9
0 (
0.7
0–
1.1
0)
0.6
0 (
0.4
0–
0.9
0)
Ou
tco
me
Ob
esit
y
Ob
esit
y
Ob
esit
y
Ove
rwe
igh
t o
r
ob
esit
y
Ob
esit
y
Ove
rwe
igh
t o
nly
Ob
esit
y
Ove
rwe
igh
t o
r
ob
esit
y
Ob
esit
y
Ove
rwe
igh
t o
r
ob
esit
y
Ob
esit
y
Ob
esit
y
Ove
rwe
igh
t o
r
ob
esit
y
Ob
esit
y
Ove
rwe
igh
t o
r
ob
esit
y
Ove
rwe
igh
t o
r
ob
esit
y
Ob
esit
y
Ove
rwe
igh
t o
r
ob
esit
y
Ob
esit
y
Au
tho
r, y
ea
r (r
efe
ren
ce
)
Str
bak 1
991 (
114)
Li
2005 (
115)
He 2
000 (
116)
Poulton 2
001 (
117)
Arm
str
on
g 2
00
2 (
11
8)
Hedig
er
2001 (
119)
Gru
mm
er-
Str
aw
n 2
00
4
(32
)
Du
bo
is 2
00
6 (
12
0)
Ara
ujo
20
06
(1
21
)
Li
2003 (
122)
Ma
ffe
is 1
99
4 (
A)
(12
3)
Sca
glio
ni
20
00
(1
24
)
O'C
alla
ghan 1
997 (
125)
Bu
rde
tte
20
06
(1
26
)
Vo
n K
rie
s 1
99
9 (
12
7)
Fry
e 2
00
3 (
12
8)
* to
tal sam
ple

29
Ta
ble
3.1
.(c
onti
nued) Stu
dy d
esig
n
Co
ho
rt
Co
ho
rt
Co
ho
rt
Co
ho
rt
Co
ho
rt
Cro
ss-s
ecti
on
al
Cro
ss-s
ecti
on
al
Cro
ss-s
ecti
on
al
Co
ho
rt
Cro
ss-s
ecti
on
al
Cro
ss-s
ecti
on
al
Co
ho
rt
Co
ho
rt
Ca
se
-co
ntr
ol
Ca
se
-co
ntr
ol
Co
ho
rt
Ye
ar
of
bir
th
of
su
bje
cts
19
46
Not
sta
ted
19
90
19
91
-2
19
61
19
85
-7
19
90
19
77
-85
19
72
-3
19
73
-82
Not
sta
ted
19
82
-5
19
77
-80
Not
sta
ted
Not
sta
ted
19
79
Ag
e m
ea
su
red
6 y
ea
rs
6 y
ea
rs
6 y
ea
rs
7-8
ye
ars
8 y
ea
rs
9-1
0 y
ea
rs
9-1
2 y
ea
rs
6-1
4 y
ea
rs
11
ye
ars
9-1
8 y
ea
rs
9-1
4 y
ea
rs
1-1
4 y
ea
rs
12
-17
ye
ars
12
-18
ye
ars
12
-18
ye
ars
15
-16
ye
ars
Co
mp
ari
so
n g
rou
ps
Eve
r b
rea
stf
ed
(n
=2
87
3)
vs.
Ne
ve
r b
rea
stf
ed
(8
58
)
Bre
astf
ed
fo
r ≥6
mo
nth
s v
s.
Bre
astf
ed
fo
r <
6 m
on
ths
(n=
61
)*
Bre
astf
ed
fo
r ≥3
mo
nth
s (
n=
60
7)
vs.
Bre
astf
ed
fo
r <
3
mo
nth
s (
n=
28
0)
Exclu
siv
ely
bre
astf
ed
fo
r ≥2
mo
nth
s (
n=
22
11
) vs.
Ne
ve
r
bre
astf
ed
(n
=11
53
)
Not
sta
ted
Eve
r b
rea
stf
ed
(n
=1
75
4)
vs.
Ne
ve
r b
rea
stf
ed
(n
=3
54
)
Not
sta
ted
Eve
r b
rea
stf
ed
(n
=3
06
41
) vs.
Ne
ve
r b
rea
stf
ed
(n
=3
12
7)
Bre
astf
ed
fo
r >
6 m
on
ths v
s.
Ne
ve
r b
rea
stf
ed
(n
=5
91
)*
Bre
astf
ed
fo
r >
9 m
on
ths (
n=
67
) vs.
Bre
astf
ed
<1
we
ek
(n=
47
1)
Mo
stly o
r o
nly
bre
astf
ed
(n
=4
51
0)
vs.
Mo
stly o
r o
nly
form
ula
fe
d (
n=
22
48
)
Bre
astf
ed
fo
r ≥4
mo
nth
s v
s.
Ne
ve
r b
rea
stf
ed
(n
=7
49
)*
Bre
astf
ed
fo
r >
2 m
on
ths (
n=
73
) vs.
Bre
astf
ed
fo
r ≤2
mo
nth
s (
n=
63
)
Eve
r b
rea
stf
ed
(n
=4
5)
vs.
Ne
ve
r b
rea
stf
ed
(2
84
)
Eve
r b
rea
stf
ed
(n
=6
0)
vs.
Ne
ve
r b
rea
stf
ed
(3
32
)
Bre
astf
ed
fo
r >
2 m
on
ths (
n=
39
0)
vs.
Bre
astf
ed
fo
r ≤2
mo
nth
s (
n=
39
1)
Ge
nd
er
All
Male
All
All
All
All
All
All
All
All
All
All
All
All
All
All
Od
ds r
atio
(9
5%
co
nfid
en
ce
in
terv
al)
0.9
4 (
0.7
3–
1.2
0)
0.8
8 (
0.5
9–
1.3
2)
0.3
3 (
0.1
3–
0.8
3)
0.5
3 (
0.3
1–
0.8
9)
0.4
6 (
0.2
3–
0.9
2)
1.2
2 (
0.8
7–
1.7
1)
0.4
2 (
0.1
1–
1.6
1)
0.6
6 (
0.5
2–
0.8
7)
0.4
5 (
0.2
7–
0.7
8)
0.8
0 (
0.7
1–
0.9
0)
0.8
0 (
0.6
6–
0.9
6)
0.3
6 (
0.1
–1
.28
)
0.7
3 (
0.2
3–
2.2
7)
0.9
5 (
0.8
4–
1.0
7)
0.7
8 (
0.6
6–
0.9
1)
0.6
(0
.3–
1.6
)
0.5
1 (
0.2
2–
1.1
6)
0.4
4 (
0.2
1–
0.9
3)
0.2
9 (
0.1
1–
0.7
3)
0.6
6 (
0.4
4–
0.9
8)
Ou
tco
me
Ove
rwe
igh
t o
nly
Ob
esit
y
Ove
rwe
igh
t o
r
ob
esit
y
Ove
rwe
igh
t o
nly
Ob
esit
y
Ob
esit
y
Ob
esit
y
Ove
rwe
igh
t o
r
ob
esit
y
Ove
rwe
igh
t o
r
ob
esit
y
Ove
rwe
igh
t o
r
ob
esit
y
Ob
esit
y
Ove
rwe
igh
t
Ob
esit
y
Ove
rwe
igh
t o
nly
Ob
esit
y
Ob
esit
y
Ove
rwe
igh
t
Ob
esit
y
Ob
esit
y
Ove
rwe
igh
t o
r
ob
esit
y
Au
tho
r, y
ea
r (r
efe
ren
ce
)
Wa
dsw
ort
h 1
99
9 (
12
9)
Th
ors
do
ttir
20
03
(1
30
)
Be
rgm
an
n 2
00
3 (
13
1)
Reill
y 2
005 (
132)
Eid
1970 (
133)
Lie
se
20
01
(1
34
)
Su
ng
20
03
(A
) (1
35
)
To
sch
ke
20
02
(1
36
)
Poulton 2
001 (
117)
Li
2003 (
122)
Gill
man 2
001 (
137)
Li
2005 (
115)
Elli
ott
1997 (
138)
Kra
me
r 1
98
1 (
10
8)
Kra
me
r 1
98
1 (
10
8)
Tulld
ahl
1999 (
139)
* to
tal sam
ple
RESULTS AND DISCUSSION - REVIEW 3

30 EVIDENCE ON THE LONG-TERM EFFECTS OF BREASTFEEDING: SYSTEMATIC REVIEWS AND META-ANALYSES
Ta
ble
3.1
.(c
onti
nued) Stu
dy d
esig
n
Co
ho
rt
Co
ho
rt
Co
ho
rt
Co
ho
rt
Co
ho
rt
Co
ho
rt
Ye
ar
of
bir
th
of
su
bje
cts
19
82
19
72
-3
19
66
19
58
19
57
-9
19
34
-44
Ag
e m
ea
su
red
18
ye
ars
21
ye
ars
31
-35
ye
ars
33
ye
ars
Ad
ult l
ife
56
-66
ye
ars
Co
mp
ari
so
n g
rou
ps
Bre
astf
ed
fo
r ≥1
mo
nth
(n
=4
89
) vs.
Bre
astf
ed
fo
r <
1
month
(n=
1666)
Bre
astf
ed
fo
r >
6 m
on
ths v
s.
Ne
ve
r b
rea
stf
ed
(n
=6
87
)*
Bre
astf
ed
fo
r ≥4
mo
nth
s (
n=
12
1)
vs.
Ne
ve
r b
rea
stf
ed
(n=
78
)
Bre
astf
ed
fo
r >
1 m
on
th v
s.
Ne
ve
r b
rea
stf
ed
(n
=4
66
2)
*
Bre
astf
ed
fo
r >
1 m
on
th v
s.
Ne
ve
r b
rea
stf
ed
(n
=4
62
5)
*
Eve
r b
rea
stf
ed
(n
=1
99
9)
vs.
Ne
ve
r b
rea
stf
ed
(n
=3
86
)
Bre
astf
ed
fo
r >
8 m
on
ths (
n=
98
6)
vs.
Bre
astf
ed
fo
r <
2
mo
nth
s (
n=
60
7)
Ge
nd
er
Male
s
All
All
Male
s
Fem
ale
s
All
All
Od
ds r
atio
(9
5%
co
nfid
en
ce
in
terv
al)
0.7
3 (
0.5
0–
1.0
7)
0.7
9 (
0.4
6–
1.3
4)
0.6
4 (
0.3
3–
1.2
6)
0.3
4 (
0.1
2–
1.0
1)
0.9
3 (
0.7
4–
1.1
7)
0.8
4 (
0.6
7–
1.0
5)
0.7
3 (
0.5
1–
1.0
7)
1.1
0 (
0.8
8–
1.3
7)
Ou
tco
me
Ob
esit
y
Ove
rwe
igh
t
Ove
rwe
igh
t o
r
ob
esit
y
Ob
esit
y
Ob
esit
y
Ob
esit
y
Ob
esit
y
Ob
esit
y
Au
tho
r, y
ea
r (r
efe
ren
ce
)
Vic
tora
20
03
(1
40
)
Poulton 2
001 (
117)
Kva
avik
20
05
(1
41
)
Pa
rso
ns 2
00
3 (
14
2)
Ric
hte
r 1
98
1 (
14
3)
Eri
ksso
n 2
00
3 (
14
4)
* to
tal sam
ple
Table 3.2 shows that there was no marked
effect modification by age group, year at birth,
control of confounding, categories of breastfeed-
ing duration, study setting, study design, and
control for confounding variables. On the other
hand, the study’s outcome was related to het-
erogeneity between studies.
Concerning publication bias, the funnel plot
is quite asymmetrical, with small studies tend-
ing to report a higher protective effect of
breastfeeding. Indeed, Table 3.2 shows that the
protective effect of breastfeeding was higher
among small studies (<500 participants). How-
ever, studies with 500-1500 and >1500 partici-
pants had similar protective effects, which were
also similar to the pooled protective effect of
all studies.
Eight studies provided odds ratios for more
than one outcome, such as overweight only (e.g.
BMI 25-29.9), overweight plus obesity (e.g. BMI
>25) and obesity (e.g. BMI >30). Six of these
eight studies reported a more marked protec-
tive effect against obesity than against over-
weight only or overweight plus obesity. This sup-
ports a causal effect of breastfeeding.
Relevant studies not included inthe meta-analyses
A frequent limitation of observational studies
is inadequate adjustment for confounding by
socioeconomic and maternal variables. In the
absence of randomized studies, within-family
analyses allow controlling for confounding by
socioeconomic, maternal variables, as well as self-
selection bias. Gillman et al (112) analysed data
from 5614 sibling sets from the Growing Up
Today Study to assess the association of
breastfeeding with adolescent obesity within
sibling sets. The overall odds of overweight in
that study were smaller among subjects breastfed
for at least 7 months, compared with those
breastfed for 3 months or less (OR: 0.85; 95%
CI: 0.71–1.00). When the analyses were limited
to the 172 families in which one sibling was
breastfed for at least 7 months and another for
3 months or less, the resulting odds ratio was
similar to that of the overall analyses OR: 0.89;
95% CI: 0.50–1.59), but the upper 95% confi-
dence limit was well above the unity (1). This
similarity between the results obtained in the

31RESULTS AND DISCUSSION - REVIEW 3
total sample and those from the siblings study
suggests that confounding by socioeconomic
status was not an important issue in this study.
However, because heterogeneity in breastfeeding
durations among siblings is much smaller than
for unrelated individuals, the effective sample
size for the within-family analysis was quite small
leading to less precise estimates. Another within-
family analysis from the United States (113)
found no association between breastfeeding
duration and prevalence of obesity.
Odds ratio of overweight/obesit
0.1 0.5 1 2 5 10
Favours breastfeeding Favours not breastfeeding
Figure 3.3. Odds ratio and its 95% confidence interval of being considered as overweight/obese, compar-ing breastfed vs. non-breastfed subjects in different studies. Whether the estimate was formales (M), females (F) and all (A) is indicated in parenthesis
Strbak 1991 (A)
He 2000 (A)
Poulton 2001 (A)
Armstrong 2002 (A)
Hediger 2001 (A)
Grummer-Strawn 2004 (A)
Li 2003 (A)
Li 2003 (A)
Scaglioni 2000 (A)
O'Callaghan 1997 (A)
Von Kries 1999 (A)
Frye 2003 (A)
Wadsworth 1999 (A)
Bergmann 2003 (A)
Li 2005 (A)
Li 2005 (A)
Dubois 2006 (A)
Araujo 2006 (A)
Maffeis 1994 (A)
Burdette 2006 (A)
Reilly 2005 (A)
Eid 1970 (A)
Liese 2001 (A)
Sung 2003 (A)
Toschke 2002 (A)
Poulton 2001 (A)
Gillman 2001 (A)
Elliott 1997 (A)
Kramer 1981 (A)
Kramer 1981 (A)
Tulldahl 1999 (A)
Victora 2003 (A)
Poulton 2001 (A)
Kvaavik 2005 (A)
Parsons 2003 (M)
Parsons 2003 (F)
Richter 1981 (A)
Eriksson 2003 (A)
Thorsdottir 2003 (M)
Combined
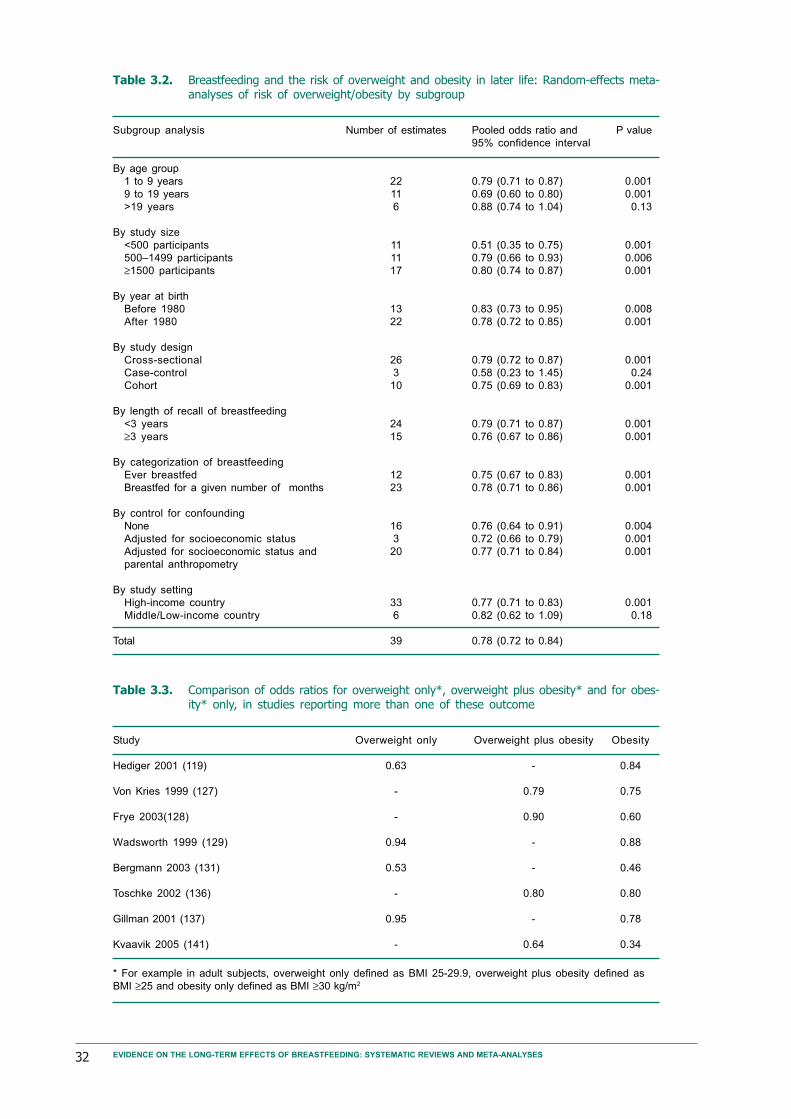
32 EVIDENCE ON THE LONG-TERM EFFECTS OF BREASTFEEDING: SYSTEMATIC REVIEWS AND META-ANALYSES
Subgroup analysis
By age group
1 to 9 years
9 to 19 years
>19 years
By study size
<500 participants
500–1499 participants
≥1500 participants
By year at birth
Before 1980
After 1980
By study design
Cross-sectional
Case-control
Cohort
By length of recall of breastfeeding
<3 years
≥3 years
By categorization of breastfeeding
Ever breastfed
Breastfed for a given number of months
By control for confounding
None
Adjusted for socioeconomic status
Adjusted for socioeconomic status and
parental anthropometry
By study setting
High-income country
Middle/Low-income country
Total
Number of estimates
22
11
6
11
11
17
13
22
26
3
10
24
15
12
23
16
3
20
33
6
39
Pooled odds ratio and
95% confidence interval
0.79 (0.71 to 0.87)
0.69 (0.60 to 0.80)
0.88 (0.74 to 1.04)
0.51 (0.35 to 0.75)
0.79 (0.66 to 0.93)
0.80 (0.74 to 0.87)
0.83 (0.73 to 0.95)
0.78 (0.72 to 0.85)
0.79 (0.72 to 0.87)
0.58 (0.23 to 1.45)
0.75 (0.69 to 0.83)
0.79 (0.71 to 0.87)
0.76 (0.67 to 0.86)
0.75 (0.67 to 0.83)
0.78 (0.71 to 0.86)
0.76 (0.64 to 0.91)
0.72 (0.66 to 0.79)
0.77 (0.71 to 0.84)
0.77 (0.71 to 0.83)
0.82 (0.62 to 1.09)
0.78 (0.72 to 0.84)
P value
0.001
0.001
0.13
0.001
0.006
0.001
0.008
0.001
0.001
0.24
0.001
0.001
0.001
0.001
0.001
0.004
0.001
0.001
0.001
0.18
Table 3.2. Breastfeeding and the risk of overweight and obesity in later life: Random-effects meta-analyses of risk of overweight/obesity by subgroup
Study
Hediger 2001 (119)
Von Kries 1999 (127)
Frye 2003(128)
Wadsworth 1999 (129)
Bergmann 2003 (131)
Toschke 2002 (136)
Gillman 2001 (137)
Kvaavik 2005 (141)
Overweight only
0.63
-
-
0.94
0.53
-
0.95
-
Overweight plus obesity
-
0.79
0.90
-
-
0.80
-
0.64
Obesity
0.84
0.75
0.60
0.88
0.46
0.80
0.78
0.34
Table 3.3. Comparison of odds ratios for overweight only*, overweight plus obesity* and for obes-ity* only, in studies reporting more than one of these outcome
* For example in adult subjects, overweight only defined as BMI 25-29.9, overweight plus obesity defined as
BMI ≥25 and obesity only defined as BMI ≥30 kg/m2

33
Conclusion
The evidence suggests that breastfeed-
ing may have a small protective effect
on the prevalence of obesity. In spite
of the evidence of publication bias, a
protective effect of breastfeeding was
still observed among the larger studies
(>1500 participants), suggesting that
this association was not due to publi-
cation bias. With respect to confound-
ing, studies that controlled for socio-
economic status and parental anthro-
pometry also reported that breastfeed-
ing was associated with a lower preva-
lence of obesity. This effect seems to
be more important against obesity
than against overweight.
Because the great majority of the
published studies were conducted in
Western Europe and North America, we are not
able to assess whether this association is present
in low and middle-income settings.
RESULTS AND DISCUSSION - REVIEW 3
Figure 3.4. Funnel plot showing odds ratio for overweight/obes-ity by standard error of odds ratio
1 2 3
0
0.2
0.4
0.6
0.8
Odds ratio (log scale)S
tan
da
rd e
rro
r

34 EVIDENCE ON THE LONG-TERM EFFECTS OF BREASTFEEDING: SYSTEMATIC REVIEWS AND META-ANALYSES
Biological plausibility
Two possible mechanisms for a protective ef-
fect of breastfeeding against type-2 diabetes have
been proposed.
Baur et al (145) observed that the fasting
glucose level was inversely correlated to long-
chain polyunsaturated fatty acids in skeletal
muscle membranes. Because long-chain polyun-
saturated fatty acids are present in breastmilk,
but not in most brands of formula (49), it has
been postulated that changes in skeletal muscle
membrane would play a role in the development
of insulin resistance, leading to compensatory
hyperinsulinaemia. Over a period of time there
would be β-cell failure, resulting in the occur-
rence of type-2 diabetes (146).
Several studies (105,147,148) reported that
formula-fed infants have higher basal and post-
prandial concentrations of insulin and
neurotensin, which modulates insulin and glu-
cagon release. These differences may lead to the
earlier development of insulin resistance and
type-2 diabetes.
These are possible mechanisms for an asso-
ciation between breastfeeding and diabetes.
Other biological mechanisms may also exist,
which are presently unknown.
Overview of the evidence
The two independent literature searches carried
out at WHO and at the University of Pelotas
identified five papers that assessed the associa-
tion between breastfeeding duration and type-2
diabetes.
Pettitt et al (149) followed a cohort of Pima
Indians born between 1950 and 1978. Informa-
tion on infant feeding was provided by mothers
in 1978. The odds ratio for type-2 diabetes be-
tween subjects who were exclusively breastfed
in the first two months and those who were
exclusively bottle-fed was 0.41 (95% CI: 0.18–
0.93).
Ravelli et al (77) studied a cohort of sub-
jects who were born between 1943 and 1947 in
a university hospital in Amsterdam. Informa-
tion on infant feeding at hospital discharge was
collected from the medical records. The odds
ratio for type-2 diabetes was 0.51 (95% CI: 0.3–
0.9), comparing exclusively breastfed subjects
with those who were partially or exclusively
bottle-fed.
Young et al (150) assessed the role of prena-
tal and early infancy risk factors for type-2 dia-
betes among native Canadians. Forty-six cases
were recruited from the only clinical centre for
the treatment of diabetes in the province of
Manitoba. Two controls were chosen for each
case, from a paediatric clinic. Mean ages were
14.0 years for the cases and 12.7 years for con-
trols. The odds ratio for type-2 diabetes between
subjects who were breastfed for >6 months and
those breastfed for <6 months was 0.36 (95%
CI: 0.13–0.99).
Martin et al (58) studied a cohort of sub-
jects recruited in 16 centres in England and Scot-
land, who participated in a 1-week survey of
diet and health when aged <20 years between
1937 and 1939. Information on breastfeeding
duration was obtained from the subjects’ moth-
ers. At a mean age of 71 years, breastfeeding
was not associated with type-2 diabetes (odds
ratio: 0.97; 95% CI: 0.41–2.30).
Rich-Edwards et al (151) studied a cohort
of registered nurses in the US, who had been
followed since 1976. Information on occurrence
of diabetes was reported by the subjects them-
selves. Prevalence of diabetes was lower among
breastfed (4%) compared to non-breastfed (5%)
subjects.
These five studies were included in a meta-
analysis. The pooled odds ratio was 0.63 (95%
CI: 0.45–0.89). Fig. 4.1 shows the forest plot
for this analysis.
Other relevant studies not in-cluded in the meta-analysis
Lawlor et al (60) evaluated a random sample of
schoolchildren aged 9 and 15 years from Esto-
nia and Denmark. Insulin resistance was esti-
mated according to the homeostasis model as-
sessment (HOMA), based on fasting glucose and
insulin levels. Information on infant feeding was
collected from the parents at the time of the
Review 4 - Breastfeeding and the risk of type-2 diabetes
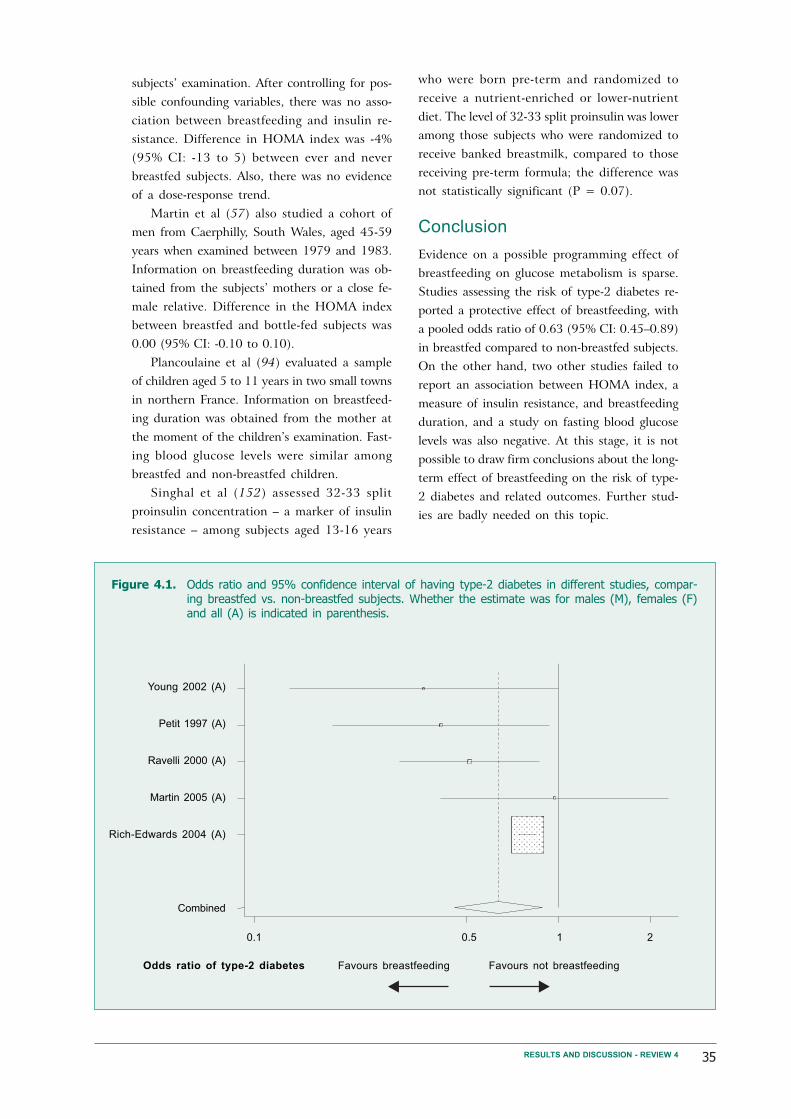
35
subjects’ examination. After controlling for pos-
sible confounding variables, there was no asso-
ciation between breastfeeding and insulin re-
sistance. Difference in HOMA index was -4%
(95% CI: -13 to 5) between ever and never
breastfed subjects. Also, there was no evidence
of a dose-response trend.
Martin et al (57) also studied a cohort of
men from Caerphilly, South Wales, aged 45-59
years when examined between 1979 and 1983.
Information on breastfeeding duration was ob-
tained from the subjects’ mothers or a close fe-
male relative. Difference in the HOMA index
between breastfed and bottle-fed subjects was
0.00 (95% CI: -0.10 to 0.10).
Plancoulaine et al (94) evaluated a sample
of children aged 5 to 11 years in two small towns
in northern France. Information on breastfeed-
ing duration was obtained from the mother at
the moment of the children’s examination. Fast-
ing blood glucose levels were similar among
breastfed and non-breastfed children.
Singhal et al (152) assessed 32-33 split
proinsulin concentration – a marker of insulin
resistance – among subjects aged 13-16 years
who were born pre-term and randomized to
receive a nutrient-enriched or lower-nutrient
diet. The level of 32-33 split proinsulin was lower
among those subjects who were randomized to
receive banked breastmilk, compared to those
receiving pre-term formula; the difference was
not statistically significant (P = 0.07).
Conclusion
Evidence on a possible programming effect of
breastfeeding on glucose metabolism is sparse.
Studies assessing the risk of type-2 diabetes re-
ported a protective effect of breastfeeding, with
a pooled odds ratio of 0.63 (95% CI: 0.45–0.89)
in breastfed compared to non-breastfed subjects.
On the other hand, two other studies failed to
report an association between HOMA index, a
measure of insulin resistance, and breastfeeding
duration, and a study on fasting blood glucose
levels was also negative. At this stage, it is not
possible to draw firm conclusions about the long-
term effect of breastfeeding on the risk of type-
2 diabetes and related outcomes. Further stud-
ies are badly needed on this topic.
RESULTS AND DISCUSSION - REVIEW 4
Figure 4.1. Odds ratio and 95% confidence interval of having type-2 diabetes in different studies, compar-ing breastfed vs. non-breastfed subjects. Whether the estimate was for males (M), females (F)and all (A) is indicated in parenthesis.
Young 2002 (A)
Petit 1997 (A)
Ravelli 2000 (A)
Martin 2005 (A)
Rich-Edwards 2004 (A)
Combined
Odds ratio of type-2 diabetes
0.1 0.5 1 2
Favours breastfeeding Favours not breastfeeding

36 EVIDENCE ON THE LONG-TERM EFFECTS OF BREASTFEEDING: SYSTEMATIC REVIEWS AND META-ANALYSES
Biological plausibility
Long-chain polyunsaturated fatty acids are
present in breastmilk, but not in most brands
of formula (49). These fatty acids are preferen-
tially incorporated into neural cell membranes;
structural lipids constitute about 60% of the
human brain. The major lipid components in-
clude docosahexaenoic (DHA) and arachidonic
(AA) acids (153), which are important for reti-
nal and cortical brain development (154). Bjerve
et al (155) reported that the results of the Bayley
mental and psychomotor development indexes
correlated positively with serum DHA concen-
trations.
AA and DHA accumulate in the brain and
retina most rapidly during the last trimester of
pregnancy and the first months after birth (156).
Their reserves are limited at birth, especially in
pre-term infants, and decline rapidly when lack-
ing in the diet (157). Bottle-fed infants have
been shown to have lower long-chain polyun-
saturated fatty acids in the phospholipids of the
cerebral cortex than infants who are fed
breastmilk (158). This is, therefore, a potential
mechanism for an effect of breastfeeding on in-
tellectual development.
In addition to the chemical properties of
breastmilk, breastfeeding enhances the bonding
between mother and child (159, 160), which may
contribute to the child’s intellectual develop-
ment.
Specific methodological issues
General methodological issues were addressed
in the Introduction. Two points deserve special
attention. Because cognition and performance
in intelligence tests are positively related to the
stimulation received by the child (161) and be-
cause breastfeeding mothers may be more prone
to stimulating their children (162), studies as-
sessing the long-term consequences of
breastfeeding on intellectual performance should
attempt to control for the quantity and quality
of stimulation. In addition, in societies where
breastfeeding is more common among upper
social groups, the possibility of confounding by
parental education level has to be addressed.
Overview of the evidence
We identified three meta-analyses that assessed
the relationship between breastfeeding duration
and performance in intelligence tests.
In 1999, Anderson et al (163) were the first
to publish a meta-analysis on this topic, em-
ploying the following selection criteria:
the study included a comparison between
subjects who were mostly breastfed with
those who were mostly bottle-fed;
the outcome was measured with a widely
applied test of cognitive development or
ability, yielding a single score;
subjects were examined between infancy
and adolescence.
The studies were considered as including con-
trol for confounding if the estimates were ad-
justed for a minimum of five variables, from a
list of 15 potential confounders.
Eleven studies were included in their analy-
ses. In a random-effects model, the adjusted
mean difference in cognitive function was of
3.16 (95% CI: 2.35 to 3.98) points in favour of
breastfed subjects. The effect of breastfeeding
was not modified by age at measurement. The
benefit of breastfeeding was higher among low
birthweight infants (mean difference: 5.18
points; 95% CI: 3.59 to 6.77) although a sig-
nificant effect was also observed among normal
birthweight subjects (mean difference: 2.66
points; 95% CI: 2.15 to 3.17).
In 2000, Drane et al (164) carried out a sec-
ond systematic review. Articles had to fulfil the
following criteria:
subjects had to be born between 1960
and 1998;
cognition had to be measured by using
standard tests;
Review 5 - Breastfeeding and school achievement/intelligencelevels
37
breastfeeding had to be measured as a
categorical variable (exclusively breastfed,
partially breastfed, exclusively formula-
fed) or as a “continuous variable” (dura-
tion of exclusive breastfeeding or propor-
tion of the diet as breastmilk);
analyses had to be adjusted for socioeco-
nomic status and birth weight, at least.
Twenty-four studies including subjects born
between 1960 and 1998 were identified, but
only five (165-169) fulfilled the three methodo-
logical pre-requisites. Another study (170),
which met two standards (confounding and cog-
nition assessment) and partially met the stand-
ard for breastfeeding measurement, was also
included. Four of these studies reported a posi-
tive effect of breastfeeding on cognitive devel-
opment, particularly for low-birthweight sub-
jects.
In 2002, Jain et al (171) published a third
review. Inclusion was restricted to studies pub-
lished in English, and each study was assessed
for the following methodological aspects: study
design, sample size, target population, quality
of feeding data, control of susceptibility bias,
blinding and outcome measures. Of the 40 stud-
ies identified, only nine met all criteria for qual-
ity of the feeding data; the breastfed group was
specified as those who mostly breastfed, infor-
mation on infant feeding was collected in in-
fancy and by interviewing the mother or from
health records, and duration of breastfeeding
was of at least 1 month among the breastfed
subjects. Only two of these nine studies pre-
sented estimates adjusted for socioeconomic
status and stimulation at home, and their re-
sults were conflicting. Wigg et al (172) reported
that, after controlling for socioeconomic status
and quality of the child’s environment, breastfed
subjects presented a small advantage in the
Wechsler Intelligence Scale for Children at
11-13 years of age (mean difference: 0.8; 95%
CI: -1.9 to 3.5 points). Johnson et al (173) re-
ported that the adjusted difference between
breastfed and non-breastfed 3-year-olds in the
Stanford-Binet Composite IQ Scale was 5.0
points (95% CI: 0.3 to 9.5), while in the Peabody
Picture Vocabulary Test the difference was 4.6
points (95% CI: 0.7 to 8.5). Seven other stud-
ies controlled for both socioeconomic status and
stimulation/interaction of the child but did not
fulfil the remaining methodological criteria.
Three of these studies reported that perform-
ance in the intelligence test was higher among
breastfed subjects (165,174,175), whereas four
failed to show an association (162,176-178).
Given the conflicting results from high-quality
studies, the authors stated that the evidence on
the effect of breastfeeding on cognition was not
convincing.
A very important study that was included
in the meta-analyses carried out by Anderson
et al (163) and by Drane et al (164) was a
randomized trial by Lucas et al (167), in which
newborn pre-term babies received breastmilk
or formula, and a significant improvement in
WISC-R was found in the former. Because of
the randomized design, these differences are not
likely to be due to confounding.
Update of existing meta-analysis
Jain and colleagues (171) restricted their inter-
pretation to whether or not the study results
had been significant. They did not discuss the
direction of the effect in non-significant stud-
ies, nor did they try to pool the results in a
meta-analysis. We carried out a meta-analysis
including these papers, as well as three more
recent articles identified in our own systematic
review. According to the criteria proposed by
Jain and colleagues, all estimates were adjusted
for stimulation at home and fulfilled the other
quality criteria. Studies restricted to very low
birthweight infants were not included. The three
additional studies are described below.
Quinn et al (179) studied a cohort of 7357
singleton children whose mothers had been en-
rolled in the Mater Hospital-University of
Queensland Study of Pregnancy. Information on
breastfeeding duration was obtained from the
mother when the child was six months old. At
five years, 4049 children were assessed with the
Peabody Picture Vocabulary Test Revised
(PPVT-R). Breastfeeding duration was positively
associated with the PPVT-R score, and after con-
trolling for confounding by socioeconomic sta-
tus, birthweight, and stimulation in the home,
the mean score for children breastfed for six
RESULTS AND DISCUSSION - REVIEW 5
38 EVIDENCE ON THE LONG-TERM EFFECTS OF BREASTFEEDING: SYSTEMATIC REVIEWS AND META-ANALYSES
months or more was 8.2 (95% CI: 6.5 to 9.9)
points higher for females and 5.8 (95% CI: 4.1
to 7.5) points higher for males, when compared
to those never breastfed.
Clark et al (180) followed a cohort of chil-
dren born between 1991 and 1996 in urban com-
munities near Santiago, Chile, who were enrolled
in a study on prevention of iron deficiency in
healthy full-term infants. At six months, the in-
fants were randomly assigned to receive iron
supplementation. At five years, information from
784 (62.6%) subjects was gathered. Children
breastfed for <2 months or >8 months had lower
scores for language, motor and cognition tests
than those breastfed for 2-8 months, after ad-
justment for socioeconomic factors and home
stimulation.
Angelsen et al (181) reported from Norway
that the odds of having a low total intelligence
quotient at five years of age was higher among
those children breastfed for <3 months com-
pared to those breastfed for at least 6 months
(odds ratio: 1.5; 95% CI: 1.0–2.1).
Because the Chilean and Norwegian studies
did not provide results in terms of means scores,
they were not included in the meta-analyses. Fig.
5.1 shows that the eight studies observed a ben-
eficial effect from breastfeeding, which was sta-
tistically significant in six of them. Because het-
erogeneity among studies was statistically sig-
nificant, a random-effects model was used. In
the pooled analysis, performance in intelligence
tests was higher among those subjects who had
been breastfed (mean difference: 4.9; 95% CI:
2.97 to 6.92). Given the small number of stud-
ies, it was not possible to assess publication bias.
Studies on breastfeeding andschooling
Our systematic review resulted in only three
studies on the relationship between breastfeed-
ing and achieved schooling. Horwood &
Fergusson (168) studied adolescents from
Christchurch, New Zealand, who had been fol-
lowed since birth. Even after controlling for con-
founding by socioeconomic status and perina-
tal variables (birthweight, birth order, and ma-
ternal smoking in pregnancy), increased
breastfeeding duration was positively associated
with academic performance in high-school leav-
ing examinations. A lower percentage of chil-
dren left high school without qualifications in
the group breastfed for >8 months (14%) as
compared to those breastfed for 4–7 months
(16.4%), <4 months (19.2%), and not breastfed
(22.2%) (overall P <0.05).
Richards et al (182) reported from the Brit-
ish 1946 birth cohort that the odds ratio for
obtaining an advanced educational qualification
by the age of 26 years was directly associated
with breastfeeding duration, showing a dose-
response relationship. The odds of obtaining an
advanced educational qualification were 1.58
(95% CI: 1.15–2.18) times higher among those
subjects who were breastfed for more than seven
months, compared with those who were never
breastfed.
Breastfeeding was also associated with in-
creased achieved schooling among Brazilian ado-
lescents who had been followed-up since birth
(183). In the adjusted analyses, there was an
increase in schooling with breastfeeding dura-
tion up to 12 months. Subjects breastfed for 9-
11 months had achieved 8.0 (95% CI: 7.5–8.5)
years of schooling, while those breastfed for less
than one month had 7.2 (95% CI: 6.9–7.6) years.
Children breastfed for 12 or more months at-
tained on average 7.7 (95% CI: 7.3–8.0) years.
This association is unlikely to be explained by
residual confounding by socioeconomic status.
In this population, there was no strong associa-
tion between breastfeeding and social class, and
the poorest children were those breastfed for
over one year. In addition, a stratified analysis
showed that breastfeeding was associated with
increased schooling within all strata of family
income.
Conclusion
This meta-analysis suggests that breastfeeding
is associated with increased cognitive develop-
ment in childhood, in studies that controlled
for confounding by socioeconomic status and
stimulation at home. The practical implications
of a relatively small increase in the performance
in developmental tests in childhood may be
open to debate. However, evidence from the only
three studies on school performance in late ado-

39
lescence or young adulthood suggests that
breastfeeding is also positively associated with
educational attainment (168,182,183).
The issue remains of whether the associa-
tion is related to the properties of breastmilk
itself, or whether breastfeeding enhances the
bonding between mother and child, and thus
RESULTS AND DISCUSSION - REVIEW 5
contributes to intellectual development. Al-
though in observational studies it is not possi-
ble to disentangle these two effects, the posi-
tive results from the randomized trial carried
out by Lucas et al (167) suggest that the nutri-
tional properties of breastmilk alone seem to
have an effect.
Johnson (A) 1996
Morrow-Tlucak (A) 1988
Rogers (A) 1978
Jacobson (A) 1992
Lucas (A) 1992
Wigg (A) 1998
Quinn (M) 2001
Quinn (F) 2001
Combined
Mean difference
-2 -1 0 1 2 3 4 5 6 7 8 9 10 15
Mean lower in breastfed Mean higher in breastfed
subjects subjects
Figure 5.1. Mean difference in cognitive development scores and its 95% confidence interval betweenbreastfed and non-breastfed subjects in different studies. Whether the estimate was for males(M), females (F) and all (A) is indicated in parenthesis

40 EVIDENCE ON THE LONG-TERM EFFECTS OF BREASTFEEDING: SYSTEMATIC REVIEWS AND META-ANALYSES
The available evidence suggests that breastfeed-
ing may have long-term benefits. Subjects who
had been breastfed were found to have a lower
mean blood pressure and lower total cholesterol,
and showed higher performance in intelligence
tests. Furthermore, the prevalence of overweight/
obesity and type-2 diabetes was lower among
breastfed subjects. All effects were statistically
significant, but for some outcomes their mag-
nitude was relatively modest.
The Table 6.1 summarizes the magnitude of
the effects of breastfeeding based on the five
meta-analyses described above. For all outcomes,
except performance in intelligence tests, we pro-
vide a comparison of these effects with those
observed for other public health interventions.
For blood pressure, the effect of breastfeeding
was smaller than those derived from other pub-
lic health interventions targeted at adults, such
as dietary advice, physical activity, salt restric-
tion, and multiple risk factor interventions. On
the other hand, for total cholesterol among
adults, the magnitude of the breastfeeding ef-
VI. Conclusions
fect was similar to that of dietary advice in
adulthood. Similarly, for the prevention of type-
2 diabetes, the magnitude was similar to that
of diet and physical activity. Concerning obes-
ity, whereas Summerbell et al (184) reported
that combined dietary education and physical
activity interventions were not effective in re-
ducing childhood obesity and overweight, we
noticed that breastfeeding was associated with
a 22% reduction in the prevalence of overweight/
obesity.
This Table is intended for illustrative pur-
poses only. It should be interpreted with cau-
tion because it includes a comparison of the
effect of actual interventions – none of them
with perfect compliance levels – with the gross
difference of the effect between breastfed and
non-breastfed subjects, which corresponds to an
intervention with 100% compliance. Only the
long-term follow-up of subjects involved in
breastfeeding trials will provide a more accu-
rate estimate of the impact of breastfeeding
promotion.
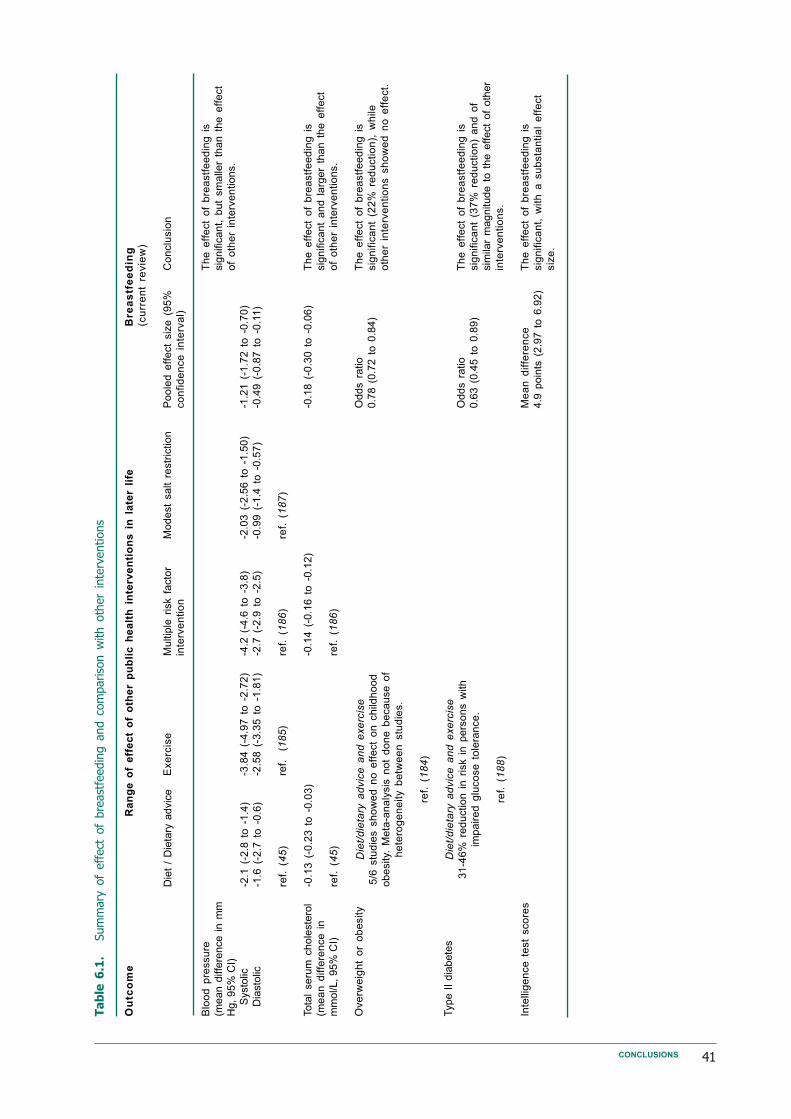
41CONCLUSIONS
Ta
ble
6.1
.Sum
mary
of
eff
ect
of
bre
ast
feedin
g a
nd c
om
pariso
n w
ith o
ther
inte
rventions
Die
t /
Die
tary
advic
e
-2.1
(-2
.8 t
o -
1.4
)
-1.6
(-2
.7 t
o -
0.6
)
ref.
(4
5)
-0.1
3 (
-0.2
3 t
o -
0.0
3)
ref.
(4
5)
Exe
rcis
e
-3.8
4 (
-4.9
7 t
o -
2.7
2)
-2.5
8 (
-3.3
5 t
o -
1.8
1)
ref.
(1
85
)
Mu
ltip
le r
isk f
acto
r
inte
rve
ntio
n
-4.2
(-4
.6 t
o -
3.8
)
-2.7
(-2
.9 t
o -
2.5
)
ref.
(1
86
)
-0.1
4 (
-0.1
6 t
o -
0.1
2)
ref.
(1
86
)
Po
ole
d e
ffe
ct
siz
e (
95
%
co
nfid
en
ce
in
terv
al)
-1.2
1 (
-1.7
2 t
o -
0.7
0)
-0.4
9 (
-0.8
7 t
o -
0.1
1)
-0.1
8 (
-0.3
0 t
o -
0.0
6)
Od
ds r
atio
0.7
8 (
0.7
2 t
o 0
.84)
Od
ds r
atio
0.6
3 (
0.4
5 t
o 0
.89)
Me
an
diffe
ren
ce
4.9
poin
ts (
2.9
7 t
o 6
.92)
Mo
de
st
sa
lt r
estr
ictio
n
-2.0
3 (
-2.5
6 t
o -
1.5
0)
-0.9
9 (
-1.4
to
-0
.57
)
ref.
(1
87
)
Ou
tco
me
Blo
od
pre
ssu
re
(mean d
iffe
rence i
n m
m
Hg,
95%
CI)
S
ysto
lic
D
iasto
lic
Tota
l se
rum
ch
ole
ste
rol
(me
an
diffe
ren
ce
in
mm
ol/L, 95%
CI)
Ove
rwe
igh
t o
r o
be
sity
Type I
I dia
bete
s
Inte
llig
en
ce
te
st
sco
res
Die
t/d
ieta
ry a
dvic
e a
nd
exe
rcis
e
5/6
stu
die
s s
ho
we
d n
o e
ffe
ct
on
ch
ildh
oo
d
ob
esity.
Me
ta-a
na
lysis
no
t d
on
e b
eca
use
of
he
tero
ge
ne
ity b
etw
ee
n s
tud
ies.
ref.
(1
84
)
Die
t/d
ieta
ry a
dvic
e a
nd
exe
rcis
e
31
-46
% r
ed
uctio
n i
n r
isk i
n p
ers
on
s w
ith
imp
air
ed
glu
co
se
to
lera
nce
.
ref.
(1
88
)
Ra
ng
e o
f e
ffe
ct
of
oth
er
pu
bli
c h
ea
lth
in
terv
en
tio
ns
in
la
ter
life
Bre
as
tfe
ed
ing
(cu
rre
nt
revie
w)
Co
nclu
sio
n
Th
e e
ffe
ct
of
bre
astf
ee
din
g i
s
sig
nific
an
t, b
ut
sm
alle
r th
an
th
e e
ffe
ct
of
oth
er
inte
rve
ntio
ns.
Th
e e
ffe
ct
of
bre
astf
ee
din
g i
s
sig
nific
an
t a
nd
la
rge
r th
an
th
e e
ffe
ct
of
oth
er
inte
rve
ntio
ns.
Th
e e
ffe
ct
of
bre
astf
ee
din
g i
s
sig
nific
an
t (2
2%
re
du
ctio
n),
wh
ile
oth
er
inte
rve
ntio
ns s
ho
we
d n
o e
ffe
ct.
Th
e e
ffe
ct
of
bre
astf
ee
din
g i
s
sig
nific
an
t (3
7%
re
du
ctio
n)
an
d o
f
sim
ilar
magnitude t
o t
he e
ffect
of
oth
er
inte
rve
ntio
ns.
Th
e e
ffe
ct
of
bre
astf
ee
din
g i
s
sig
nific
an
t, w
ith
a s
ub
sta
ntia
l e
ffe
ct
siz
e.
42 EVIDENCE ON THE LONG-TERM EFFECTS OF BREASTFEEDING: SYSTEMATIC REVIEWS AND META-ANALYSES
References
1. WHO Collaborative Study Team on the
Role of Breastfeeding on the Prevention
of Infant Mortality. Effect of breastfeed-
ing on infant and child mortality due to
infectious diseases in less developed
countries: a pooled analysis. Lancet, 2000,
355(9202):451-5.
2. Kramer MS, Kakuma R. The optimal du-
ration of exclusive breastfeeding: a sys-
tematic review. Advances in Experimental
Medicine and Biology, 2004, 554:63-77.
3. World Health Organization. Global Strat-
egy for Infant and Young Child Feeding, The
Optimal Duration of Exclusive Breastfeeding.
Geneva, World Health Organization,
2001.
4. World Health Organization and UNICEF.
Protecting, Promoting and Supporting Breast-
feeding: The Special Role of Maternity Services.
Geneva, World Health Organization,
1989.
5. Barker DJP. Fetal and infant origins of adult
disease. London, BMJ Publishing, 1992.
6. Rich-Edwards JW et al. Birth weight and
risk of cardiovascular disease in a cohort
of women followed up since 1976. British
Medical Journal, 1997, 315(7105):396-400.
7. Newsome CA et al. Is birth weight re-
lated to later glucose and insulin metabo-
lism? A systematic review. Diabetic Medi-
cine, 2003, 20(5):339-48.
8. Horta BL et al. Early and late growth and
blood pressure in adolescence. Journal of
Epidemiology and Community Health, 2003,
57(3):226-30.
9. Joseph KS, Kramer MS. Review of the
evidence on fetal and early childhood
antecedents of adult chronic disease. Epi-
demiologic Reviews, 1996, 18(2):158-74.
10. Lucas A, Fewtrell MS, Cole TJ. Fetal ori-
gins of adult disease - the hypothesis re-
visited. British Medical Journal, 1999,
319(7204):245-9.
11. Lucas A. Programming by early nutrition
in man. Ciba Foundation Symposium, 1991,
156:38-55.
12. Gluckman PD, Hanson MA. Living with
the past: evolution, development, and
patterns of disease. Science, 2004,
305(5691):1733-6.
13. Chalmers I. Unbiased, relevant, and reli-
able assessments in health care: impor-
tant progress during the past century, but
plenty of scope for doing better. British
Medical Journal, 1998, 317(7167):1167-8.
14. Altman DG et al. The revised CONSORT
statement for reporting randomized tri-
als: explanation and elaboration. Annals
of Internal Medicine, 2001, 134(8):663-94.
15. Lucas A et al. Multicentre trial on feed-
ing low birthweight infants: effects of diet
on early growth. Archives of Disease in Child-
hood, 1984, 59(8):722-30.
16. Kramer MS et al. Promotion of
Breastfeeding Intervention Trial
(PROBIT): a randomized trial in the
Republic of Belarus. The Journal of the
American Medical Association, 2001,
285(4):413-20.
17. Concato J, Shah N, Horwitz RI.
Randomized, controlled trials, observa-
tional studies, and the hierarchy of re-
search designs. New England Journal of
Medicine, 2000, 342(25):1887-92.
18. Victora CG et al. The Pelotas birth co-
hort study, Rio Grande do Sul, Brazil,
1982-2001. Cadernos de Saude Publica,
2003, 19(5):1241-56.

43
19. Huttly SR et al. Do mothers overesti-
mate breast feeding duration? An exam-
ple of recall bias from a study in south-
ern Brazil. American Journal of Epidemiology,
1990, 132(3):572-5.
20. World Health Organization. Contemporary
patterns of breastfeeding. Report on the WHO
Collaborative Study on Breastfeeding. Geneva,
World Health Organization, 1981.
21. Bauchner H, Leventhal JM, Shapiro ED.
Studies of breastfeeding and infections.
How good is the evidence? The Journal of
the American Medical Association,
1986,256(7):887-92.
22. Horta BL et al. [Breastfeeding and feed-
ing patterns in two cohorts of children
in southern Brazil: trends and differ-
ences]. Cadernos de Saude Publica, 1996, 12
(Supplement 1):43-48.
23. Victora CG et al. The role of conceptual
frameworks in epidemiological analysis:
a hierarchical approach. International Jour-
nal of Epidemiology, 1997, 26(1):224-7.
24. Thompson SG. Why sources of hetero-
geneity in meta-analysis should be inves-
tigated. British Medical Journal, 1994,
309(6965):1351-5.
25. Barr SI et al. Effects of increased con-
sumption of fluid milk on energy and
nutrient intake, body weight, and cardio-
vascular risk factors in healthy older
adults. Journal of the American Dietetic Asso-
ciation, 2000, 100(7):810-7.
26. Fomon S. Infant feeding in the 20th cen-
tury: formula and beikost. The Journal of
Nutrition, 2001, 131(2):409S-20S.
27. Promislow JH, Gladen BC, Sandler DP.
Maternal recall of breastfeeding duration
by elderly women. American Journal of Epi-
demiology, 2005, 161(3):289-96.
28. Eaton-Evans J, Dugdale AE. Recall by
mothers of the birth weights and feed-
ing of their children. Human Nutrition
Applied Nutrition, 1986, 40(3):171-5.
29. Kark JD et al. Validity of maternal report-
ing of breast feeding history and the asso-
ciation with blood lipids in 17 year olds in
Jerusalem. Journal of Epidemiology and Com-
munity Health, 1984, 38(3):218-25.
30. Marmot MG et al. Effect of breast-feed-
ing on plasma cholesterol and weight in
young adults. Journal of Epidemiology and
Community Health, 1980, 34(3):164-7.
31. Kuh D et al. Life course epidemiology.
Journal of Epidemiology and Community
Health, 2003, 57(10):778-83.
32. Grummer-Strawn LM, Mei Z. Does
breastfeeding protect against pediatric
overweight? Analysis of longitudinal data
from the Centers for Disease Control and
Prevention Pediatric Nutrition Surveillance
System. Pediatrics, 2004, 113(2):e81-6.
33. Egger M, Smith GD. Bias in location and
selection of studies. British Medical Jour-
nal, 1998, 316(7124):61-6.
34. Greenland S. Quantitative methods in the
review of epidemiologic literature. Epide-
miologic Reviews, 1987, 9:1-30.
35. DerSimonian R, Laird N. Meta-analysis
in clinical trials. Controlled Clinical Trials,
1986, 7(3):177-88.
36. Normand SL. Meta-analysis: formulating,
evaluating, combining, and reporting.
Statistics in Medicine, 1999, 18(3):321-59.
37. Egger M et al. Bias in meta-analysis de-
tected by a simple, graphical test. British
Medical Journal, 1997, 315(7109):629-34.
38. Begg CB, Mazumdar M. Operating char-
acteristics of a rank correlation test for
publication bias. Biometrics, 1994,
50(4):1088-101.
39. Sterne JA, Gavaghan D, Egger M. Publi-
cation and related bias in meta-analysis:
power of statistical tests and prevalence
in the literature. Journal of Clinical Epide-
miology, 2000, 53(11):1119-29.
40. Berkey CS et al. A random-effects regres-
sion model for meta-analysis. Statistics in
Medicine, 1995, 14(4):395-411.
REFERENCES
44 EVIDENCE ON THE LONG-TERM EFFECTS OF BREASTFEEDING: SYSTEMATIC REVIEWS AND META-ANALYSES
41. Greenland S. Invited commentary: a criti-
cal look at some popular meta-analytic
methods. American Journal of Epidemiology,
1994, 140(3):290-6.
42. Lawes CM et al. Blood pressure and car-
diovascular disease in the Asia Pacific
region. Journal of Hypertension, 2003,
21(4):707-16.
43. Boulanger JM, Hill MD. Hypertension and
stroke: 2005 Canadian Hypertension
Educational Program recommendations.
The Canadian Journal of Neurological Sciences,
2005, 32(4):403-8.
44. Forsen T et al. Growth in utero and dur-
ing childhood among women who develop
coronary heart disease: longitudinal study.
British Medical Journal, 1999,
319(7222):1403-7.
45. Brunner EJ et al. Dietary advice for re-
ducing cardiovascular risk. Cochrane Da-
tabase of Systematic Reviews, 2005(4):
CD002128.
46. Whitten CF, Stewart RA. The effect of
dietary sodium in infancy on blood pres-
sure and related factors. Studies of in-
fants fed salted and unsalted diets for five
months at eight months and eight years
of age. Acta Paediatrica Scandinavica Supple-
ment, 1980, 279:1-17.
47. Singhal A, Cole TJ, Lucas A. Early nutri-
tion in preterm infants and later blood
pressure: two cohorts after randomised
trials. Lancet, 2001, 357(9254):413-9.
48. Geleijnse JM et al. Long-term effects of
neonatal sodium restriction on blood
pressure. Hypertension, 1997, 29(4):913-7.
49. Koletzko B et al. Long chain polyunsatu-
rated fatty acids (LC-PUFA) and perina-
tal development. Acta Paediatrica, 2001,
90(4):460-4.
50. Engler MM et al. The effects of a diet
rich in docosahexaenoic acid on organ
and vascular fatty acid composition in
spontaneously hypertensive rats.
Prostaglandins, Leukotrienes, and Essential Fatty
Acids, 1999, 61(5):289-95.
51. Morris MC, Sacks F, Rosner B. Does fish
oil lower blood pressure? A meta-analy-
sis of controlled trials. Circulation, 1993,
88(2):523-33.
52. Forsyth JS et al. Long chain polyunsatu-
rated fatty acid supplementation in in-
fant formula and blood pressure in later
childhood: follow up of a randomised
controlled trial. British Medical Journal,
2003, 326(7396):953.
53. Perry IJ, Whincup PH, Shaper AG. Envi-
ronmental factors in the development of
essential hypertension. British Medical
Bulletin, 1994, 50(2):246-59.
54. Owen CG et al. Effect of breast feeding in
infancy on blood pressure in later life: sys-
tematic review and meta-analysis. British
Medical Journal, 2003, 327(7425):1189-95.
55. Martin RM, Gunnell D, Smith GD.
Breastfeeding in infancy and blood pres-
sure in later life: systematic review and
meta-analysis. American Journal of Epidemi-
ology, 2005, 161(1):15-26.
56. Martin RM et al. Does breastfeeding in
infancy lower blood pressure in child-
hood? The Avon Longitudinal Study of
Parents and Children (ALSPAC). Circula-
tion, 2004, 109(10):1259-66.
57. Martin RM et al. Breastfeeding and car-
diovascular disease risk factors, incidence,
and mortality: the Caerphilly study. Jour-
nal of Epidemiology and Community Health,
2005, 59(2):121-9.
58. Martin RM et al. Breastfeeding and
atherosclerosis: intima-media thickness
and plaques at 65-year follow-up of the
Boyd Orr cohort. Arteriosclerosis, Throm-
bosis, and Vascular Biology, 2005,
25(7):1482-8.
59. Lawlor DA et al. Associations of paren-
tal, birth, and early life characteristics
with systolic blood pressure at 5 years of
age: findings from the Mater-University
study of pregnancy and its outcomes.
Circulation, 2004, 110(16):2417-23.
45
60. Lawlor DA et al. Infant feeding and com-
ponents of the metabolic syndrome: find-
ings from the European Youth Heart
Study. Archives of Disease in Childhood, 2005,
90(6):582-8.
61. Horta BL et al. Breastfeeding duration and
blood pressure among Brazilian adolescents.
Acta Paediatrica, 2006, 95(3):325-31.
62. Boulton J. Nutrition in childhood and its
relationships to early somatic growth,
body fat, blood pressure, and physical fit-
ness. Acta Paediatrica Scandinavica Supple-
ment, 1981, 284:1-85.
63. Smith RE et al. Determinants of blood
pressure in Sowetan infants. South Afri-
can Medical Journal, 1995, 85(12 Pt 2):
1339-42.
64. Zeman J, Simkova M. [Blood pressure
values in infants and young children in
relation to the duration of breast feed-
ing]. Ceskoslovenská pediatrie, 1981,
36(10):593-4.
65. Baranowski T et al. Height, infant-feed-
ing practices and cardiovascular function-
ing among 3 or 4 year old children in
three ethnic groups. Journal of Clinical Epi-
demiology, 1992, 45(5):513-8.
66. Whincup PH, Cook DG, Shaper AG.
Early influences on blood pressure: a
study of children aged 5-7 years. British
Medical Journal, 1989, 299(6699):587-91.
67. Williams S, St George IM, Silva PA. In-
trauterine growth retardation and blood
pressure at age seven and eighteen. Jour-
nal of Clinical Epidemiology, 1992,
45(11):1257-63.
68. Wilson AC et al. Relation of infant diet
to childhood health: seven year follow up
of cohort of children in Dundee infant
feeding study. British Medical Journal, 1998,
316(7124):21-5.
69. Lucas A, Morley R. Does early nutrition
in infants born before term programme
later blood pressure? British Medical Jour-
nal, 1994, 309(6950):304-8.
70. Rona RJ, Qureshi S, Chinn S. Factors re-
lated to total cholesterol and blood pres-
sure in British 9 year olds. Journal of Epi-
demiology and Community Health, 1996,
50(5):512-18.
71. Esposito-Del Puente A et al. Familial and
environmental influences on body com-
position and body fat distribution in
childhood in southern Italy. International
Journal of Obesity and Related Metabolic Dis-
orders, 1994, 18(9):596-601.
72. Butler NR et al. Recent findings from the
1970 child health and education study: pre-
liminary communication. Journal of the Royal
Society of Medicine, 1982, 75(10):781-4.
73. Taittonen L et al. Prenatal and postnatal
factors in predicting later blood pressure
among children: cardiovascular risk in
young Finns. Pediatric Research, 1996,
40(4):627-32.
74. Kolacek S, Kapetanovic T, Luzar V. Early
determinants of cardiovascular risk fac-
tors in adults. B. Blood pressure. Acta
Paediatrica, 1993, 82(4):377-82.
75. Leeson CP et al. Duration of breast feed-
ing and arterial distensibility in early
adult life: population based study. British
Medical Journal, 2001, 322(7287):643-7.
76. Martin RM et al. Infant nutrition and
blood pressure in early adulthood: the
Barry Caerphilly Growth study. The Ameri-
can Journal of Clinical Nutrition, 2003,
77(6):1489-97.
77. Ravelli AC et al. Infant feeding and adult
glucose tolerance, lipid profile, blood pres-
sure, and obesity. Archives of Disease in Child-
hood, 2000, 82(3):248-52.
78. Wadsworth ME. Follow-up of the first na-
tional birth cohort: findings from the Medi-
cal Research Council National Survey of
Health and Development. Paediatric and Peri-
natal Epidemiology, 1987, 1(1):95-117.
79. Fall CH et al. Fetal and infant growth and
cardiovascular risk factors in women.
British Medical Journal, 1995, 310(6977):
428-32.
REFERENCES
46 EVIDENCE ON THE LONG-TERM EFFECTS OF BREASTFEEDING: SYSTEMATIC REVIEWS AND META-ANALYSES
80. Law MR, Wald NJ, Thompson SG. By how
much and how quickly does reduction in
serum cholesterol concentration lower
risk of ischaemic heart disease? British
Medical Journal, 1994, 308(6925):367-72.
81. Lauren L et al. Relationship between
birthweight and blood lipid concentra-
tions in later life: evidence from the ex-
isting literature. International Journal of
Epidemiology, 2003, 32(5):862-76.
82. Owen CG et al. Infant feeding and blood
cholesterol: a study in adolescents and a
systematic review. Pediatrics, 2002,
110(3):597-608.
83. Wong WW et al. Effect of dietary cho-
lesterol on cholesterol synthesis in breast-
fed and formula-fed infants. Journal of Li-
pid Research, 1993, 34(8):1403-11.
84. Devlin AM et al. Early diet influences
hepatic hydroxymethyl glutaryl coenzyme
A reductase and 7alpha-hydroxylase
mRNA but not low-density lipoprotein
receptor mRNA during development.
Metabolism, 1998, 47(1):20-6.
85. LaRosa JC, He J, Vupputuri S. Effect of
statins on risk of coronary disease: a
meta-analysis of randomized controlled
trials. The Journal of the American Medical
Association, 1999, 282(24):2340-6.
86. Jooste PL et al. Effect of breastfeeding
on the plasma cholesterol and growth of
infants. Journal of Pediatric Gastroenterology
and Nutrition, 1991, 13(2):139-42.
87. Mize CE et al. Lipoprotein-cholesterol
responses in healthy infants fed defined
diets from ages 1 to 12 months: com-
parison of diets predominant in oleic acid
versus linoleic acid, with parallel obser-
vations in infants fed a human milk-based
diet. Journal of Lipid Research, 1995,
36(6):1178-87.
88. Freedman DS, Lee SL, Byers T, Kuester S,
Sell KI. Serum cholesterol levels in a
multiracial sample of 7,439 preschool
children from Arizona. Preventive Medicine,
1992, 21(2):162-76.
89. Friedman G, Goldberg SJ. Concurrent and
subsequent serum cholesterol of breast-
and formula-fed infants. The American Jour-
nal of Clinical Nutrition, 1975, 28(1):42-5.
90. Ward SD et al. Determinants of plasma
cholesterol in children – a family study.
The American Journal of Clinical Nutrition,
1980, 33(1):63-70.
91. Routi T et al. Tracking of serum lipopro-
tein (a) concentration and its contribu-
tion to serum cholesterol values in chil-
dren from 7 to 36 months of age in the
STRIP Baby Study. Special Turku Coro-
nary Risk Factor Intervention Project for
Babies. Annals of Medicine, 1997,
29(6):541-7.
92. Huttunen JK et al. Fat composition of
the infant diet does not influence subse-
quent serum lipid levels in man. Athero-
sclerosis, 1983, 46(1):87-94.
93. Elaraby II EDMK, Aref GH. Effect of
breast vs. humanized milk on concurrent
and subsequent serum cholesterol levels.
Saudi Medical Journal, 1985, 6:480-3.
94. Plancoulaine S et al. Infant feeding pat-
terns are related to blood cholesterol
concentration in prepubertal children
aged 5-11 y: the Fleurbaix-Laventie Ville
Sante study. European Journal of Clinical
Nutrition, 2000, 54(2):114-9.
95. Crawford PB et al. Serum cholesterol of
6-year-olds in relation to environmental
factors. Journal of the American Dietetic As-
sociation, 1981, 78(1):41-6.
96. Hodgson PA et al. Comparison of serum
cholesterol in children fed high, moder-
ate, or low cholesterol milk diets during
neonatal period. Metabolism, 1976,
25(7):739-46.
97. Fomon SJ et al. Indices of fatness and
serum cholesterol at age eight years in
relation to feeding and growth during
early infancy. Pediatric Research, 1984,
18(12):1233-8.

47
98. Hromadova M et al. Relationship be-
tween the duration of the breastfeeding
period and the lipoprotein profile of chil-
dren at the age of 13 years. Physiological
Research, 1997, 46(1):21-5.
99. Singhal A et al. Breastmilk feeding and
lipoprotein profile in adolescents born
preterm: follow-up of a prospective
randomised study. Lancet, 2004,
363(9421):1571-8.
100. Kolacek S et al. Early determinants of
cardiovascular risk factors in adults. A.
Plasma lipids. Acta Paediatrica, 1993,
82(8):699-704.
101. Fall CH et al. Relation of infant feeding
to adult serum cholesterol concentration
and death from ischaemic heart disease.
British Medical Journal, 1992, 304(6830):
801-5.
102. Gillman MW. Breast-feeding and obesity. The
Journal of Pediatrics, 2002, 141(6):749-50.
103. Whitehead RG. For how long is exclusive
breastfeeding adequate to satisfy the dietary
energy needs of the average young baby?
Pediatric Research, 1995, 37(2):239-43.
104. Rolland-Cachera MF et al. Influence of
macronutrients on adiposity develop-
ment: a follow up study of nutrition and
growth from 10 months to 8 years of age.
International Journal of Obesity and Related
Metabolic Disorders, 1995, 19(8):573-8.
105. Lucas A et al. Breast vs. bottle: endocrine
responses are different with formula feed-
ing. Lancet, 1980, 1(8181):1267-9.
106. Birch LL, Fisher JO. Development of eat-
ing behaviors among children and ado-
lescents. Pediatrics, 1998, 101(3 Part
2):539-49.
107. Arenz S et al. Breastfeeding and child-
hood obesity – a systematic review. Inter-
national Journal of Obesity and Related Meta-
bolic Disorders, 2004, 28(10):1247-56.
108. Kramer MS. Do breastfeeding and de-
layed introduction of solid foods protect
against subsequent obesity? The Journal
of Pediatrics, 1981, 98(6):883-7.
109. Owen CG et al. Effect of infant feeding
on the risk of obesity across the life
course: a quantitative review of published
evidence. Pediatrics, 2005, 115(5):1367-77.
110. Harder T et al. Duration of breastfeeding
and risk of overweight: a meta-analysis.
American Journal of Epidemiology, 2005,
162(5):397-403.
111. Owen CG et al. The effect of breastfeed-
ing on mean body mass index through-
out life: a quantitative review of published
and unpublished observational evidence.
The American Journal of Clinical Nutrition,
2005, 82(6):1298-307.
112. Gillman MW et al. Breastfeeding and
overweight in adolescence. Epidemiology,
2006, 17(1):112-4.
113. Nelson MC, Gordon-Larsen P, Adair LS.
Are adolescents who were breastfed less
likely to be overweight? Analyses of sib-
ling pairs to reduce confounding. Epide-
miology, 2005, 16(2):247-53.
114. Strbak V et al. Late effects of breastfeed-
ing and early weaning: seven-year prospec-
tive study in children. Endocrine Regula-
tions, 1991, 25(1-2):53-7.
115. Li C, Kaur H et al. Additive interactions
of maternal prepregnancy BMI and
breastfeeding on childhood overweight.
Obesity Research, 2005, 13(2):362-71.
116. He Q et al. Risk factors of obesity in
preschool children in China: a population-
based case-control study. International Jour-
nal of Obesity and Related Metabolic Disor-
ders, 2000, 24(11):1528-36.
117. Poulton R, Williams S. Breastfeeding and
risk of overweight. The Journal of the Ameri-
can Medical Association, 2001,
286(12):1449-50.
118. Armstrong J, Reilly JJ. Breastfeeding and
lowering the risk of childhood obesity.
Lancet, 2002, 359(9322):2003-4.
119. Hediger ML et al. Association between
infant breastfeeding and overweight in
young children. The Journal of the American
Medical Association, 2001, 285(19):2453-60.
REFERENCES
48 EVIDENCE ON THE LONG-TERM EFFECTS OF BREASTFEEDING: SYSTEMATIC REVIEWS AND META-ANALYSES
120. Dubois L, Girard M. Early determinants
of overweight at 4.5 years in a popula-
tion-based longitudinal study. International
Journal of Obesity (London), 2006,
30(4):610-7.
121. Araujo CL et al. Breastfeeding and over-
weight in childhood: evidence from the
Pelotas 1993 birth cohort study. Interna-
tional Journal of Obesity (London), 2006,
30(3):500-6.
122. Li L, Parsons TJ, Power C. Breastfeeding
and obesity in childhood: cross sectional
study. British Medical Journal, 2003,
327(7420):904-5.
123. Maffeis C et al. Parental and perinatal
factors associated with childhood obes-
ity in north-east Italy. International Journal
of Obesity and Related Metabolic Disorders,
1994, 18(5):301-5.
124. Scaglioni S et al. Early macronutrient
intake and overweight at five years of age.
International Journal of Obesity and Related
Metabolic Disorders, 2000, 24(6):777-81.
125. O’Callaghan MJ et al. Prediction of obes-
ity in children at 5 years: a cohort study.
Journal of Paediatrics and Child Health, 1997,
33(4):311-6.
126. Burdette HL et al. Breastfeeding, introduc-
tion of complementary foods, and adipos-
ity at 5 y of age. The American Journal of Clinical
Nutrition, 2006, 83(3):550-8.
127. von Kries R et al. Breastfeeding and obes-
ity: cross sectional study. British Medical
Journal, 1999, 319(7203):147-50.
128. Frye C, Heinrich J. Trends and predictors
of overweight and obesity in East Ger-
man children. International Journal of Obes-
ity and Related Metabolic Disorders, 2003,
27(8):963-9.
129. Wadsworth M et al. Breastfeeding and
obesity. Relation may be accounted for
by social factors. British Medical Journal,
1999, 319(7224):1576.
130. Thorsdottir I, Gunnarsdottir I, Palsson
GI. Association of birth weight and
breast-feeding with coronary heart dis-
ease risk factors at the age of 6 years.
Nutrition, Metabolism, and Cardiovascular
Diseases, 2003, 13(5):267-72.
131. Bergmann KE et al. Early determinants of
childhood overweight and adiposity in a
birth cohort study: role of breast-feeding.
International Journal of Obesity and Related
Metabolic Disorders, 2003, 27(2):162-72.
132. Reilly JJ et al. Early life risk factors for
obesity in childhood: cohort study. Brit-
ish Medical Journal, 2005, 330(7504):1357.
133. Eid EE. Follow-up study of physical
growth of children who had excessive
weight gain in first six months of life.
British Medical Journal, 1970, 2(701):74-6.
134. Liese AD et al. Inverse association of
overweight and breast feeding in 9 to 10-
y-old children in Germany. International
Journal of Obesity and Related Metabolic Dis-
orders, 2001, 25(11):1644-50.
135. Sung RY et al. High prevalence of insulin
resistance and metabolic syndrome in
overweight/obese preadolescent Hong
Kong Chinese children aged 9-12 years.
Diabetes Care, 2003, 26(1):250-1.
136. Toschke AM et al. Overweight and obesity
in 6- to 14-year-old Czech children in 1991:
protective effect of breast-feeding. The Jour-
nal of Pediatrics, 2002, 141(6):764-9.
137. Gillman MW et al. Risk of overweight
among adolescents who were breastfed
as infants. The Journal of the American Medi-
cal Association, 2001, 285(19):2461-7.
138. Elliott KG et al. Duration of breastfeed-
ing associated with obesity during adoles-
cence. Obesity Research, 1997, 5(6):538-41.
139. Tulldahl J et al. Mode of infant feeding
and achieved growth in adolescence: early
feeding patterns in relation to growth and
body composition in adolescence. Obes-
ity Research, 1999, 7(5):431-7.

49
140. Victora CG et al. Anthropometry and
body composition of 18 year old men
according to duration of breast feeding:
birth cohort study from Brazil. British
Medical Journal, 2003, 327(7420):901.
141. Kvaavik E, Tell GS, Klepp KI. Surveys of
Norwegian youth indicated that breast
feeding reduced subsequent risk of obes-
ity. Journal of Clinical Epidemiology, 2005,
58(8):849-55.
142. Parsons TJ, Power C, Manor O. Infant
feeding and obesity through the
lifecourse. Archives of Disease in Childhood,
2003, 88(9):793-4.
143. Richter J. [Influence of duration of breast-
feeding on body-weight-development].
Ärztliche Jugendkunde, 1981, 72(3):166-9.
144. Eriksson J et al. Obesity from cradle to
grave. International Journal of Obesity and
Related Metabolic Disorders, 2003,
27(6):722-7.
145. Baur LA et al. The fatty acid composi-
tion of skeletal muscle membrane phos-
pholipid: its relationship with the type
of feeding and plasma glucose levels in
young children. Metabolism, 1998;47(1):
106-12.
146. Arslanian S. Type-2 diabetes in children:
clinical aspects and risk factors. Hormone
Research, 2002, 57 (Supplement 1):19-28.
147. Aynsley-Green A. The endocrinology of
feeding in the newborn. Baillière’s Clinical
Endocrinology and Metabolism, 1989,
3(3):837-68.
148. Salmenpera L et al. Effects of feeding regi-
men on blood glucose levels and plasma
concentrations of pancreatic hormones
and gut regulatory peptides at 9 months
of age: comparison between infants fed
with milk formula and infants exclusively
breast-fed from birth. Journal of Pediatric
Gastroenterology and Nutrition, 1988,
7(5):651-6.
149. Pettitt DJ et al. Breastfeeding and inci-
dence of non-insulin-dependent diabetes
mellitus in Pima Indians. Lancet, 1997,
350(9072):166-8.
150. Young TK et al. Type-2 diabetes mellitus
in children: prenatal and early infancy risk
factors among native Canadians. Archives
of Pediatrics and Adolescent Medicine, 2002,
156(7):651-5.
151. Rich-Edwards JW et al. Breastfeeding
During Infancy and the Risk of Cardio-
vascular Disease in Adulthood. Epidemiol-
ogy, 2004, 15(5):550-556.
152. Singhal A et al. Low nutrient intake and
early growth for later insulin resistance
in adolescents born preterm. Lancet, 2003,
361(9363):1089-97.
153. Crawford MA. The role of essential fatty
acids in neural development: implications
for perinatal nutrition. The American Jour-
nal of Clinical Nutrition, 1993, 57(5
Supplement):703S-709S; discussion
709S-710S.
154. Birch EE et al. Dietary essential fatty acid
supply and visual acuity development.
Investigative Ophthalmology and Visual Sci-
ence, 1992, 33(11):3242-53.
155. Bjerve KS et al. Omega-3 fatty acids: es-
sential fatty acids with important bio-
logical effects, and serum phospholipid
fatty acids as markers of dietary omega
3-fatty acid intake. The American Journal
of Clinical Nutrition, 1993, 57(5
Supplement):801S-805S; discussion
805S-806.
156. Clandinin MT et al. Intrauterine fatty acid
accretion rates in human brain: implica-
tions for fatty acid requirements. Early
Human Development, 1980, 4(2):121-9.
157. van Beek RH, Carnielli VP, Sauer PJ.
Nutrition in the neonate. Current Opinion
in Pediatrics, 1995, 7(2):146-51.
158. Makrides M et al. Fatty acid composi-
tion of brain, retina, and erythrocytes in
breast- and formula-fed infants. The Ameri-
can Journal of Clinical Nutrition, 1994,
60(2):189-94.
159. Renfrew MJ, Lang S, Woolridge MW.
Early versus delayed initiation of breast-
feeding. Cochrane Database of Systematic
Reviews, 2000(2):CD000043.
REFERENCES

50 EVIDENCE ON THE LONG-TERM EFFECTS OF BREASTFEEDING: SYSTEMATIC REVIEWS AND META-ANALYSES
160. Klaus M. Mother and infant: early emo-
tional ties. Pediatrics, 1998, 102(5 Supple-
ment E):1244-6.
161. Johnson DL et al. Does HOME add to
the prediction of child intelligence over
and above SES? The Journal of Genetic Psy-
chology, 1993, 154(1):33-40.
162. Fergusson DM, Beautrais AL, Silva PA.
Breastfeeding and cognitive development
in the first seven years of life. Social Sci-
ence and Medicine, 1982, 16(19):1705-8.
163. Anderson JW, Johnstone BM, Remley DT.
Breastfeeding and cognitive development:
a meta-analysis. The American Journal of
Clinical Nutrition, 1999, 70(4):525-35.
164. Drane DL, Logemann JA. A critical evalu-
ation of the evidence on the association
between type of infant feeding and cog-
nitive development. Paediatric and Perina-
tal Epidemiology, 2000, 14(4):349-56.
165. Lucas A et al. A randomised multicentre
study of human milk versus formula and
later development in preterm infants.
Archives of Disease in Childhood. Fetal and
Neonatal Edition, 1994, 70(2):F141-6.
166. Pollock JI. Long-term associations with in-
fant feeding in a clinically advantaged popu-
lation of babies. Developmental Medicine and
Child Neurology, 1994, 36(5):429-40.
167. Lucas A et al. Breast milk and subsequent
intelligence quotient in children born
preterm. Lancet, 1992, 339(8788):261-4.
168. Horwood LJ, Fergusson DM. Breastfeed-
ing and later cognitive and academic out-
comes. Pediatrics, 1998, 101(1):E9.
169. Greene LC et al. Relationship between
early diet and subsequent cognitive per-
formance during adolescence. Biochemical
Society Transactions, 1995, 23(2):376S.
170. Rogan WJ, Gladen BC. Breastfeeding and
cognitive development. Early Human De-
velopment, 1993, 31(3):181-93.
171. Jain A, Concato J, Leventhal JM. How
good is the evidence linking breastfeeding
and intelligence? Pediatrics, 2002, 109(6):
1044-53.
172. Wigg NR et al. Does breastfeeding at six
months predict cognitive development?
Australian and New Zealand Journal of Public
Health, 1998, 22(2):232-6.
173. Johnson DL et al. Breastfeeding and chil-
dren’s intelligence. Psychological Reports,
1996, 79(3 Pt 2):1179-85.
174. Morrow-Tlucak M, Haude RH, Ernhart
CB. Breastfeeding and cognitive develop-
ment in the first 2 years of life. Social Sci-
ence and Medicine, 1988, 26(6):635-9.
175. Rodgers B. Feeding in infancy and later
ability and attainment: a longitudinal
study. Developmental Medicine and Child Neu-
rology, 1978, 20(4):421-6.
176. Jacobson SW, Jacobson JL. Breastfeeding
and intelligence. Lancet, 1992,
339(8798):926.
177. Lucas A et al. Early diet in preterm ba-
bies and developmental status in infancy.
Archives of Disease in Childhood, 1989,
64(11):1570-8.
178. Silva PA, Buckfield P, Spears GF. Some
maternal and child developmental char-
acteristics associated with breast feed-
ing: a report from the Dunedin
Multidisciplinary Child Development
Study. Australian Paediatric Journal, 1978,
14(4):265-8.
179. Quinn PJ et al. The effect of breastfeeding
on child development at 5 years: a co-
hort study. Journal of Paediatrics and Child
Health, 2001, 37(5):465-9.
180. Clark KM et al. Breastfeeding and men-
tal and motor development at 5 1/2 years.
Ambulatory Pediatrics, 2006, 6(2):65-71.
181. Angelsen NK et al. Breastfeeding and
cognitive development at age 1 and 5
years. Archives of Disease in Childhood, 2001,
85(3):183-8.
182. Richards M, Hardy R, Wadsworth ME.
Long-term effects of breastfeeding in a
national birth cohort: educational attain-
ment and midlife cognitive function.
Public Health Nutrition, 2002, 5(5):631-5.

51
183. Victora CG et al. Breastfeeding and school
achievement in Brazilian adolescents. Acta
Paediatrica, 2005, 94(11):1656-60.
184. Summerbell CD et al. Interventions for
preventing obesity in children. Cochrane
Database of Systematic Reviews, 2005(3):
CD001871.
185. Whelton SP et al. Effect of aerobic exer-
cise on blood pressure: a meta-analysis
of randomized, controlled trials. Annals
of Internal Medicine, 2002, 136(7):493-503.
186. Ebrahim S, Smith GD. Systematic review
of randomised controlled trials of multi-
ple risk factor interventions for prevent-
ing coronary heart disease. British Medi-
cal Journal, 1997, 314(7095):1666-74.
REFERENCES
187. He FJ, MacGregor GA. Effect of longer-
term modest salt reduction on blood pres-
sure. Cochrane Database of Systematic Re-
views, 2004(3):CD004937.
188. Pan XR, Li GW, Hu YH, Wang JX, Yang
WY, An ZX, et al. Effects of diet and ex-
ercise in preventing NIDDM in people
with impaired glucose tolerance. The Da
Qing IGT and Diabetes Study. Diabetes
Care, 1997, 20(4):537-44.

52 EVIDENCE ON THE LONG-TERM EFFECTS OF BREASTFEEDING: SYSTEMATIC REVIEWS AND META-ANALYSES