evolution i scott bowling topher gee stan schneider beth schussler randy small min zhong...
TRANSCRIPT

Evolution IScott Bowling
Topher GeeStan SchneiderBeth Schussler
Randy SmallMin Zhong
Facilitator: Paula Lemons
Evolution I
• Topic: Evidence for and mechanisms of evolution
• Introductory Biology (majors), Large enrollment (200+/section)
• We are assuming students “know”:– Definition of evolution– Hardy-Weinberg Equilibrium and problem solving– Evolutionary processes
Tidbit Learning Goal• Students will demonstrate an understanding
of evolutionary processes

Tidbit Learning Objectives• recall Hardy-Weinberg and evolutionary
processesGiven a scenario, students will:• identify whether evolution has occurred and
articulate the evidence• predict the mechanism(s) driving evolutionary
change and identify the necessary evidence
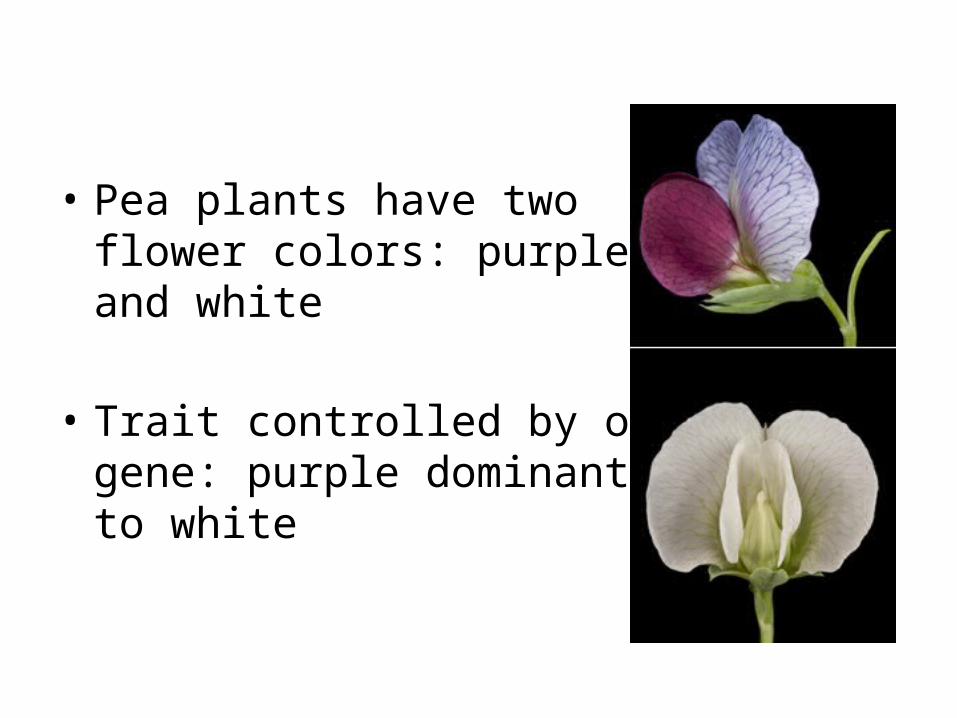
• Pea plants have two flower colors: purple and white
• Trait controlled by one gene: purple dominant to white

0 1 2 3 4 5 6 7 8 9 10 110
0.10.20.30.40.50.60.70.80.9
1
Generation
Freq
uenc
y of
w
hite
flow
er a
llele
(q)
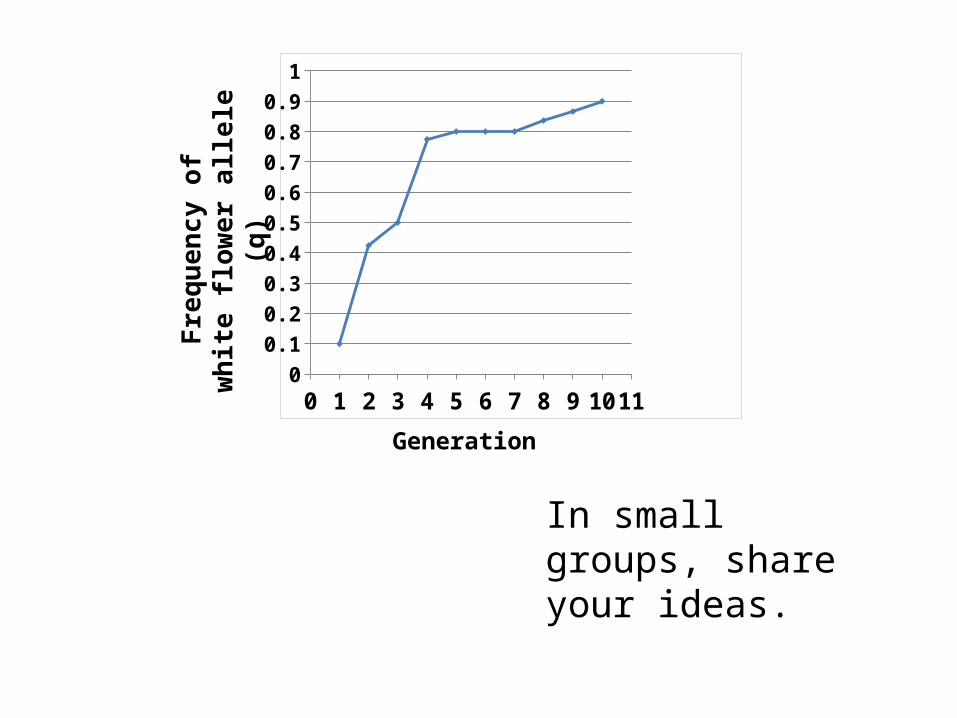
On your own, summarize what this figure is telling you.
0 1 2 3 4 5 6 7 8 9 10 110
0.10.20.30.40.50.60.70.80.9
1
Generation
Freq
uenc
y of
w
hite
flow
er a
llele
(q)
In small groups, share your ideas.

Graph here
1 2 3 4 5 6 7 8
0% 0% 0% 0%0%0%
100%
0%
Look at the shaded Regions (A, B, and C). Over which, if any of these regions has evolution occurred for the flower color gene?
1. A only2. B only3. C only4. Both A and B5. Both A and C6. Both B and C7. All three regions8. None of these regions
0 1 2 3 4 5 6 7 8 9 10 110
0.10.20.30.40.50.60.70.80.9
1
Generation
Freq
uenc
y of
w
hite
flow
er a
llele
(q)
A B C

0 1 2 3 4 5 6 7 8 9 10 110
0.10.20.30.40.50.60.70.80.9
1
Generation
Freq
uenc
y of
w
hite
flow
er a
llele
(q)
A B C
Discuss the importance of the following factors in deciding whether evolution has occurred:
• Allele frequencies• Number of generations• Magnitude of change

Graph here
1 2 3 4 5 6 7 8
100%
0% 0% 0%0%0%0%0%
Look at the shaded Regions (A, B, and C). Over which, if any of these regions has evolution occurred for the flower color gene?
1. A only2. B only3. C only4. Both A and B5. Both A and C6. Both B and C7. All three regions8. None of these regions
0 1 2 3 4 5 6 7 8 9 10 110
0.10.20.30.40.50.60.70.80.9
1
Generation
Freq
uenc
y of
w
hite
flow
er a
llele
(q)
A B C
Each group will be assigned one evolutionary process to discuss and explain to the rest of the class:
1. Genetic drift2. Mutation3. Non-random mating4. Migration (gene flow)5. Natural selection

• Dr. Sally Slither conducted a study on two populations of lizards: one on an isolated island and the other on the mainland.
– Generation time = 2 years
– Island population (N = 1,000)
– Mainland population (N = 100,000)
• In each population, some have googly-eyes (dominant) and some have small eyes (recessive).
Googly-eyed
Small-eyed

Dr. Slither’s 20-yr study of eye size in lizard populations

Graph here
1 2 3 4 5
0% 0% 0%0%
100%
Based on the figure above, what is the most likely explanation for why the island population’s allele frequency is more erratic than the mainland’s?
Dr. Slither’s 20-yr study of eye size in lizard populations
1. Genetic drift2. Mutation3. Non-random mating4. Migration (gene flow)5. Natural selection

• Googly-eyed lizards are more sensitive to light and prefer dimmer conditions.
• The mainland habitat is being deforested by human activity.

Dr. Slither’s 20-yr study of eye size in lizard populations
Given what you know, what could explain the mainland population’s gradual shift in allele frequency over time?
Genetic driftMutationNon-random mating
Migration (gene flow)
Natural selection

Homework
• For either lizard population (mainland or island), what evidence would you need to support the hypothesis that EACH of the following is occurring:– Natural selection– Non-random mating– Migration

Summative AssessmentA population of spiders includes individuals with plain legs (recessive) as well as individuals with yellow bands on their legs (dominant). You have a data set that spans multiple generations for this population. In the first generation your data indicate that of 100 spiders, 64 had yellow bands on their legs. Five generations later, the population had grown to 10,000 spiders and included 1,600 with plain legs.
1. Has evolution occurred over these generations? Explain your reasoning and show supporting work.
2. Has natural selection occurred on the yellow band phenotype? Why or why not?
3. What data set(s) would you need to collect to identify the mechanism of evolution?

Learning Objective
Assessment Active learning Low Order/High Order
Recall Hardy-Weinberg principles and evolutionary processes
Formative: Explain HW principles Group discussion Low Order
Identify whether evolution has occurred & the evidence
Formative: Evaluating population data to identify when evolution has occurred; pinpointing the evidence
Clicker questions – discussion – re-poll
High order
Predict the mechanism(s) driving evolutionary change and identify the necessary evidence
Formative: Evaluating population data in scenario to identify potential evolutionary mechanisms.
Formative: Homework assignment.
Summative: Exam question to test student ability to identify whether or not evolution has occurred, and what mechanisms might have resulted in that evolution.
Clicker questions – discussion – re-poll (multiple sections of a scenario)
High order
Diversity:
Diversity
Female scientist named in scenario.Group members presenters are diverse.Read clicker questions & group discussion questions to students to accommodate learning style diversity & students with disabilities.Active learning includes both group and individual activities.

OPTIONAL?
What evidence is necessary to know whether evolution has occurred within a population?
• Individually, write a one-minute essay• Brief group discussion
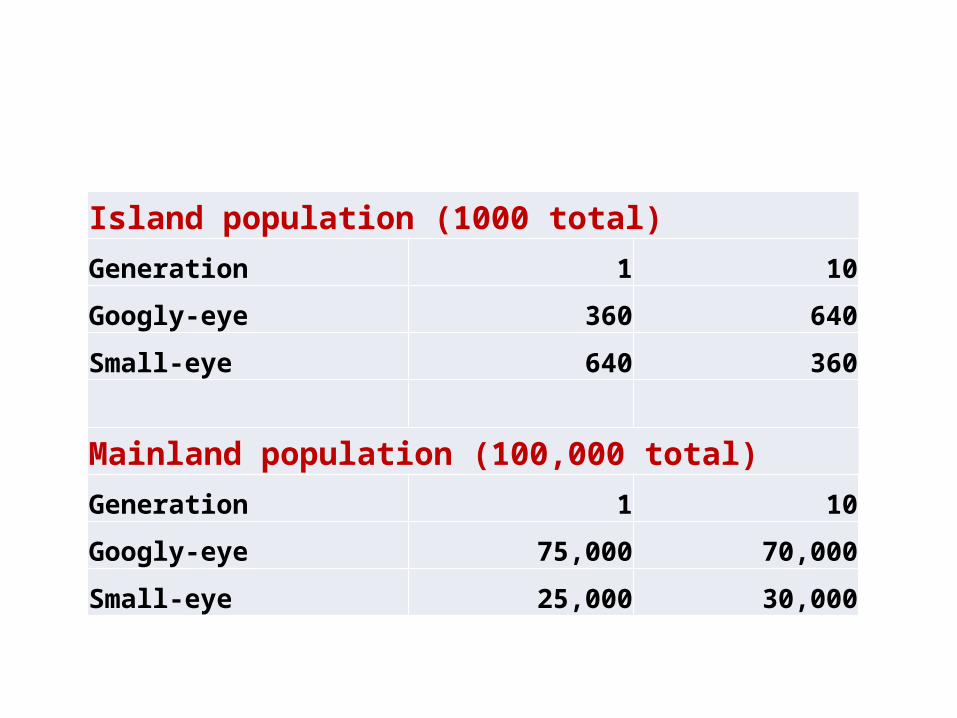
Island population (1000 total)Generation 1 10
Googly-eye 360 640
Small-eye 640 360
Mainland population (100,000 total)Generation 1 10
Googly-eye 75,000 70,000
Small-eye 25,000 30,000

• The island habitat is undisturbed and heavily forested.