evolution mining
TRANSCRIPT

Evolution Mining AGM Presentation
29 November 2011 Jake Klein – Executive Chairman

Disclaimer and Important Notice This disclaimer and important notice applies to this presentation and any information provided in relation to or in connection with the information contained in it. This presentation provides information in summary form. Some of that information is based on publicly available sources, has not been independently verified and may not be complete. For further information relating to Evolution Mining see the Scheme Booklet released by Conquest Mining Limited dated 13 September 2011 and the Explanatory Memorandum released by Catalpa Resources Limited dated 13 September 2011. This presentation contains forward-looking statements which involve a number of risks and uncertainties. These statements reflect current expectations, beliefs, hopes, intentions or strategies regarding the future and assumptions based on currently available information. Should one or more of the risks or uncertainties materialise, or should underlying assumptions prove incorrect, actual results may vary from the expectations, beliefs, hopes, intentions and strategies described in this presentation. No representation or warranty is made as to the accuracy, completeness, reliability, fairness or correctness of the information contained in this presentation. To the maximum extent permitted by law, no person, including Catalpa Resources Limited, Conquest Mining Limited, Newcrest Mining Limited and their respective related bodies corporate, officers, employees and representatives (including agents and advisors), accepts any liability or responsibility for loss arising from the use of the information contained in this presentation. The information contained in this presentation is not investment or financial product advice and is not intended to be used as the basis for making an investment decision. In this regard, this presentation has been prepared without taking into account the investment objectives, financial situation or particular needs of any person. This presentation does not constitute an offer to issue or sell, or to arrange to sell, securities or other financial products. In particular, this presentation and the information contained in it does not constitute a solicitation, offer or invitation to buy, subscribe for or sell any security in the United States or to or for the account or benefit of any U.S. Person (as defined in Regulation S under the U.S. Securities Act of 1933, as amended (the US Securities Act)). The securities referred to in this presentation as being offered or sold have not been, and will not be, registered under the US Securities Act. Securities may not be offered or sold in the United States unless they have been registered under the US Securities Act or an exemption from registration is available. The release, publication or distribution of this presentation in jurisdictions outside Australia may be restricted by law. Any failure to comply with such restrictions may constitute a violation of applicable securities laws.
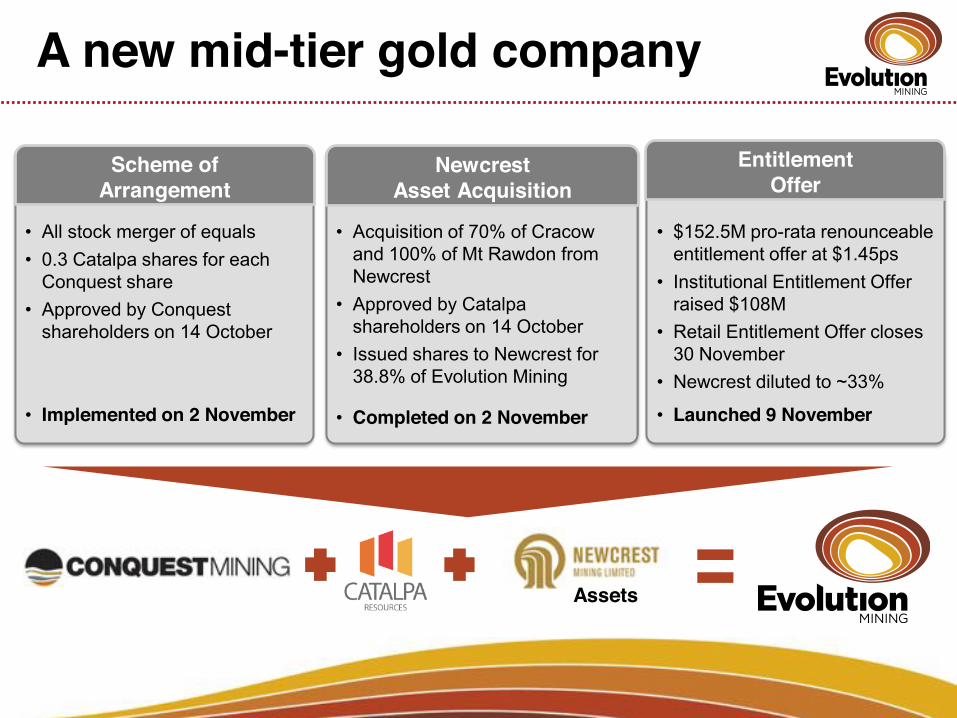
A new mid-tier gold company
Assets
• Acquisition of 70% of Cracow and 100% of Mt Rawdon from Newcrest
• Approved by Catalpa shareholders on 14 October
• Issued shares to Newcrest for 38.8% of Evolution Mining
• Completed on 2 November
Newcrest Asset Acquisition
• $152.5M pro-rata renounceable entitlement offer at $1.45ps
• Institutional Entitlement Offer raised $108M
• Retail Entitlement Offer closes 30 November
• Newcrest diluted to ~33%
• Launched 9 November
Entitlement Offer
• All stock merger of equals • 0.3 Catalpa shares for each
Conquest share • Approved by Conquest
shareholders on 14 October
• Implemented on 2 November
Scheme of Arrangement
A new mid-tier gold company
Key Strengths:
� Asset Portfolio
� Financial Capacity
� People
� Profile

Assets
1. Pro forma asset level production assuming 100% ownership for the full year. Actual FY2012 production will be less than this given Asset acquisition occurred on 2 November 2011.
2. See Appendix for full Ore Reserve and Mineral Resource disclosure.
Brisbane
TownsvilleMt CarltonPajingo
Mt Rawdon
PerthEdna May
Cracow
Sydney
� 303koz pro forma FY2011 gold production1
� 335 – 375koz forecast FY2012 gold production1
� 410 – 465koz forecast FY2013 gold equivalent production
� 3.5Moz Aueq. Reserves2
� 6.9Moz Aueq. Resources2
� Robust exploration potential
� Defined growth profile
� All assets 100% owned

Edna May
66 85-93
115-125
FY 2009 FY 2010 FY 2011 FY 2012E FY 2013E
� Open pit mining commenced late 2009 � 2.8Mtpa throughput � Average grade 1.1g/t gold � FY2012 cash cost estimate: $890-$990/oz � Growth opportunities
— Higher grade underground mining
— Increase plant throughput from 2.8Mtpa to 3.2Mtpa
� Drilling continues to underpin business case for underground mining. Recent intersections include:
— 1.11m @ 88.9g/t gold from 562m (EMD051W)
— 1.90m @ 36.1g/t gold from 409m (EMD052)
— 3.35m @ 23.1g/t gold from 407m (EMD052A)
— 2.30m @ 43.8g/t gold from 400m (EMD058A)
Location Western Australia
Stage Producing
Mine Type Open pit
Minerals Gold
Mineralisation type Stockwork and high-grade reefs
Mine Life 9 years
Ore Reserves 0.9Moz gold
Mineral Resources 1.8Moz gold
Production Profile (Kozpa Gold)
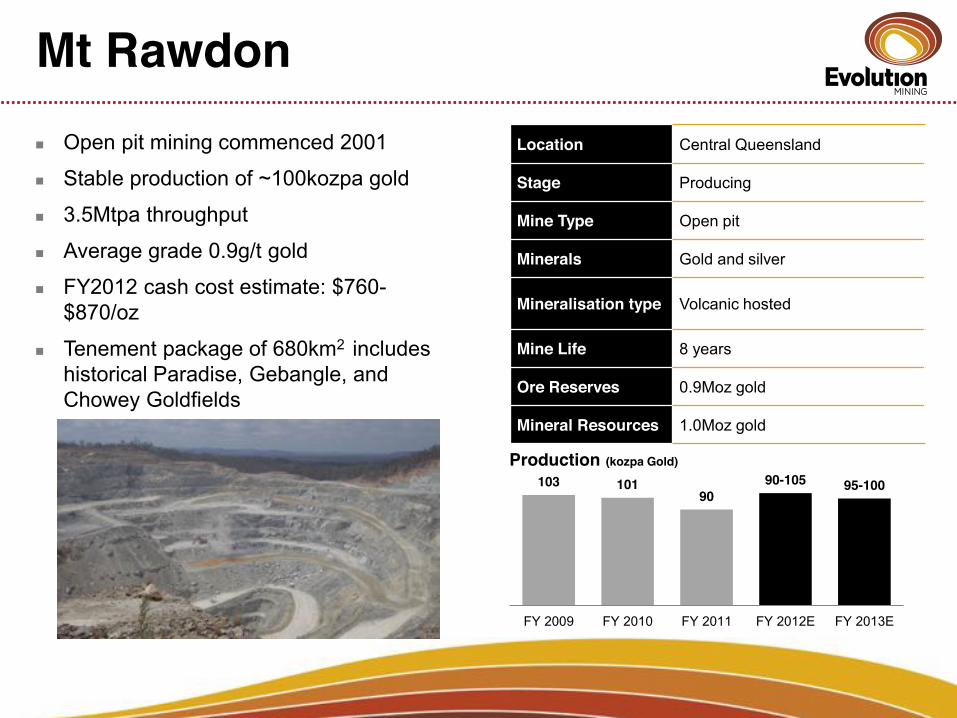
Mt Rawdon
103 101 90
90-105 95-100
FY 2009 FY 2010 FY 2011 FY 2012E FY 2013E
� Open pit mining commenced 2001
� Stable production of ~100kozpa gold
� 3.5Mtpa throughput
� Average grade 0.9g/t gold
� FY2012 cash cost estimate: $760-$870/oz
� Tenement package of 680km2 includes historical Paradise, Gebangle, and Chowey Goldfields
Location Central Queensland
Stage Producing
Mine Type Open pit
Minerals Gold and silver
Mineralisation type Volcanic hosted
Mine Life 8 years
Ore Reserves 0.9Moz gold
Mineral Resources 1.0Moz gold
Production (kozpa Gold)
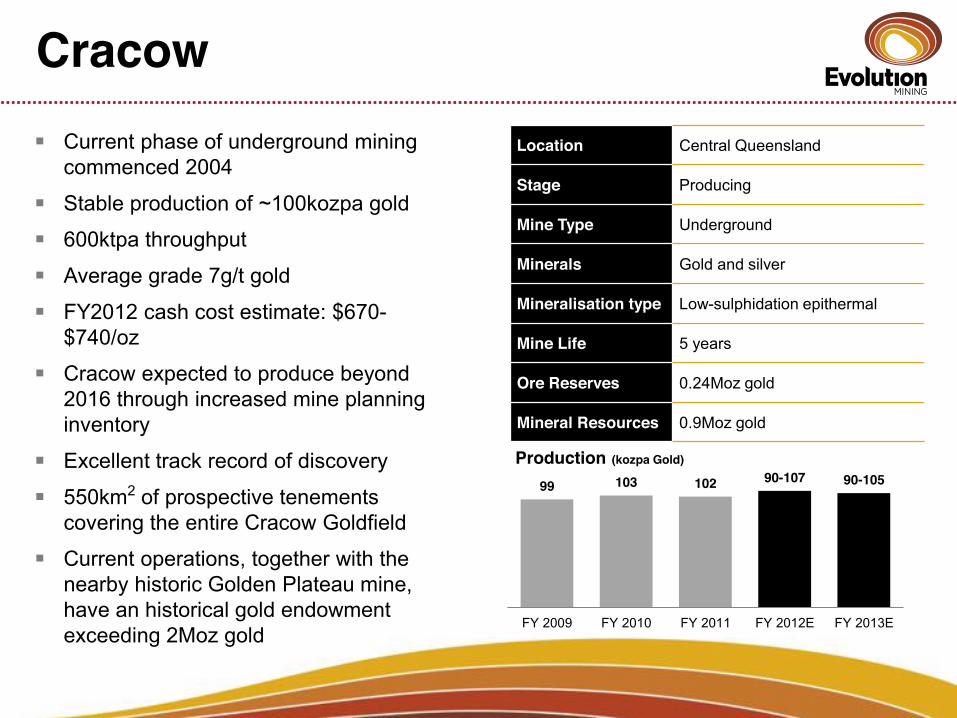
Cracow
99 103 102 90-107 90-105
FY 2009 FY 2010 FY 2011 FY 2012E FY 2013E
� Current phase of underground mining commenced 2004
� Stable production of ~100kozpa gold � 600ktpa throughput � Average grade 7g/t gold � FY2012 cash cost estimate: $670-
$740/oz � Cracow expected to produce beyond
2016 through increased mine planning inventory
� Excellent track record of discovery � 550km2 of prospective tenements
covering the entire Cracow Goldfield � Current operations, together with the
nearby historic Golden Plateau mine, have an historical gold endowment exceeding 2Moz gold
Location Central Queensland
Stage Producing
Mine Type Underground
Minerals Gold and silver
Mineralisation type Low-sulphidation epithermal
Mine Life 5 years
Ore Reserves 0.24Moz gold
Mineral Resources 0.9Moz gold
Production (kozpa Gold)
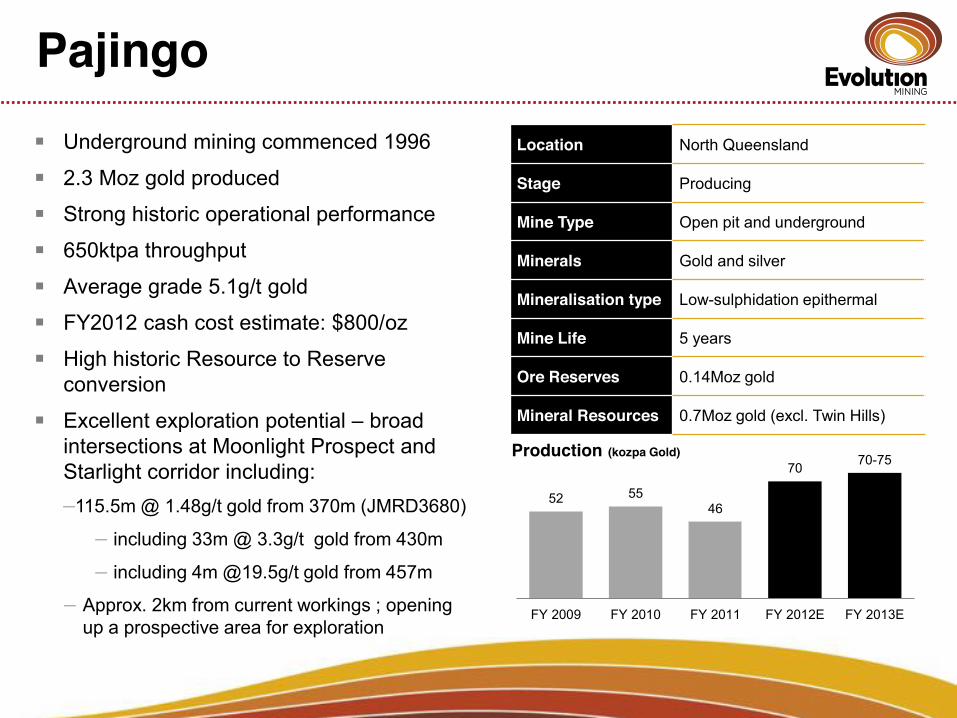
Pajingo � Underground mining commenced 1996 � 2.3 Moz gold produced � Strong historic operational performance � 650ktpa throughput � Average grade 5.1g/t gold � FY2012 cash cost estimate: $800/oz � High historic Resource to Reserve
conversion � Excellent exploration potential – broad
intersections at Moonlight Prospect and Starlight corridor including: —115.5m @ 1.48g/t gold from 370m (JMRD3680)
— including 33m @ 3.3g/t gold from 430m — including 4m @19.5g/t gold from 457m
— Approx. 2km from current workings ; opening up a prospective area for exploration
Location North Queensland
Stage Producing
Mine Type Open pit and underground
Minerals Gold and silver
Mineralisation type Low-sulphidation epithermal
Mine Life 5 years
Ore Reserves 0.14Moz gold
Mineral Resources 0.7Moz gold (excl. Twin Hills)
Production (kozpa Gold)
52 55 46
70 70-75
FY 2009 FY 2010 FY 2011 FY 2012E FY 2013E

Mt Carlton � Plant commissioning expected in 2H
CY20121 � V2 open pit – 3.7g/t gold equivalent � A39 open pit – 552g/t silver � Target production of 95kozpa gold
equivalent � Capital expenditure of A$127m � Cash Costs estimate: A$600/oz of gold
equiv. � Significant exploration potential � CY 2011 exploration budget of $5.2
million — locate additional mineralised centres
adjacent to the V2 and A39 deposits — locate additional high-grade silver
mineralisation similar to the A39 deposit
Location North Queensland
Stage Development
Mine Type Open pit
Minerals Gold, silver and copper
Mineralisation type High-sulphidation epithermal
Mine Life 12 years plus
Ore Reserves 1.3Moz gold equivalent
Mineral Resources 2.1Moz gold equivalent
1. Assuming timely receipt of permits

Leading mid-tier gold company
Source of information for charts: Broker reports and company guidance released as at 4 November 2011
Source of information for charts: Broker reports and company guidance released as at 4 November 2011

Defined growth profile
Top 3 in growth amongst
Australian mid-caps
Mt Rawdon Pajingo Cracow Edna May Mt Carlton
410 – 465koz
335 – 375koz
303koz
YE June 2011 YE June 2012E YE June 2013E
Financial capacity
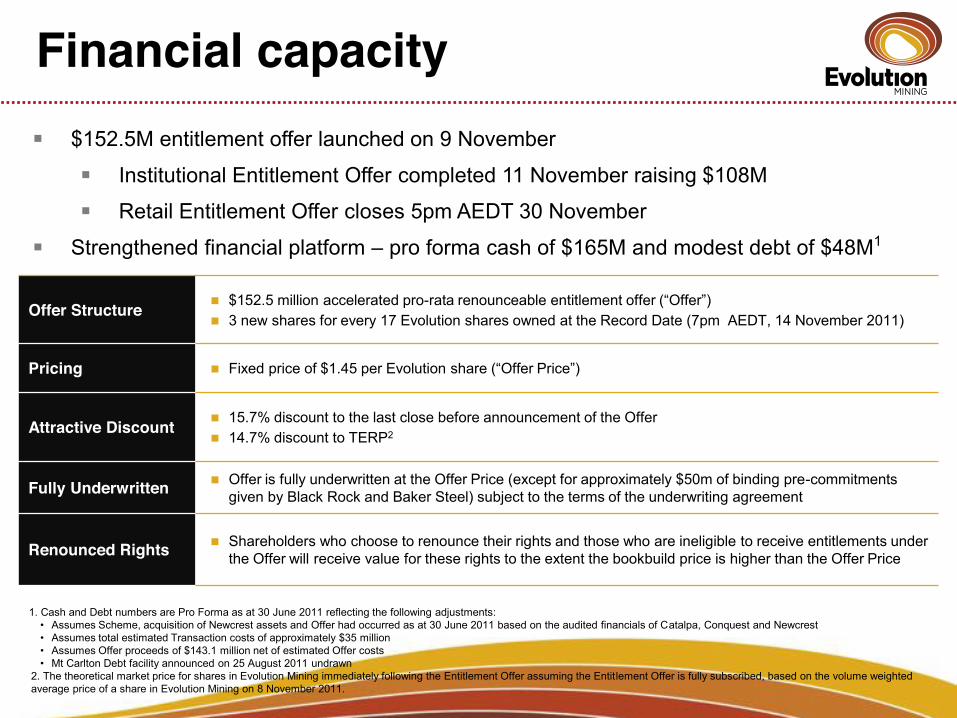
Offer Structure � $152.5 million accelerated pro-rata renounceable entitlement offer (―Offer‖) � 3 new shares for every 17 Evolution shares owned at the Record Date (7pm AEDT, 14 November 2011)
Pricing � Fixed price of $1.45 per Evolution share (―Offer Price‖)
Attractive Discount � 15.7% discount to the last close before announcement of the Offer � 14.7% discount to TERP2
Fully Underwritten � Offer is fully underwritten at the Offer Price (except for approximately $50m of binding pre-commitments given by Black Rock and Baker Steel) subject to the terms of the underwriting agreement
Renounced Rights � Shareholders who choose to renounce their rights and those who are ineligible to receive entitlements under the Offer will receive value for these rights to the extent the bookbuild price is higher than the Offer Price
� $152.5M entitlement offer launched on 9 November � Institutional Entitlement Offer completed 11 November raising $108M � Retail Entitlement Offer closes 5pm AEDT 30 November
� Strengthened financial platform – pro forma cash of $165M and modest debt of $48M1
1. Cash and Debt numbers are Pro Forma as at 30 June 2011 reflecting the following adjustments: • Assumes Scheme, acquisition of Newcrest assets and Offer had occurred as at 30 June 2011 based on the audited financials of Catalpa, Conquest and Newcrest • Assumes total estimated Transaction costs of approximately $35 million • Assumes Offer proceeds of $143.1 million net of estimated Offer costs • Mt Carlton Debt facility announced on 25 August 2011 undrawn
2. The theoretical market price for shares in Evolution Mining immediately following the Entitlement Offer assuming the Entitlement Offer is fully subscribed, based on the volume weighted average price of a share in Evolution Mining on 8 November 2011.
Profile
� Benefit of Newcrest as a 33% supportive shareholder � Board representation � Potential to leverage business development opportunities and geological knowledge � Interests aligned
“Newcrest believes its investment in Evolution will maximise the value of the Newcrest assets”
� Global gold funds as major shareholders: � Baker Steel Capital (London) � BlackRock Investment (London) � Acorn Capital (Melbourne) � Van Eck Global (New York) � Indus Capital Partners (New York)
� Increased broker coverage: � BBY � Evans & Partners � Goldman Sachs � Hartleys � Investec � Ord Minnett � Patersons � RBC Capital Markets � Resource Capital

A new mid-tier gold company
Grow Leverage off mining expertise and financial capacity
Consolidate Integrate new mines, people and processes
Key Strengths Asset
Portfolio Financial Capacity People Profile

Appendices
www.evolutionmining.com.au

Resources and Reserves
� Note 1 : Mt Carlton Total gold grades and ounces are reported on a gold equivalent basis for combined V2 and A39 deposits. � Mt Carlton Total Mineral Resource reported on an elemental basis stands at 27.4Mt @ 1.4g/t Au, 39.9g/t Ag and 0.25% Cu for 1.24Moz Au, 34.9Moz Ag and 68.2kt Cu � Mt Carlton Total Ore Reserve reported on an elemental basis stands at 9.7Mt @ 2.6g/t Au, 55.1g/t Ag and 0.35% Cu for 812koz Au, 17.3Moz Ag and 34kt Cu � Mineral Resources are inclusive of Ore Reserves.
Tonnes Gold Grade Ounces Tonnes Gold Grade Ounces Tonnes Gold Grade Ounces Tonnes Gold Grade Ounces(Mt) (g/t) Au (koz) (Mt) (g/t) Au (koz) (Mt) (g/t) Au (koz) (Mt) (g/t) Au (koz)
Edna May Operations Openpit 20.6 1.1 690 20.2 0.9 612 10.6 0.9 296 51.4 1.0 1,598Edna May Operations Underground 0.4 7.3 98 0.3 7.6 69 0.7 7.4 166Cracow Operations Underground 0.3 9.7 86 1.0 7.7 258 3.1 5.5 548 4.4 6.3 893Mt Rawdon Operations Openpit 0.2 1.1 8 36.3 0.9 1,015 0.2 0.6 4 36.7 0.9 1,026Pajingo Operations Openpit 0.3 3.0 30 0.1 1.0 0.3 0.3 3.0 30Pajingo Operations Underground 0.2 5.4 35 2.5 4.7 375 2.4 3.8 288 5.0 4.3 698Twin Hills 0.5 4.1 71 2.7 2.3 205 1.4 2.8 123 4.6 2.7 398
(Mt) Gold Eqv AuE (koz) (Mt) Gold Eqv AuE (koz) (Mt) Gold Eqv AuE (koz) (Mt) Gold Eqv AuE (koz)
Mt Carlton Operations 1 14.6 2.8 1,370 11.3 2.0 727 1.5 1.3 62 27.4 2.4 2,159SUB TOTAL 36.4 1.9 2,260 74.8 1.4 3,320 19.4 2.3 1,390 130.6 1.7 6,967
Mineral Resource StatementTotalMeasured Indicated Inferred
Tonnes Gold Grade Ounces Tonnes Gold Grade Ounces Tonnes Gold Grade Ounces(Mt) (g/t) Au (koz) (Mt) (g/t) Au (koz) (Mt) (g/t) Au (koz)
Edna May Operations Openpit 15.2 1.1 532 12.4 1.0 394 27.5 1.1 927Edna May Operations UndergroundCracow Operations Underground 0.2 8.1 61 0.8 6.8 182 1.1 7.0 244Mt Rawdon Operations Openpit 0.2 1.1 8 31.8 0.9 912 32.0 0.9 920Pajingo Operations Openpit 0.3 2.8 30 0.3 2.8 31Pajingo Operations Underground 0.1 5.7 10 0.5 6.6 100 0.5 6.5 110
(Mt) Gold Eqv AuE (koz) (Mt) Gold Eqv AuE (koz) (Mt) Gold Eqv AuE (koz)
Mt Carlton Operations 1 Openpit 5.6 4.6 828 4.1 3.2 426 9.7 4.0 1,25521.3 2.1 1,439 50.0 1.3 2,044 71.2 1.5 3,486
TotalOre Reserve Statement
SUB TOTAL
Proved Probable
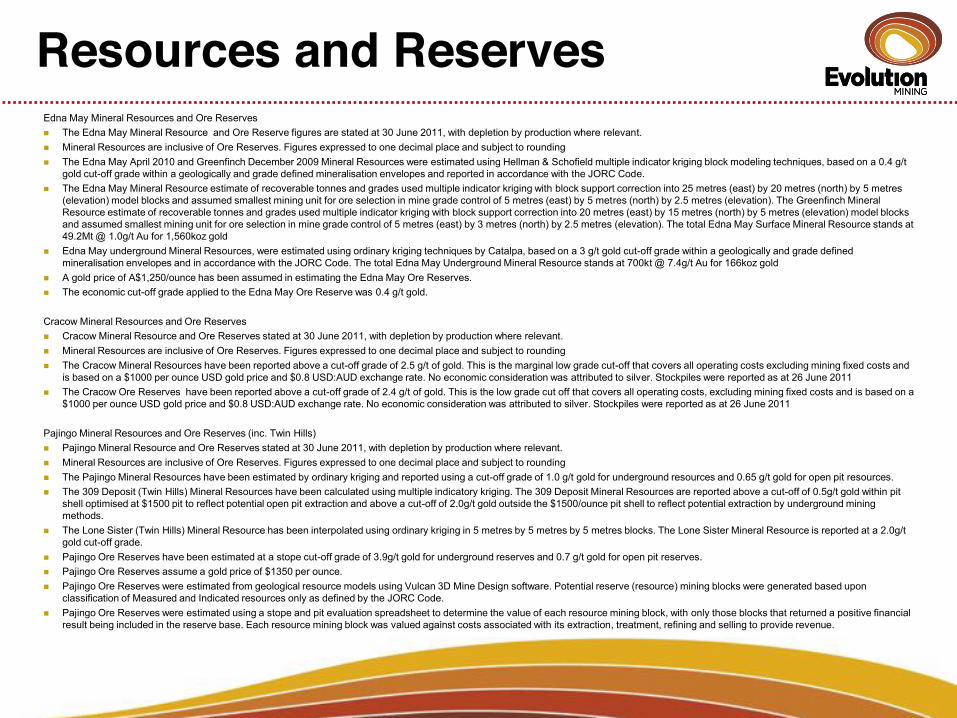
Edna May Mineral Resources and Ore Reserves � The Edna May Mineral Resource and Ore Reserve figures are stated at 30 June 2011, with depletion by production where relevant. � Mineral Resources are inclusive of Ore Reserves. Figures expressed to one decimal place and subject to rounding � The Edna May April 2010 and Greenfinch December 2009 Mineral Resources were estimated using Hellman & Schofield multiple indicator kriging block modeling techniques, based on a 0.4 g/t
gold cut-off grade within a geologically and grade defined mineralisation envelopes and reported in accordance with the JORC Code. � The Edna May Mineral Resource estimate of recoverable tonnes and grades used multiple indicator kriging with block support correction into 25 metres (east) by 20 metres (north) by 5 metres
(elevation) model blocks and assumed smallest mining unit for ore selection in mine grade control of 5 metres (east) by 5 metres (north) by 2.5 metres (elevation). The Greenfinch Mineral Resource estimate of recoverable tonnes and grades used multiple indicator kriging with block support correction into 20 metres (east) by 15 metres (north) by 5 metres (elevation) model blocks and assumed smallest mining unit for ore selection in mine grade control of 5 metres (east) by 3 metres (north) by 2.5 metres (elevation). The total Edna May Surface Mineral Resource stands at 49.2Mt @ 1.0g/t Au for 1,560koz gold
� Edna May underground Mineral Resources, were estimated using ordinary kriging techniques by Catalpa, based on a 3 g/t gold cut-off grade within a geologically and grade defined mineralisation envelopes and in accordance with the JORC Code. The total Edna May Underground Mineral Resource stands at 700kt @ 7.4g/t Au for 166koz gold
� A gold price of A$1,250/ounce has been assumed in estimating the Edna May Ore Reserves. � The economic cut-off grade applied to the Edna May Ore Reserve was 0.4 g/t gold. Cracow Mineral Resources and Ore Reserves � Cracow Mineral Resource and Ore Reserves stated at 30 June 2011, with depletion by production where relevant. � Mineral Resources are inclusive of Ore Reserves. Figures expressed to one decimal place and subject to rounding � The Cracow Mineral Resources have been reported above a cut-off grade of 2.5 g/t of gold. This is the marginal low grade cut-off that covers all operating costs excluding mining fixed costs and
is based on a $1000 per ounce USD gold price and $0.8 USD:AUD exchange rate. No economic consideration was attributed to silver. Stockpiles were reported as at 26 June 2011 � The Cracow Ore Reserves have been reported above a cut-off grade of 2.4 g/t of gold. This is the low grade cut off that covers all operating costs, excluding mining fixed costs and is based on a
$1000 per ounce USD gold price and $0.8 USD:AUD exchange rate. No economic consideration was attributed to silver. Stockpiles were reported as at 26 June 2011 Pajingo Mineral Resources and Ore Reserves (inc. Twin Hills) � Pajingo Mineral Resource and Ore Reserves stated at 30 June 2011, with depletion by production where relevant. � Mineral Resources are inclusive of Ore Reserves. Figures expressed to one decimal place and subject to rounding � The Pajingo Mineral Resources have been estimated by ordinary kriging and reported using a cut-off grade of 1.0 g/t gold for underground resources and 0.65 g/t gold for open pit resources. � The 309 Deposit (Twin Hills) Mineral Resources have been calculated using multiple indicatory kriging. The 309 Deposit Mineral Resources are reported above a cut-off of 0.5g/t gold within pit
shell optimised at $1500 pit to reflect potential open pit extraction and above a cut-off of 2.0g/t gold outside the $1500/ounce pit shell to reflect potential extraction by underground mining methods.
� The Lone Sister (Twin Hills) Mineral Resource has been interpolated using ordinary kriging in 5 metres by 5 metres by 5 metres blocks. The Lone Sister Mineral Resource is reported at a 2.0g/t gold cut-off grade.
� Pajingo Ore Reserves have been estimated at a stope cut-off grade of 3.9g/t gold for underground reserves and 0.7 g/t gold for open pit reserves. � Pajingo Ore Reserves assume a gold price of $1350 per ounce. � Pajingo Ore Reserves were estimated from geological resource models using Vulcan 3D Mine Design software. Potential reserve (resource) mining blocks were generated based upon
classification of Measured and Indicated resources only as defined by the JORC Code. � Pajingo Ore Reserves were estimated using a stope and pit evaluation spreadsheet to determine the value of each resource mining block, with only those blocks that returned a positive financial
result being included in the reserve base. Each resource mining block was valued against costs associated with its extraction, treatment, refining and selling to provide revenue.
Resources and Reserves
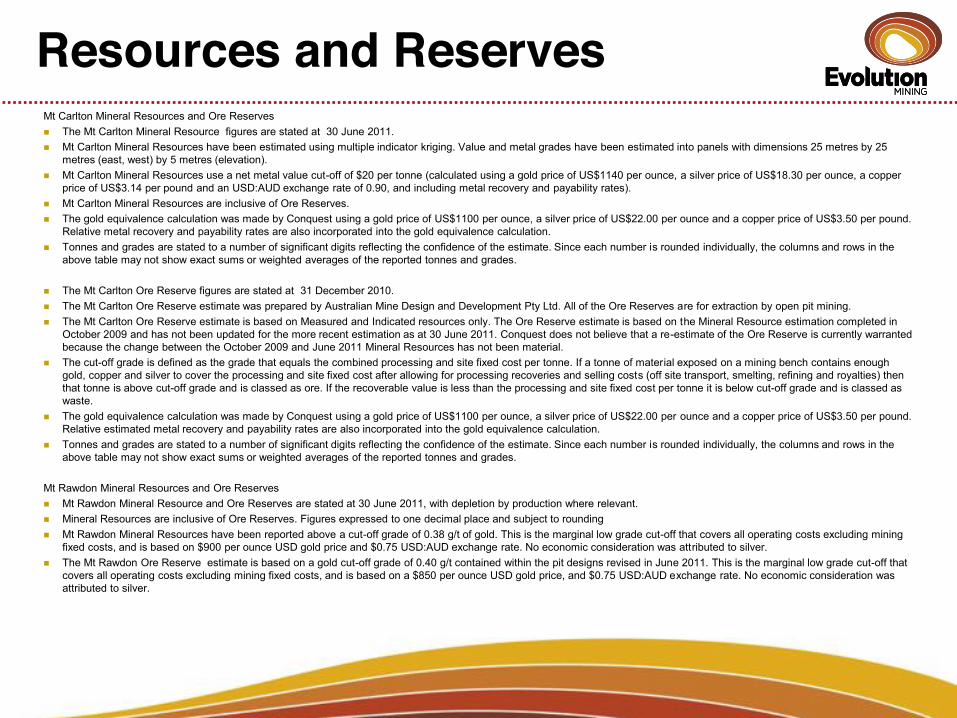
Mt Carlton Mineral Resources and Ore Reserves � The Mt Carlton Mineral Resource figures are stated at 30 June 2011. � Mt Carlton Mineral Resources have been estimated using multiple indicator kriging. Value and metal grades have been estimated into panels with dimensions 25 metres by 25
metres (east, west) by 5 metres (elevation). � Mt Carlton Mineral Resources use a net metal value cut-off of $20 per tonne (calculated using a gold price of US$1140 per ounce, a silver price of US$18.30 per ounce, a copper
price of US$3.14 per pound and an USD:AUD exchange rate of 0.90, and including metal recovery and payability rates). � Mt Carlton Mineral Resources are inclusive of Ore Reserves. � The gold equivalence calculation was made by Conquest using a gold price of US$1100 per ounce, a silver price of US$22.00 per ounce and a copper price of US$3.50 per pound.
Relative metal recovery and payability rates are also incorporated into the gold equivalence calculation. � Tonnes and grades are stated to a number of significant digits reflecting the confidence of the estimate. Since each number is rounded individually, the columns and rows in the
above table may not show exact sums or weighted averages of the reported tonnes and grades.
� The Mt Carlton Ore Reserve figures are stated at 31 December 2010. � The Mt Carlton Ore Reserve estimate was prepared by Australian Mine Design and Development Pty Ltd. All of the Ore Reserves are for extraction by open pit mining. � The Mt Carlton Ore Reserve estimate is based on Measured and Indicated resources only. The Ore Reserve estimate is based on the Mineral Resource estimation completed in
October 2009 and has not been updated for the more recent estimation as at 30 June 2011. Conquest does not believe that a re-estimate of the Ore Reserve is currently warranted because the change between the October 2009 and June 2011 Mineral Resources has not been material.
� The cut-off grade is defined as the grade that equals the combined processing and site fixed cost per tonne. If a tonne of material exposed on a mining bench contains enough gold, copper and silver to cover the processing and site fixed cost after allowing for processing recoveries and selling costs (off site transport, smelting, refining and royalties) then that tonne is above cut-off grade and is classed as ore. If the recoverable value is less than the processing and site fixed cost per tonne it is below cut-off grade and is classed as waste.
� The gold equivalence calculation was made by Conquest using a gold price of US$1100 per ounce, a silver price of US$22.00 per ounce and a copper price of US$3.50 per pound. Relative estimated metal recovery and payability rates are also incorporated into the gold equivalence calculation.
� Tonnes and grades are stated to a number of significant digits reflecting the confidence of the estimate. Since each number is rounded individually, the columns and rows in the above table may not show exact sums or weighted averages of the reported tonnes and grades.
Mt Rawdon Mineral Resources and Ore Reserves � Mt Rawdon Mineral Resource and Ore Reserves are stated at 30 June 2011, with depletion by production where relevant. � Mineral Resources are inclusive of Ore Reserves. Figures expressed to one decimal place and subject to rounding � Mt Rawdon Mineral Resources have been reported above a cut-off grade of 0.38 g/t of gold. This is the marginal low grade cut-off that covers all operating costs excluding mining
fixed costs, and is based on $900 per ounce USD gold price and $0.75 USD:AUD exchange rate. No economic consideration was attributed to silver. � The Mt Rawdon Ore Reserve estimate is based on a gold cut-off grade of 0.40 g/t contained within the pit designs revised in June 2011. This is the marginal low grade cut-off that
covers all operating costs excluding mining fixed costs, and is based on a $850 per ounce USD gold price, and $0.75 USD:AUD exchange rate. No economic consideration was attributed to silver.
Resources and Reserves
Competent Persons Statement
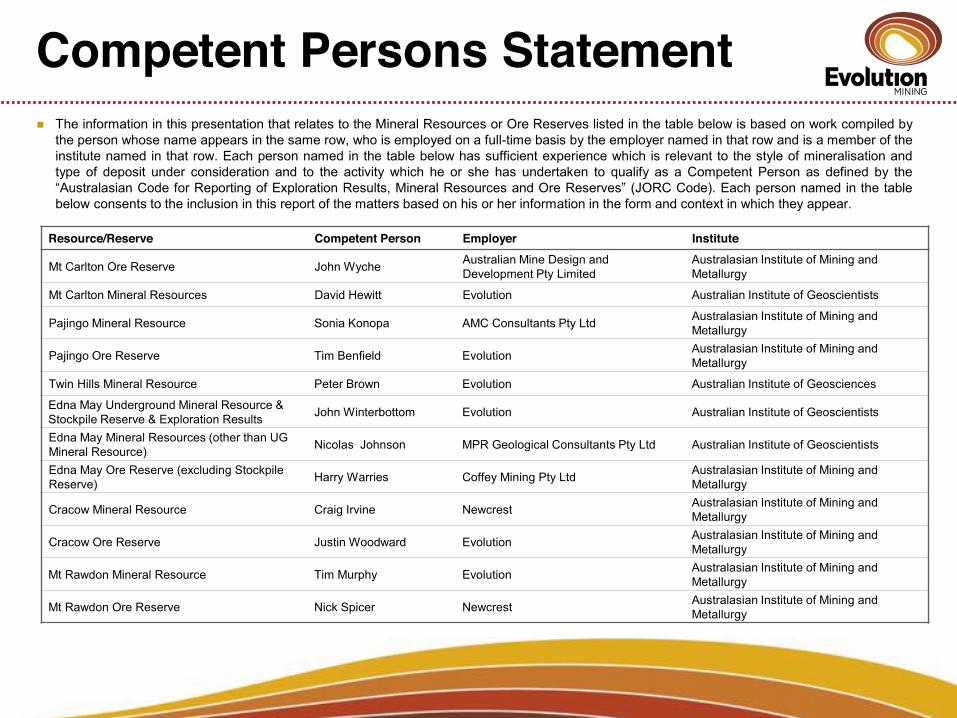
Resource/Reserve Competent Person Employer Institute
Mt Carlton Ore Reserve John Wyche Australian Mine Design and Development Pty Limited
Australasian Institute of Mining and Metallurgy
Mt Carlton Mineral Resources David Hewitt Evolution Australian Institute of Geoscientists
Pajingo Mineral Resource Sonia Konopa AMC Consultants Pty Ltd Australasian Institute of Mining and Metallurgy
Pajingo Ore Reserve Tim Benfield Evolution Australasian Institute of Mining and Metallurgy
Twin Hills Mineral Resource Peter Brown Evolution Australian Institute of Geosciences
Edna May Underground Mineral Resource & Stockpile Reserve & Exploration Results John Winterbottom Evolution Australian Institute of Geoscientists
Edna May Mineral Resources (other than UG Mineral Resource) Nicolas Johnson MPR Geological Consultants Pty Ltd Australian Institute of Geoscientists
Edna May Ore Reserve (excluding Stockpile Reserve) Harry Warries Coffey Mining Pty Ltd Australasian Institute of Mining and
Metallurgy
Cracow Mineral Resource Craig Irvine Newcrest Australasian Institute of Mining and Metallurgy
Cracow Ore Reserve Justin Woodward Evolution Australasian Institute of Mining and Metallurgy
Mt Rawdon Mineral Resource Tim Murphy Evolution Australasian Institute of Mining and Metallurgy
Mt Rawdon Ore Reserve Nick Spicer Newcrest Australasian Institute of Mining and Metallurgy
� The information in this presentation that relates to the Mineral Resources or Ore Reserves listed in the table below is based on work compiled by the person whose name appears in the same row, who is employed on a full-time basis by the employer named in that row and is a member of the institute named in that row. Each person named in the table below has sufficient experience which is relevant to the style of mineralisation and type of deposit under consideration and to the activity which he or she has undertaken to qualify as a Competent Person as defined by the ―Australasian Code for Reporting of Exploration Results, Mineral Resources and Ore Reserves‖ (JORC Code). Each person named in the table below consents to the inclusion in this report of the matters based on his or her information in the form and context in which they appear.

Evolution Mining
www.evolutionmining.com.au