evolution of industry-related volatile organic …
TRANSCRIPT

SINTEZA 2021INTERNATIONAL SCIENTIFIC CONFERENCE ON INFORMATION TECHNOLOGY AND DATA RELATED RESEARCH
107Sinteza 2021submit your manuscript | sinteza.singidunum.ac.rs
DOI: 10.15308/Sinteza-2021-107-111
Filip Alimpić1*,Mirjana Perišić1,2,Svetlana Stanišić1,Gordana Jovanović1,2,Andreja Stojić1,2
1Singidunum University, Belgrade, Serbia
2Institute of Physics Belgrade, National Institute of the Republic of Serbia, Belgrade, Serbia
Correspondence: Filip Alimpić
e-mail: [email protected]
EVOLUTION OF INDUSTRY-RELATED VOLATILE ORGANIC COMPOUND LEVELS AFFECTED BY COVID-19 LOCKDOWN IN BELGRADE
Abstract: In this study, we have evaluated the impacts of emergency state and curfew period on the industry-related volatile organic compound concentrations in Belgrade, Serbia. Pollutant concentrations were registered during the three-month period by using Standard Proton Transfer Reaction Quadrupole Mass Spectrometer (PTR-MS) and data analyses included correlation analysis with hierarchical clustering, probability density functions, and bivariate polar plots. As shown, all compounds, except those registered at protonated mass m/z 121, exhibited a significant drop in concentrations only a week after curfew was introduced. The behavior of analyzed compounds suggests that the VOC concentrations are more affected by industrial than traffic emissions.
Keywords: Air Quality, Volatile Organic Compounds, COVID-19, Lockdown, PTR-MS.
INTRODUCTION
The COVID-19 pandemic in Spring 2020 had a major impact on human behavior, which resulted in significant changes in air quality worldwide and reported benefits to the natural environment. In the period that followed, several studies have used this real-world experiment to enhance our understanding of air pollution and its sources.
The study of Berman and Ebisu has shown statistically significant NO2 declines of 25.5%, as well as a somewhat smaller decrease of PM2.5
levels in urban counties and counties where early non-essential business closures were introduced [1]. The study of Querol et al. investigated air quality changes across 11 metropolises in Spain [2]. Their results emphasized the importance of the massive use of public transport that was reduced because of the fear of infection. While NO2 levels fell below 50% of the WHO annual air quality guidelines, PM2.5 levels were reduced less than expected due to fact that traffic was not the major factor contributing to high PM levels, but also due to the increased contribu-tions from biomass burning or meteorological conditions favoring secondary aerosol formation.
ENVIRONMENTAL DATA SCIENCE SESSION
Sinteza 2021submit your manuscript | sinteza.singidunum.ac.rs
Environmental Data Science Session
108
SINTEZA 2021INTERNATIONAL SCIENTIFIC CONFERENCE ON INFORMATION TECHNOLOGY AND DATA RELATED RESEARCH
In compliance with this, the study of Briz-Redón et al. has shown that the 4-week lockdown had a significant impact on reducing the atmospheric levels of NO2, as well as CO, SO2, and PM10 in some cities, but the levels of O3 were increased [3]. The study of Chen et al. has concluded that the interventions adopted to limit the COVID-19 outbreak have resulted in improvements in air quality and associated health benefits in non-COVID-19 deaths, which could have outnumbered the confirmed deaths attributable to COVID-19 in China [4]. In this study, we have evaluated the impact of 3-month preventive measures and curfew on air quality in Belgrade (Serbia) based on industry-related volatile organic compounds (VOCs).
2. MATERIALS AND METHODS
The measurements of VOCs and meteorological pa-rameters were conducted in Belgrade urban area (44.86o N, 20.39o E) in the period from 2nd March to 2nd June 2020. They covered two weeks before the implementation of the state of emergency introduced as a response to the COVID-19 pandemic and lasted almost one month after the measures were lifted. Standard Proton Transfer Reaction Quadrupole Mass Spectrometer (PTR-MS, Ionicon Analytik, GmbH, Austria) was used for online measurements of 21 to 270 amu mass range [5], [6], while Vaisala weather station was used for measuring meteorological parameters. Calibration of PTR-MS measurements was done according to Taipale and coau-thors [7] by using referent gases and a liquid calibration unit (Ionicon Analytik). Data analyses included corre-lation analysis with hierarchical clustering, probability density functions, and bivariate polar plots [8]. Mobility data was obtained from Google and Apple.
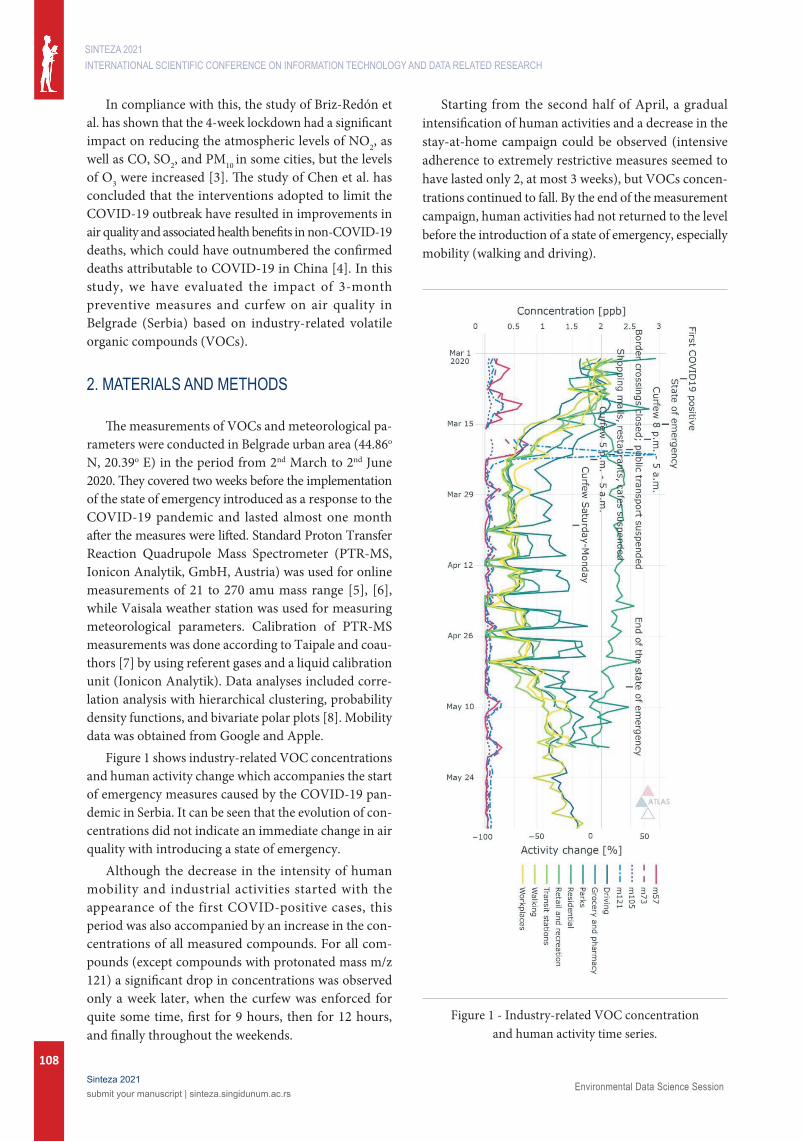
Figure 1 shows industry-related VOC concentrations and human activity change which accompanies the start of emergency measures caused by the COVID-19 pan-demic in Serbia. It can be seen that the evolution of con-centrations did not indicate an immediate change in air quality with introducing a state of emergency.
Although the decrease in the intensity of human mobility and industrial activities started with the appearance of the first COVID-positive cases, this period was also accompanied by an increase in the con-centrations of all measured compounds. For all com-pounds (except compounds with protonated mass m/z 121) a significant drop in concentrations was observed only a week later, when the curfew was enforced for quite some time, first for 9 hours, then for 12 hours, and finally throughout the weekends.
Starting from the second half of April, a gradual intensification of human activities and a decrease in the stay-at-home campaign could be observed (intensive adherence to extremely restrictive measures seemed to have lasted only 2, at most 3 weeks), but VOCs concen-trations continued to fall. By the end of the measurement campaign, human activities had not returned to the level before the introduction of a state of emergency, especially mobility (walking and driving).
Figure 1 - Industry-related VOC concentration and human activity time series.

Sinteza 2021submit your manuscript | sinteza.singidunum.ac.rs
Environmental Data Science Session
109
SINTEZA 2021 INTERNATIONAL SCIENTIFIC CONFERENCE ON INFORMATION TECHNOLOGY AND DATA RELATED RESEARCH
It should be noted that there were a few spikes of concentrations registered at all four masses in the period just before and during the lockdown. For compounds registered at m/z 57, the spike almost 4 times the mean concentration was observed a day before the start of the lockdown. For compounds registered at m/z 73, the spike almost 3 times the mean concentration occurred six days after the beginning of the lockdown. Com-pounds registered at m/z 105 had an intensity spike of 2 times the mean concentration in the event that has occurred 19 days after the start of the lockdown. The largest spike was observed for compounds registered at m/z 121, which raised almost 13 times more than the average readings, and it occurred at the same time as the spike of compounds measured at m/z 73 (six days after the start of the lockdown). General changes in com-pound concentrations during and after lockdown can be assigned to low industrial activity, while the origin of spikes demands further investigation.
In the period before the introduction of the emer-gency state, the correlations between all analyzed VOCs (r-values were in the range from
3. RESULTS AND DISCUSSION
0.81 to 0.95), as well as the interconnection of com-pounds detected at m/z 73 and human activities such as walking, spending time in retail, recreation and transit were observed (Figure 2). The correlation between com-pounds registered at m/z 105 and 121 was the strongest (r=0.95), while the weakest correlations were calculated between compounds registered at m/z 73 and other VOCs (lowest being between compounds registered at m/z 73 and 121 at r=0.81). During the state of emer-gency, the interconnection of all VOCs persisted, excluding compounds registered at m/z 121, as well as the correlations between the observed concentrations and human activities. No correlations between VOCs and human mobility were observed in the period following the lockdown, although the correlations between volatiles, including compounds registered at m/z 121, were re-established.
Figure 3 shows the relative changes in mean VOC concentrations during and after the lockdown com-pared to the pre-introduction period. During the state of emergency, the concentrations of all compounds (except compounds registered at m/z 121) dropped in the range from 30 to 73% compared to the period before its introduction. After the state of emergency was lifted, concentrations continued to fall (35-80%).
The concentrations of compounds registered at m/z 121 recorded an increase of over 36% during the state of emergency, while in the period after the lockdown the level was 20% lower compared to the period before the introduction of the emergency measures.
Figure 2 - Parameter value correlation matrix.

Sinteza 2021submit your manuscript | sinteza.singidunum.ac.rs
Environmental Data Science Session
110
SINTEZA 2021INTERNATIONAL SCIENTIFIC CONFERENCE ON INFORMATION TECHNOLOGY AND DATA RELATED RESEARCH
Figure 3 - Mean VOC concentration difference during and after relative to the period before the
state of emergency.
The probability distribution functions (PDFs) showed unimodality with pronounced peaks during all three periods of the measurement campaign (Figure 4). The PDFs of m/z 57, 73, and 105 suggested lowering the intensity of emissions of dominant sources during the pre-lockdown period. The compounds that have been detected at m/z 121 had a similar unimodal shape of PDF during every period of the measurement campaign.
Figure 4 - VOCs density plots.
The dependence of concentrations on wind direction and speed before the restriction period indicated that the common sources for the analyzed compounds were located in the eastern, western, and southwestern direc-tions from the monitoring site (Figure 5). Additionally, certain emission sources of the compounds registered at m/z 73, 105, and 121 were revealed northeast. The high-est concentrations of m/z 57 were recorded for the wind speeds of 3 to 7 m s 1, coming from the western and eastern direction which suggests that the most intense
emission sources were distant ones. The compounds registered at m/z 73, 105, and 121 had similar behavior patterns. High concentrations for wind speeds ranging from 4 to 6 m s 1 also indicate the influence of remote sources.
With the introduction of emergency measures, a homogenization of pollution in the ground layers of the atmosphere took place, which was reflected in the rela-tively uniform distribution of concentrations of all ana-lyzed volatiles regarding wind direction. The reduction of contribution of distant sources and the dominance of local ones was observed.
After the lockdown period, VOC concentrations remained low, with notable activation of the sources of compounds registered at m/z 73 and 105 in the western and southwestern areas.
Figure 5 - Industry-related VOC dependency on wind parameters.
4. CONCLUSION
As can be concluded, an immediate change in air quality with introducing a state of emergency was not observed. A few spikes of concentrations of industry-related volatile organic compounds were registered in the period just before and during the lockdown, while the general decrease in pollutant concentrations during and after lockdown can be assigned to low industrial activity.

Sinteza 2021submit your manuscript | sinteza.singidunum.ac.rs
Environmental Data Science Session
111
SINTEZA 2021 INTERNATIONAL SCIENTIFIC CONFERENCE ON INFORMATION TECHNOLOGY AND DATA RELATED RESEARCH
In the period before and during the lockdown, the cor-relations between all analyzed VOCs, with exception of compounds registered at m/z 121, and human activities were observed, while after the lockdown no correlations between VOCs and human mobility were detected. The probability distribution functions showed the unimodal distribution of the concentrations with pronounced peaks during all three periods of the measurement cam-paign. During and after the lockdown, the reduction of contribution of distant sources and the dominance of local ones was observed. As can be concluded, the industry appears to be the major source of analyzed volatiles.
5. ACKNOWLEDGEMENTS
The authors acknowledge funding provided by the Institute of Physics Belgrade, through the grant by the Ministry of Education, Science and Technological Development of the Republic of Serbia and the Science Fund of the Republic of Serbia #GRANT No. 6524105, AI-ATLAS.
REFERENCES
[1] J. Berman i K. Ebisu, „Changes in US air pollution during the COVID-19 pandemic,“ Science of the To-tal Environment, t. 739, p. 139864, 2020.
[2] X. Querol, J. Massagué, A. Alastuey, T. Moreno, G. Gangoiti, E. Mantilla i J. Duéguez, „Lessons from the COVID-19 air pollution decrease in Spain: Now what?,“ Science of The Total Environment, t. 779, p. 146380, 2021.
[3] Á. Briz-Redón, C. Belenguer-Sapiña i Á. Serrano-Aroca, „Changes in air pollution during COVID-19 lockdown in Spain: a multi-city study,“ Journal of environmental sciences, t. 101, pp. 16-26, 2021.
[4] C. Kai, M. Wang, C. Huang, P. Kinney i P. Anastas, „Air pollution reduction and mortality benefit dur-ing the COVID-19 outbreak in China,“ The Lancet Planetary Health, t. 4, br. 6, pp. e210-e212, 2020.
[5] W. Lindinger, A. Hansel and A. Jordan, “On-line monitoring of volatile organic compounds at pptv levels by means of proton-transfer-reaction mass spectrometry (PTR-MS) medical applications, food control and environmental research,” International Journal of Mass Spectrometry and Ion Processes, vol. 173, no. 3, pp. 191-241, 1998.
[6] A. Stojić, S. Stanišić Stojić, A. Šoštarić, L. Ilić, Z. Mijić i S. Rajšić, „Characterization of VOC sources in an urban area based on PTR-MS measurements and receptor modelling,“ Environmental Science and Pollution Research, t. 22, br. 17, pp. 13137-13152, 2015.
[7] R. Taipale, T. M. Ruuskanen, J. Rinne, M. K. Kajos, H. Hakola, T. Pohja i M. Kulmala, „Quantitative long-term measurements of VOC concentrations by PTR-MS–measurement, calibration, and volume mixing ratio calculation methods,“ Atmospheric Chemistry and Physics, t. 8, br. 22, pp. 6681-6698, 2008.
[8] S. Grange, A. Lewis i D. Carslaw, „Source appor-tionment advances using polar plots of bivariate correlation and regression statistics,“ Atmospheric Environment, t. 145, pp. 128-134, 2016.