evolution of the venezuelan population...
TRANSCRIPT

NATIONAL MIGRATION TRENDS IN SOUTH AMERICABolivarian Republic of Venezuela
1
Concentration of Venezuelan emigration
Colombia, United States of America and Spain
Growth of flows towards historic destinations
United States of America, Spain
Diversification towards other destinations
Panama, Caribbean Islands, Argentina,Chile, Peru, among others
United States of America: American Community Survey from the US Census Bureau
Spain:Spanish Continuous Register /National Institute for Statistics
Italy, Portugal, Canada: UN DESA 2015 and 2017
Mexico: UN DESA 2015, 2016*** and 2017***
Panama: UN DESA 2015, 2016*** and 2017***
Costa Rica: General Directorate of Migration and Foreigners
Colombia: UN DESA 2015, 2017 Migration Colombia1
Brazil: UN DESA 2015, June 2016 and 2017. Estimate based on the Brazilian Federal Police database
Ecuador2:UN DESA 2015, 2016*** and 2017***
Peru:2015 National Superintendence for Migration, 2016*** and 2017***
Chile3:2015 Chilean Immigration Department, 2016*** and 2017***
According to updated information based on o�cial available sources (such as population statistics, migra-tion records and estimates), the map shows the approximate Venezuelan migrant stock in selected countries. Likewise, due to the limited sources, it is di�cult to quantify irregular migra-tion as well as transit population.
*Estimates based on authors’ calcula-tion for 2016 and 2017 do not add data of refugees or asylum seekers.
**Estimates calculated by the authors based on the National Census and permanent residence permits issued.
***Estimates calculated by the authors based on the 2015 figure, including residence permits that have been since then issued.
Traditionally, the migration dynamic in South America is marked by intra- and extra-regional patterns. In recent years, the Bolivarian Republic of Venezuela has seen changes in its migration processes. Thus, in recent times, there has been an intensification of flows towards traditional destinations as well as new destinations in the region and the world.
UNITED STATES OF AMERICA
255,5202015
290,2242016
MEXICO
15,959 23,7342015 2016
32,5822017
CANADA
17,898 18,6082015 2017
PANAMA
9,883 36,3652015 2017
ECUADORPERU
2,351 4,6652015 2016
CHILE
8,001 34,623 119,0512015 2016 2017
COLOMBIA
48,714 600,0002015 2017
BRAZIL
3,425 5,5232015
URUGUAY
ARGENTINA
12,8562015
COSTA RICA
6,437 7,6922015 2016
8,8922017
2016
35,0002017
25,9602016
PORTUGAL
24,1742015
24,6032017
SPAIN
165,895 180,2892015 2016
208,3332017
ITALY
48,9702015
49,8312017
2016
20,999
26,239 2017
57,1272017
8,901 23,7192015 2016
39,5192017
1,8552015
2,7622016 2017
6,033
ESTIMATE ON SIGNIFICANT DESTINATIONS 2015/2017*
February 2018
WORLDWIDE
SOUTH AMERICA
2005 2010 2015 2017
437,280 556,641 697,562 1,622,109
54,616
380,790 496,352 630,839 1,552,407
62,240 88,975 885,891
SIGNIFICANT DESTINATIONS
(See map)
Argentina4:
2015**, 2016*** and
2017***
Uruguay5:2015**, 2016*** and 2017***
EVOLUTION OF THE VENEZUELAN POPULATION ABROAD
The 2005 and 2010 figures stem from the United Nations Department of Economic and Social A�airs (UN DESA). The 2015 and 2017 figures are derived from UN DESA and other o�cial sources.* The 2017 figure accumulates the latest data available in every country.
SOUTH AMERICA
22
NUMBER OF RESIDENCE PERMITS ISSUED TO VENEZUELAN NATIONALS
0
500
1,000
1,500
2,000
2,500
3,000
3,500
2012 2013 2014 2015 2016 2017
38 62
864
3,271
710
193
Caracas
PERU
ECUADOR
CHILE
VENEZUELA
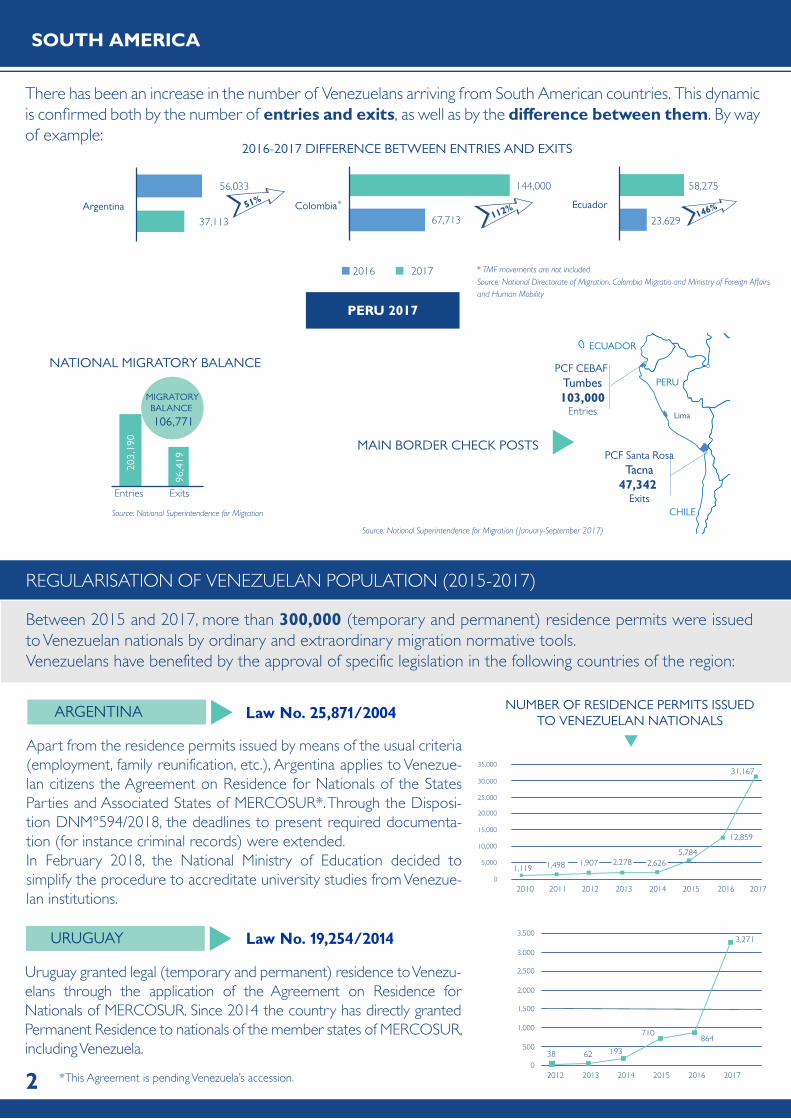
PCF CEBAF Tumbes103,000
Entries
PCF Santa RosaTacna
47,342 Exits
Lima
There has been an increase in the number of Venezuelans arriving from South American countries. This dynamic is confirmed both by the number of entries and exits, as well as by the di�erence between them. By way of example:
REGULARISATION OF VENEZUELAN POPULATION (2015-2017)
Between 2015 and 2017, more than 300,000 (temporary and permanent) residence permits were issued to Venezuelan nationals by ordinary and extraordinary migration normative tools.Venezuelans have benefited by the approval of specific legislation in the following countries of the region:
ARGENTINA
Apart from the residence permits issued by means of the usual criteria (employment, family reunification, etc.), Argentina applies to Venezue-lan citizens the Agreement on Residence for Nationals of the States Parties and Associated States of MERCOSUR*. Through the Disposi-tion DNM°594/2018, the deadlines to present required documenta-tion (for instance criminal records) were extended.In February 2018, the National Ministry of Education decided to simplify the procedure to accreditate university studies from Venezue-lan institutions.
Law No. 19,254/2014
Uruguay granted legal (temporary and permanent) residence to Venezu-elans through the application of the Agreement on Residence for Nationals of MERCOSUR. Since 2014 the country has directly granted Permanent Residence to nationals of the member states of MERCOSUR, including Venezuela.
URUGUAY
Exits Entries
PERU 2017
96,4
19
203,
190
2016-2017 DIFFERENCE BETWEEN ENTRIES AND EXITS
NATIONAL MIGRATORY BALANCE
MAIN BORDER CHECK POSTS
*This Agreement is pending Venezuela’s accession.
0
5,000
10,000
15,000
20,000
25,000
30,000
35,000
20112010 2012 2013 2014 2015 2016 2017
1,119
5,784
12,859
31,167
1,498 1,907 2,278 2,626
MIGRATORY BALANCE
106,771
EcuadorColombia*
67,71337,113
56,033 144,000
23,629
58,275
Argentina
2016 2017
112%51%146%
Source: National Superintendence for Migration
Source: National Directorate of Migration, Colombia Migratio and Ministry of Foreign A�airs and Human Mobility
Source: National Superintendence for Migration ( January-September 2017)
* TMF movements are not included
Law No. 25,871/2004

SOUTH AMERICA
PERMANENT RESIDENCE AND TEMPORARY VISAS ISSUED
NUMBER OF VISA APPLICATIONS IN 2016 AND 2017 APPLICATIONS BY REGION
VISA APPLICANTS BASED ON AGE VISA APPLICANTS BASED ON GENDER
0-14:12.6%
45-74: 8.1%15-44: 79.2% Mayor de 75: 0.2%
Rest of the Country
Metropolitan Region
Maule Region
Valparaiso Region
75% 7.4%
13.9%3.7%
353.2% 46.8%
Other South American countries issue residence permits to Venezuelan nationals only through the ordinary channels of regularisation. In this sense, the number of residence permits issued by Chile is noteworthy.
PERU Supreme Decree No. 002-2017, No. 023-2017 and No. 001-2018
In January 2017, Peru introduced a specific “Temporary Residence Permit” (PTP in Spanish) for the benefit of Venezue-lans that had entered the country before January 2017. Currently the deadline has been extended to December 31, 2018. Since its implementation, more than 27,000 Venezuelans have received the PTP.
Between 2015 and 2017, Chile issued more than 120,000 residence permits considering permanent residence and temporary visas. Temporary visas are divided into three categories: subject to a contract, study or temporary.
During 2016 and 2017, 108,206 Venezuelans who had entered the country with tourist visa have submitted applica-tions for residence permits. It is the foreign group that submitted the largest number of applications for legal residence in such period.
ECUADOR
CHILE
Ecuador-Venezuela Migration Statute and UNASUR Visa
Through the Migration Statute (2011), Ecuador grants temporary residence if economic solvency is proven. Through the UNASUR Visa (2017), the nationals of the block can have access to a two-year temporary residence.
BRAZIL
COLOMBIA
CNIg Resolution No. 126/2017 (See page 5)
Resolution No. 5797/2017, 1272/2017 and 0740/2018 (See page 4)
0
20,000
10,000
30,000
50,000
40,000
70,000
60,000
80,000
90,000
2015 2016 2017
84,425
11,819
72,606
8,381 3,70422,921
26,625
9,730
1,349
2016 20170
30,000
60,000
90,000
30,751
77,455
Temporary residences Permanent residences
Total
151.9%

COLOMBIA Colombia is the main destination for Venezuelans in South America. Likewise, a large percentage of Venezuelan citizens enter Colombia in transit towards third destination countries. This dynamic not only has remained steady, but also increased in recent months, with the following key destinations: Ecuador, Peru, Chile, the United States, Panama, Mexico, Spain, Argentina, Brazil and Costa Rica (Colombia Migration, 2017)6. IOM Colombia leads the coordination of the UN Border Inter-Agency Group. It also works with UNHCR, WFP and the Resident Coordinator on several activities.
Colombia Migration (2017) estimates that around 600,000 Venezuelans are in the country:
Border Mobility Card (TMF in Spanish)
Special Permit of Permanence (PEP in Spanish) (Resolution No. 5797/2017)
This document was created to facilitate mobility in border areas in February 2017.The TMF had been approved for 1,624,915 Venezuelans up until its suspension in 2018. It happens in the context of a circular migration of citizens who reside in border areas and who habitually move between two countries, some even registering several entries and exits per day.Sixty-three per cent of Venezuelans with TMF reported a residence in border States with Colombia.
In July 2017, Colombia implemented a Special Permit of Perma-nence by Resolution No. 5797/2017. In this first stage, the situation of approximately 68,374 Venezuelan nationals who had entered before July 28 was regularised.This Special Permit has been issued mainly in the cities of Bogota, Medellin and Barranquilla.In February 2018, the second phase of the PEP implementation was authorised for the Venezuelan citizens who are at present in the country and who had entered Colombia before February 2 through an o�cial immigration check post.As from the implementation of the PEP, 155,572 applications have been registered.
Access to HealthOn August 18, 2017, the Ministry of Health issued Resolution 3015, which allows the Venezuelan citizens who have the PEP to a�liate to the Colombian health system. The PEP is submitted together with the passport and it enables the person to have access to health services, be it as a contributor to a paid health plan or as part of the subsidised system for those who cannot a�ord it. The nationals who do not have the PEP and are regular have the right to emer-gencies healthcare.
73.225
TachiraZuliaBarinasMeridaOther cities
Bogota
Barranquilla
Other citiesCali
Medellin
CASE STUDY
40%9%
7%
4%3%
Residence of Venezuelans with TMF
11%
37%
42%
5% 5%
4

DTM Brazil: Implementation in the cities of Boa Vista and Pacaraima in the State of Roraima.
CASE STUDY
BRAZIL There has been an increase of Venezuelan citizens entering Brazil in the past two years, through Roraima State, a land border with Venezuela. In fact, a large part of
The presence of the indigenous Warao people in the migration flow has also been observed, with an increase seen in 2017, particularly in the States of Roraima (RR), Amazonas (AM) and Pará (PA). Estimates from the National Human Rights Council (January 2018) establish that around 370 indigenous Warao are sheltered in Boa Vista, and other 370 in Pacaraima (RR); 150 in Manaus (AM);110 in Santarém and 100 in the city of Belém (PA).In addition, there are two other shelters for non-in-digenous Venezuelans in the city of Boa Vista (RR), with around 1,000 people.On March 2 2017, the National Council of Immigration issued CNIg Normative Resolution No.26, which grants a 2-year temporary residence to foreigners from bordering countries for whom the MERCOSUR Resi-dence Agreement is not e�ective. Therefore, Venezuelan nationals can apply for that permit. At the end of July 2017, a measure of exemption from the payment of
migratory fees was taken through a juditial decision.Thus, between March and December 2017, 8,470 residence permits were issued though Normative Resolution No. 126. Of the total number of applicants for temporary residence, 4,220 were filed in the State of Roraima.Brazil is the South American country with the largest number of asylum seekers. According to the Federal Police, 17,865 applications were lodged in 2017, a much higher number than in 2016 (3,354) and 2015 (821).Most of these were initiated in the State of Roraima.In the framework of the Crisis Working Group created by the Government of Brazil, IOM, UNHCR, UNFPA and other United Nations agencies provide technical assistance. Likewise, several activities (training, camp management, regularisation, etc.) are coordinated with UNHCR, UNFPA, the Federal Police and civil society organizations.
IOM Action Plan in Roraima
(i) Support for the migration regularisation.(ii) Training on Camp Coordination and Camp Management (CCCM).(iii) Development of two types of research: one on the legal status of the migrant indigenous population and the other on the integration and access of the Warao people to public policies using the city of Manaus as a case study. (iv) Support to civil society organisations to provide direct assistance to Venezuelan migrants, income genera tion and labour market inclusion of the Warao indigenous people.(v) Implementation of the Displacement Tracking Matrix (DTM).
Brasilia
Caracas
BRAZIL
RORAIMA
VENEZUELA
Boa Vista
residence and asylum applications were requested in the State of Roraima.According to a recent OBMigra7 report, most of the non-indigenous Venezuelans enter the Pacaraima territory by land. This flow comes predominantly from the eastern part of Venezuela (Bolivar State -26,3 per cent, Caracas – 15,4 per cent, Monagas – 16,3 per cent, Anzoátegui – 13,1 per cent and Carabobo – 7,4 per cent).This population is mainly young (72 per cent are in the 20 - 39 age group), and characterised by a male profile (63 per cent). They also have a good level of education (78 per cent have completed their secondary education, and 32 per cent have completed university and graduate studies).
5

COLOMBIA
PERU
Composition of the flows
Colombian-Venezuelans40%30%
30%
Venezuelans
Colombians
First Phase: October-December 2016
Second Phase: June-October 2017
DTM Bogota: being implemented.
Round I: October-November 20178
Round 2: November 2017
Beginning of the trip
Beginning of the trip
FinalDestination
DISPLACEMENT TRACKING MATRIX (DTM)
In the face of the rising flows of Venezuelan nationals in the region it is evidently necessary to understand the profile of Venezuelan migrants, the characteristics and dynamics of migration routes. The DTM is a system to track and monitor the displacement and mobility of population. Some countries in the region have implemented (and/or are about to implement) this tool to have a better understanding of the Venezuelan population that is migrating into the region:
The DTM pilot project was implemented by the IOM and Colombia Migration, and provided knowledge about the nationality profile of the people that make up the migration flow between Colombia and Venezu-ela. The universe of the methodology comprised moving population encompassing three municipalities: Arauca (Arauca), Cucuta and Villa del Rosario (North of Santander).
The information was collected in nine municipalities of the country from the border area with Venezuela and interme-diate cities: Arauca (Arauca), North of Santander (Cucuta and Villa del Rosario), La Guajira (Uribia, Manaure, Maicao, Dibulla and Riohacha) and Bolivar (Cartagena). The process was divided into two parts: household surveys where the Venezuelan population lives and interviews to transit population (border crossing, land terminal). The results will be published soon.
This tool has been applied in the regions of Tacna (border with Chile) and Tumbes (border with Ecuador), as they repre-sent the main entry and exit points, respectively, of the Venezuelan migrants.
Venezuelan migrants are mainly young and professional (from 18 to 35 years of age), mostly single. There is a greater proportion of males. A significant number of those surveyed have children, most of them in Venezuela.
In parallel with the DTM, a qualitative tool was implemented in the metropolitan region of Lima, gathering informa-tion through primary sources such as interviews.
RESULTS
63% 37%
64% 36%
15.8%Tachira
15.8%Caracas
12.8%Carabobo
18%Caracas
14%Carabobo
10%Lara
9%Tachira
65,1%Peru
28,8%Chile
4,5%Argentina
6

Ecuador
Peru
Argentina
Brazil
Colombia
Buenos Aires
United States of America
Panama
Mexico
Costa Rica
Tacna
Santiagode
Chile
Florida Trinidad y Tobago
Aruba
Curaçao
Caracas
Trinidad and Tobago
Venezuela
ArubaCuraçao
Bonaire
Tumbes
Lima
Rumichaca
Arauca
Cucuta
Villa del Rosario
Colombia
Venezuela
Quito
Venezuela
Chile
Mendoza
Pacaraima
Caracas
OTROS DESTINOS IMPORTANTES EN LA REGIÓN LATINOAMERICANAMAP OF MIGRATION ROUTES
7

OTROS DESTINOS IMPORTANTES EN LA REGIÓN LATINOAMERICANA
MEXICO
This is the main destination for Venezuelans in Central America.As from October 1, 2017, the country requires a visa from Venezuelan nationals.Between 2016 and 2017, the number of permits issued tripled. In 2017,10,617 permits were issued by the Extraordinary Regularisation Scheme.
The flows of entries and exits of Venezuelan nationals, as well as the di�erence between them, show a sustained growth over the past three years.
There is a clear increase in the di�erence between the entries and exits of Venezuelan nationals from 2015 to 2016, as well as a rise in the number of residence permits issued
PANAMA
Source: Secretariat of the Interior
Source: National Migration Service, Panama
There has been an increase in the number of migrants from Venezuela.The issuance of Visiting Cards on Humanitarian Grounds stands out, increasing from 181 in 2016 to 1,443 in 2017. These permits are granted to asylum seekers, on humanitarian grounds or for public interest.
Total residence permits issued for Venezuelans
COSTA RICA
DOMINICAN REPUBLIC
Temporary and permanent residence permits issued for
Venezuelans
Temporary residences
NEIGHBOURING CARIBBEAN ISLANDS
Aruba, Curaçao and the Republic of Trinidad and Tobago have received an increased number of Venezuelans. Short distances facilitate mobility.The Government of Curaçao required IOM’s assistance to receive migrants and manage shelters.
Permanent residences
Entries
Exits
Entries
Exits
OTHER COUNTRIES IN LATIN AMERICA AND THE CARIBBEAN
DIFFERENCE BETWEEN ENTRIES AND EXITS:
2014: 373 2015: 1,7842016: 3,6662017: 4,658
20162015 20170
5,000
10,000
8
4,982
2,793
2,235
4,229 5,535
3,313
2016 20170
10,000
20,000
4,615
15,366
2014 2015 20160
10,000
20,000
30,000
40,000
50,000
30,016 29,643 32,962
43,850
2015 2016155,000
160,000
165,000
170,000
175,000
167,176166,903
170,713
161,636
Source: General Directorate of Migration
Source: General Directorate of Migration and Foreigners
Residence permits issued
2015 2016 20170
500
1,000
1,500
345
749
1,529
47,516
2017
35.63240.290
34,746

United States of America
KEY DESTINATIONS IN THE NORTH
Source: American Community Survey/US Census Bureau.
In the United States, the Venezuelan population has experienced a sustained growth in recent years.
The Venezuelan population grew 18 per cent between 2014 and 2015, while in the last interannual variation (2015 to 2016), a 13 per cent increase was regis-tered.
According to the Homeland Security Department (O�ce of Immigration Statistics 2016), 12,242 Venezuelans with tourist visas overstayed during the last fiscal year (from October 1, 2016, to September 30, 2017).
According to the Homeland Security Department (O�ce of Immigration Statistics 2016), about 10,000 legal residence permits per year were issued over the 2004-2015 period. In 2016, 5,662 permanent residence permits were granted to Venezuelans.
In the 2006-2016 period, 64,000 Venezuelans became American citizens.
In Europe, Spain is the main destination from the quantitative point of view for Vene-zuelan emigration. The stock of people born in Venezuela has increased in recent years and it is one of the most dynamic in the group of South American ones.
Spain
Fuente: Elaboración propia en base a Padrón Municipal/Instituto Nacional de Estadística.
In 2017, around 200,000 people born in Venezuela were registered in Spain.The number of women (113,292) is larger than that of men (95,041).More than 60 per cent (127,825) have Spanish citizenship, related to the previous Spanish emigration towards Venezuela.
Italy and PortugalThese countries are receiving increased flows of Venezuelans. Similarly to Spain, many of them already have or are entitled to obtain European citizenship.
2013 2014 20152010 2011 2012 2016 2017140,000
150,000
160,000
170,000
180,000
190,000
200,000
210,000
155,056 159,348 162,063 162,144 160,588
165,895
180,289
208,333
61.3%
38.7%
9
Evolution of the number of Venezuelans in Spain
The interannual variation in the 2014-2015 period was 3,3 per cent, increasing to 8,6 per cent in the 2015-2016 period and almost doubling (15.5 per cent) between 2016 and 2017.
Spanish citizenship Venezuelan citizenship
2013 2014 2015 2016 2010 2011 2012
3,171
184,039 189,219 194,287 197,724216,187
255,520290,224
45.6% 54.4%

Source: UNHCR and Brazilian Federal Police (2018)
Source: Brazilian Federal Police (2018)
OTROS DESTINOS IMPORTANTES EN LA REGIÓN LATINOAMERICANAINFORMATION ABOUT ASYLUM APPLICATIONS
References
1. Colombia Migration.2. Ministry of Foreign A�airs and Human Mobility.3. National Directorate of Migration.4. Department of Registration and Migration.5. National Directorate of Migration.6. Colombia Migration(2017) Migration Snapshot. Colombia-Venezuela. Available athttp://www.migracioncolombia.gov.co.
7. OBMigra (2017) Executive Summary. Sociodemographic and labour pro�le of venezuelan immigration in Brazil. Conselho Nacional de Imigração.8. OIM Peru (2017) DTM Round I. Available at http://peru.iom.int/.9. UNHCR (2018) Venezuela Situation. Available at https://data2.unhcr.org/en/situations/vensit.
According to UNHCR, the number of asylum applications submitted by Venezuelans has risen in recent years. Around 100,000 asylum applications were lodged from 2014 to 20179.
Brazil It is the South American country with the greatest number of asylum applications. According to the Federal Police, most of them (16,841) were lodged in the State of Roraima.
Asylum Applications
2017 - 17,865
2016 - 3,354
2015 - 821
2014 - 207
1,125ChileEcuador 1,563
Spain 12,036Peru 11,573
Costa Rica 4,129
Panama 3,744
Mexico 3,150
Canada 1,847
Brazil 22.247United States of America 46,248
Asylum applications per year


This publication is part of a series of reports on migration produced by the Migration Analysis Unit of the IOM Regional O�ce for South America.
IOM Regional O�ce for South Americawww.robuenosaires.iom.int
www.facebook.com/OIMSuramerica
@OIMSuramerica