evolutionary analysis of functional modules in dynamic ppi
TRANSCRIPT

Evolutionary Analysis of Functional Modules in DynamicPPI Networks
Nan DuComputer Science and
Engineering DepartmentSUNY at Buffalo
Buffalo, 14260, [email protected]
Yuan ZhangCollege of Electronic
Information and ControlEngineering
Beijing University ofTechnology
Beijing, 100124, [email protected]
Kang LiComputer Science and
Engineering DepartmentSUNY at Buffalo
Buffalo, 14260, [email protected]
Jing GaoComputer Science and
Engineering DepartmentSUNY at Buffalo
Buffalo, 14260, [email protected]
Supriya D MahajanDepartment of Medicine
SUNY at BuffaloBuffalo, 14260, U.S.A.
Bindukumar B NairDepartment of Medicine
SUNY at BuffaloBuffalo, 14260, [email protected]
Stanley A. SchwartzDepartment of Medicine
SUNY at BuffaloBuffalo, 14260, U.S.A.
Aidong ZhangComputer Science and
Engineering DepartmentSUNY at Buffalo
Buffalo, 14260, [email protected]
ABSTRACTFunctional module detection in Protein-Protein Interaction(PPI) networks is essential to understanding the organiza-tion, evolution and interaction of the cellular systems. In re-cent years, most of the researches have focused on detectingthe functional modules from the static PPI networks. How-ever, sometimes the structure of the PPI networks changes inresponse to stimuli resulting in the changes of both the com-position and functionality of these modules. These changesoccur gradually and can be thought of as an evolution of thefunctional modules. In our opinions the evolutionary analy-sis of functional modules is a key to form important insightsof the functional modules’ underlying behaviors, particularlywhen targeting complex living systems.
In this paper, we propose a novel computational frame-work which integrates a PPI network with multiple dynamicgene coexpression networks to categorize and track the evo-lutionary pattern of functional modules over consecutive time-stamps. We first propose a method to construct dynamicPPI networks, and then design a new functional influencebased algorithm to detect the functional modules from thesedynamic PPI networks. Based on the results of this ap-proach, we provide a simple but effective method to charac-
Permission to make digital or hard copies of all or part of this work forpersonal or classroom use is granted without fee provided that copies arenot made or distributed for profit or commercial advantage and that copiesbear this notice and the full citation on the first page. To copy otherwise, torepublish, to post on servers or to redistribute to lists, requires prior specificpermission and/or a fee.ACM-BCB’12, October 7-10, 2012, Orlando, FL, USACopyright 2012 ACM 978-1-4503-1670-5/12/10 ...$15.00.
terize and track the evolutionary patterns of dynamic mod-ules, which involves detecting evolutionary events betweenmodules found at consecutive timestamps. Extensive ex-periments on the fermentation process dataset of S. cere-visiae show that the proposed framework not only outper-forms previous functional module detection methods, butalso efficiently tracks the evolutionary patterns of functionalmodules.
Categories and Subject DescriptorsJ.3 [Life And Medical Sciences]: Biology and Genetics
General TermsALGORITHMS
1. INTRODUCTIONProtein Protein Interaction (PPI) networks help us sys-
tematically analyzing the structure of a large living systemand also allow us to understand principles like essentiality,protein interactions, functional modules and cellular path-ways. The identification of functional modules in PPI net-works is of great interest as it often reveals unknown func-tional ties between proteins and thus helps in predictingfunctionalities of unknown genes.
However, traditional functional module detection approachestreat the PPI network as a static graph, where the graph iseither derived from data which is fixed at a certain times-tamp or aggregated from the data collected over a period.These approaches ignore the temporal evolution of the func-tional modules which can offer biologists valuable insights.In the absence of capturing the inherent dynamic charac-
ACM-BCB 2012 250

teristics within the PPI networks, one may miss the op-portunity to capture the evolutionary pattern of functionalmodules.
Protein-Protein interactions are often subjected to exter-nal stimuli and this results in a change in the structure ofthe network during the development. These dynamicallyvarying interactions which sometimes are referred to as tran-sient interactions are caused by stimuli that may be eitherreactive (caused by exogenous factors, such as a responseto environmental stimulus) or programmed (due to endoge-nous signals, such as cell-cycle dynamics or developmentalprocess) [23]. Also, the functional modules detected at eachtimestamp may evolve regularly as the protein interactionsdynamically change over time. Specifically, detecting thefunctional module evolution, that is, the module’s functionschange over time, provides insights into the underlying be-havior of the molecular system. For example, network dy-namics can describe how cells respond to environmental cuesor how an interaction network changes during development.It is also worth mentioning that temporal evolution of thefunctional modules will also be very useful for monitoringchronic and genetic disease development and outcome. Thuswe believe that it is promising to track the evolution of func-tional modules and proteins in the dynamic PPI networks.
In this paper, we propose a framework to categorize andtrack the evolutionary pattern of functional modules overconsecutive timestamps. Accordingly, we begin by construct-ing a series of dynamic PPI networks based on both the PPInetwork and the dynamic gene coexpression networks duringvarious timestamps. We then solve the functional moduledetection problem with a novel functional influence basedalgorithm which quantifies the influence from one biologicalcomponent to another. In addition, the proposed functionalmodule detection method maintains certain levels of moduleequivalence between consecutive timestamps, the detaileddefinition of which will be discussed in Section 2.2. Finally,we try to capture complex evolutionary patterns of func-tional modules over time by analyzing the key evolutionaryevents among modules in consecutive timestamps.
In summary, there are three main contributions of our pa-per: (i) we propose a novel method to construct the dynamicPPI networks by integrating the static PPI network with thedynamic gene coexpression networks; (ii) we propose a newfunctional influence based functional module detection algo-rithm in which the functional modules detected are allowedto be overlapping and would not change dramatically overshort time; (iii) we provide a model for tracking the evolu-tionary process of functional modules over time.
To the best of our knowledge, this is the first work in ana-lyzing the evolutionary patterns of functional modules overconsecutive timestamps. The rest of the paper is organizedas follows. The proposed approach is presented in Section2. Extensive experimental results are shown in Section 3.Finally, we conclude our work in Section 4.
2. METHODWe begin by introducing the method of constructing the
dynamic PPI networks in Section 2.1. In Section 2.2, wewill present the functional influence based algorithm usedfor detecting the functional modules. Finally, the model weused for tracking the evolution of the functional modules ispresented in Section 2.3.
2.1 Dynamic PPI Network ConstructionSeveral researchers have worked on integrating static data
with dynamic data to discover the temporal evolution ofprotein interaction networks. Han et al. integrated the PPInetworks with gene expression data and suggested that somemodules are active at specific times and locations [8]. Qi etal. further noted that the integration of a variety of datasets,including binary interactions, protein complexes and expres-sion profiles, enables the identification of subnetworks thatare active under certain conditions [17].
In order to discover the temporal evolution of functionalmodules, we integrate the static PPI network with a series ofdynamic gene coexpression networks. Given a PPI networkP = (V,E), where V is a set of proteins and E is a setof interactions between these proteins, let M1,M2, ...,MT
be a set of |V | × n gene expression matrices, where T isthe number of timestamps and n is the number of samples(replicates) in the experiments. Our goal is to construct Tdynamic PPI networks D1, D2, ..., DT , each of which is a|V | × |V | matrix. Note that each gene expression matrixM i (1 ≤ i ≤ T ) and dynamic PPI network Di (1 ≤ i ≤ T )corresponds to a specific timestamp i.
Before constructing the dynamic PPI networks, we firstneed to construct a series of gene coexpression networksG1, G2, ..., GT . Gene coexpression networks have been usedto demonstrate that functionally related genes are frequentlycoexpressed across multiple datasets and across different or-ganisms [10], and to estimate the underlying regulatory re-lationships between genes under various experimental con-ditions [1]. By constructing specific gene coexpression net-work at each timestamp, e.g., at early stage, intermediatestage and terminal stage of a certain disease, it is possibleto identify disease-mediated changes in the network connec-tivity patterns.
For each gene pair, the absolute Pearson correlation coeffi-cient of their expression profiles along samples is calculated,and the output is a |V |×|V | correlation matrix, which repre-sents expression similarity between each gene pair. Based onthese correlation matrices, we can easily construct the genecoexpression network, where each node is a gene and eachedge represents that the correlation measure between twogenes is greater than a cutoff threshold. This cutoff thresh-old is used to remove all but the most likely biologically-significant relationships, and we choose an appropriate cut-off threshold based on the average correlation similarity fromeach correlation matrix.
Combining static PPI network with time course gene ex-pression data leads to a better understanding of protein orgene function and reveals global changes in network topol-ogy that hint at higher level cellular organizational princi-ples and functions [16]. Furthermore, we can regulate thechanges of proteins’ relationships and also track the evolu-tionary process of the functional modules by integrating thestatic PPI network with time course gene expression data.After we get the gene coexpression networks G1, G2, ..., GT ,we integrate them with the PPI network P by the rule thatif one interaction exists at both the PPI network P and thei-th dynamic gene coexpression network Gi, this interactionwould be added to the i-th dynamic PPI network Di. Oth-erwise, we believe that there is no interaction between thisprotein pair at this timestamp. An example of constructingdynamic PPI networks is presented in Figure 1.
ACM-BCB 2012 251

Figure 1: An example of constructing dynamic PPI networks at five timestamps.
2.2 Functional Influence based Functional Mod-ule Detection
In recent years, many methods have been developed to de-tect functional modules in a PPI network, such as MarkovClustering (MCL) [5] which is a fast stochastic flow basedclustering algorithm for graph, hierarchical clustering method[7] and spectral clustering method [24]. Furthermore, two ofour previous algorithms based on functional influence havealso been proposed, which efficiently analyzed large-sized,complex PPI networks [3, 20]. The functional influence al-gorithm was first proposed by Nabieva et al [13], and the ba-sic idea of it is that influence is propagated from the sourceproteins to the surrounding neighborhoods, and this processis repeated for each protein until each protein in the graphhas an influence score. This influence score represents theamount of functional influence received by the protein for agiven function.
However, since these approaches are not designed for dy-namic graphs clustering, they do not consider the temporalcharacteristic of the dynamic PPI networks, where the inter-actions between proteins continuously evolve. Therefore, wepropose to design a novel functional influence based methodwhich can effectively identify the protein functional modulesthat reflect the temporal evolution over consecutive times-tamps. Our method also allows the overlapping between themodules and can automatically estimate the optimal num-ber of modules at each timestamp.
The Principle of Module Equivalence.Since living systems are subjected to the external stim-
uli, the interactions between proteins also evolve with timewhich raises a new challenge for the traditional clustering al-gorithms. Since in our case, the clusters evolve continuously,which is different with the case in which the traditional clus-tering algorithms usually handle, some new considerationsare needed. On one hand, we expect to detect the func-tional modules that depend on the current PPI network; onthe other hand, we also expect that the detected functionalmodules do not deviate too dramatically from the previoustimestamp’s PPI network. Similar principles have also beenused in [2]. In other words, since the living system is morelikely to change gradually instead of dramatically, we ex-pect certain level of module equivalence between functionalmodules detected in consecutive timestamps. Moreover, in
many cases, the dramatic change of functional modules overa short time could be due to the noise which may come fromsample contamination, experimental design or the cluster-ing method. Fulfilling the module equivalence can also helpin generating more robust results that are not sensitive tonoise; this is validated in the experiment.
Figure 2: An example of illustrating module equiv-alence. (a) the clustering results evolve gradually;(b) the clustering results change dramatically.
Consider the simple example shown in Figure 2. There aretwo clustering results (a) and (b) of 7 proteins over 3 times-tamps, where each node is a protein and the nodes enclosedtogether denotes a cluster. It is easy to notice that, theproteins partitioned into the same cluster are stable in re-sult (a), where each cluster changes gradually over time. Onthe contrary, the proteins partitioned together in result (b)change dramatically. Therefore, according to the principleof module equivalence, (a) should be preferred. Obviously,it is easier and more reasonable to track the evolutionarypatterns of functional modules in (a) than (b).
To achieve certain level of module equivalence betweenfunctional modules in consecutive timestamps, we proposea method to construct a series of weighted dynamic PPInetworks, which takes the PPI network from the previoustimestamp into account and guarantees that the modules
ACM-BCB 2012 252

change smoothly in consecutive timestamps. Given T times-tamps’ unweighted dynamic PPI networks D1, D2, ..., DT
which have been introduced in Section 2.1, we aim at con-structing T weighted dynamic PPI networks WD1,WD2, ...,WDT , where each dynamic PPI network can be representedas WDi = (V i, Ei). The weight between proteins u and vin WDi is defined as:
WDiuv =
⎧⎪⎨⎪⎩
α, if Di−1uv = 1 xor Di
uv = 1,
β, if Di−1uv = 1 and Di
uv = 1,
0, otherwise,
(1)
where α and β are pre-set weights, and 0 ≤ α < β ≤ 1. Theassumption is that the weight of an interaction between pro-teins u and v at i-th timestamp is based on both unweighteddynamic PPI networks Di−1 and Di. If a particular inter-action exists at both of these consecutive timestamps, wehave a high confidence that this interaction is reliable andstable, and thus it would be assigned a high weight β. If thisinteraction only exists at one of the two consecutive times-tamps, it would be less confident that it does not come fromnoise, and thus it would be assigned a relatively low weightα. It can also be considered as that we use previous PPInetwork as an evidence to weigh the current network. Inaddition, when i = 1 it does not have previous timestamp,thus WD1
uv = α if there is an interaction between proteinu and v in D1. In our experiments, we set α = 0.1 andβ = 0.2.
Functional Flow Model.Based on the weighted dynamic PPI networks WDi (1 ≤
i ≤ T ), we design a modified influence based functional mod-ule detection algorithm. We first select some proteins to bethe source protein set S which are the start points to prop-agate the influence based on the weighted degrees of theproteins. A previous research [9] has observed that the con-nectivity of nodes in biological networks plays a crucial rolein cellular functions. The weighted degree of protein u, de-noted d(u), is the summation of the weights between u andits neighbors and the formula is shown as Eq. 2, where N(u)is the set of the neighbors of protein u and wuv is the weightof the edge between the protein u and v.
d(u) =∑
v∈N(u)
wuv. (2)
Secondly, we assign an initial influence weight to eachsource protein s (s ∈ S) and propagates the weight to itsneighbors x. The process of computing the initial flow f(s →x) from s to x is denoted as:
f(s → x) =wsx∑
z∈N(s) wsz× F (s) , (3)
where F (s) is the initial influence score for the source pro-tein which we assign as a constant value 1 and wsx is thenormalized weight of the edge between s and x. The influ-ence score of x is then updated by summing of all incomingflows from its neighbors, which is shown as Eq. 4.
F (x) =∑
u∈N(x)
fs(u → x) . (4)
After updating the influence weight, x propagates its influ-ence weight to its neighbors, this process is defined as:
f(x → y) =wxy∑
z∈N(x) wxz× F (x) . (5)
The flow f(x → y) would be removed if it is less than athreshold θflow. Eq. 4 and Eq. 5 are repeated until thereis no more flow in the network. By the end of the flowsimulation, we can obtain a flow pattern which is a |S|× |V |matrix, where each vector is a set of cumulative quantitiesof functional influences for a particular source protein s overall the proteins. The functional influence profile is a vectorwhere each item reflects the functional influence receivedfrom a source protein in the network. In the flow pattern,all the proteins that have a higher functional influence scorethan the threshold θflow, would be grouped into a functionalmodule.
Merging Preliminary Modules.Note that the preliminary modules extracted from flow
pattern are typically overlapped since a protein may have ahigh functional influence to multiple source proteins. How-ever, the quality of these preliminary modules mainly de-pends on the source protein selection. Through merging thesimilar preliminary modules which have a large fraction ofcommon members, we obtain the final modules which havehigher accuracy. It is an important step to merge the similarpreliminary modules to generate the final modules [6]. Sincethese final modules are merged from the overlapped prelim-inary modules, they are also overlapped. The real func-tional modules are likely to be overlapping, since a moleculegenerally may perform different biological processes or func-tions in different environments [26]. In our work, we setθflow = 0.02.
In our case, we use a hierarchical clustering algorithm tomerge the preliminary modules based on the Jaccard in-dex between modules [25]. However, one difficult issue infunctional module detection is to determine the number ofclusters. As we know, the classic hierarchical clustering al-gorithms suffer from the limitation that the number of clus-ters is specified by users. It is impractical to expect wehave sufficient domain knowledge to determine the numberof modules for each timestamp. Also, it is unreasonable toassume that the number of clusters at each timestamp isthe same. Therefore, in our work, we use the method of[19] which proposed a L curve method to automatically es-timate the optimal number of clusters by using the propertyof the knee shape graph to identify the appropriate numberof functional modules. Therefore, in our method, the num-ber of clusters is unbounded, and an optimal number can beautomatically determined.
2.3 Evolutionary EventsRecently, a few approaches have been proposed to charac-
terize the evolution of clusters over consecutive timestampsin social networks. Takaffoli et al. [22] described an event-based framework to track the transitions between clusters atconsecutive timestamps, and they improved the event formu-lae to track the entire observation time in a later work [21].All these works have used a two-stage approach in whichthe clusters are first detected independently at each times-tamp, and then matched to determine the critical evolution-ary events. As mentioned before, our functional modules de-tected from consecutive timestamps are simultaneously in-fluenced by two consecutive timestamps which makes our
ACM-BCB 2012 253
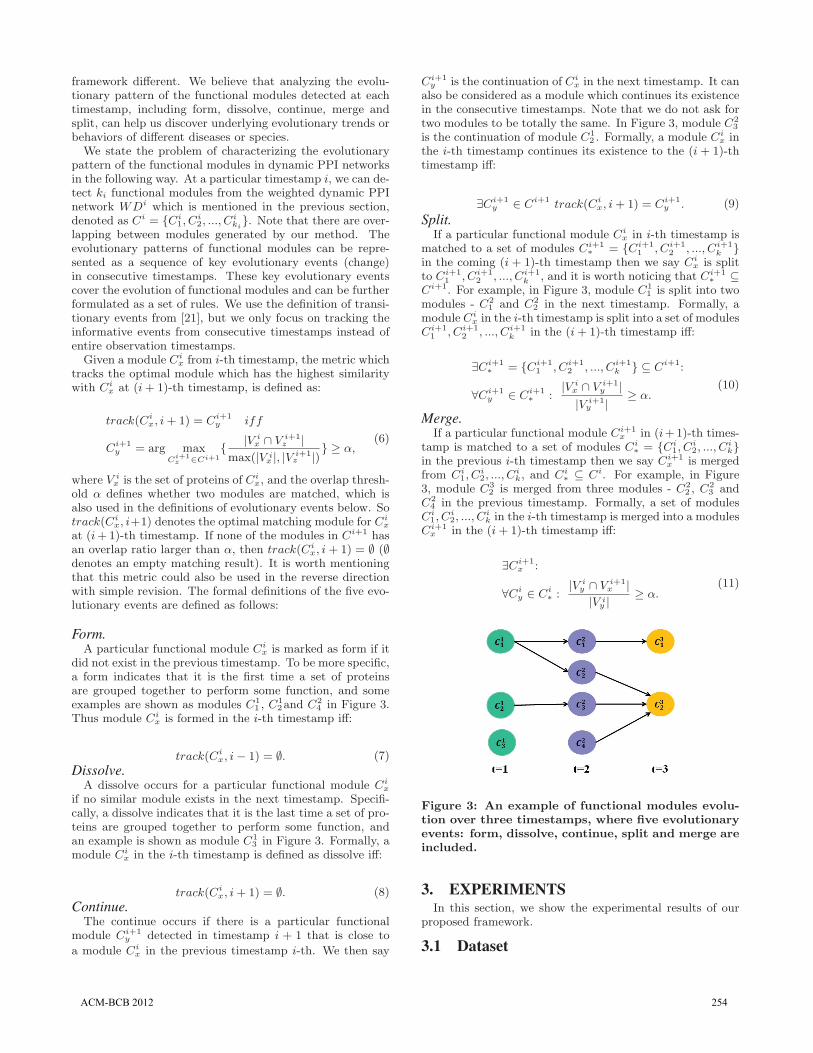
framework different. We believe that analyzing the evolu-tionary pattern of the functional modules detected at eachtimestamp, including form, dissolve, continue, merge andsplit, can help us discover underlying evolutionary trends orbehaviors of different diseases or species.
We state the problem of characterizing the evolutionarypattern of the functional modules in dynamic PPI networksin the following way. At a particular timestamp i, we can de-tect ki functional modules from the weighted dynamic PPInetwork WDi which is mentioned in the previous section,denoted as Ci = {Ci
1, Ci2, ..., C
iki}. Note that there are over-
lapping between modules generated by our method. Theevolutionary patterns of functional modules can be repre-sented as a sequence of key evolutionary events (change)in consecutive timestamps. These key evolutionary eventscover the evolution of functional modules and can be furtherformulated as a set of rules. We use the definition of transi-tionary events from [21], but we only focus on tracking theinformative events from consecutive timestamps instead ofentire observation timestamps.
Given a module Cix from i-th timestamp, the metric which
tracks the optimal module which has the highest similaritywith Ci
x at (i+ 1)-th timestamp, is defined as:
track(Cix, i+ 1) = Ci+1
y iff
Ci+1y = arg max
Ci+1z ∈Ci+1
{ |V ix ∩ V i+1
z |max(|V i
x |, |V i+1z |)} ≥ α,
(6)
where V ix is the set of proteins of Ci
x, and the overlap thresh-old α defines whether two modules are matched, which isalso used in the definitions of evolutionary events below. Sotrack(Ci
x, i+1) denotes the optimal matching module for Cix
at (i+1)-th timestamp. If none of the modules in Ci+1 hasan overlap ratio larger than α, then track(Ci
x, i+ 1) = ∅ (∅denotes an empty matching result). It is worth mentioningthat this metric could also be used in the reverse directionwith simple revision. The formal definitions of the five evo-lutionary events are defined as follows:
Form.A particular functional module Ci
x is marked as form if itdid not exist in the previous timestamp. To be more specific,a form indicates that it is the first time a set of proteinsare grouped together to perform some function, and someexamples are shown as modules C1
1 , C12and C2
4 in Figure 3.Thus module Ci
x is formed in the i-th timestamp iff:
track(Cix, i− 1) = ∅. (7)
Dissolve.A dissolve occurs for a particular functional module Ci
x
if no similar module exists in the next timestamp. Specifi-cally, a dissolve indicates that it is the last time a set of pro-teins are grouped together to perform some function, andan example is shown as module C1
3 in Figure 3. Formally, amodule Ci
x in the i-th timestamp is defined as dissolve iff:
track(Cix, i+ 1) = ∅. (8)
Continue.The continue occurs if there is a particular functional
module Ci+1y detected in timestamp i + 1 that is close to
a module Cix in the previous timestamp i-th. We then say
Ci+1y is the continuation of Ci
x in the next timestamp. It canalso be considered as a module which continues its existencein the consecutive timestamps. Note that we do not ask fortwo modules to be totally the same. In Figure 3, module C2
3
is the continuation of module C12 . Formally, a module Ci
x inthe i-th timestamp continues its existence to the (i + 1)-thtimestamp iff:
∃Ci+1y ∈ Ci+1 track(Ci
x, i+ 1) = Ci+1y . (9)
Split.If a particular functional module Ci
x in i-th timestamp ismatched to a set of modules Ci+1
∗ = {Ci+11 , Ci+1
2 , ..., Ci+1k }
in the coming (i + 1)-th timestamp then we say Cix is split
to Ci+11 , Ci+1
2 , ..., Ci+1k , and it is worth noticing that Ci+1
∗ ⊆Ci+1. For example, in Figure 3, module C1
1 is split into twomodules - C2
1 and C22 in the next timestamp. Formally, a
module Cix in the i-th timestamp is split into a set of modules
Ci+11 , Ci+1
2 , ..., Ci+1k in the (i+ 1)-th timestamp iff:
∃Ci+1∗ = {Ci+1
1 , Ci+12 , ..., Ci+1
k } ⊆ Ci+1:
∀Ci+1y ∈ Ci+1
∗ :|V i
x ∩ V i+1y |
|V i+1y | ≥ α.
(10)
Merge.If a particular functional module Ci+1
x in (i+1)-th times-tamp is matched to a set of modules Ci
∗ = {Ci1, C
i2, ..., C
ik}
in the previous i-th timestamp then we say Ci+1x is merged
from Ci1, C
i2, ..., C
ik, and Ci
∗ ⊆ Ci. For example, in Figure3, module C3
2 is merged from three modules - C22 , C
23 and
C24 in the previous timestamp. Formally, a set of modules
Ci1, C
i2, ..., C
ik in the i-th timestamp is merged into a modules
Ci+1x in the (i+ 1)-th timestamp iff:
∃Ci+1x :
∀Ciy ∈ Ci
∗ :|V i
y ∩ V i+1x |
|V iy | ≥ α.
(11)
Figure 3: An example of functional modules evolu-tion over three timestamps, where five evolutionaryevents: form, dissolve, continue, split and merge areincluded.
3. EXPERIMENTSIn this section, we show the experimental results of our
proposed framework.
3.1 Dataset
ACM-BCB 2012 254

To construct the dynamic PPI networks, we have used twodata sources, one is the static PPI network, and the other isthe time course gene expression data.
Time Course Gene Expression Data.We use a time course gene expression dataset which repre-
sents the response of S. cerevisiae in a 15-day wine fermen-tation that is the process of S. cerevisiae turning the sugarof crushed grapes into alcohol. The dataset consists of seventimestamps (0, 12, 24, 48, 60, 120, and 340 hours which re-sponse to different ethanol concentrations), and there is agene expression matrix created at each timestamp. In or-der to have a high cover ratio with the PPI network, weused the top 1285 genes which have the most known inter-actions in the DIP’s PPI dataset1. In addition, for each ofthe 1285 genes, the primary data consist of three indepen-dent biological samples at each of seven timestamps. Theraw microarray data are published on Apr. 17, 2008 andavailable at the National Center for Biotechnology Informa-tion database2 (NCBI) with the accession number GSE8536[12]. In our experiments, we set the cutoff thresholds forseven timestamps’ correlation matrices as 0.76, 0.76, 0.83,0.79, 0.73, 0.76 and 0.70, respectively, corresponding to theiraverage correlation similarity.
PPI Network.We used the S. cerevisiae data from the Database of In-
teracting Proteins3 (DIP) database which was updated onFeb. 28, 2012. The S. cerevisiae PPI dataset contains totally22,418 interactions.
3.2 Similarity between Functional Modules overTimestamps
As we mentioned before, in the real world, the cellularsystem evolves gradually over time; thus we believe that thefunctional modules detected from each timestamp shouldchange smoothly instead of dramatically. We assessed thefunctional modules’ similarity across the timestamps by com-paring the proposed method with some classical clusteringmethods: K-means, Hierarchical clustering, Fuzzy c-meansclustering (FCM) and Spectral clustering. In addition, sincethese baseline algorithms are required to preset the clusternumber K, thus for each algorithm, we have tested both thecases when K = 15 and when K = 30. Note that amongthese baseline algorithms, K-means, Hierarchical clusteringand Spectral clustering are non-overlapping clustering algo-rithms, and Fuzzy c-means is an overlapping clustering algo-rithm in which each node has a membership value for eachcluster. In our experiments, if one particular node x’s mem-bership value for a cluster Ci
j is larger than 0.1 we would
assign x to Cij . We also show our proposed method’s perfor-
mance without considering the module equivalence throughthe consecutive timestamps.
To measure the similarity between the functional modules,we use the Jaccard index, which is defined as:
J(Cix, C
i+1y ) =
|V ix ∩ V i+1
y ||V i
x ∪ V i+1y | , (12)
which is between 0 and 1. Then we summed up and av-
1As list at www.acsu.buffalo.edu/ nandu/GeneNames.docx2www.ncbi.nlm.nih.gov/3http://dip.doe-mbi.ucla.edu/dip/
eraged all the maximal Jaccard value for each module at acertain timestamp to be the final result, where a high valueindicates that the modules detected at two separate times-tamps are similar, or dissimilar otherwise. The results of allthe methods are shown in Table 1. As can be seen, our pro-posed method shows higher module similarity over all times-tamps than the other methods, since the baseline algorithmsonly consider the PPI network at the current timestamp. Itdemonstrates that our proposed framework properly han-dled the functional modules’ smoothly evolution.
3.3 Functional Module IdentificationTo evaluate the effectiveness of our proposed framework,
we used Funcat as the functional annotation from MIPSdatabase. MIPS Functional Catalogue (FunCat) [18] is anannotation scheme for the functional description of proteinsof prokaryotic and eukaryotic origin, and we used the topfour levels of Funcat for validation. For statistical evolu-tion of the detected modules, we used the p-value from thehypergeometric distribution, which is defined as:
p = 1−m−1∑i=0
(|X|i
)(|V |−|X|n−i
)(|V |
n
) , (13)
where |V | is the number of proteins in the PPI network, |X|is the number of proteins in a reference function, n is the sizeof the modules, and m is the number of proteins in commonbetween the function and the module. It is understood asthe probability that at least m proteins in a module of size nare included in a reference function of size |X|. A low valueof p-value demonstrates that the module closely correspondsto the function, since it is not likely that the network willproduce the module by chance.
Similarly , we assessed the proposed algorithm’s perfor-mance by comparing it with the baseline algorithms de-scribed in Section 3.2. The results are shown in Table 2. Asthe table shows, our proposed framework remarkably out-performs the baseline algorithms at each timestamp. Thisresult indicates two things: 1) by following the principle ofmodule equivalence, our functional influence based methodprovides more robust functional modules which are not sen-sitive to noise; and 2) our functional influence based overlap-ping functional module detection algorithm is more effective.
3.4 Informative Module IdentificationIn this part, we used the evolutionary events which are
defined in Section 2.3 to track the informative behavioralpatterns in the evolving graph. We define core-module asthe intersection of a series of modules which are linked asa connected graph by the evolutionary events at differenttimestamps and represents the evolution of its constituentcommunities ordered by time over the entire timestamps.To be more specific, the core-community is denoted as M ={Ct1
k1∩ Ct2
k2... ∩ Ctm
km}, where t1 < t2 < ... < tm.
By tracking the critical evolutionary events between times-tamps, we found some interesting results. Figure 4 shows theevolving graphs for four α values: 0.6, 0.7, 0.8 and 0.9, re-spectively. In the evolving graph, each node is a functionalmodule detected at a particular timestamp and each edgeis an interaction (event) between modules between two con-secutive timestamps. We see from Figure 4 that, as the αincreases, the number of detected evolutionary events be-comes less and less. Also, the backbone of the evolution
ACM-BCB 2012 255

Table 1: Comparing of modules’ similarity across timestampt=0-12 t=12-24 t=24-48 t=48-60 t=60-120 t=120-340 Ave
Evolution Flow 0.49 0.53 0.55 0.53 0.51 0.51 0.52Evolution Flow (Without Smoothness) 0.24 0.29 0.32 0.29 0.3 0.28 0.28
K-means (K=15) 0.10 0.13 0.07 0.09 0.09 0.10 0.10K-means (K=30) 0.19 0.23 0.24 0.21 0.21 0.2 0.21FCM (K=15) 0.22 0.21 0.22 0.22 0.22 0.25 0.21FCM (K=30) 0.16 0.15 0.22 0.24 0.14 0.15 0.17
Spectral Clustering (K=15) 0.24 0.27 0.30 0.30 0.26 0.21 0.26Spectral Clustering (K=30) 0.2 0.16 0.21 0.17 0.17 0.22 0.18
Table 2: Comparing of − log(p-value)t=0 t=12 t=24 t=48 t=60 t=120 t=340 Ave
Evolution Flow 7.51 10.64 9.03 11.71 8.99 9.56 10.46 9.7K-means (K=15) 4.66 3.64 3.79 4.63 4.48 3.92 4.21 4.19K-means (K=30) 4.21 4.34 4.13 3.84 3.82 4.01 3.64 3.99FCM (K=15) 6.69 8.26 9.09 6.77 8.03 5.43 8.4 7.52FCM (K=30) 5.18 6.8 6.5 5.79 6.27 5.52 7.39 6.85
Spectral Clustering (K=15) 6.25 7.97 8.57 9.57 8.14 8.17 7.21 7.98Spectral Clustering (K=30) 5.56 5.33 5.52 5.29 5.32 4.75 5.31 5.29
becomes clearer. Finally, when α = 0.9, we can detect amodule which is consistent over all timestamps. To makeit clearer, we extracted this module and represented it indashed lines in Figure 4(d). It is easy to note that the core-module is M∗ = {C1
1 ∩C22 ∩C3
2 ∩C41 ∩C5
1 ∩C63 ∩C7
1}, whichincludes 25 core proteins which are POL30, RAD1, PIN3,RAD23, HRT1, YOL087C, RAD7, UBA1, MET30, MGT1,RVS167, HSE1, CDC48, SAN1, PRP8, RPL40A, SNF1,CLB2, KSS1, SWD1, RPL40B, MUS81, SWI5, GRR1 andGPA1.
The consistency shows that the proteins which are in-cluded in this core-module interact strongly over the en-tire observation period. This is not surprising since thisfunctional module is essentially involved in cell growth andcell death, as well as ethanol concentrations changing. Suchconsistency in evolutionary patterns of this module may pro-vide clues about how proteins response to external stimuliduring the wine fermentation progression. The top 10 bi-ological process annotations of this core-module M∗ withvery low p-value are shown in Table 3, which are calculatedby [11]. Some functional key words such as protein ubiquiti-nation, protein conjugation, post-translational modification,response to stimulus and catabolic process, have been provento play an important role in the process of S. cerevisiae fer-mentation [15, 14, 4].
4. CONCLUSIONSIn this paper, we proposed a framework for analyzing
the evolutionary patterns of functional modules in dynamicPPI networks. Since this framework has considered the in-herent dynamic characteristics within the PPI networks, itmay provide novel insights into the underlying behaviors ofthe molecular system. To our best knowledge, this is thefirst evolutionary analysis of functional modules in dynamicPPI networks. Using the wine fermentation of S. cerevisiaedataset over consecutive timestamps, we demonstrated thegene annotation enrichment of the identified functional mod-ules, the sets of proteins that participate in the same bio-logical function, in high confidence. Also, the results of the
experiment in Section 3.4 lead to the conclusion that theproposed framework can categorize and track the evolution-ary events of the functional modules effectively, and obtainsan informative functional module which plays an importantrole over the entire observation time. Through deeply ana-lyzing the gene annotations of the functional modules whoseevolutionary pattern are distinctive, we may capture impor-tant insights of various diseases or creatures.
5. REFERENCES[1] K. Basso and et al. Reverse engineering of regulatory
networks in human b cells. Nature Genetics, 37(4):382–390,2005.
[2] Y. Chi and et al. On evolutionary spectral clustering. ACMTransactions on Knowledge Discovery from Data,3(4):1–30, 2009.
[3] Y.-R. Cho, L. Shi, and A. Zhang. flownet: Flow-basedapproach for efficient analysis of complex biologicalnetworks. 2009 Ninth IEEE International Conference onData Mining, pages 91–100, 2009.
[4] J. Ding and et al. Tolerance and stress response to ethanolin the yeast saccharomyces cerevisiae. Applied Microbiologyand Biotechnology, 74(2):253–263, 2010.
[5] A. J. Enright, S. Van Dongen, and C. A. Ouzounis. Anefficient algorithm for large-scale detection of proteinfamilies. Nucleic Acids Research, 30(7):1575–1584, 2002.
[6] L. Getoor and C. P. Diehl. Link mining: a survey. SIGKDDExplor. Newsl., 7(2):3–12, Dec. 2005.
[7] M. Girvan and M. E. J. Newman. Pnas communitystructure in social and biological networks communitystructure in social and biological networks- pnas. PNAS,pages 1–9, 2002.
[8] J.-D. J. Han and et al. Evidence for dynamically organizedmodularity in the yeast protein-protein interaction network.Nature, 430(6995):88–93, 2004.
[9] H. Jeong, S. P. Mason, A. L. BarabA ↪asi, and Z. N. Oltvai.Lethality and centrality in protein networks. Nature,411(6833):41–42, 2001.
[10] H. K. Lee and et al. Coexpression analysis of human genesacross many microarray data sets. Genome Research,14(6):1085–1094, 2004.
[11] S. Maere, K. Heymans, and M. Kuiper. Bingo: a cytoscapeplugin to assess overrepresentation of gene ontology
ACM-BCB 2012 256

Table 3: Top 10 biological process annotations for the core-module M∗
GO-ID p-value Description16567 7.92E-10 protein ubiquitination32446 5.48E-09 protein modification by small protein conjugation70647 3.42E-08 protein modification by small protein conjugation or removal43687 4.13E-07 post-translational protein modification51716 8.25E-07 cellular response to stimulus43412 1.15E-06 macromolecule modification42787 1.17E-06 protein ubiquitination involved in ubiquitin-dependent protein catabolic process6974 1.78E-06 response to DNA damage stimulus6464 1.88E-06 protein modification process50896 3.64E-06 response to stimulus
Figure 4: Plot of evolving graph with varying α values.
categories in biological networks. Bioinformatics,21(16):3448–3449, 2005.
[12] V. Marks and et al. Dynamics of the yeast transcriptomeduring wine fermentation reveals a novel fermentationstress response. FEMS Yeast Research, 8(1):35–52, 2008.
[13] E. Nabieva and et al. Whole-proteome prediction of proteinfunction via graph-theoretic analysis of interaction maps.Bioinformatics, 21 Suppl 1:302–310, 2005.
[14] S. Ostergaard, L. Olsson, and J. Nielsen. Metabolicengineering of saccharomyces cerevisiae. Microbiology andMolecular Biology Reviews, 64(1):34–50, 2000.
[15] N. Piggott, M. Cook, M. Tyers, and V. Measday.Genome-wide fitness profiles reveal a requirement forautophagy during yeast fermentation. G3 (Bethesda),1(5):353–67, 2011.
[16] T. M. Przytycka, M. Singh, and D. K. Slonim. Toward thedynamic interactome : it’s about time. Access, 11(1), 2010.
[17] Y. Qi and H. Ge. Modularity and dynamics of cellularnetworks. PLoS Computational Biology, 2(12):9, 2006.
[18] A. Ruepp and et al. The funcat, a functional annotationscheme for systematic classification of proteins from wholegenomes. Nucleic Acids Research, 32(18):5539–5545, 2004.
[19] S. Salvador and P. Chan. Determining the number ofclusters/segments in hierarchical clustering/segmentationalgorithms. 16th IEEE International Conference on Tools
with Artificial Intelligence, 1(Ictai):576–584, 2004.[20] L. Shi, Y.-R. Cho, and A. Zhang. Functional flow
simulation based analysis of protein interaction network.BIBE ’10, pages 144–149, 2010.
[21] M. Takaffoli, F. Sangi, J. Fagnan, and O. R. Za. Modec -modeling and detecting evolutions of communities.Artificial Intelligence, pages 626–629, 2010.
[22] M. Takaffoli, F. Sangi, J. Fagnan, and O. R. Zaiane. Aframework for analyzing dynamic social networks. Science,2010.
[23] X. Tang, J. Wang, B. Liu, M. Li, G. Chen, and Y. Pan. Acomparison of the functional modules identified from timecourse and static ppi network data. BMC Bioinformatics,12(1):339, 2011.
[24] S. White and P. Smyth. A spectral clustering approach tofinding communities in graphs. Proceedings of the fifthSIAM international conference on data mining, 119:274,2005.
[25] A. Zhang. Protein Interaction Networks: ComputationalAnalysis. 2009.
[26] S. Zhang, H.-W. Liu, X.-M. Ning, and X.-S. Zhang. Ahybrid graph-theoretic method for mining overlappingfunctional modules in large sparse protein interactionnetworks. International journal of data mining andbioinformatics, 3(1):68–84, 2009.
ACM-BCB 2012 257