evolutionary computation applied to agent-based simulation
TRANSCRIPT
Evolutionary Computation Applied toAgent-Based Simulation Modeling of Climate
and Social Dynamics
Jeffrey K. Bassett and Claudio Cioffi-Revilla
Mason-Smithsonian Joint Project on Climate Change and SocietyCenter for Social Complexity, Krasnow Institute for Advanced Study
George Mason University, Fairfax, Virginia 22314, USA{jbasset1,ccioffi}@gmu.edu
https://cs.gmu.edu/~eclab/projects/cdi/
Abstract. Detailed population distribution data are often unavailablefor building spatial agent-based models of climate change effects on hu-mans, especially for past, historical data. A key challenge is to generateapproximations of historical (or even future) populations, to initialize ourmodels, based on certain spatial qualities of the landscape. We use evo-lutionary algorithms (EAs) to tune a relatively simple ”placement algo-rithm” or ”settlement algorithm.” The EAs generate modern settlementsthat match LandScan data. When generating historical populations, weinclude as much information as is available, and then let our algorithmgenerate missing parts of the spatio-temporal distribution. We illustratethis procedure based on evolutionary computation with the NorthLandsmodel of climate change and social dynamics, using MASON and ECJ.Results are positive and encouraging, highlighting additional researchdirections.
A critical task in developing viable, empirically-based agent-based models (ABM)of complex systems with coupled human, artificial, and natural (CHAN) compo-nent subsystems is the specification of initial population distributions. Theory,observation, and experience can provide significant help, but in most cases find-ing proper population distribution values is a hard, non-trivial task in ABMresearch. This is especially so for ABMs on climate change and societal dy-namics, where spatial and temporal scales are relatively large and theory andobservations on population distributions are incomplete.
This paper presents a novel methodological procedure for obtaining popu-lation distributions in ABMs of CHAN systems using genetic algorithms (GA)from evolutionary computation (EC). The GA-based procedure is illustratedwith the recent MASON NorthLands ABM, created to analyze climate changescenarios and societal consequences (Cioffi et al. 2015). Results show the advan-tage of our GA-based procedure over other approaches, such as manual tuning.
The next section provides and introduction with motivation and backgroundon earlier related research, followed by sections describing, experimenting with,

2 J. Bassett & C. Cioffi
and discussing our proposed GA-based procedure. The final section provides asummary.
1 Introduction
1.1 Motivation: Research Questions
Consider the goal of developing a viable, empirically-calibrated agent-basedmodel (ABM) of a complex system with coupled human, artificial, and natu-ral (CHAN) component subsystems, such as one or more geographic regionsof the Earth system. How are initial population distributions determined whenextant theory, data, or other sources are insufficient or unavailable? Which pro-cedures can provide valid answers to such questions? How can the proceduresbe tested, demonstrated, and improved? Research questions such as these arecritical for the task of determining proper population distributions in ABMs ofCHAN systems used for analyzing and understanding impacts of climate changeon society as well as the natural and built environments.
As pointed out elsewhere, “computational simulation modeling provides a vi-able scientific methodology, specifically through geospatial agent-based models(Cioffi, 2014: ch.10; Heppenstall et al., 2012; Railsback and Grimm, 2012). Suchmodels combine a set of features, such as: (1) ability to selectively representall empirical entities of interest (social, artificial, and natural) as computationalobjects endowed with (i.e., encapsulating) attribute-variables necessary to deter-mine the state of each entity (overcoming the challenge of high dimensionality);(2) ability to model all necessary spatio-temporal features, such as weather, land-scapes, and human activity that co-evolve over time (overcoming fragmentationin traditional disciplinary models); (3) ability to implement relevant systemsand processes directly informed by social and biophysical theories (leveraging allnecessary disciplinary knowledge within a unified framework); and (4) ability tomanipulate variables and change scenarios, including at run-time, for conductingvirtual experiments that yield empirically valid results (enabling experimentalscience in silico)”(Cioffi et al., 2015: 2).
MASON (Multi-Agent Simulator Of Neighborhoods) (Luke et al. 2005) is aJava toolkit for building ABMs, while ECJ (Luke 2010) is a highly configurableJava toolkit that can thus be used to create a variety of different EvolutionaryAlgorithms. Further motivation is provided by the opportunity to use MASONand ECJ in combination, for which both systems are optimized (Cioffi, De Jong& Bassett 2012).
1.2 Relevant Literature
Recent comprehensive reviews of the literature on spatial agent-based socialsimulation models that focus on socio-natural and socio-engineered systems (i.e.,the most relevant class of models) include An et al. (2014) and Cioffi (2015), inaddition to Batty (2013), Heppenstall et al. (2012), Kohler and van der Leeuw

EC Applied to ABM of Climate and Social Dynamics 3
(2007), Liu et al. (2007), and Railsback and Grimm (2012). The most commonstrategy for populating a spatial ABM at initialization is to assign agents torandom locations and let the burn-in phase at run time determine where they willbe subsequently distributed, based on the model’s dynamics. Another strategyis to use a known empirical distribution, such as provided by census data, butfor simulations extending into the past this is not a viable solution. Neitherof these strategies works well for models that have large spatial and temporalscales, because they either take too long to run (former case) or information forinitialization is unavailable (latter case).
2 Proposed Procedure
This section describes our proposed general procedure, prior to presenting illus-trative results in the next section. The main goal is to obtain viable estimatesof population distributions for use in a geospatial agent-based model. By “vi-able” we mean population values that have internal and external validity (i.e.,accuracy and empirical correspondence, respectively) as well as reliability (mea-surement consistency over space and time). First, we describe the algorithm forinitial settlement nucleation by agent placement, followed by the evolutionaryalgorithm (EA).
2.1 Agent Placement/Settlement Nucleation Algorithm
During initialization, agents are placed on the ABM’s “map” a few at a time,based on certain spatial features that exist. As agents are placed, subsequentagents decisions are affected by decisions made by earlier agents. In other words,agents will tend to be attracted to locations that have already been settled, thusgrowing towns and cities.
The MASON modeling library allows for a number of map layers to be de-fined. These layers contain geospatial information in the form of grids that canbe displayed independently or together. The data from these layers can be ac-cessed by agent, or other parts of the program. Several map layers define thefeatures that affect settlement. The specific layers we use are: elevation abovesea level, proximity to fresh water (i.e., large rivers and lakes), proximity to po-tential ports, and temperature averaged over a 50 year period. These and otherfeatures described below are ethnographically appropriate (i.e., informed by cul-tural anthropology), given the target system and research questions addressedby the model; different features apply to other cases. In this case they representfeatures that actors deem significant in their lives, and relate to growing seasons,transportation, and trade, among other human activities.
The locations of previously settled agents also affects current and future set-tlement decisions. These are modeled as two layers. The first defines the locationsof the already settled population, and the second is derived from the first, andadds a diffusion effect, making it attractive to settle in locations that neighborlocations that are populated. The diffusion grid is generated by iterating through

4 J. Bassett & C. Cioffi
each cells in the population grid, retrieving the population value for the givencell, and then adding this value to all the cells in the diffusion grid that makeup the Moore neighborhood of the corresponding cell.
Fig. 1. Spatial distribution of desirability by average temperature (upper left), eleva-tion (upper right), fresh water (lower left), and ports (lower right).
Accordingly, six spatial layers affect settlement decisions. Four represent nat-ural qualities or physical features of a given location: temperature (t), elevation(e), proximity to fresh water (w), and proximity to a port (p), as shown inFigure 1. Two more spatial layers represent social qualities: settled population(s) and population diffusion (f). Each of these six variables represents a vectorcontaining the appropriate values for all the cells in Canada. These are combinedto form another layer called desirability, using the following formulas:
n = ctz(t) + cez(e) + cwz(w) + cpz(p) (1)
n′ = normalize(n) (2)
a = css + cfcsf (3)

EC Applied to ABM of Climate and Social Dynamics 5
d =
(n′1)cx + a1(n′2)cx + a2
...(n′m)cx + am
(4)
Here, n is a vector denoting desirability based on natural factors alone, m isthe length of n (and all the other vectors as well), a is a vector representing socialfactors alone, and d is a vector representing total desirability at each grid cell onthe map (in this case Canada). This equation is performed on every grid cell, thusdefining a new, aggregate layer for desirability. The constant cx is an exponentwith the effect of adjusting the emphasis on high desirability areas, allowingthe demand for the most desirable areas to be increased appropriately. Thefunction z() transforms a vector into a set of standardized z-score values, wherez(x) = (xi −µ)/σ, and the normalize() function is a unity-based normalizationfunction, rescaling values into the range [0, 1].
When an agent selects the area it will settle, it essentially considers every gridcell in Canada, and then chooses one of those locations randomly, with a like-lihood that is biased by the desirability. This is implemented using a techniquethat is common in evolutionary algorithms called a roulette wheel.
A roulette wheel is essentially implemented as follows. Pick a random numbery between 0 and
∑di. Then traverse the vector d, summing the values as you
go. If the sum exceeds y, then the previous vector value in d is chosen, and thegrid cell associated with it is selected for settlement. The speed of this processcan be greatly improved by keeping a vector of partial sums of d, and then usinga binary search to find the appropriate index.
Because our desirability calculation is dependent on agents that have alreadybeen placed, we must update the roulette wheel from time to time. In theorywe should update it after every agent is placed, but this would be too timeconsuming. Instead, we decided to place agents in groups, and then perform theupdate. For our experiments, we place 100000 agents before performing anotherupdate. The consequence of this is that the placement decisions made by agentswill not be affected by any other agents that were placed previously that werealso in the same group.
When agents are placed, they are placed 10 at a time. In other words, alocation is chosen, and then 10 agents are placed in that one location. Thenanother location is chosen, 10 more agents are place, and so on. According tothe LandScan data, the total population in Canada in 2005 is just over 30 million,and this is how many agents we ultimately place.
2.2 Evolutionary Algorithm
Our EA was implemented using the ECJ toolkit, given that the NorthLandsmodel is implemented in MASON (Luke et al. 2005) and the two toolkits arebuilt to operate together in a highly efficient way.

6 J. Bassett & C. Cioffi
Representation Individual agents in our EA are represented as a list of realvalued numbers. These comprise key constants to the agent placement algorithm(see 2.1). Specifically, the following constants are defined as genes: ce, cw, cp, ct,cs, cf , cx. All genes are constrained to the range [-1, 1], except for cs, cf , andcx, which are constrained to ranges [0, 30], [0, 10], and [0, 40], respectively.
Selection and Reproduction The parent and offspring populations in ourEA are non-overlapping. This simply means that each new generation consistssolely of newly produced offspring. In other words, no individuals from pro-ceeding generations are allowed to survive. We felt that this would allow forgreater variation, and avoid becoming trapped in local optima, thus improvingthe search.
During reproduction, parents are selected using tournament selection with atournament size of 2. This provides a reasonably strong and consistent selectionpressure, without being overwhelming.
All selected parents are varied using two reproduction operators: two-pointcrossover and Gaussian mutation. Two-point crossover was chosen over one-point crossover because it is known to have fewer issues with gene linkages (DeJong, 2006). The Gaussian mutation operator is applied to every gene in eachindividual, with a fixed and relatively low amount of variation (σ = 0.05), whichwe determined experimentally using sensitivity studies. A low value for σ allowsthe EA better convergence on solutions later in the run. The crossover counter-balances this, as it is known to produce large amounts of variation, but onlyearly in the run, when it is most useful.
All experiments were performed with populations containing 50 individuals.In general, crossover requires populations of at least this size to be effective.Similarly, all experiments were run for 50 generations, which preliminary exper-iments determined was sufficient to converge on a solution.
Fitness Function The fitness of an individual is calculated by using the genevalues as parameters to the placement algorithm and generating a population.This population is then compared to the LandScan data to see how similarthe two are. LandScan data is a GIS product created at Oak Ridge NationalLaboratory that estimates global population distributions at a 1km scale.
There are two distinct aspects of the populations that are compared: a spa-tial distribution, and the rank distribution of the cells. A good fit for the spatialdistribution indicates that agents are in roughly the correct locations and con-centrations. Rank distribution, on the other hand, gives an indication of whetheragents tend to create communities with similar densities and in similar propor-tion to actual human communities.
Spatial Distribution A simple approach to measuring a spatial distribution is tocalculate the Kullback-Leibler divergence of the two distributions (Kullback andLeibler, 1951). This produces a result in the range [0, 1], thus creating a type ofsimilarity metric, with a 1 indicating a perfect match.

EC Applied to ABM of Climate and Social Dynamics 7
However, we were concerned that human populations tend to be highly con-centrated into population centers within relatively small boundaries. Even underthe best of circumstances, it is unlikely that our algorithm would be able to gen-erate cities in exactly the same locations as the ones that humans chose tonucleate. Our concern was that our placement algorithm might generate a cityvery close to the location of an actual city, but still far enough away so that thereis little impact on the similarity metric. In other words, the algorithm would getalmost no credit, even though the generated and real cities were actually quiteclose.
In order to create a more forgiving similarity metric, we first applied a Gaus-sian smoothing algorithm to both populations before comparing them. Figure 2provides an example of the effect that this has on the spatial layer, essentiallyspreading the population out into larger masses. For the Gaussian smoothing,we performed 2 passes using a 9 × 9 kernel with σ = 3.0.
Fig. 2. The left image is population distribution derived from 2005 LandScan data. Thecolor map has been altered to be non-linear in order to emphasize the low populationgrid cells. The right image is the same population data with a Gaussian smoothingalgorithm applied for use with the EA fitness function.
Rank Distribution The rank distributions of settlement sizes (also called Zipf’sor Zipfian distributions) were compared using the Kolmogorov-Smirnov statistic,which has value in the range [0, 1], with 0 being an identical match.
Combining Measures We combined the spatial and rank measures as follows:f(x) = s(x)(1 − r(x)), where s(x) is the spatial measure and r(x) is the rankmeasure, both described above. This creates the fitness values used for an indi-vidual in the EA.
8 J. Bassett & C. Cioffi
3 Further Illustrative Results
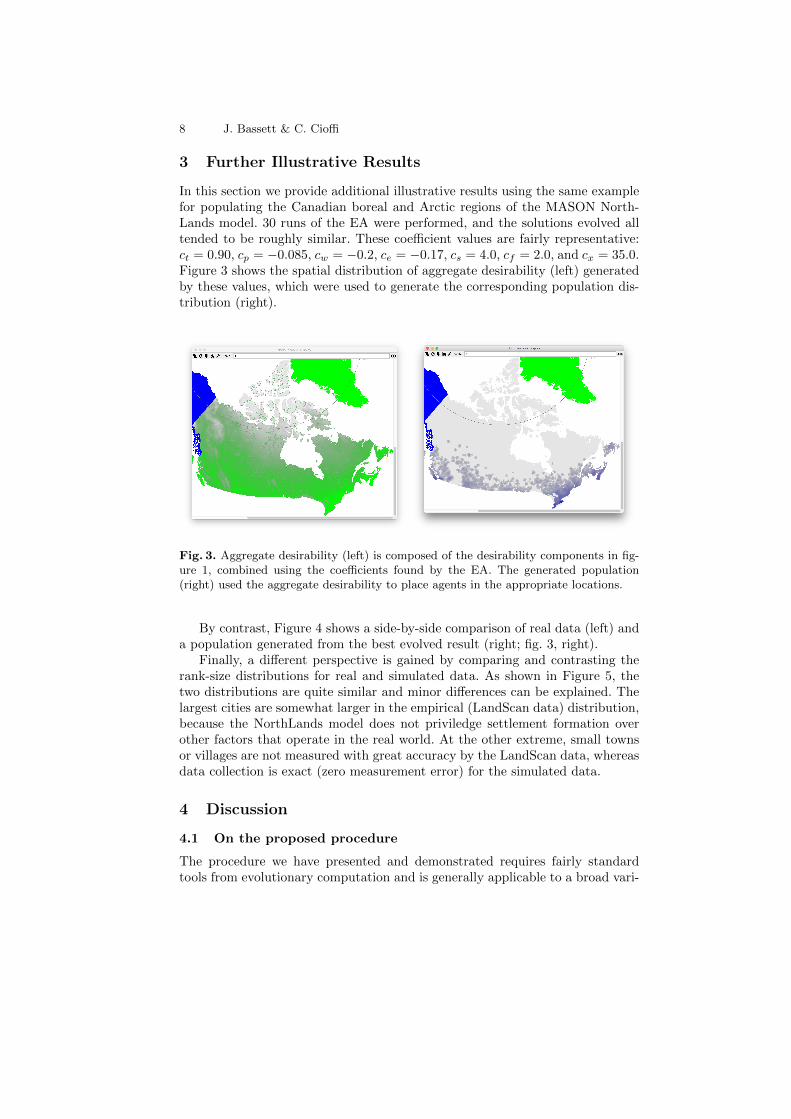
In this section we provide additional illustrative results using the same examplefor populating the Canadian boreal and Arctic regions of the MASON North-Lands model. 30 runs of the EA were performed, and the solutions evolved alltended to be roughly similar. These coefficient values are fairly representative:ct = 0.90, cp = −0.085, cw = −0.2, ce = −0.17, cs = 4.0, cf = 2.0, and cx = 35.0.Figure 3 shows the spatial distribution of aggregate desirability (left) generatedby these values, which were used to generate the corresponding population dis-tribution (right).
Fig. 3. Aggregate desirability (left) is composed of the desirability components in fig-ure 1, combined using the coefficients found by the EA. The generated population(right) used the aggregate desirability to place agents in the appropriate locations.
By contrast, Figure 4 shows a side-by-side comparison of real data (left) anda population generated from the best evolved result (right; fig. 3, right).
Finally, a different perspective is gained by comparing and contrasting therank-size distributions for real and simulated data. As shown in Figure 5, thetwo distributions are quite similar and minor differences can be explained. Thelargest cities are somewhat larger in the empirical (LandScan data) distribution,because the NorthLands model does not priviledge settlement formation overother factors that operate in the real world. At the other extreme, small townsor villages are not measured with great accuracy by the LandScan data, whereasdata collection is exact (zero measurement error) for the simulated data.
4 Discussion
4.1 On the proposed procedure
The procedure we have presented and demonstrated requires fairly standardtools from evolutionary computation and is generally applicable to a broad vari-

EC Applied to ABM of Climate and Social Dynamics 9
Fig. 4. A side-by-side comparison of the 2005 LandScan data (left) and a populationgenerated from the best evolved result (right).
Fig. 5. A comparison of population rank-size distributions on a log-log scale. Rank andpopulation are represented by the x- and y-axis, respectively The generated population(blue ’x’) is very similar to that in the LandScan data (red ’+’), although the populationseems to be somewhat skewed away from areas of high density and toward areas oflower density.

10 J. Bassett & C. Cioffi
ety of situations characterised in the Introduction. The situation addressed is notuncommon in computational social science using spatial agent-based models, sothe same procedure could be used to populate other entities that can be placedaccording to a set of identified features. For examples, certain types of buildingsor infrastructure, not just human agents or households (as in NorthLands).
Another advantage of the proposed procedure is that it is also susceptible toimprovements as evolutionary computation (and advanced toolkits, such as ECJ)also improve. Finally, this EA procedure can be easily tested in other MASON-based social simulation models, because ECJ is ideally designed to operate withmodels created with MASON.
4.2 On the results
The context of these results is provided by the broader Mason-Smithsonian JointProject on Climate and Society, of which NorthLands is a core part. Theseresults represent the latest of several iterations that were developed using aspiral development model, and in that time NorthLands has evolved from asingle model architecture to one based on a “federated” framework.
The results demonstrated here have intrinsic value for the proposed proce-dure, as well as extrinsic value for marking progress in the development andanalysis of NorthLands. These results on population distributions provide morerobust foundations for the simulation of population migratory movements whenclimate change stress the population through a variety of causal mechanisms, asin a network of influences that generate rural and urban migratory movements.
4.3 Future research
The following are envisioned developments:
1. We are developing an approach to incorporating more detailed census infor-mation into our placement algorithm. Population information often exists atthe province, county and municipal levels, and we are planning to constrainthe placement of certain agents to match this.
2. We are developing a mechanism for agent movement that uses an approachthat is very similar to our placement algorithm, but includes additional fac-tors in decision-making, such as available infrastructure, wealth, agent sat-isfaction and agent preferences.
3. We plan to perform sensitivity studies, particularly in different regions andtime frames, in order to determine the robustness of these results and theirsensitivity to cultural factors.
Acknowledgements
Paper prepared for the Sixth Annual Conference of the Computational SocialScience Society of the Americas (CSSSA), Santa Fe, New Mexico, October 29

EC Applied to ABM of Climate and Social Dynamics 11
– November 1, 2015. Funding for this study has been provided by the US Na-tional Science Foundation, CDI Program, grant no. IIS-1125171, which supportsthe Mason-Smithsonian Joint Project on Climate Change and Societal Dynam-ics, and by the Center for Social Complexity at George Mason University, incollaboration with the Smithsonian National Museum of Natural History.
This product was made utilizing the LandScan (2005)TM High Resolutionglobal Population Data Set copyrighted by UT-Battelle, LLC, operator of OakRidge National Laboratory under Contract No. DE-AC05-00OR22725 with theUnited States Department of Energy. The United States Government has certainrights in this Data Set. Neither UT-Batelle, LLC nor the US Department ofEnergy, nor any of their employees, makes and warranty, express or implied, orassumes any legal liability or responsibility for the accuracy, completeness, orusefulness of the data set.
References
An, L, A Zvoleff, J Liu & W Axinn: Agent-Based Modeling in Coupled Humanand Natural Systems (CHANS): Lessons from a Comparative Analysis, Ann As-soc Amer Geog 104 (4): 723–745 (2014)
Batty M, The New Science of Cities, MIT Press (2013)
Cioffi-Revilla, C: Introduction to Computational Social Science: Principles andApplications. London and Heidelberg. Springer (2014)
Cioffi-Revilla, C: A Unified Framework for Convergence of Social, Engineering,and Natural Sciences. In W S Bainbridge & M Rocco. Handbook of Science andTechnology Convergence. London and Heidelberg. Springer (2015)
Cioffi-Revilla C, De Jong K, Bassett J: Evolutionary Computation and Agent-based Modeling: Biologically-inspired Approaches for Understanding ComplexSocial Systems. Comput Math Org Th 18(3):356–373 (2012)
Cioffi-Revilla, C, Honeychurch W, Rogers JD: MASON Hierarchies: A Long-Range Agent Model of Power, Conflict, and Environment in Inner Asia. In JBemmann & M Schmauder (eds.), Complexity of Interaction Along the EurasianSteppe Zone in the First Millennium CE. Bonn, Germany: Rheinische Friedrich-Wilhelms-Universitat Bonn Press, 89–113 (2015)
Cioffi-Revilla C, Rogers JD, Schopf P, Luke S, Bassett J, Hailegiorgis A, KennedyW, Froncek P, Mulkerin M, Shaffer M, Wei E: MASON NorthLands: A Geospa-tial Agent-Based Model of Coupled Human-Artificial-Natural Systems in Borealand Arctic Regions. Proc Soc Sim Conf SSC2015, 11th Conf Eur Soc Sim Assoc,Groningen, The Netherlands, Sept 14–118 (2015)

12 J. Bassett & C. Cioffi
De Jong, K. A. Evolutionary Computation: A Unified Approach. MIT Press,Cambridge, Mass. (2006)
Heppenstall AJ, Crooks AT, See LM, Batty M (eds): Agent-based Models ofGeographical Systems. Springer, New York (2012)
Kohler TA, van der Leeuw SE, eds. The model-based archaeology of socionaturalsystems. School for Advanced Research on the, 2007.
Kullback S and Leibler RA: On information and sufficiency. Ann. Math. Stat.,22:7986, (1951)
Liu J, Dietz T, Carpenter SR, Alberti M, Folke C, Moran E, . . . Taylor W: Com-plexity of Coupled Human and Natural Systems. Science 317:1513–1516 (2007)
Luke S, Cioffi-Revilla C, Panait L, Sullivan K: MASON: A Java Multi-AgentSimulation Environment. Simulation: Trans Soc Modeling Simulation Int 81(7):517–527 (2005)
Luke S: The ECJ owners manual. Technical report, George Mason University(2010)
Railsback SF, Grimm V: Agent-Based and Individual-Based Modeling: A Prac-tical Introduction. Princeton University Press, Princeton NJ (2012)