evolving geometric design decision-making in the united states
TRANSCRIPT

1
Evolving Geometric Design Decision-Making in the United States
U.S. Country Report for the 5th International Symposium on Geometric Design Vancouver, Canada June 2015

2
Authors
Patrick Hasson Safety and Highway Design Technical Service Team Leader Federal Highway Administration 4749 Lincoln Mall Drive, Ste 600 Matteson, IL 60443 Office: (708) 283-3595 [email protected]
Brooke Struve Federal Highway Administration 12300 W. Dakota Ave., Suite 340 Denver, CO 80228 Office: 720-963-3270 [email protected]
Clayton Chen Office of Safety Research and Development Federal Highway Administration Turner-Fairbank Highway Research Center 6300 Georgetown Pike McLean, VA 22101 Office: 202-493-3054 [email protected]
Jim Brewer Kansas Department of Transportation Dwight D. Eisenhower State Office Building 700 S.W. Harrison Street Topeka, KS 66603-3745 Office: 785-296-3901 [email protected]
Mark Doctor Safety / Geometric Design Engineer Federal Highway Administration 61 Forsyth Street, SW Suite 17T26 Atlanta, GA 30303 Office: 404-562-3732 [email protected]

3
Keith Harrison Safety / Geometric Design Engineer Federal Highway Administration 4749 Lincoln Mall Drive, Ste 600 Matteson, IL 60443 Office: 415-748-8393 [email protected]
Deanna Maifield Project Development Iowa Department of Transportation 800 Lincoln Way Ames, IA 50010 Office: 515-239-1505 [email protected]
Mick Matzke Design Program Manager Preconstruction Team Leader Federal Highway Administration 1200 New Jersey Ave, SE E73-443 Washington, DC 20590 Office: 202-366-4658 [email protected]
George Merritt Safety / Geometric Design Engineer Federal Highway Administration 61 Forsyth Street, SW Suite 17T26 Atlanta, GA 30303 Office: (404) 562-3689 [email protected]
Robert Mooney Preconstruction Team Leader Federal Highway Administration 1200 New Jersey Ave, SE E73-303 Washington, DC 20590 Office: 202-366-2221 [email protected]

4
ABSTRACT
As is so often said, necessity is the mother of invention. Transportation agencies in the United States (U.S.) are increasingly challenged to achieve greater results with fewer resources. Meanwhile, technologies, analysis tools, and new approaches are being implemented to achieve these goals for the future. As a result, agencies are striving to be strategic in their allocation of resources by linking design decisions to explicit performance outcomes. This is increasingly possible through the use of new means of predicting the safety performance of geometric design choices through the use of the methodologies of the Highway Safety Manual. Better use of three-dimensional modelling in design is also providing opportunities to visualize and evaluate these choices.
Transportation professionals across the U.S. are also gaining a greater understanding and placing more focus on the roadway user and how people of various ages and abilities respond to driving tasks. Emphasis and knowledge is also increasing on how to design for the needs and safety of all non-motorized users of the highways. Innovative design approaches are being implemented to improve safety by removing conflicts at intersections, providing more space for non-motorized transportation, and enhancing the friction of roadway surfaces. Meanwhile, U.S. agencies and the automotive industry are seeking ways to utilize vehicle communication technologies to significantly reduce crashes and questioning how those technologies will affect geometric design decisions in the future.

5
TRENDS IN GEOMETRIC DESIGN
Transportation professionals in the United States (U.S.) are facing new challenges and are seeking innovative approaches to address transportation goals for the future. Transportation agencies are no longer functioning in the same financial climate as in times past. Revenue streams for infrastructure projects have become less certain, while aging infrastructure is in need of repair or replacement as congestion grows in many urban areas, as illustrated in Figure 1. There are often competing demands placed upon transportation professionals to provide safe and reliable transportation for automobiles, freight, pedestrians, bicyclists, and transit and yet reduce environmental impacts and enhance surrounding communities. Design decisions have become increasingly complex, demanding analysis of many influences and outcomes and a balance of competing needs. Agencies are embracing innovative approaches to design decision-making and emerging tools and technologies to achieve performance goals for the surface transportation system. Increasing numbers and percentages of aging persons using our nation’s streets and highways in the decades ahead will pose many challenges to transportation engineers. The transportation professional workforce is also aging and a high proportion of experienced design engineers will soon be retiring. It is paradoxical that, at a time when design decision-making is more complex and more analytical engineering tools are available, many less-experienced professionals need some basic guidelines for making design decisions.
Figure 1. Congestion typical of many U.S. urban areas

6
U.S. HIGHWAY AND TRAVEL CHARACERISTICS After several years of decreasing travel volumes, in 2014 the U.S. experienced its highest volumes on highways nationwide with 3015.6 billion vehicle miles traveled, representing a 1.5% increase from the previous year. (1) These miles were travelled by the 254 million vehicles registered in the U.S. (2), along with Pan-American travelers from Mexico and Canada. Heavy trucks represent 4.2% of the U.S. vehicle fleet (2); however, heavy trucks travel approximately seven percent of the total vehicle miles travelled. (3)
This travel is dispersed on a 4,094,447 mile network of freeways, arterials, collectors, and local highways and streets. Twenty-seven percent of these highways and streets are located in urban areas, while seventy-three percent are in rural areas. (1)
Safety on U.S. highways and streets remains a significant concern, with 32,719 fatalities and 2.31 million injuries reported in 2013. (4) There have been dramatic decreases since the 2005 when the number of fatalities was 39,189 (5); however, that downward trend may be slowing (See Figure 2). (4)
Figure 2. Fatalities and Fatality Rate per 100 Million Vehicle Miles Traveled by Year (4)
IMPROVING DESIGN AND ENGINEERING FOR ALL USERS Highway designers face many complex tradeoffs. A quality design must satisfy the needs of a variety of users, and must balance cost, safety, and mobility with historical, cultural, and environmental impacts. Quality design increasingly requires more analysis than simply assembling elements from the available tables, charts, and equations of criteria outlined in design manuals. Highway engineers and designers work within complex relationships that allow an acceptable level of flexibility in roadway designs that require managing the related risks. Over the past decades – through policies, guidelines, conferences, training, and new partnerships – transportation agencies across the U.S. have been bridging knowledge gaps and enabling engineers to design with flexibility and employ context-sensitive approaches with greater confidence and regularity.
Context-Sensitive Solutions Transportation agencies use Context-Sensitive Solutions (CSS) and design flexibility as tools to contribute to creating more livable communities. With the incorporation of CSS and livability principles the transportation industry is realizing it must look beyond the right-of-way and consider the connections to corridors and communities, taking advantage of the opportunities to enhance the quality of life.

7
CSS and livability apply to transportation processes, outcomes, and decision making and are founded upon collaborative decision-making strategies that engage a full range of stakeholders early and continuously throughout the project planning and development process. Both help meet community goals and national goals of environmental sustainability. The livability concept promotes linkages between jobs, housing, schools, and safe transportation to improve quality of life. These livability principles are key outcomes of the CSS process. The CSS process is a collaborative, interdisciplinary approach that involves all stakeholders in providing a transportation facility that fits its setting. Both CSS and livability lead to preserving and enhancing scenic, aesthetic, historic, community, and environmental resources, while improving or maintaining safety, mobility, and infrastructure conditions. Livability and CSS can also improve the cost-effectiveness and streamline the delivery of transportation programs.
While much progress has been achieved in institutionalizing CSS in transportation agency business processes, a recent informal survey by FHWA reveals that more work needs to be done, as nearly one quarter of the States rated themselves as either in the “Initiating Progress” or “Early Implementation” stage.
In 2015, the Institute of Transportation Engineers (ITE) will publish a new Informational Report, Integration of Safety in the Project Development Process and Beyond: A Context Sensitive Approach (6) intended to build upon the ITE Recommended Practice, Designing Walkable Urban Thoroughfares: A Context Sensitive Approach (7) to expand understanding of CSS principles and practices within the transportation community and incorporate highway safety elements from a quantitative, substantive, analytical and technical perspective.
Design professionals are faced with many questions for which there may be no clear answers:
• How do we balance safety against other community, environmental, economic, or mobility values?
• How do we determine where compromise is reasonable and if it is possible to trade safety against these?
• How do we know if the owning agency is at risk for making such tradeoffs? • How can one select the preferred solution?
The incorporation of substantive safety into the project development process elevates the safety criteria to the level of the other evaluation criteria, such as environmental impacts, community values, right-of-way, mobility, and congestion, and provides the means by which professionals may make informed project decisions and answer these questions. This report demonstrates how these types of questions can be answered to the satisfaction of stakeholders for any project by integrating substantive safety into design decisions.
Flexibility in Design The phrase flexibility in highway design was adopted by the Federal Highway Administration (FHWA) in a pioneering publication (8) issued in 1997 that demonstrated how agencies could accomplish the objectives of CSS within accepted design processes and criteria. The core theme of the FHWA publication was flexibility—in design approaches, use of criteria, execution of design solutions, and incorporation of special or unique features. The American Association of State Highway and

8
Transportation Officials (AASHTO) published A Guide for Achieving Flexibility in Highway Design (9) that added greatly to the technical background needed to apply the concepts of flexible design. Most transportation agencies have adopted the philosophy of flexibility in design. Yet, many design practitioners continue to struggle with how best to achieve that flexibility. Flexible thinking is about making informed choices. Simple application of the highest or lowest value within a range of design values without explicit consideration of context might not always lead to the most informed choices that best meet a project’s objectives. Applying flexibility in design encourages engineers to consider the roadway context, implications for the safety and comfort of pedestrians and bicyclists, and implications for regional mobility.
Practical Design & Performance-Based Practical Design State DOTs are increasingly challenged with addressing their system performance, mobility, and safety needs in the current era of financial limitations. To address this challenge some DOTs moved to a Practical Design process while others are moving towards a Performance-Based Practical Design approach.
Practical Design Though the name, definition, and approach of Practical Design vary from State to State, most States with a Practical Design program emphasize a renewed focus on scoping projects to stay within the core purpose and need. By exercising a greater level of discipline, agencies may eliminate nonessential project design elements resulting in lower cost and improved value. This approach may enable transportation agencies to deliver a greater number of projects than otherwise possible under their previous project development approaches. By utilizing such an approach to design decision-making, agencies can expand beyond merely considering individual projects and consider the overall system benefits of which each project is a part.
Information and examples of Practical Design can be found in the NCHRP Synthesis 443, “Practical Highway Design Solutions”. (10)
Performance-Based Practical Design Performance-Based Practical Design helps agencies further focus their Practical Design approaches by incorporating performance goals into their decision-making. This helps ensure that agencies do not overemphasize short-term cost savings without a clear understanding of how such decisions could impact other objectives (such as safety and operational performance, context sensitivity, life-cycle costs, long-range corridor goals, livability, and sustainability). Under a performance-based approach to project design and attribute selection, decisions can be made based on multiple factors using quantifiable cost and benefit measures to assure that transportation agencies make efficient use of public funds. Agencies using this decision-making approach also strive to apply risk management strategies as well as financial/economic analyses to evaluate options and alternatives that will yield the greatest return on investment.
To address this concern and to make more informed decisions, transportation agencies are evolving towards a PBPD approach grounded in a performance management framework. PBPD can be articulated as modifying a traditional design approach to a “design up” approach where transportation decision makers exercise engineering judgment to build up the improvements from existing conditions to meet

9
both project and system objectives. PBPD uses appropriate performance-analysis tools, considers both short and long term project and system goals while addressing project purpose and need. Key emphases of PBPD include:
• PBPD focuses on performance improvements that benefit both project and system needs. • Agencies make sound decisions based upon performance analysis. • By scrutinizing each element of a project’s scope relative to value, need, and urgency, a PBPD
approach seeks a greater return on infrastructure investments. • PBPD strengthens the emphasis on planning-level corridor or system performance needs and
objectives when planning, scoping and developing individual projects. • PBPD can be implemented within the Federal-aid Highway Program regulatory environment
utilizing existing flexibility. PBPD does not eliminate, modify, or compromise existing design standards or regulatory requirements.
More information, including case studies and frequently asked questions, can be found at: http://www.fhwa.dot.gov/design/pbpd/.
SAFETY PERFORMANCE ANALYSIS A new generation of highway safety analysis tools is being deployed to the transportation community through several innovative research efforts. The Highway Safety Manual (HSM) (11) and supporting implementation tools including SafetyAnalyst, Interactive Highway Safety Design Model, and the Crash Modification Factors (CMF) Clearinghouse were developed by cooperative research. These tools are greatly advancing State and local highway agencies’ ability to incorporate explicit, quantitative consideration of safety into their planning and project development decision making.
Highway Safety Manual The HSM, first published in 2010, provides practitioners with information and tools to consider safety when making decisions related to design and operation of roadways. The HSM assists practitioners in selecting countermeasures and prioritizing projects, comparing alternatives, and quantifying and predicting the safety performance of roadway elements considered in planning, design, construction, maintenance, and operation.
While safety has been the highest of priorities, prior to the HSM, there was no widely accepted tool available to quantifiably predict the impact of infrastructure decisions on safety. The primary focus of the HSM is the introduction and development of analytical tools for predicting the impact of transportation project and program decisions on road safety.
The HSM includes predictive methods that can be used by transportation agencies to anticipate the safety performance of new facilities, to assess the safety performance of existing facilities, or to estimate the expected effectiveness of proposed improvements to existing facilities.
Updates and New Chapters Two new chapters of the HSM were released in 2014 (12) to add predictive methods for estimating the “expected average crash frequencies (in total, by crash type, or by crash severity) for both freeways and
10
ramps with known characteristics.” (13) The predictive method for freeways includes evaluation of freeway segments as well as freeway segments with speed change lanes. The predictive method for ramps includes evaluation of interchange components; including ramps, collector-distributor roads, and ramp terminals.
The AASHTO, in concert with the Transportation Research Board (TRB) and FHWA, is working towards a 2nd Edition HSM, with 2018 as a target for publication. Several NCHRP projects are underway to address emerging issues and develop new material for future editions of the HSM. These projects address improved consistency of the methodology across various highway types and improved accuracy based on the influences of additional site characteristics.
The project description for NCHRP 17-62 describes the HSM crash prediction methodology and proposed refinements:
An important component of the HSM is the ability to estimate the safety performance of highways and the effects of proposed countermeasures. The HSM utilizes safety performance functions (SPFs) to estimate the number of crashes over a specific roadway over a specific time period… [Currently, the predictive] models in the HSM differ by chapter…To provide more consistency for users, it is desirable that a HSM second edition provide a consistent approach to predictive modeling by crash severity and crash type. (14)
Researchers acknowledge that CMFs are a critical component of the highway safety management process in that they can be used to compare the relative effectiveness of alternative treatments and adjust baseline estimates from SPFs. In spite of this, researchers also recognize that our full knowledge about CMFs is still developing. In other words, we are beginning to have better understanding about how factors such as geographic location, terrain, traffic demand, geometric design, traffic control and other features can influence effectiveness of treatments. (15)
Additional topics for further research and development of analysis tools include six-lane and one-way urban and suburban arterials, design of roadside features, a broader range of intersection configurations and traffic control, roundabouts, and systemic analysis of pedestrian safety.
Calibration As explained in the HSM, the Part C predictive method includes:
…models which consist of safety performance functions (SPFs), crash modification factors (CMFs), and calibration factors and have been developed for specific roadway segment and intersection types. The SPF functions are the basis of the predictive models and were developed in HSM-related research from the most complete and consistent available data sets. However, the general level of crash frequencies may vary substantially from one jurisdiction to another for a variety of reasons including climate, driver populations, animal populations, crash reporting thresholds, and crash reporting system procedures. (16)
The HSM further describes how:

11
These variations may result in some jurisdictions experiencing substantially more reported traffic crashes on a particular facility type than in other jurisdictions. In addition, some jurisdictions may have substantial variations in conditions between areas within the jurisdiction (e.g., snowy winter driving conditions in one part of the State and only wet winter driving conditions in another part of the State). (17)
Therefore, for predictive models to provide results that are meaningful and accurate for each jurisdiction, it is important that the SPFs be calibrated for application in each jurisdiction. A procedure for determining the calibration factors for the predictive models is presented in the HSM. A calibration factor is used to account for differences between the jurisdiction(s) for which the models were developed and the jurisdiction for which the predictive method is applied.
Some agencies are choosing to develop their own SPFs rather than calibrating the HSM SPFs. To assist agencies, the following guides have been developed:
• How to Choose Between Calibrating SPFs from the HSM and Developing Jurisdiction-Specific SPFs (18)
• User’s Guide to Develop Highway Safety Manual Safety Performance Function Calibration Factors (19)
• Safety Performance Function Development Guide: Developing Jurisdiction-Specific SPFs (20)
State Implementation The AASHTO Standing Committee on Highway Traffic Safety has established a goal to institutionalize the HSM and its associated analytical tools to make data-driven decisions, advance the science of safety, and to ultimately reduce fatalities and serious injuries.
Implementation of the HSM varies by State agency. Some “lead” States developed and have begun executing comprehensive HSM Implementation Plans, while others are moving towards implementation at a more moderate pace. Examples of implementation activities by State agencies include:
• Utah DOT – Reviewed Highway Safety Improvement Program and Design Exception processes, updated typically applied CMFs, and developed training.
• Missouri DOT – Increased internal understanding, established an implementation team, provided training, developed policy and guidance, and provided technical support.
• Louisiana DOTD – Incorporated HSM methodologies into policy by gaining leadership approval and commitment, and developed a short- (0 to 3 years), and long-term (3 to 7 year) implementation plan.
• Alabama DOT – Identified HSM users and their needs, and determined data needs.
Implementation resources developed to assist agencies include:
• HSM Implementation Guide for Managers—Outlines what the HSM is (and is not), how it relates to other core technical documents and policies, and the potential benefits of its use - particularly improvements in the safety performance of the highway system. (21)
• Integrating the HSM into the Project Development Process—Provides practitioners with examples and ideas for integrating safety performance measures into the project development

12
process, including planning, alternatives development and analysis, design, operations, and maintenance. (22)
Interactive Highway Safety Design Model The FHWA’s Interactive Highway Safety Design Model (23) is a suite of software analysis tools used to evaluate the safety and operational effects of geometric design decisions on highways. IHSDM is a decision-support tool which provides estimates of a highway design's expected safety and operational performance, and checks existing or proposed highway designs against relevant design policy values. Results of the IHSDM support decision-making in the highway design process. Intended users include highway project managers, designers, and traffic and safety reviewers in State and local highway agencies and in engineering consulting firms.
The current IHSDM 2014 Release (version 10.1.0) includes six evaluation modules: Crash Prediction, Design Consistency, Intersection Review, Policy Review, Traffic Analysis, and Driver/Vehicle. The Crash Prediction Module—which implements the crash prediction methods documented in HSM Part C—includes capabilities to evaluate rural two-lane highways, rural multilane highways, urban/suburban arterials, freeway segments, and freeway ramps/interchanges (including ramps, collector-distributor roads, and ramp terminals). IHSDM also includes a CPM Calibration Utility to assist agencies in implementing the calibration procedures described in the Appendix to HSM Part C.
FHWA plans to extend the IHSDM CPM to include safety prediction models for six-lane and one-way urban and suburban arterials. In the long term, the IHSDM CPM could be further extended to include future HSM Part C predictive methods for roundabouts, roadside features, an expanded range of intersection types, etc.
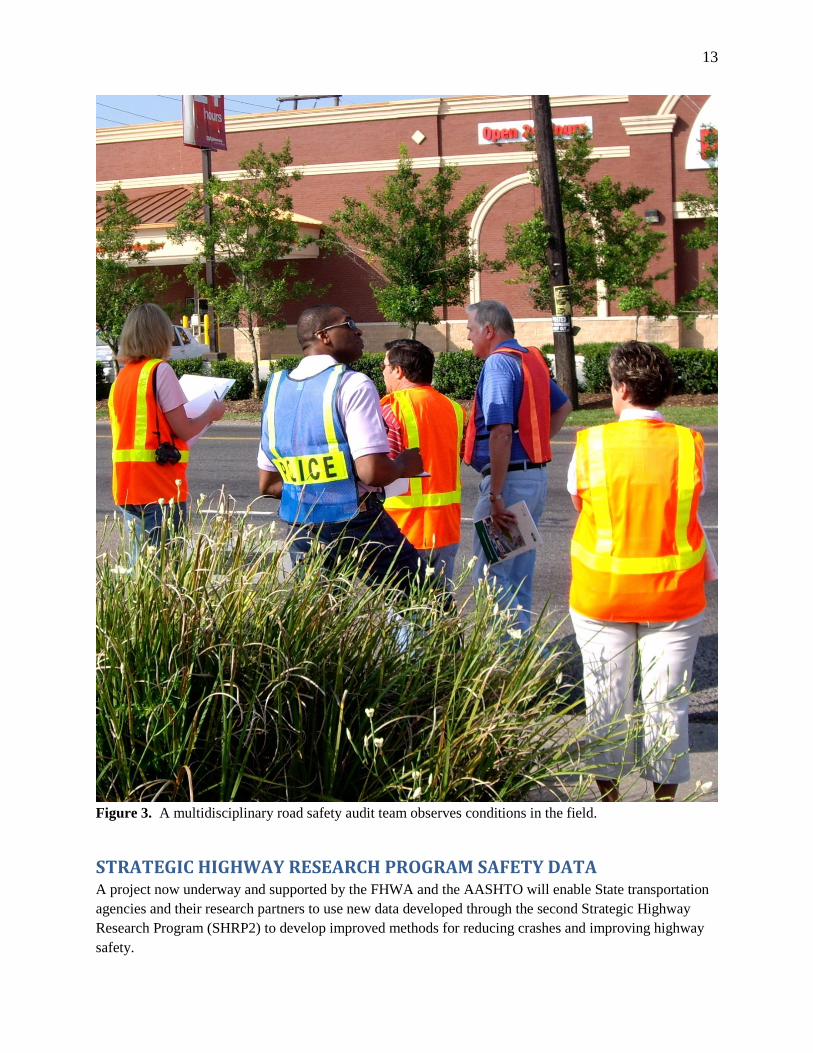
Road Safety Audits Another important safety analysis tool being utilized in design is the application of road safety audits (RSAs) within the project design phase. The use of RSAs within the U.S. has continued briskly since the publication of the 2004 NCHRP Synthesis 336 (24), a study that examined the practices and benefits of RSAs worldwide. An RSA is a formal examination of the safety performance of an existing or future facility by an independent, interdisciplinary audit team. Such a team is shown observing field conditions in Figure 3. RSAs have become a popular tool for evaluating the safety performance of in-service roads and are evolving to also become a tool for evaluating design choices and opportunities for enhancing safety. By identifying and mitigating for potential safety issues before a facility is constructed, safety performance is enhanced from the very first day of operation. More transportation agencies are conducting RSAs during the design stage of projects, especially on high-profile or high-cost projects such as major corridor improvements or freeway interchanges in metropolitan areas. Several agencies are exploring how RSAs and value engineering analyses could be integrated or coordinated in a way that ensures safety is appropriately considered during the value analysis process. Value engineering is a review or analysis of a proposed design to identify and recommend alternative solutions that reduce life-cycle costs while adding value to the facility.
13
Figure 3. A multidisciplinary road safety audit team observes conditions in the field.
STRATEGIC HIGHWAY RESEARCH PROGRAM SAFETY DATA A project now underway and supported by the FHWA and the AASHTO will enable State transportation agencies and their research partners to use new data developed through the second Strategic Highway Research Program (SHRP2) to develop improved methods for reducing crashes and improving highway safety.

14
As an example, a pilot project was conducted by this data to explore how certain types of geometric designs may influence driver behavior and impact safety at intersections focusing on Offset Left-Turn Lanes. The objective was to evaluate left-turning gap rejection and acceptance by a large number of drivers at a large number of intersections with a broad distribution of left-turn lane offsets (ranging from negative to positive). The outcome is expected to help DOTs design intersections that balance crash risk with construction and maintenance cost.
The SHRP2 safety data comprise two large databases: a Naturalistic Driving Study (NDS) database and a Roadway Information Database (RID). The NDS data provide a wealth of information regarding driving behavior, and the RID is a companion database measuring roadway elements and conditions. Included in the RID are geometric data that were collected consistently and within project specifications on 25,000 miles across six States. These two databases are linked to associate driver behavior with actual roadway characteristics and driving conditions.
The ongoing projects related to geometric design topics include 1) evaluation of the interaction between horizontal and vertical alignment on rural two lane roads with objective to understand driver behavior and response to different combinations of horizontal and vertical alignments at different risk conditions; and 2) exploration into how is driver behavior and performance impacted while in the vicinity of closely spaced interchange ramps by examining driver behavior and performance at these locations that may lead to uncovering potential changes in design criteria, signing, and markings as well as other potential countermeasures to reduce crash frequencies and severities.
Through the FHWA/AASHTO Implementation Assistance Program, datasets are being made available to State DOTs to identify crash causation factors and to develop effective countermeasures, such as road designs, that will address their common safety concerns. A three phased approach is being used to reduce the risk and uncertainty of the application process. In Phase 1, States will demonstrate within nine months if their research concept is viable. After review from FHWA/AASHTO task force some of the projects will move to Phase 2 in which they will use full NDS/RID databases and conduct in-depth research and analysis with countermeasure identification. In Phase 3, selected projects will be funded to adopt, champion, and implement countermeasures nationally.
The FHWA has established the Safety Training and Analysis Center (STAC) at Turner-Fairbank Highway Research Center (TFHRC) to assist the research community and State DOTs when using data from the SHRP2’s NDS and RID databases. The STAC will advance the design, development, and execution of training to support research and analysis focused on addressing the safety of the roadway environment, specifically the impact of roadway features on driving behavior. It will also provide technical assistance to highway safety data stakeholders (primarily State DOTs), including access to subject matter experts from the academic and scientific communities working at TFHRC to expand the roadway safety body of knowledge.
FHWA will use the STAC to analyze the data, conduct research, and develop tools to address high priority issues of national significance. The STAC will support the mission of FHWA’s Office of Safety Research and Development to use a data-driven, systematic approach to reducing highway fatalities and making the nation’s roads safer.

15
INTEGRATING HUMAN FACTORS IN DESIGN Human factors pertain to the capabilities and limitations of human beings as vehicle drivers, bicyclists, and pedestrians. Applying the knowledge of human factors is a critical component for safe and efficient road design. Highway agencies and design practitioners are increasingly applying human factors principles in the design decision-making process. Knowledge about how certain user groups are likely to respond to given conditions can help designers reduce the risk of user error, or at least minimize the consequences of an error should one occur.
The NCHRP Report 600, Human Factors Guidelines for Road Systems, Second Edition, (25) was released in 2012. These guidelines make up an important resource that provide human factors principles and findings for consideration by highway designers, traffic engineers, and safety practitioners. The design related content in the Human Factors Guidelines (HFG) is presented in a structured format intended to maximize ease-of-use and interpretability. The guidelines focus on providing specific, actionable design principles, supported by a discussion and review of key research and analyses. The HFG offers design information on roadway location elements such as curves, grades, and intersections.
Traffic engineering elements such as signing, marking and lighting are also covered. Special design issues and considerations are included to help address design constraints and relevant trade-offs. The HFG help design engineers to more effectively consider the roadway user’s capabilities and limitations in the design and operation of highway facilities. The impetus behind the HFG was the recognition that current design references have limitations in providing the practitioner with adequate guidance for incorporating road user needs and capabilities when dealing with design and operational issues.
The FHWA has developed a new Human Factors Guidelines Workshop based on the NCHRP Report 600. This workshop will help attendees gain an understanding of the HFG and how it can be applied to road system design and operational decisions. This course describes why it is important to incorporate human factors in the design and operation of roadways and describe the relationships between driver capabilities, driver behavior and roadway safety. The workshop also demonstrates how the HFG and the HSM (11) can be used cooperatively along with RSAs to further improve the design decision making process.
In 2014, the FHWA released the Handbook for Designing Roadways for the Aging Population (26) that provides practitioners with a practical information source that links aging road user performance to highway design, operational, and traffic engineering features. It includes sections related to freeway road segments and interchanges useful in providing special consideration to the needs of older users.
Demographic trends in the US indicate that by the year 2030, one-fifth of drivers will be in the 65-and-older age group. The increasing numbers and percentages of aging persons using our nation’s streets and highways in the decades ahead will pose many challenges to transportation engineers and the focus on improving safety and operational efficiency. In effect, for many aspects of road design, the “design driver” and the “design pedestrian” will be 65 or over.
Compared to other mobility options such as public transit and walking, the personal automobile remains the overwhelming choice for most US seniors. This means that there will be a steadily increasing proportion of drivers who experience declining vision; slowed decision-making and reaction times; exaggerated difficulty when dividing attention between traffic demands and other important sources of information; and reductions in strength, flexibility, and general fitness.

16
In a proactive response to this pending surge in aging road users, the FHWA first published the Older Driver Highway Design Handbook in 1998 to provide highway designers and engineers with the first practical information source linking age-related declines in functional capabilities to enhanced design, operational, and traffic engineering treatments, keyed to specific roadway features. Experience with these enhanced treatments, including extensive feedback from local and State-level practitioners, led to the release of the Highway Design Handbook for Older Drivers and Pedestrians in 2001. Now, a third edition of this resource has been prepared, under a new title, which incorporates new research, expands the range of applications covered by the Handbook, and introduces format changes—including a web-based version—that will facilitate access and use by engineering professionals.
The FHWA has sponsored recent research that investigated driver expectations and signage at complex interchanges. (27,28) The results from these studies indicated that complex interchanges pose significant challenges to most drivers, and that many of these problems arise from basic human factors issues related to various aspects of interchanges. For example, one important design issue identified was that the perceptual grouping of information elements on guide signs had clear and systematic effects on how drivers interpret and use sign information, and moreover, that the inappropriate application of perceptual grouping led to incorrect driver assumptions about lane destinations. These perceptual factors, in addition to other human factors issues, were investigated using empirical data collection methods. The FHWA is continuing research efforts on complex interchanges with the goal of developing useful design guidance for promoting the consistent and effective implementation of good practices related to perceptual elements of guide signs. The study will consult with roadway engineers and other stakeholders to identify how the research can best serve to provide design guidance about human factors and complex interchanges.
Some of the Implementation Assistance Program projects under SHRP2 will investigate driver behaviors such as: 1) Understanding the interactions between pedestrians and drivers at signalized intersections, 2) Investigating the roles of the driver and roadway characteristics in crashes, 3) Assessing how speed limits on certain types of roadways affect driver behavior, 4) Assessing driver behavior near closely spaced interchange ramps, and 5) Investigating how weather conditions affect speed behavior and drivers.
NON-MOTORIZED TRANSPORTATION With the increased awareness of the need to not only accommodate, but fully integrate, the needs of pedestrians and bicyclists into highway and street infrastructure; increased emphasis is being placed on the planning, design, and operation of pedestrian and bicycle networks that are safe and convenient for the full range of user abilities.

17
Figure 4. Separated bike lanes on 15th Street in Washington, D.C.
Designing for Pedestrians and Bicyclists In 2015, Secretary of Transportation Anthony R. Foxx challenged mayors and other elected city officials in the U.S. to “take significant action to improve safety for bicycle riders and pedestrians of all ages and abilities.” (29) Key elements of this challenge include using designs that are appropriate to the context of the street and its uses and taking advantage of opportunities to create and complete pedestrian and bicycle networks. The FHWA released updates to PEDSAFE in 2013 and BIKESAFE in 2014 providing guidance on countermeasures to improve safety for these vulnerable roadway users. (30,31)
In 2012, the AASHTO released the 4th edition of its Guide for the Development of Bicycle Facilities. (32) This new publication greatly expands upon the information available in the previous 1999 edition. The guidelines now include dimensions and operational characteristics of a range of design bicycles, such as recumbent bicycles and bicycle trailers. Recommendations on the selection of bikeway type are based on characteristics of the roadway, with an emphasis on providing bike lanes and bike paths on roadways with higher volumes and speeds rather than expecting bicycles to share lanes with motor vehicles. For on-road bicycle facilities, design details are addressed for a range of roadway configurations and recommendations are made for how to retrofit existing roadways to accommodate bicycle travel. The guide also addresses the need to plan for short and long term bicycle parking and to design effective parking facilities.

18
The AASHTO Guide is a comprehensive treatment of the planning, design, safety, and operational considerations for bicycle facilities. However, it does not include innovations—such as bike boxes—that are being tried in various municipalities around the country. The National Association of City Transportation Officials released the Urban Bikeway Design Guide (33) in 2010 to address these innovative techniques for on-street bikeways. A majority of these innovative techniques are compatible with the other AASHTO and FHWA guides and manuals.
Several municipalities are making advances with the use of separated bike lanes—sometimes referred to as cycle tracks—and there has been a need for more design guidance for these types of facilities. (See Figure 4.) FHWA will be releasing a guide for the design of these separated bike lanes in 2015. With limited bicycle crash data available, linking design features to actual safety performance continues to be a challenge. The guidelines will, however, address the benefits and challenges with the various design treatments and provide designers with background information on what is currently known about the safety of these designs.
Accessible Transportation The year 2015 marks the 25th anniversary of the Americans with Disabilities Act. This civil rights legislation has a direct effect on design decisions with its requirements to assure equal access to government programs (such as transportation) and to public places for people with physical or mental impairments. (See Figure 5.) Shortly after this law was enacted, the Americans with Disabilities Act Accessibility Guidelines (ADAAG) (34) were adopted as the design standard for making facilities accessible to all pedestrians. These standards, and more recently adopted updates, include requirements such as limiting criteria for clear passage, turning spaces, longitudinal and cross slopes, ramps with handrails, curb ramps between sidewalks and street crossings, and handicap parking spaces. However, these standards are more applicable to building and site construction then they are to the longitudinal public right-of-way. Designers and agencies have been left to translate the ADAAG standards, where applicable, to highways and streets and make judgments on issues not fully addressed by the standards.
The U.S. Architectural and Transportation Barriers Compliance Board is in the process of finalizing its Guidelines for Pedestrian Facilities in the Public Right-of-Way (35). Notable features of these guidelines include:
• Minimum continuous width of sidewalks is 4 ft. (1.2 m.), exclusive of curb. • Longitudinal grade of sidewalks may match, but not exceed, the grade of the adjacent roadway. • Wherever pedestrian-activated signals are installed, the push buttons must be properly located
and have locator tones and audible and vibrotactile indications. • Cross slope of crosswalks at intersections may not exceed 2% if crossing traffic always slows or
stops, as at a yield or stop sign. • Cross slope of crosswalks at intersections may not exceed 5% if crossing traffic may at times
proceed through the intersection without slowing, as during the green phase of a signal. • All crosswalks, whether marked or unmarked, must be accessible to the sidewalks via a curb
ramp or blended transition. • Curb ramps and blended transitions must have detectable warning surfaces to alert pedestrians
with vision disabilities of the boundary between the sidewalk and street.

19
• Some parking spaces with accessible features must be provided wherever there is marked or metered on-street parking.
With these new guidelines, it will be more imperative than ever that accessible design is considered early in the development of design alternatives. Requirements for crosswalks will affect horizontal and vertical alignments and drainage at intersections. Curb ramps may require additional right-of-way at intersection corners. Utilities may need to be removed or relocated. When designers leave consideration of accessible pedestrian facilities until later in the design, they may severely limit their opportunities to develop a design which best meets the needs and provides the best functionality for all users.
Because these guidelines are based on civil rights law, designers do not have the same latitude to vary from them as they would other design standards and guidelines. However under extraordinary conditions with limiting terrain or other severe constraints, designers may determine that meeting the guidelines is impracticable, but they must still design the facilities to conform with accessibility standards to the maximum extent feasible.

20
Figure 5. Pedestrian with physical impairment crossing street in Saugutuck, Michigan Photo credit: www.pedbikeimages.org/ Dan Burden

21
MANAGED LANES—HOT AND HOV LANES The term managed lanes encompasses a range of strategies and techniques to control the usage of freeway lanes to improve the efficiency by which people travel along the corridor. These strategies and techniques may be implemented with a permanently-applied scheme or varied as conditions change. Managed lanes are used to reduce congestion and travel time and improve trip reliability while reducing costs and impacts associated with constructing additional lanes.
The managed-lane strategy most commonly used in the U.S. is high-occupancy-vehicle (HOV) lanes, where priority is given to vehicles with a minimum number of passengers. The first implementations were bus-only lanes, but to increase utilization of these lanes, HOV lanes were expanded to allow vehicles with multiple passengers in 1970’s and 1980’s. Many of these HOV lanes have since evolved into high-occupancy-toll (HOT) lanes, where drivers can pay a toll to use the lane when they don’t meet the vehicle occupancy requirements to use the lane for free. Prices are set to maximize the use of the lane while providing a benefit of travel time and trip reliability to drivers who pay the toll. Presently there are more than 150 HOV or HOT facilities in the U.S. (36)
Until recently tolling on the Interstate System was limited to pilot programs. Recent legislative changes have opened the opportunity to use tolling strategies on the entire Interstate System. Additional lanes may be constructed as toll lanes or HOV lanes may be converted if the number of general purpose lanes remains the same. (37) With this relaxation of tolling restrictions on the Interstate, continued increases in congestion, and limited resources; interest in implementing toll strategies will only increase.
Facilities with HOT/HOV lanes have a number of features that require special attention with respect to the geometric design. Many agencies are moving to automated toll collection, using transponders in the vehicles or cameras to read license plates. These automated toll collection methods eliminate the need for toll collection sites along the roadway, thus reducing delays and conflicts between drivers seeking the shortest queue. The HOT/HOV lanes are usually the left-most lanes on the freeway and will operate at higher travel speeds then the adjacent general purpose lanes. (See Figure 6.) This differential in speeds between adjacent lanes presents a potential crash risk, which is managed by providing a buffer between the lanes and controlling ingress and egress from the HOT/HOV lanes. Designs for the buffers vary, ranging from painted buffers to physical barriers to separate lanes. Zones where lane changes are permitted between the general purpose lanes and the HOT/HOV lanes must be located with consideration of the interchanges and the lane changes required for entering or exiting the freeway and maneuvering to or from the HOT/HOV lanes. In many locations, direct access ramps have been constructed between cross-streets and the HOT/HOV lanes. At freeway-to-freeway interchanges, additional ramps are often constructed to allow motorists in the HOT/HOV facility to move directly to the HOT/HOV lanes of the other facility without traversing the general purpose lanes.
Where congestion is high and space for addition of lanes is limited, shoulder running is another managed-lane strategy that is becoming more prevalent. With shoulder running, the existing shoulder is used as another travel lane, either for set time periods when congestion is usually high or dynamically in response to conditions. Since shoulders serve many purposes—such as clear roadside, breakdown lane, enforcement activities, maintenance activities, and drainage—the need for additional lane capacity is balanced with these other needs.
22
Shoulder running strategies necessitate careful consideration of lane configurations at interchanges, reduced clear zone on the roadside, speed, emergency pull-offs, and enforcement. Additional signing and striping is used at freeway exit and entrance ramps to communicate to drivers whether the shoulder is open as a lane and how to navigate through the interchange. With vehicles using the shoulder lane, the width of clear roadside is reduced and vehicles that run off the roadway have less space to recover. However, when shoulder running is only used during congested times of day, the travel speeds are lower and balance this risk. With shoulder running, it is also necessary to determine how to address incidents and maintenance. Emergency pull-offs may be strategically located along the corridor. With active traffic management that allows operators to immediately open or close lanes, additional opportunities become available to respond to incidents and close a lane for maintenance activities. Enforcement activities are unlikely to occur when there is not a safe place to pull-off the roadway. Automated enforcement is an opportunity to improve compliance where there aren’t locations to pull over; however, automated enforcement is not currently accepted in all locations.

23
Figure 6. High-occupancy toll lanes in use on I-85 in Georgia
EMERGING TECHNICAL AREAS
Accelerating the deployment of innovative practices and technologies to deliver safer, more efficient projects with less delivery times is the focus of the FHWA’s Every Day Counts (EDC) initiative. EDC is a national effort and partnership between the FHWA, the AASHTO, and State and local transportation agencies that places significant emphasis on the deployment of specific technologies over a short period of time. The ultimate goal is to significantly accelerate proven solutions across the Nation compared to normal dissemination timeframes. Several EDC initiatives are related to improving safety through better design.

24
Innovative Intersection and Interchange Geometrics Transportation professionals in the U.S. are challenged to meet the increasingly complex safety and mobility needs of a growing population, and to do so with limited resources. In particular, at many highway junctions, congestion continues to worsen. Drivers, pedestrians and bicyclists experience longer delays and greater exposure to risk. Traffic and safety problems are more complicated than ever, and conventional intersection designs are sometimes found to be insufficient to mitigate transportation problems. Increasingly, design engineers are investigating and implementing innovative intersection treatments.
Through the EDC initiative, efforts have been made to accelerate wide deployment of innovative intersection and interchange designs by developing design and operational guidelines, providing training, promoting peer-to-peer exchanges, and developing informational videos and video case studies to help agencies explain these concepts to project stakeholders. Although there are many innovative designs emerging around the country, this EDC initiative focused on advancing a select few intersection and interchange designs with substantial and proven benefits compared to conventional designs. The intersection and interchange designs being advanced through this initiative are: displaced left-turn intersections, variations on U-turn intersections, diverging diamond interchanges, and modern roundabouts.
Restricted Crossing U-Turn Intersection The restricted crossing U-turn (RCUT) intersection is also known as a “J-turn” intersection or “Super-Street” design. The intersection geometrics require that vehicular traffic from the minor-street wanting to proceed straight through, or make a direct left-turn, make these movements by way of a right turn onto the major road, followed by a U-turn at a median crossover downstream of the main intersection, then proceeding back to the main intersection for a right turn (to complete the original through movement) or continuing straight (to complete the original left-turn). On rural high-speed facilities these movements pose the greatest risk for severe crashes and in the J-turn design they are replaced with a series of indirect turns that are less likely to result in a crash.
Median U-Turn Intersection Median U-turn intersections (MUT) involve prohibiting direct left-turns at the main intersection through signing. To turn left from the major road onto an intersecting cross street, drivers travel through the intersection and then execute a U-turn at a downstream median opening and then turn right at the cross street. Drivers on the side street desiring to turn left onto the major road must turn right at the intersection and then execute a U turn at the downstream median opening and proceed back through the intersection. This design can be implemented with or without signal control at the median openings on the major road.
Displaced Left Turn Intersection The displaced left turn intersection (DLT) eliminates the conflicts at the main intersection between left-turning vehicles and oncoming traffic by utilizing a left-turn bay placed to the left of oncoming traffic, as shown in Figure 7. This conflicting movement is relocated upstream where vehicles cross-over opposing traffic and into the left-turn bay at a midblock signalized intersection on the approach to the main intersection thereby increasing mainline capacity.

25
Figure 7. Displaced left-turn intersection where left turn lanes cross to the far left side of the road at a signal in advance of the main intersection.
Diverging Diamond Interchange The design of the diverging diamond interchange (DDI), also known as the double crossover diamond interchange, enhances the safety and operations of the intersections at a diamond-style interchange by reducing the number of conflict points and by allowing more efficient two-phase signalized intersections at the ramp terminals within the interchange. This is accomplished through geometry and channelization that moves traffic to the left side of the roadway between the ramp terminals, thus allowing a left-turn movement without the need for an exclusive signal phase. (See Figure 8.) The result is more efficient traffic movement and greater throughput along the crossroad in the same amount of space.
The first full application of the DDI design in the U.S. opened to traffic in 2009 in Springfield, Missouri. Although the concept had been utilized at a few interchanges in France, usage within the U.S. was at first met with great skepticism and safety concerns over wrong-way movements. The FHWA and Missouri DOT worked together to evaluate initial DDI design concepts in a highway driving simulator. The results from the study found that the large majority of drivers in the simulator were intuitively able to maneuver correctly through the DDI. This research helped to alleviate many of the initial safety and operational concerns about this innovative design. Following the great success of the initial DDIs built in the U.S., acceptance and utilization of the concept has increased enormously. By early 2015, more than 40 DDIs have been opened to traffic with many more in construction and development.

26
Figure 8. Diverging diamond interchange at I-270 and Dorsett Road in St. Louis, Missouri
Roundabouts The modern roundabout is a form of circular intersection in which traffic travels counterclockwise around a central island and in which entering traffic must yield to circulating traffic. Roundabouts have proven to be a very adaptable intersection geometric alternative, offering great flexibility for application where designs may differ in terms of their size, number of legs, and number of lanes. Roundabouts have been successfully deployed across a wide range of contexts including at isolated rural intersections with high approach speeds and in intensely developed urban settings that include extensive pedestrian and bicycle features. In certain locations with constrained right-of-way, the application of mini-roundabouts is gaining acceptance. Mini-roundabouts are small roundabouts that typically feature a fully traversable central island. Modern roundabouts continue to gain acceptance in the U.S. with an estimate of over 3,500 in 2014. The growth has been exponential but implementation still lags in some States. Ongoing efforts to promote good design practice are essential to the continued safety and operational success that roundabouts have had in the U.S.
The FHWA published the Alternative Intersection/Interchange Informational Report (AIIR) in 2010 that presents information on selected intersection and interchange designs. Much additional experience and information has been gathered since the AIIR was published. Through the EDC program, the FHWA is updating information on the geometric design features, operational and safety issues, access management issues, costs and construction sequencing, and applicability of several innovative intersection and

27
interchange designs. Four new informational guides have been developed for the RCUT, MUT, DLT and DDI. These are available at: http://safety.fhwa.dot.gov/intersection/alter_design/.
Road Diets (Roadway Reconfiguration) A roadway reconfiguration, also known as a road diet, is another safety innovation promoted through EDC. Road diets offer several high-value improvements at a low cost when applied to traditional four-lane undivided highways. Benefits of a road diet include enhanced safety, mobility and access for all road users and a "complete streets" environment to accommodate a variety of transportation modes. A classic road diet typically involves converting an existing four-lane, undivided roadway segment to a three-lane segment consisting of two through lanes and a center, two-way left-turn lane, as shown in Figures 9 and 10. The benefits include crash reductions, reduced vehicle speed differential, improved mobility and access by all road users, and integration of the roadway into surrounding uses that result in an enhanced quality of life. A key feature of a road diet is that it allows reclaimed space to be allocated for other uses, such as turn lanes, bus lanes, pedestrian refuge islands, bike lanes, sidewalks, bus shelters, parking or landscaping.
Figure 9. Original configuration before a Road Diet, with two lanes in each direction. Photo credit: Randy Dittberner, VDOT

28
Figure 10. Final configuration after a Road Diet, with one lane in each direction, a two-way-left-turn-lane, and bike lanes. Photo credit: Randy Dittberner, VDOT
Four-lane undivided highways experience relatively high crash frequencies — especially as traffic volumes and turning movements increase over time — resulting in conflicts between high-speed through traffic, left-turning vehicles and other road users. FHWA has deemed road diets a proven safety countermeasure and promotes them as a safety-focused design alternative to a traditional four-lane, undivided roadway. Road diet-related CMFs are also available for use in safety countermeasure benefit-cost analysis. As more communities desire "complete streets" and more livable spaces, they look to agencies to find opportunities to better integrate pedestrian and bicycle facilities and transit options along their corridors. When a road diet is planned in conjunction with reconstruction or simple overlay projects, the safety and operational benefits are achieved essentially for the cost of restriping. A road diet is a low-cost solution that addresses safety concerns and benefits all road users — a win-win for quality of life.
Road diets stand the test of time, having been implemented by transportation agencies for more than two decades. One of the first installations of a road diet was in 1979 in Billings, Montana. Road diets increased in popularity in the 1990s, with installations occurring in both rural and urban States such as Iowa and Minnesota. Cities—including Charlotte, Chicago, New York, Palo Alto, San Francisco and Seattle—have also opted for the positive impact road diets bring to their communities. FHWA recently produced a Road Diet Informational Guide (38) to help communities understand the safety and operational benefits and determine if road diets may be helpful in their location.

29
High Friction Surface Treatments High friction surface treatments (HFST) are the site- specific application of very high-quality, durable aggregates using a polymer binder that restores and maintains pavement friction where the need for a safer pavement surface is the greatest. Maintaining the appropriate amount of pavement friction is critical for safe driving. Vehicles traversing horizontal curves require a greater side force friction, and vehicles at intersections require greater longitudinal force friction.
Horizontal curves made up only 5 percent of the highway miles in the U.S., yet more than 25 percent of U.S. highway fatalities occur at or near horizontal curves each year. While some of the factors contributing to these crashes include excessive vehicle speed or distracted driving and driver error, at some locations, the deterioration of pavement surface friction may also be a contributing factor. Variable friction creates the need to consider pavement improvements for surface characteristics, particularly for friction, at certain locations in order to increase safety.
Figure 11. High-friction surface treatment has been applied on one lane of a curved roadway. Eventually, the other lane was treated as well.

30
In locations such as sharp horizontal curves and where vehicles may brake excessively, the road surface of standard pavements may become prematurely polished, thereby reducing the available pavement friction. This loss of friction contributes to vehicles losing control or skidding at high speed, causing drivers to turn abruptly or brake excessively. Negotiating a sharper curve requires an increased friction demand, and that greater demand causes greater shear forces on the surface aggregate, thereby leading to even more polishing of the surface aggregate. When applied at such locations, the friction of the pavement is increased, as shown in Figure 11. The HFST technology is unique in its ability to address site-specific issues. While the largest numbers of problem locations are likely to be on the local and collector systems, there are also high-volume intersections, interchange ramps, and selected segments of Interstate alignments where these treatments would also be beneficial.
Safety Edge Roadway departures account for over half of all fatal crashes in the U.S. and pavement edge drop-off on roadways has been linked as a contributing cause of many such crashes. To mitigate vertical drop-offs, installing the Safety EdgeSM on pavements is another safety initiative advocated through EDC. This low-cost technology allows drivers who drift off highways to return to the pavement safely. By simply shaping the edge of the pavement to 30 degrees, the safety problem of vertical drop-off can be mitigated. The Safety EdgeSM provides a durable transition on which vehicles can return to the paved road smoothly and easily, even at relatively high speeds.
Figure 12. Sloping the edge of the pavement allows drivers who drift off the edge to correct and return to the roadway.
EXPANDING USE OF 3D MODELLING TO IMPROVE GEOMETRIC DESIGN

31
Three-dimensional (3D) modelling and design has been used heavily in the U.S. for several years. However, the focus of the models has changed significantly in recent years. A decade ago, 3D models were either developed as a wireframe that could be used by the designer for limited analysis or were processed into photo realistic fly-overs or drive-through movies intended to show the public what the final highway project would look. Today, 3D models are normally developed with a much more utilitarian goal.
Construction firms, both large and small, have been investing in Automated Machine Guidance technologies for their equipment, as shown in Figure 13. The equipment has advanced to the point that even precision work, such as paving, can be completed without traditional survey and staking. To take full advantage of their investment, the contracting industry has been working with DOTs to expedite the transition to electronic files. States are now using the traditional design software to export 3D terrain files that can be transferred directly to the contractors’ equipment. This reduces the chance of survey errors and typos that can occur as data is copied into or out of the paper plans. As the contract documents move away from traditional paper formats and toward a transfer of data, States have placed increased emphasis on accuracy of the models, consistency of data formats, ensuring data is not corrupted during usage, file security, digital signatures and related issues.
Figure 13. Concrete paver uses automated machine guidance with no need for string-lines. Photo credit: Kevin Merryman, Iowa DOT

32
The push toward electronic deliverables has necessitated a more complete and more consistent 3D model on each project. This has provided benefits in resolving more traditional design issues. In the past, visualization efforts focused on preparing photo-realistic images required special processing that was reserved for high profile projects. With the 3D model becoming the primary focus of designers, high quality, complete models are available for most projects. Aerial images can be draped over the existing terrain model with the 3D design superimposed over the existing terrain to provide a quick, good quality 3D visualization for public meetings or to address issues with multidisciplinary review teams. This allows the designer to move within the model to discuss any location with a property owner rather than just the locations that were fully developed with photo-realistic drive-throughs.
Figure 14. Using visualization, the design can be evaluated from the driver’s perspective. Image developed by: Brandon Filides, Iowa DOT
The models that are currently used can also provide a valuable insight for the designer to evaluate complex features such as intersection alignment and sight distance from a drivers view, as shown in Figure 14. This allows designers to view the future project in a simulated environment with much less work than previously required. Non-traditional designs can be evaluated in much greater detail than previous software and modeling would have allowed. A designer working in 3D will be able to discover design issues that may have otherwise gone unnoticed working in a two-dimensional (2D) environment. This is especially true with new or unique elements or design features. Working in a 3D environment can also be advantageous when evaluation the staging or construction sequencing of a project. It allows the designer to see points of conflict, drainage issues, and other details with more clarity than would be available in 2D. Bridge contractors are taking advantage of 3D design to evaluate equipment placement, clearance issues, and to assure there is sufficient room to remove existing structures as well as placing elements of the new structure. Agencies have also combined subsurface utility exploration with 3D design to analyze clearances and points of conflicts between utilities as well as conflicts with construction
33
staging. With the success of 3D design States are moving to 4D and 5D design, which incorporate cost and schedule to take even greater advantage of the model as a project management tool.
In addition to 3D modelling tools, agencies are utilizing data collection tools that can create virtual models of existing or constructed features with greater accuracy and precision, such as Light Detection and Ranging (LiDAR). LiDAR uses laser pulses to measure distance, providing significantly more data points with less disruption to traffic. As LiDAR usage increases and the quality of mobile data collection improves, designers have the opportunity to develop high-resolution models as a tool that provides even more information in greater detail and accuracy than currently available through tradition survey and photogrammetric practices. Combining LiDAR and computer–aided drafting and design creates a near virtual environment which gives the designer the ability to evaluate the design from an entirely new perspective--that of the user.
Some agencies have started using 3D measurement tools such as LiDAR to assess the existing geometric design features of roadways to strategically determine where to apply improvements. For example, designers can use this data to model existing highway surface geometry to evaluate storm water drainage performance based on in-situ conditions (pavement cross-slope and grade) and determine hydroplaning probability based upon predicted surface water film thickness. Depending on environmental conditions of the location; the rainfall frequency, intensity and duration variations can be taken into account prior to designing the project. Using this information with historical design details can identify those locations that present an increased crash risk. By combining technologies such as LiDAR with design tools, agencies have a greater opportunity to manage risk and make cost-effective decisions by applying improvements only to locations with the need to reduce hydroplaning potential without making the expenditure to modify cross-slope along the entire corridor.

34
LOOKING TO THE FUTURE OF SMART ROADS AND SMART CARS
Figure 15. Connected vehicles of all types communicating at a busy intersection.
As communication and mapping technologies are becoming more sophisticated, the U.S. Department of Transportation, auto manufacturers, and others are investigating opportunities and developing plans to utilize these technologies to improve highway safety and mobility. Vehicle-to-infrastructure (V2I) and vehicle-to-vehicle (V2V) communications allow drivers to received enhanced information based on their speed and location with respect to roadway features and other travelers, including pedestrians and bicyclists. (See Figure 15.) One example is the Curve Speed Warning where a driver may receive an in-vehicle alert if they are approaching a highway curve at an excessive speed. Another example is the Intersection Movement Assist where a driver receives a warning when it may not be safe to enter the intersection. Analyses of these and other currently identified applications of V2I have revealed the opportunity to eliminate 59% of single vehicle crashes and 29% of multi-vehicle crashes. (39) With this enhanced information based on real-time data, crashes can be significantly reduced without making physical changes to the roadway geometry. With the potential for more applications of V2V and V2I and the implementations of automated driving tasks, questions are raised about the traditional way of thinking about geometric design. The full implications of V2V and V2I technologies on geometric design decision-making are as yet unknown but will play a significant role in the evolution of the design decisions. More information about the on-going development of these emerging technologies is available at http://www.its.dot.gov.

35
CONCLUSION While safety continues to be the highest of priorities in highway design decisions across the U.S., increasingly this is accomplished in a delicate balance with other priorities. Many states and localities are embracing the national strategy, Toward Zero Deaths, to emphasize the need to continue making improvements to protect the travelling public. (40) Meanwhile, the U.S. Congress has enacted legislation requiring the evolution towards performance-based administration of the transportation system, with agencies setting specific targets to realize improvements in planning, safety, highway conditions, and transit. (41) Geometric design is the means by which so many goals and values in communities and transportation systems are achieved, and agencies across the U.S. are employing new approaches to design decision-making to assure the best use of their resources in achieving these transportation performance goals. The additional tools and knowledge now available are changing how designers perceive their roles. With improved knowledge about the needs of all road users and emerging means of predicting and modelling the effects of design decisions, it is becoming possible to truly understand the performance implications of these complex design decisions. These exciting changes provide greater opportunities to incorporate innovation into design decision-making and assure that these choices truly contribute to a successful transportation system for the future.

36
KEY TRANSPORTATION AGENCIES IN THE UNITED STATES As transportation professionals innovate to meet the challenges of making sound design choices, they do so in collaboration through key transportation agencies and organizations, which include:
• The American Association of State Highway and Transportation Officials (AASHTO) is an organization representing the transportation agencies of each State, the District of Columbia, and Puerto Rico. Professionals from State agencies volunteer to contribute to policy, standards, and technical activities through AASHTO’s committees.
• The Federal Highway Administration (FHWA) is the governmental agency that supports State and local governments in the design, construction, and maintenance of the National Highway System through financial and technical assistance.
• The U.S. Department of Transportation (USDOT) is the governmental agency that oversees national transportation policies to provide safe and secure transportation across all modes of travel and encompasses the administrations and bureaus that support each of those modes, including the FHWA.
• The Transportation Research Board (TRB) supports advances through research and dissemination of knowledge related to practice and policies. The TRB is part of the National Research Council and is funded by federal and State transportation agencies and other organizations with an interest in transportation.
• The Institute of Transportation Engineers (ITE) is an international association of transportation professionals and supports education, public awareness, research, and information exchange.
• The National Association of City Transportation Officials (NACTO) is a nonprofit professional organization representing large cities on transportation issues.
• The National Association of County Engineers (NACE) is a nonprofit professional organization representing county and parish engineers, transportation or public works directors, highway superintendents, and the like, who oversee local roads, which comprise the majority of the nation’s highways.
37
REFERENCES (1) Federal Highway Administration, “Highway Statistics Series,”
http://www.fhwa.dot.gov/policyinformation/statistics/2011, accessed April 20, 2015. (2) United States Department of Transportation, “National Transportation Statistics,”
http://www.rita.dot.gov/bts/sites/rita.dot.gov.bts/files/publications/national_transportation_statistics/index.html, accessed April 20, 2015.
(3) Federal Highway Administration, “Highway Vehicle-Miles of Travel by Vehicle: 2003,” http://ops.fhwa.dot.gov/freight/freight_analysis/nat_freight_stats/docs/05factsfigures/fig2_2.htm, accessed April 20, 2015.
(4) National Highway Traffic Safety Administration, “2013 Motor Vehicle Crashes: Overview,” http://www-nrd.nhtsa.dot.gov/Pubs/812101.pdf, accessed April 20, 2015.
(5) National Highway Traffic Safety Administration, Traffic Safety Facts 2005, http://www-nrd.nhtsa.dot.gov/Pubs/TSF2005.PDF, accessed April 20, 20015.
(6) Institute of Transportation Engineers, Informational Report, Integration of Safety in the Project Development Process and Beyond: A Context Sensitive Approach, publication pending.
(7) Institute of Transportation Engineers, Designing Walkable Urban Thoroughfares: A Context Sensitive Approach, 2010. http://www.ite.org/css/, accessed February 25, 2015.
(8) Federal Highway Administration, Flexibility in Highway Design, 1997. http://www.fhwa.dot.gov/environment/publications/flexibility/, accessed February 25, 2015.
(9) American Association of State Highway and Transportation Officials. A Guide for Achieving Flexibility in Highway Design, May 2004, Washington, D.C.
(10) McGee, Hugh W., “NCHRP Synthesis 443 Practical Highway Design Solutions,” Transportation Research Board, Washington, D.C., 2013, http://www.trb.org/Publications/Blurbs/168619.aspx, accessed February 25, 2015.
(11) American Association of State Highway and Transportation Officials, Highway Safety Manual, 1st Edition, 2010, Washington, D.C.
(12) American Association of State Highway and Transportation Officials, Highway Safety Manual, 1st Edition, 2014 Supplement, Washington, D.C.
(13) American Association of State Highway and Transportation Officials Bookstore, https://bookstore.transportation.org/collection_detail.aspx?ID=136, accessed February 10, 2015.
(14) Transportation Research Board, “NCHRP 17-62 Improved Prediction Models for Crash Types and Crash Severities,” http://apps.trb.org/cmsfeed/TRBNetProjectDisplay.asp?ProjectID=3420, accessed February 10, 2015.
(15) Transportation Research Board, “NCHRP 17-63 Guidance for the Development and Application of Crash Modification Factors,” http://apps.trb.org/cmsfeed/TRBNetProjectDisplay.asp?ProjectID=3421, accessed February 10, 2015.
(16) American Association of State Highway and Transportation Officials, Highway Safety Manual, 1st Edition, Volume 2, 2010, Washington, D.C., p. A-1.
(17) American Association of State Highway and Transportation Officials, Highway Safety Manual, 1st Edition, Volume 2, 2010, Washington, D.C., p. C-18.
(18) Srinivasan, Raghavan, Daniel Carter, and Karin Bauer; How to Choose Between Calibrating SPFs from the HSM and Developing Jurisdiction-Specific SPFs, August 2013, http://www.pooledfund.org/details/study/484, accessed February 10, 2015.

38
(19) Bahar, Geni and Ezra Hauer; User’s Guide to Develop Highway Safety Manual Safety Performance Function Calibration Factors, January 2014, http://apps.trb.org/cmsfeed/TRBNetProjectDisplay.asp?ProjectID=3287, accessed February 10, 2015.
(20) Srinivsan, Raghavan and Karin Bauer; Safety Performance Function Development Guide: Developing Jurisdiction-Specific SPFs, September 2013, http://safety.fhwa.dot.gov/rsdp/downloads/spf_development_guide_final.pdf, accessed February 10, 2015.
(21) Neuman, Tim and Ida van Schalkwyk; HSM Implementation Guide for Managers, September 2011, http://www.highwaysafetymanual.org/Documents/hsm_mngrguide.pdf, accessed February 10, 2015.
(22) Van Schalkwyk, I., E.A. Wemple, and T.R. Neuman; Integrating the HSM into the Highway Project Development Process, May 2012, http://www.highwaysafetymanual.org/Documents/hsm_integration.pdf, accessed February 10, 2015.
(23) Federal Highway Administration, “Interactive Highway Design Model (IHSDM),” http://www.ihsdm.org/wiki/Welcome, accessed February 25, 2015.
(24) Wilson, Eugene M. and Martin E. Lipinski; “NCHRP Synthesis 336 Road Safety Audits,” Transportation Research Board, Washington, D.C., 2004, http://www.trb.org/Main/Public/Blurbs/155284.aspx, accessed February 25, 2015.
(25) Cambell, John L., Monica G. Lichty, James L. Brown, et al; “NCHRP Report 600 Human Factors Guidelines for Road Systems, Second Edition,” Transportation Research Board, Washington, D.C., 2012, http://www.trb.org/Main/Blurbs/167909.aspx, accessed February 25, 2015.
(26) Brewer, Marcus, Debbie Murillo, and Alan Pate; Handbook for Designing Roadways for the Aging Population, Federal Highway Administration, Washington, D.C., 2015, http://safety.fhwa.dot.gov/older_users/handbook/, accessed February 25, 2015.
(27) Richard, Christian M. and Monica G. Lichty; Driver Expectations When Navigating Complex Interchanges, Federal Highway Administration, Washington, D.C., 2013, http://www.fhwa.dot.gov/publications/research/safety/13048/index.cfm, accessed February 25, 2015.
(28) Fitzpatrick, Kay, Susan T. Chrysler, Marcus A. Brewer, et al; Simulator Study of Signs for a Complex Interchange and Complex Interchange Spreadsheet Tool, Federal Highway Administration, Washington, D.C., 2013, http://www.fhwa.dot.gov/publications/research/safety/13047/index.cfm, accessed February 25, 2015.
(29) United States Department of Transportation, “Mayors’ Challenge for Safer People, Safer Streets,” http://www.dot.gov/mayors-challenge, accessed February 25, 2015.
(30) Zegeer, Charles V., Dan Nabors, and Peter Lagerwey; PEDSAFE 2013 Pedestrian Safety Guide and Countermeasures Selection System, Federal Highway Administration, Washington, D.C., 2013, http://www.pedbikesafe.org/PEDSAFE/authors.cfm, accessed February 25, 2015.
(31) Sundstrom, Carl and Dan Nabors; BIKESAFE 2014 Bicycle Safety Guide and Countermeasure Selection System, Federal Highway Administration, Washington, D.C., 2014, http://www.pedbikesafe.org/BIKESAFE/authors.cfm, accessed February 25, 2015.

39
(32) American Association of State Highway and Transportation Officials, Guide for the Development of Bicycle Facilities, 2012, Fourth Edition, Washington, D.C.
(33) National Association of City Transportation Officials, Urban Street Design Guide, Island Press, Washington, D.C., 2013, http://nacto.org/usdg/, accessed February 25, 2015.
(34) United States Access Board, “About the ADA Standards for Transportation Facilities,” http://www.access-board.gov/guidelines-and-standards/transportation/facilities/about-the-ada-standards-for-transportation-facilities, accessed February 25, 2015.
(35) United States Access Board, “About the Rulemaking on Public Rights-of-Way,” http://www.access-board.gov/guidelines-and-standards/streets-sidewalks/public-rights-of-way, accessed February 25, 2015.
(36) Federal Highway Administration, “Federal-Aid Highway Program Guidance on High Occupancy Vehicle (HOV) Lanes, November 2012,” Chapter II, http://www.ops.fhwa.dot.gov/freewaymgmt/hovguidance/, accessed February 25, 2015.
(37) Federal Highway Administration, “Tolling and Pricing Questions & Answers,” http://www.fhwa.dot.gov/map21/qandas/qatolling.cfm, accessed February 25, 2015.
(38) Knapp, Keith, Brian Chandler, Jennifer Atkinson, et al; Road Diet Informational Guide, Federal Highway Administration, 2014, http://safety.fhwa.dot.gov/road_diets/info_guide/rdig.pdf, accessed February 25, 2015.
(39) Eccles, Kimberly, Frank Gross, Mindy Liu, et al; Crash Data Analyses for Vehicle-to-Infrastructure Communications for Safety Applications, Federal Highway Administration, 2012, http://www.fhwa.dot.gov/publications/research/connectedvehicles/11040/11040.pdf, accessed February 25, 2015.
(40) American Association of Motor Vehicle Administrators, American Association of State Highway Transportation Officials, Commercial Vehicle Safety Alliance, et al, Toward Zero Deaths: A National Strategy on Highway Safety, http://www.towardzerodeaths.org/strategy.php, accessed April 20, 2015.
(41) Federal Highway Administration, “Transportation Performance Management,” http://www.fhwa.dot.gov/tpm/index.cfm, accessed April 20, 2015.