evolving localization patterns of company foundations ... · pdf file3 evolving localization...
TRANSCRIPT

# 05.12
Tobias Scholl, Thomas Brenner and Martin Wendel
Evolving localization patterns
of company foundations
Evidence from the German
MST-industry
Marburg Geography
Working Papers on
Innovation and Space

2
Impressum:
Working Papers on Innovation and Space
Philipps-Universität Marburg
Herausgeber:
Prof. Dr. Dr. Thomas Brenner
Deutschhausstraße 10 35032 Marburg E-Mail: [email protected]
Erschienen: 2012

3
Evolving localization patterns of company
foundations – Evidence from the German MST-
industry
Tobias Scholl1
Schumpeter Center for Clusters, Public Policy and Innovation, Frankfurt University.
Thomas Brenner
Section Economic Geography and Location Research, Institute of Geography,
Philipps-University, Marburg.
Martin Wendel
Mainz University.
Abstract:
We investigate company foundations in the German micro technology industry by
means of a spatial-temporal micro-geographic analysis. In order to deal with our
unusual detailed data, we develop a new distance-based framework for a logistic
regression that is able to present results in a continuous space. Locations of com-
pany foundations are investigated with respect to their spatial proximity to similar
firms, patent owner, related industries and research institutions and are bench-
marked with the overall distribution of company foundations in Germany. We
demonstrate that spatial proximity has a clear influence on where new companies
are founded. Furthermore, the influence of proximity to different agents is not con-
stant over times but evolves with the industry’s life cycle.
.
Keywords: Spatial concentration, localization, clusters, MAUP, distance-based measures
JEL Classifications: C40, M13, R12
1 Corresponding author: Tobias Scholl, Schumpeter Center for Clusters, Public Policy and
Innovation, Frankfurt University. Email address: [email protected]

4
Section 1: Introduction
1 Introduction
New technologies and industries are one of the main driving forces of the economy. In the
early phase (expansion phase) of their life-cycle, industries often show high growth rates
(e.g. Klepper 1996, Audretsch and Feldman 1996) and an increasing tendency towards spa-
tial concentration (Dumais et al. 2002). Furthermore, clusters usually develop on the basis of
new technologies or industries (e.g. Brenner 2004). On average, clusters generate employ-
ment, economic growth and higher wages in the long run (Porter 1998). Hence, regions
benefit greatly from new industries establishing therein.
Therefore, it is of strong interest to understand where new technologies and industries
emerge and locate. What are the circumstances that make the appearance of a new industry
in a region more or less likely? Unfortunately, we know little about this. Studies of a whole
industry including its early development and explaining the spatial distribution in these early
times are very rare. An exception is the work by Steve Klepper and co-authors (Klepper
2006 and Klepper and Buenstorf 2009) who analyze the development of a number of indus-
tries such as the automobile industry and the tire industry. Most of the literature that dis-
cusses the geographic location of industries focuses on one location, e.g. in the context of
cluster studies. These studies explain why a specific location was a good place for the indus-
try to establish. Many relevant factors can be identified from this huge amount of literature
(see e.g. Brenner und Mühlig 2012).
We apply a different approach here, which adds comprehensive evidence to this literature.
The basic idea is in line with the arguments by Klepper (2006): start-ups, including spin-offs
and their location are of great importance for the spatial distribution of industries. Therefore,
we examine the location of all company foundations of one German industry. In contrast to
most of the approaches in the literature, we apply spatial econometrics for studying the fac-
tors that make company foundations more likely in one location than in another. This means
that we do not examine the motives and origin of each founder but analyze whether compa-
ny foundations appear especially near to other specific factors that might constitute a source
of founders. In addition, we repeat the analysis for a number of time periods in order to
study whether the relationships change during the industrial life-cycle.
The analysis is restricted to one industry: the micro technology industry. Micro technology,
or microsystems technologies (abbr. MST), is a high-tech industry that combines different
microelectronics components in an embedded system in a very small measure. Its fields of
application range from automobile up to medical technology. The MST is a young industry
that evolved from microelectronics at the end of the eighties. Therefore, it is an adequate
subject for studying the factors that influence the location of company foundations. It allows
for studying an industry nearly through all its so far existence. Furthermore, it was possible

5
Section 2: Theoretical framework
to identify nearly all relevant actors in this industry in Germany and their addresses, ena-
bling the usage of micro geographic data in our analysis.
The collection, evaluation and processing of micro geographic data has attracted an increas-
ing interest from many sides such as the private sector, government agencies and the scien-
tific community. In a recent article, Harvey Miller (2010) even sees an avalanche of spatial-
temporal data and calls for new methods to handle this large amount of information. Such
data, obtained by “new” sources, such as the internet, GPS systems or RFID-chips, do not
only allow insights into new fields of research but also the avoidance of false results and
misleading data. As Miller points out, until recent years, science had to match their methods
with limited and inaccurate information (Miller 2010: 181). While the availability of micro
geographic data is no longer a secret, many researchers do not exploit these possibilities as
the “new” data does not fit to the “old” methods.
To use the available micro geographic data in our case, we develop a novel framework for a
logistic regression that deals with the exact location of company foundations in relation to
the presence of other factors in space without being dependent on any spatial subdivisions
such as counties or zip-code regions. Beside the empirical results for the German MST in-
dustry, the development of such a framework is the second aim of the paper.
The rest of the paper is structured as follows: Section 2 provides the paper’s underlying
theoretical framework. Following the structure of our paper, this includes both thematic and
methodological aspects. Section 3 discusses related existing statistical methods. In Section 4
we present the data that we use in the empirical part. Section 5 starts with the description of
our new distance-based framework for a logistic regression. Its application to company
foundations in the German MST-industry, the results and interpretation are presented after-
wards. The last section concludes.
2 Theoretical framework
2.1 Spatial patterns of company foundations
Company foundations in high-tech industries do not happen anywhere but are generally
highly concentrated. The wide amount of literature on company foundations is doubtlessly
due to the fact that this topic is wildly examined from different scientific communities such
as economists, geographers or sociologists. Despite the different academic leitmotifs, there
is a common sense about the general spatial aspects of company foundations in high-tech
industries. In the following, a selection of central theories is briefly discussed, whose topic
are related to the question of the paper at hand.

6
Section 2: Theoretical framework
Entrepreneurs' location choices
One central aspect for the location of a company foundation is the spatial proximity to firms
of the same industry. Different factors make it more likely that a firm is founded in proximi-
ty to existing firms: One aspect are intra-industry knowledge spillovers. It has been shown
that the productivity of firms does not only dependent on their own R&D spending, but also
on geographically proximate firms of the same industry (e.g. Jaffe et al. 1993). If entrepre-
neurs want to benefit from those externalities, they might decide to locate close to existing
firms. While this approach somehow implies that an entrepreneur chooses his location by
comparing different opportunities, many researchers argue that the location of a firm is not
the result of choices but is mainly driven by the entrepreneur’s existing social network. Of-
ten, new entrepreneurs have worked in other firms of the same industry where they got in-
sight into technology and market opportunities and then found their own company close to
their previous employer where they can benefit from their existing relationships (Stuart and
Sorenson 2003: 231). Schmude has shown that 71.9 % of German start-ups are located in
the founders’ municipality (Schmude 2003: 295). The data that we use in this paper does not
allow for a distinction between the multiple influences of firms in the same industry, but
generally it is plausible to assume that spatial proximity to existing MST-firms positively
influences the founding of a new MST-firm.
Not only firms of the same industry, but also the presence of related industries may be im-
portant for a high regional funding activity. This is particularly true for young industries
when the level of standardization is low and innovation depends on combining knowledge
across industries (Neffke et al. 2008: 4). Furthermore, firms in related industries often serve
as suppliers (Stuart and Sorenson 2003: 231). As a proxy for the presence of related indus-
tries, we include the number of skilled workers in different industries into our investigation.
As it has been argued above, the local innovation capacity is an important aspect for high-
tech firms. Beside the spillover between firms, universities are seen as the central driver of
innovation. Especially young high-tech industries tend to cluster around research institutions
and universities due to local spillover of tacit knowledge (e.g. Audretsch et al. 2005). Fol-
lowing Caniëls (2000), universities tend to distribute their knowledge more openly than
companies. Besides supporting companies with knowledge spillover, research institutions
are often themselves the source of new firms. Analogous to company spinoffs, academic
spinoffs are often located closely to the entrepreneur’s prior place of work. According to a
survey of the German Ministry of Education and Research, one third of all academic
spinoffs are located at a 10 km distance from their incubator’s place (BMBF 2002: 42). In a
2006 survey conducted by IVAM, an international association of companies and institutes in
the field of micro technology, the access to research institutions was ranked the most im-
portant fact for the location choice of a start-up firm (IVAM-Research 2006: 1). Thus we
argue that spatial proximity to relevant research institutions should have a positive influence
on company foundations in the German MST industry.

7
Section 2: Theoretical framework
Beside the presence of research institutions, the proximity to innovative persons (normally
measured by patent applications) is also often used as a proxy for the local innovation ca-
pacity. Acs et.al (2002) show, that patent data give a reliable measure of innovative activity
for the US metropolitan statistical areas. Again, the proximity to patent owners might influ-
ence the founding activity in two ways: Firstly, a patent owner might start up his own com-
pany, whose location, as argued above, should be close to the owner’s current residence.
Secondly, firms might locate closely to patent owners to profit from local knowledge spillo-
ver.
Temporal dynamics of location choices
So far, we have argued that spatial proximity to other firms of the same industry, research
institutions, patent owners and skilled works has a general positive influence on company
foundations. While this holds true for nearly all high-tech industries it is reasonable to as-
sume that the importance of these factors is not constant over time but depends on the stage
of the industry’s life cycle. The industry life cycle theory (Gort and Klepper 1982, Klepper
1996, Audretsch and Feldman 1996) examines an industry with respect to temporal change
of industry specific factors such as innovation patterns, firm growth, entry and shakeout.
In the early phase, a new industry emerges through radical innovation. The entry rate is high
and new firms are often diversifying entrants of existing industries (Klepper 2006:
152).Tacit knowledge plays an important role and firms concentrate on rapid product inno-
vations (Audretsch and Feldman 1996: 259). As the industry is characterized by missing
standardization, innovation input comes from different sources; especially the influence of
producers outside of the industry is important during the early stage (Gort and Klepper
1982: 632). Neffke et al. (2008) have shown that industries in the early stage depend more
on spillover from other industries than in later stages. Both, the high ratio of diversifying
entrants and the importance of inter-industry spillover suggest that the proximity to firms in
related industries should have a higher influence on company foundations in the MST indus-
try during the early stage. Missing technical standardization and a high demand for research
and innovation make it also more likely that universities and research institutions have a
higher influence during the early phase (Audretsch and Feldman 1996: 269).
In the following stages (mature and declining stage), the industry becomes more self-
contained both with respect to their technological design and their spatial concentration. A
higher rate of standardization leads to similar products, sharp drop in prices and a focus
towards process driven innovation (Neffke et al. 2008: 7). Innovation requires very special-
ized, industry specific knowledge, skills and machinery so that intra-industry spillover pro-
cesses become more important. Following the higher rate of standardization, implicit
knowledge replaces tacit knowledge as the decisive force of knowledge spillover (Audretsch
and Feldman 1996: 270). Through spinoff process, early cluster of leading firms can lead to
an extraordinary agglomeration in an industry (Klepper 2006: 153). Brenner (2004) sees the
existence of a tipping point where clusters create self-augmenting processes that attract
8
Section 2: Theoretical framework
more and more firms. Hence, the presence of the industry itself in a region should become
more and more decisive for the location of foundations in the industry with time.
To sum it up, we want to investigate whether the proximity to observed agents (MST-firms,
research institutions, patent owners and skilled works) changes over time. The existing liter-
ature suggests that the proximity to research institutions and other industries plays a key role
in the early phase while the proximity to other MST-firms becomes more important during
the later stages.
2.2 Spatial statistics and the MAUP
As mentioned in the introduction, the second aim of our paper is the presentation of a lo-
gistic regression model that is able to deal with micro geographic data. Hereby, we cannot
only exploit our unusual detailed data but also circumvent the Modifiable Areal Unit Prob-
lem, a well-known problem in spatial econometrics. The MAUP states that results of statis-
tics that use spatial aggregated data always depend on the chosen level of aggregation1.
Nearly all popular spatial economic indices such as the Elison-Glaeser-, or the Gini-index
are affected by this problem.
To give an example for the MAUP, we will discuss a wildly investigated question in spatial
econometrics, whether company foundations can be explained by the spatial proximity to
similar firms and relevant scientific institutions.
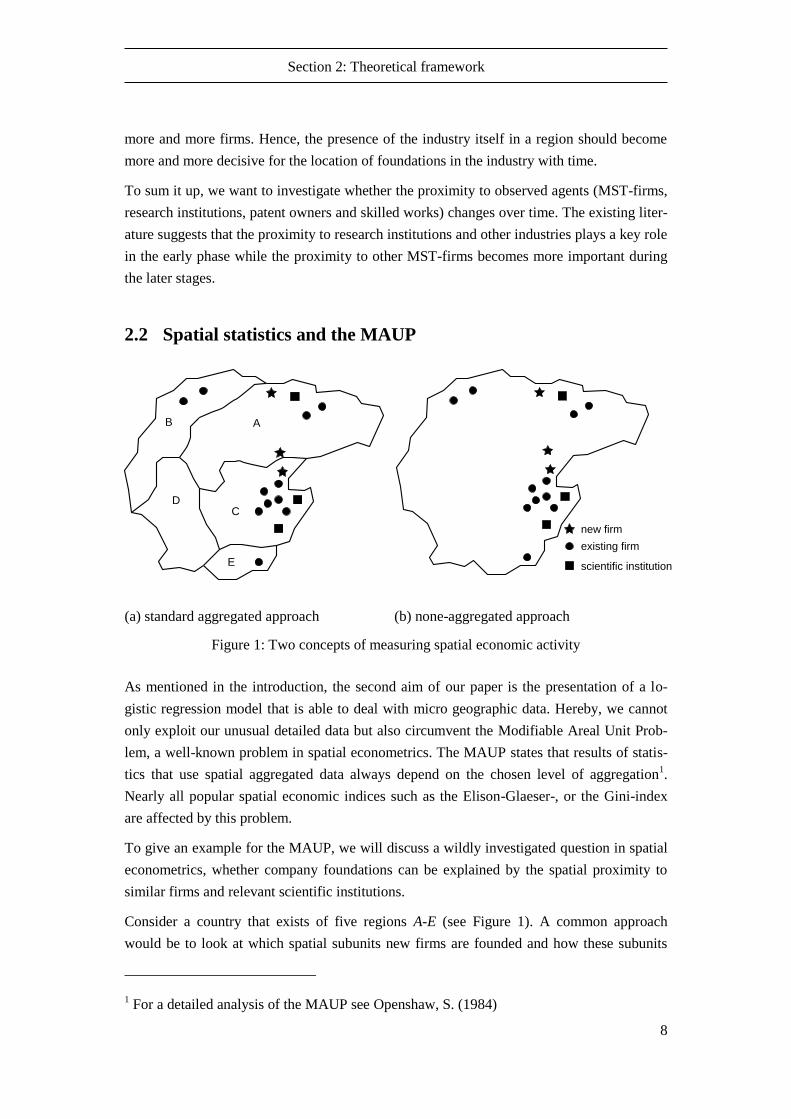
Consider a country that exists of five regions A-E (see Figure 1). A common approach
would be to look at which spatial subunits new firms are founded and how these subunits
1 For a detailed analysis of the MAUP see Openshaw, S. (1984)
(a) standard aggregated approach (b) none-aggregated approach
Figure 1: Two concepts of measuring spatial economic activity
A
D
B
C
E
new firm
existing firm
scientific institution

9
Section 2: Theoretical framework
are characterized by the observed agents. For example, region A shows two new firms and is
characterized by three existing firms and one scientific institution. By comparing the differ-
ent regions one can quantify the importance of existing firms and scientific institutions for a
company foundation through a spatial regression model:
(1)
where represent the strength of the parameters on the outcome of a company foundation
and is error term. The spatial autoregressive coefficient indicates the impact of company
foundations in neighboring regions whose individual influence is determined by the spatial
weights matrix .
Using a spatial regression model, spatial dependencies can be included as it is reasonable to
assume that company foundations cannot only be explained by the properties of a firm’s
region but also by the founding activity of surrounding regions. Nonetheless, results still
depend on regions instead of real locations. Normally these regions do not concern the eco-
nomic structure of the area under investigation but depend on administrative classifications
that provide the data for the analysis. The arbitrariness of boundary lines is referred to as the
zoning-problem of the MAUP. The scale problem is the result of a possible variation in the
spatial aggregation level, once a boundary line has been chosen. For example, if regions A-E
stand for a county, one might change the aggregation level to zip-codes, that lie inside the
counties.
There are only few papers and even less models that deal with the investigation of economic
activity without the MAUP. To our knowledge merely two different groups of MAUP-free
methods exist: The first group is represented by the Geographical Weighted Regression
(GWR) that is able to check for local differences in parameter estimations without an a pri-
ori specified spatial subdivision. The other methods belong to the group of distance-based
test statistics2 that check whether firms are located more concentrated or disperse to each
other in space. Representatives are, for instance, the DO-index by Duranton and Overman
(2005), the M-function by Marcon and Puech (2010) or the cluster-index by Scholl and
Brenner (2012).
In order to avoid the shortcomings of the MAUP, the operational unit has to be shifted from
regions to real geographical distances, which is the core concept of all distance-based meth-
ods. However, despite methodological progress and the increasing availability of spatial
data, there is a natural limit of circumventing the MAUP for some research topics. Consider
that one would also be interested in how the number of qualified labor influences the found-
ing of firms. An absolute MAUP-free answer to this question would be to look at each spe-
2 By the term “test-statistics” we refer to statistical methods that are in first line index based
tests (by instance Student`s t-test).

10
Section 3: Existing distance based methods
cific spatial position of a worker, e.g. his home-address. There are two points that limit this
approach: On the one hand, such detailed information about private persons is often not
available and its collection is controlled by strict laws in most countries. On the other hand,
the methodological approach for such spatial data is different. In comparison to firms or
research institutions, workers are not fixed in space as they normally do not work at home
but commute. Hence, there is no exact spatial position of workers but they are characterized
by spatial fuzziness. In the empirical section we show how we deal with that problem.
Considering the number of publications, MAUP free methods have not attracted much inter-
est in spatial econometrics. In his recent review “Thirty years of spatial econometrics” Luc
Anselin even excludes work that “does not take an explicit regression approach”, such as
test statistics (Anselin 2010:4). The author also mentions that the GWR has rarely been used
in economic research (Anselin 2010:14). If MAUP free methods provide a more accurate
investigation and if more and more micro spatial data is available then why are they used so
rarely? Here, we see a lack of matching the methods to the needs of spatial econometric
analysis. As test-statistical methods normally only allow the observance of one outcome,
they cannot be used for multivariate analyses that are standard in econometrics. While the
GWR is able to handle multiple variables, its core concept is to check for local deviations in
parameter estimations and is therefore a local model while the majority of econometric re-
search focuses on global outcomes. The framework for a logistic regression that we present
here is able to fill this methodological gap as it is distance-based, allows the observation of
multiple variables and gives results for global models.
3 Existing distance based methods
In this section, we will present different distance-based approaches in spatial econometrics
that are related to our new approach but show some properties that impair their usage for the
question of our paper. Though the Geographic Weighted Regression also allows a MAUP
free investigation, we will not consider it here, due to the yet mentioned fact that the GWR
is a local model. If n agents are observed, the GWR presents n different parameter estima-
tions. In comparison to the GWR, our new approach is a global model that performs a single
parameter estimation for the whole area under investigation. Thus, we will only compare
our method to other global models.
3.1 Distance based test-statistics
In contrast to regression models, distance based test-statistics focus on significance levels
instead of parameter estimations. As mentioned in section 1, there exist several MAUP-free
test-statistics. Though the metrics differ in their mathematical models they all base on the
same structure. Here, we will discuss the index by Duranton and Overman (2005) that is one

11
Section 3: Existing distance based methods
of the most established metrics for MAUP-free investigations of economic activity. The idea
of the D&O-index is to check whether the number of neighborhoods at a specific distance
between firms is significantly higher or lower than expected by random. To this end, a
smoothed density over all neighborhoods, expressed by the term K(d), is used. The first step
to compute K(d)-values is to build the geographical distances between all possible pairs of
firms so that one gains N(N-1)/2 unique bilateral distances. In the next step, one counts the
number of firm pairs that have a certain distance. The last step is smoothing the observed
numbers using a Gaussian kernel function. The solid line in Figure 2 plots the K(d)-values
for the German MST-industry. The dashed lines refer to the confidence intervals that are
built by a bootstrapping approach (Duranton & Overman 2005:1086). Figure 2 shows that
the German MST-industry has significantly more neighborhoods for the distances of 0-30
km and 290-360 km. This suggests that there are several clusters that are located at larger
distance to each other.
Although distance-based test-statistics show a lot of interesting features, their fields of ap-
plication are quite narrow. Until now, the methods only allow the testing for differences in
the (co-) localization pattern of firms and industries, but combining several aspects in one
research design is difficult (Duranton & Overman 2005:1079). Furthermore, the indices can
only deal with distances between firms but, for instance, characteristics explained by dum-
my-variables cannot be included.
Figure 2: K-density for the German MST industry.
0 20 40 60 80 100 120 140 160 180 200 220 240 260 280 300 320 340 360 3800.0
000
0.0
010
0.0
020
0.0
030
0.0
040
distances (km)
density

12
Section 3: Existing distance based methods
3.2 Klier & McMillen’s approach
Before we will present our new approach we will discuss the paper of Klier & McMillen
(2008) since their method is the closest to ours as far as we know from the existing litera-
ture. In their study about the U.S. auto-supplier industry Klier & McMillen investigate
whether the location choice of new firms in the timeframe of 1991-2003 can be explained
by a logistic regression. As explanatory variables they use the distance to the closest assem-
bler, the number of other existing suppliers3 within a radius of 100 miles, the distance to
Detroit and the presence of an Interstate highway in the zip-code of the firm. Furthermore,
they consider social statistic variables drawn from the 1990 U.S. Census such as the popula-
tion density, the proportion of white population or the proportion of employees who work in
manufacturing jobs at a zip-code level (Klier & McMillen 2008: 253).
The dependent variable of a logistic regression can only take the value one (condition ful-
filled) or zero (condition not fulfilled) and both cases are mandatory for the parameter esti-
mation (see section 5.1). The zero value can also been seen as the null hypothesis or as a
benchmark. In their investigation, Klier & McMillen define the null hypothesis as five ran-
domly drawn zip-codes that represent a hypothetical company site. On the other hand, the
value one stands for the spatial position of a zip code where a new auto-supplier was found-
ed.
The yet mentioned points show that the paper of Klier & McMillen deals with similar as-
pects as the paper at hand: The authors investigate the founding of firms from a micro-
geographic perspective by means of a logistic regression. Furthermore their approach has a
time component as they divide the population of supplier firms into two groups, depending
on whether the firm was founded before or after 1991. Similar to our approach, Klier &
McMillen investigate, whether company foundations occur close to different agents using
geographical coordinates and distances instead of regions. Hence, their paper builds the
starting point for our approach. However, we will go beyond their approach in three aspects:
MAUP
Although Klier & McMillen use geographic coordinates to locate their firms, their approach
is still affected by MAUP effects. On the one hand, even in conurbations, US zip-code areas
show a diameter of approximately 20 km. On the other hand, information on the independ-
ent variables is aggregated at an arbitrarily defined level. For instance, the authors model the
distance to other suppliers by counting the number of firms within a radius of 100 miles. In
contrast, our approach considers each single distance between the observed agents separate-
ly allowing for a clear reduction of MAUP.
Random benchmarks
3 firms founded before 1991

13
Section 4: Data
The construction of benchmarks is an important step for a logistic analysis because its re-
sults are very sensitive to a chosen benchmark. Klier & McMillen create their benchmark by
drawing five random zip-codes for each company foundation. However, Duranton & Over-
man (2005) argue that a purely stochastic pattern should not be used for a benchmark, as
industries cannot settle anywhere in a country. It is obvious that natural barriers (lakes, riv-
ers, mountains) or political restriction (nature reserves, residential areas) limit the location
choice of entrepreneurs (Duranton & Overman 2005:1085). Therefore, we will build ran-
dom samples of real company locations and use them as a benchmark.
Temporal aggregation
The last point refers to the temporal aspect in Klier & McMillen’s paper. As noted above,
the authors divide their period of investigation into two timeframes: One timeframe for the
period before 1990 and one for the period of 1991-2003. Thereby the authors gain two ex-
planatory variables: Firstly, firms that were founded before 1991. Secondly, social statistic
data, drawn from the 1990 U.S. census that can be seen as exogenous variables as the start-
ing point of their investigation is 1 year after the census (Klier & McMillen 2008: 251).
Hence, in their approach all that happens after 1990 is explained by all that was there in
1990. As the title of the paper suggests, we go beyond this and explain the location of each
company foundation by all factors that have been present at the date (at least month or year)
of this foundation.
4 Data
The central part of our dataset is built by the exact location (street, house number and post-
code) of all German MST-firms and research institutions. It was provided by the German-
based IVAM, an international association of companies and institutes in the field of micro
technology. The dataset included around 873 firms and 212 institutions that fulfill at least
one or more of the following prerequisites:
(former) members of the IVAM or another associations in the field of micro tech-
nology
firms that are listed in specific databases (e.g. www.mst-online.de)
participants of fairs or conferences that deal with micro technology
participants of public/federal projects covering micro technology
firms that are mentioned in trade journals
firms that are listed in the German Commercial Registry under the headword “mi-
cro”
For all firms and institutions the IVAM checked via the company’s homepage whether they
are really active in the MST-sector. Additionally, we double-checked the data with the

14
Section 4: Data
Germen Commercial Registry, in order to obtain the date of inception and to check whether
firms still exist or have relocated. If they relocated during the period of 1999 and 2007 we
included this change in our model. Finally, 861 MST-firms and 199 institutions were in-
cluded in the statistical analysis. We computed the easting and northing of the firms’ and
institutions’ exact location (street, house number and postcode) whereby we gain data that is
absolutely free of any spatial aggregation.
The patent data included all 3886 MST applications for the period of 1991 and 2008, pro-
vided by the Federal Ministry of Education and Science (BMBF). For every patent, the date
of submission and the zip-code of the owner were given. We computed the easting and
northing of all German zip-codes and assigned the coordinates to the patents.
As described in section 2.1, we consider the number of skilled workers to represent the
proximity to related industries. Together with the IVAM, we selected the most convincing
branches out of the WZ2003 classification, provided by the German federal office of statis-
tics:
Production of electronic devices
Production of medical devices and orthopedic appliances
(a) MST-firms (N=861) (b) benchmark-firms (N=4000)
Figure 3: Distribution of the MST-firms and the benchmark-firms in the area under investi-
gation
"
"
"
"
"
"
"
"
"
"
"
"
"
"
"
"
"
"
"
"
"
"
"
"
"
"
"
"
"
"
"
"
"
"
"
"
"
"
"
"
"
"
"
"
"
"
"
"
"
"
"
"
"
""
"
"
"
"
"
"
"
"
""
"
"
"
"
"
"
"
"
"
"
"
"
"
"
"
"
""
"
"
"
"
"
"
"
"
"
"
"
"
"
"
"
"
"
"
"
"
"
"
""
"
"
"
" "
"
"
"
"
"
"
"
"
"
"
"
"
"
"
""
"
"
"
"
"
"
"
"
"
"
" " "
"
"
""
"
"
""
""
"
"
"
"
"
""
"
"
"
"
"
""
"
"
"
"
""
""""
"
"
"""
"
"
"
"
"
"
"
""
""
"
" "
"
"
"
"
"
"
"
"
"
"
"
"
"
""
"
"
"
"
"
"
"
"
"
"
"
"
"
"
"
"
"
"
"
""
"
"
"
"
"
"
"
"
"
"
"
"
"
"
"
"
"
"
"
"
"
"
"
"
"
"
"
"
"
"
"
"
"
"
"
" ""
"
"
"
"
"
"
"
"
"
"
"
"
"
"
"
""
"
"
"
"
"
"
"
"
"
"
"
"
"
"
"
"
"
"
"
"
"
"
"
"
"
"
"
"
"
"
"
"
"
"
"
"
"
"""
"
"
"
"
"
""
"
"
"
"
""
"
"
"
"
"
"
"
"
"
"
"
"
""
"
"
"
"
"
"
"
"
"
"
"
"
"
"
"
"
"
"
"
"
"
"
"
"
"
"
"
"
"
"
""
"
"
"
"
""
"
"
"
"
"
"
"
"
"
"
"
"
"
"
"
"
"
"
"
"
"
""
"
"
"
"
"
"
"
"
"
"
"
"
"
"
"
"
"
"
"
"
"
"
"
" "
"
"
"
"
"
"
"
"
"
"
""
"
"
"
"
"
"
"
""
"
"
"
"
"
"
"
"
"
"
"
""
"
"
""
"
""""
"
"
""
"
"
"
""
"
"
""
"
""
"
"
"
"
"
"
"
"
"
"
"
"
"
"
"
"
"
"
"
"
"
"
"
"
"
""
"
"
"
"
"
"
"
"
"
"
""
"
"
"
"
" "
"
"
"
"
"
"
"
"
"
""
"
"
"
""
"
"
"
"
"
"
"
"
"
"
"
"
"
"
"
"
"
"
"
"
"
"
"
"
"
"
""
"
"
"
"
"
"
"
"
"
"
"
"
"
"
"
"
"
"
"
"
"
"
"
"
"
"
"
"
"
"
"
"
""
"
"
"
"
"
"
"
"
"
"
"
""
"
"
"
"
"
"
"
"
"
"
"
"
"
"
"
"
"
"
"
"
"
"
"
"
"
"
"
"
"
"
"
"
"
"
"
"
""
"
""
"
"
"
"
"
"
"
"
"
"
"
"
"
"
"
"
"
"
"
"
"
"
"
"
"
"
"
"
"
"
"
"
"
"
"
"
"
"
"
"
"
"
""
"""
"
"
"
" "
"
"
"
"
"
"
"
"
"
"
"
"
"
"
"
"
"
"
""
"
"
"
"
"
"
"
"
"
"
"
"
""
"
"
"
"
"
"
"
"
"
"
"
"
"
"
"
"
"
"
"
"
""
"
"
"
"
"
"
"
"
"
""
"
"
"
"
"
"
"
"
""
"
"
"
"
""
"
"
"
"
"
"
""
"
"
"
"
"
"
"
"
"
"
"
"
"
"
"
"
"
"
"
"
"
"
"
"
"
"
"
"
"
"
" "
" "
"
"
"
"
"
"
"
"
"
"
100 km100 km
" ""
"
"
"
"
"
"
"
"
"
"
"
"
"
"
"
"
"
"
"
"
"
"
"
""
"
""
"
"
"
"
"
"
""
""
"
"
"
"
"
"
"
"
"
"
"
"
"
"
"
"
"
""
"
"
"
"
"
"
"
"
"
"
"
"
"
"
"
"
"
"
"
"
"
"
"
"
"
"
"
"
"
"
"
"
"
"
"
"
""
"
"
"
"
"
"""
"
"
"
"
"
"
"
"
"
"
"
"
"
"
"
"
"
"
""
"
"
"
"
"
"
"
"
"
"
"
"
"
"
"
"
"
"
"
"
"
""
"
"
"
"
"
"
"
"
"""
"
"
"
"
""
"
"
"
"
"
"
""
"
"
"
"
"
"
"
"
"
"
"
"
"
"
"
"
"
"
"
"
"
"
"
""
"
"
"""
"
"
"
"
"
"
"
""
"
"
"
"
""
"
""
"
"
"
"
"
"
"
"
"
"
"
"
"
"
"
"
"
""
"
"
"
"
"
"
"
"
"
"
"
"
""
"
"
"
"
"
"
"
"
"
"
"
"
"
"
"
"
"
"
"
"
"
"
"
"
"
"
""
"
""
"
""
"
"
"
""
"
"
"
"
"
"
"
"
"
"
"
"
"
""
"
"
"
"
"
"
"
"
"
"
"
"
"
"
" "
"
"
"
"
"
"
"
"
"
"
"
"
"
"
"
"""
""""""
"
"
"
""
"
"
"
"
"
"
"
"
"
"
"
"
""
"
"
"
"
"
"
"
"
"
"
"
"
"
"
"
"
"
"
"
"
"
"
"
"
"
"
"
"
"
"
"
"
"
"
"
"
"
"
"
"
"
"
"
"
"
"" "
"
"
"
"
"
"
"
"
"
"
"
"
"
"
"
"
"
"
"
"
"
"
"
""
"
"
"
""
"
"
"
"
"
"
"
"
"
"
"
"
"
"
"
"
"
"
"
"
"
"
"
"
"
"
"
"
"
"
"
"
"
"
"
"
"
"
"
"
"
"
" "
"
"
"
"
"
"
"
"
"
"
"
"
"
"
""
""
"
"
"
"
"
"
"
"
"
"
"
"
"
"
"
"
"
"
"
"
"
"
"
"
"
"
"
"
"
"
"
"
"
"
"
"
"
"
"
"
"
"
"
"
"
"
"
"
"
"
"
"
"
"
"
"
"
"
" "
"
"
"
"
"
"
"
"
"
"
"
"
"
"
"
"
"
"
"
"
"
"
"
"
"
"
"
"
"
"
"
"
"
"
"
"
"
"
"
""
"
"
"
"
"
"
"
""
"
"
"
"
""
"
"
"
"
"
"
"
"
"
"
"
"
"
""
"
"
"
"
"
"
"
"
"
"
"
"
"
"
"
""
"
"
"
"
"
""""
"
"
"
"
""
"
"
""
"
"
"
"
"
"
"
"
"
"
""
"
"
"
"
"
"
"
"
"
"
"
"
"
"
"
"
"
"
"
"
"
"
"
"
"
"
"
"
"
"
"
"
"
"
"
"
"
" "
"
"
"
"
"
"
"
"
"
"
"
"
"
"
"
"
" "
"
"
"
""
"
"
"
"
"
"
"
"
"
"
"
""
"
"
"
"
"
"
"
" "
"
"
"
"
"
"
"
"
"
"
"
"
"
"
"
"
"
"
"
"
"
"
"
"
"
"
"
"
"
"
"
"
"
"
"
"
"
"
"
"
"
"
"
"
"
"
"
"
"
"
"
"
"
"
"
"
"
"
"
"
"
"
"
"
"
"
"
"
"
"
"
"
"
"
"
"
"
"
"
"
"
"
"
"
"
"
"
"
"
"
"
"
"
"
"
"
"
"
""
"
"
"
"
"
"
"
"
"
"
"
"
"
"
"
"""
"
"" "
"
" " "
"
"
"
"
"
"
"
"
"
"
"
"
"
"
"
"
"
"
"
"
"
"
""
""
"
"
"
"
"
"
""
"
"
"
"
"
"
"
"
"
"
"
"
"
"
"
"
"
"
"
"
""
"
"
"
"
"
"
"
"
"
""
"
"
"
"
"
"
"
"
"
"
"
"
"
"
"
" ""
"
"
"
""
"
"
"
"
""
"
"
"
"
"
"
"
"
"
"
"
"
"
"
"
"
""
""
"
"
"
" "
"
"
""
"
"
"
"
"
"
"
"""
"
"
"
"
"
"
""
"
"
"
"
"
""
"
"
"
"
"
"
"
"
"
"
"
"
"
"
"
"
"
"
""
"
"
"
"
"
"
"
"
""
"
"
"
""
"
"
"
"
"
"
" "
"
"
"
"
"
"
"
"
""
"
"
"
"
"
""
"
"
"
"
"
""
"
"
"
"
"
"
"
"
"
"
"
"
"
"
"
"
"
""
"
"
"
"
"
"
"
"
"
""
"
"
"
"
"
"
"
"
"
" " "
"
"
"
"
"
"
"
"
"
"
"
"
"
"
"
"
"
"
"
"
"
"
"
"
" "
"
"
"
"
"
"
"
"
"
"
"
"
"
"
"
"
"
"
"
"
"
"
""
"
"
""
"
"
"
"
"
"
"
"
"
"
"
"
"
"
"
"
"
"
"
""
"
"
"
"
"
"
"
"
"
"
"
"
"
"
"
"
"
"
"
"
"
"
"
"
"
"
"
"
"
"
"
"
"
"
""
"
"
"
"
"
"
"
"
"
"
"
"
"
"
"
"
"
"
"
"
"
"
"
"
"
"
"
"
"
"
"
"
"
"
"
"
"
"
"
"
"
"
"
"
"
""
""
"
"
"
"
"
"
"
"
"
"
"
"
""
"
"
"
"
"
"
"
"
"
"
"
"
"
"
"
"
""
"
"
"
"
"
"
"
""
"
""
"
"
"
"
"
""
"
"
"
"
"
"
"
"
"
"
"
"
"
"
"
"
"
"
"
"
""
"
"
"
"
"
"
"
"
"
"
"
"
"
""
"
"
"
"
"
"
"
"
""
"
"
"
"
"
"
"
"
"
"
"
""
"
"
"
"
"
"
"
"
"
"
"
"
"
"
"
"
"
"
"
"
"
"
"
"
"
"
"
"
"
"
"
"
"
"
"
"
"
"
""
"
"
"
"
"
"
"
"
"
"
"
"
"
"
"
"
"
"
"
"""
"
"
"
"
"
"
"
"
"
"
"
"
"
"
"
"
"
"
"
"
"
" "
"
"
"
"
"
"
" "
"
"
"
"
"
""
"
"
"
"
"
"
"
"
"
"
"
"
"
"
"
"
"
"
"
"
"
"
"
"
"
"
"
"
"
"
"
"
"
"
"
"
"
"
"
"
"
"
"
""
"
""
"
"
"
"
"
""
"
"
"
"
"
"
" "
"
"
"
"
"
"
"
"
"
"
"
"
"
"
"
"
"
"
"
"
"
""
"
"
"
"
" "
"
"
"
"
"
"
"
"
"
"
"
"
"
"
"
"
""
"
"
"
"
"
"
"
"
"
"
"
"
"
"
"
"
"
"
"
"
"
"
"
"
"
"
"
"
"
"
"
"
"
"
"
"
"
"
"
"
"
""
"
""
"
"
"
"
"
"
"
"
"
"
"
"
"
"
"
"
"
"
"
"
"
"
"
"
"
"
""
"
"
"
"
"
"
"
""
"
"
""
"
""
"
"
"
"
"
"
"
"
"
"
"
"
"
"
"
"
"
"
"
"
"
""
"
"
"
"
"
"
"
"
""
"
""
"
"
"
"
"
"
"
"
"
"
"
"
"
"
"
""
"
"
"
"
"
"
"
"
"
""
"
"
"
"
"
"
"
"
"
"
"
"
"
"
"
"
"
"
"
"
"
"
"
"
"
"
"
"
"
"
"
"
"
"
"
"
"
"
"
"
""
"
"
"
"
"
"
"
"
"
"
"""
"
"
"
"
"
"
""
"
"
"
"
"
"
"
"
"
"
"
"
""
"
"
"
"
"
"
"
""
"
"
"
"
"
"
"
"
"
"
"
"
"
"
"
"
"
"
"
"
"
""
"
"
"
"
"
"
"
"
"
"
"
"
"
""
"
"
"
"
"
""
"
""
"
"
"
"
"
"
"
"
"
"
"
"
"
"
"
"
"
"
""
"
"
"
"
"
"
"
"
"
"
"
"
"
"
"
"
"
"
"
"
"
"
"
"
"
"
"
"
"
"
"
"
"
"
"
"
"
"
"
"
"
"
"
"
"
"
"
"
"
"
"
"
"
"
"
"
"
"
"
"
"
"
"
"
"
"
"
"
"
"
"
"
"
"
"
"
"
"
"
"
"
"
""
"
"
"
"
"
"
"
"
"
"
"
"
"
"
"
""
"
"
"
"
"
"
"
"
"
"
"
"
"
"
"
"
"
"
"
"
"
"
"
""
"
" "
"
"
"
"
"
""
"
"
"
"
"
"
"
"
"
"
"
"
"
"
"
"
"
"
"
"
"
"
"
"
"
"
"
"
""
"
"
"
"
"
"
"
"
"
"
"
"
"
"
"
"
"
"
"
""
"
"
" "
"
"
"
"
"
"
""
"
"
" "
"
"
"
"
"
"
"
"
"
"
""
"
"
"
"
"""""
"
"
"
"
"
"
"
"
"
"
"
"
"
"
"
"
"
"
"
"
"
"
"
" "
"
""
"
"
"
"
"
"
"
"
"
"
"
"
"
"
"
"
"
"
"
"
"
"
"
"
"
"
""
"
"
"
"
"
"
"
"
"
"
"
"
""
"
"
"
"
"
"
"
"
"
"
"
"
"
"
"
" ""
"
"
"
"
"
"
"
"
"
"
"
"
"
"
"
"
""
"
"
"
"
"
"
"
" ""
"
"
"
""
"
"
"
"
"
""
"
"
"
"
"
"
"
"
"
"
"
"
"
"
""
"
"
"
"
"
"
"
"
"
"
"
"
"
"
"
""
"
"
"
"
"
"
"
"
"""
"""
"
"
""
"
"
"
"
"
"
"
"
"
"
"
"
"
"
"
"
"
"
"
"
"
"
"
"
"
"
"
"
"
"
"
"
"
"
"
"
"
"
"
"
"
"
"
"
"
"
"
""
"
""
"
"
"
"
"
"
"
"
"
"
"
"
"
"
""
"
"
"
"
"
" "
"
"
"
"
"
"
"
"
"
"
"
"
""
"
"
"
""
"
"
"
""
""
" ""
"
"
"
"
"
"
"
"
"
"
"
"
"
"
"
"
"
""
"
"
"
"
"
""
"
"
"
"
" "
"
"
"
"
"
"
"
"
""
"
"
"
"
"
"
"
"
"
"
"
"
"
"
"
"
"
"
"
"
"
"
"
"
"
""
"
"
"
"
""
"
"
"
"
"
"
"
"
"
"
"
"
"
"
" "
"
"
"
"
"
"
"
"
"
"
"
"
""
"
"
"
""
"
"
"
"
"
""
"
""
"
"
"
"
"
"
"
"
"
"
"
"
"
"
"
""
"
"
"
"
"
""
" "
"
"
"
"
"
"
"
"
"
"
"
"
"
"
"
"
"
"
"
"
"
"
"
"
"
"
"
"
"
"
"
"
"""""""
"
"
"
"
"
"
"
"
"
"
"
"
"
"
""
"
"
"
"
"
"
"
"
"
"
"
""
"
"
"
" "
"
"
"
"
"
"
"
"
"
"
"
"
"
"
"
"
"
"
"
"
"
"
""
"
"
"
"
"
"
"
"
"
"
"
"
"
"
"
"
"
"
"
"
"
"""
"
"
"
"
"
"
"
"
"
"
"
"
"
"
"
"
"
"
"
"
"
"
"
"
"
"
"
""
"
"
"
"
"
"
"
"
"
"
"
"
"
"
"
"
"
"
"
"
"
"
"
"
"
"
"
"
"
"
"
"
"
"
"
"
"
"
"
""
"
"
"
"
"
"
"
"
"
"
"
"
"
"
"
"
"
"
"
"
"
"
"
"
"
"
"
"
"
"
"
"
"
""
"
"
"
"
"
"
"
"
"
"
"
"
"
"
"
"
"
"
"
"
"
"
"
"
"
"
"
"
"
"
"
""
"
"
"
"
"
"
"
"
"
"
"
"
"
"
"
"
""
"
"
"
"
"
"
"
"
"
"
"
"
"
"
"
"
"
"
""
"
"
"
"
""
"
"
" "
"
"
"
"
"
"
"
""
"
"
"
"
"
"
"
"
"
"
"
"
""
"
"
"
"
"
""
"
"
"
"
"
"
"
"
"
"
"
"
"
"
"
"
"
"
"
""
""
"
"
"
"
"
"
"
"
"
"
"
"
"
"
"
"
"
"
""
"
"
"
"
"
"
"
"
""
"
"
" "
"
"
"
"
"""
"
"
"
"
"
"
" "
"
""
""
"
""
"
"
"
"
"
"
"
"
"
"
"
"
"
"
"
"
"
""
"
"
"
"
"
"
"
" "
"
"
"
"
"
"
"
"
"
"
"
"
"
"
"
"
"
"
"
"
"
"
"
"
"
""
"
"
"
"
"
"
"
"
"
"
"
"
"
"
"
"
"
"
"
"
"
"
""""
"
"
"
"
"
"
""
"
""
"
"
"
"
""
"
"
"
"
"
"
"
"
""
"
"
"
"
"
"
"
"
"
"
""
"
"
"
"
"
"
"
"
"
"
"
"
""
"
"
"
""
"
"
"
"
"
"
"
"
"
"
"
"
"
"
"
"
"
"
"
" "
"
"
"
"
"
"
"
"
"
"
"
"
"
"
"
"
"
"
""
"
"
"
"
"
"
"
""
"
"
"
"
"
"
"
"
"
"
"
"
"
"
"
"
"
"
"
"
"
"
" "
"
"
"
"
"
"
""
"
"
"
"
"
"
"
"
"
"
"
"
"
"
"
"
"
"
"
"
""
"
"
"
"
"
""
"
"
"
"
"
"
"
"
""
"
"
"
"
"
"
"
"
"
"
"
"
"
"
"
"
"
"
"
"
"
"
"
"
"
"
"
"
"
"
"
"
"
"
"
"
"
"
""
"
"
"
"
"
"
"
""
"
"
"
"
"
"
"
"
"
""
"
"
""
""
"
"
"
"
"
"
"
"
"
"
"
"
"
"
"
"
"
"
"
"
"
"
"
"
"
"
"
"
"
"
"
"
"
"
"
"
"
"
"
"
"
""
"
"
"
"
""
"
"
"
"
"
""
""
"
"
"
""
"
"
"
"
"
"
"
"
"
"
"
""
"
"
"
"
""
"
"
"
"
""
"
"
"
"
"
"
"
"
"
"
"
"
"
""
"
"
"
"
"
"
"
"
"
"
"
"
"
"
"
""
"
"
"
"
"
"
"
""
""
"
"
"
"
"
"
"
"
"
"
"
"
""
"
"
""
"
"
"
"
"
"
"
"
"
"
"
"
"
"
"
"
"
"
"
"
"
"
"
"
"
"
"
"
"
"
"
"
"
"
"
"
"
"
"
"
"
"
"
"
"
"
"
"""
"
"
"
"
"
"
"
"
""
"
"
"
"
"
"
"
"
"
"
"
""
"
"
"
"
"
"
"
"
"
"
"
"
"
"
"
"
"
"
"
"
"
"
"
"
"
"
"
"
"
"
"
""
"
"
"
"
"
"
"
"
"
"
"
"
"
" "
"
""
"
""
"
"
"
"
"
"
"
"
"
"
"
""
"
"
"
"
"
"
"
"
"
"
"
"
"
"
"
"
"
"
""
"
"
"
"
"
"
"
"
"
" "
"
"
""
"
"
"
"
"
"
"
""
"
"
"
"
"
"
"
""
"
"
"
"
""
"
"""
"
"
"
"
"
""
"
"
"
"
"
"
"
"
"
"
"
"
"
"
"
"
"
"
"
"
"
"
"
"
"
"
"
"
"
"
"
"
"
""
"
"
"
"
"
"
"
"
"
""
"
"
"
"
"
"
"
"
"
"
"
"
""
"
"
"
"
""
"
"
"
"
"
"
"
"
"
"
"
"
"
"
"
"
""
"
"
"
"
"
"
"
"
"
"
"
"
"
""
"
"
""
"
"
"
"
"
"
"
"
"
"
"
"
"
"
"
"
"
"
"
"
"
"
"
"
"
""
"
"
"
"
""
"
"
"
"
"
""
"
"
"
"
"
"
"
"
""
"
"
"
"
"
"
"
"
"
"
"
"
"
""""
""
"
"
"
"
"
"
"
"
"
"
"
"
"
"
"
"
"
"
"
"
"
"
"
"
"
"
"
"
"
"
"
"
"
"
"
"
"
"
"
"
"
"
"
"
"
"
"
"
"
"
"
"
"
"
"
"
""
"
"
"
"
"
"
"
"
"
"
"
"
"
"
"
"
"
"
"
"
"
"
"
"
"
"
"
"
"
"
""
"
"
"
"
"
"
"
"
"
"
"
"
"
"
"
"
"
"
"
"
"
"
"
"
"
"
"
""
"
"
"
""
"
"
"
"
100 km100 km

15
Section 5: A spatial-temporal investigation of company foundations
Production of measuring, check and navigation instruments
The data was available on a municipality level for the time period of 1998-2009. The 15,648
municipalities are the lowest aggregation level for Germany (average size 25.5 km2). Ana-
log to the zip codes we computed their centroid’s easting and northing. The availability of
employment data was the temporal limiting factor of our analysis. Thus we present results
for company foundations in the MST only for the time period of 1998-2009 (383 firms).
The construction of our benchmark was conducted as follows: For each investigated year,
we draw 1000 German manufacturing firms from the list of all manufacturing firms in the
Creditreforms’ MARKUS database (most comprehensive database on German firms) that
were founded in the respective year. Analogous to the MST-firms, we computed the easting
and northing of the firms’ exact location.
5 A spatial-temporal investigation of com-
pany foundations
After having presented our data, we can now take a closer look how to handle this large
amount of information. As the main part of our data is free of any spatial aggregation, we
cannot use standard spatial regression models that always require the comparison of regions.
Instead, we compare locations of company foundations in the MST industry with places of
foundations in other industries. The following section discusses in all details how this ap-
proach can be implemented. After this step, section 5.2 presents the empirical results for the
MST industry using our new distance based framework.
5.1 Methodological approach
Spatial approach
The mathematical concept of our new framework bases on building sums of inverted dis-
tances, as it has been proposed in Sorenson & Audia (2000), Stuart and Sorenson (2003) and
Scholl and Brenner (2012). For each firm, we compute cluster values, which are built by the
average inverted distances of a firm i to other agents in the area under investigation:
∑ ( )
(2)
where ( ) stands for the orthodromic distance in km from firm i to agent j. Obviously, the
sum on the right-hand side increases with the number of observations J. Therefore, an aver-
age is established to make values comparable. Because the term
makes the index inde-

16
Section 5: A spatial-temporal investigation of company foundations
pendent of the number of observations, we can include several cluster indices in one model
(e.g. the centrality to other firms or research institutions).
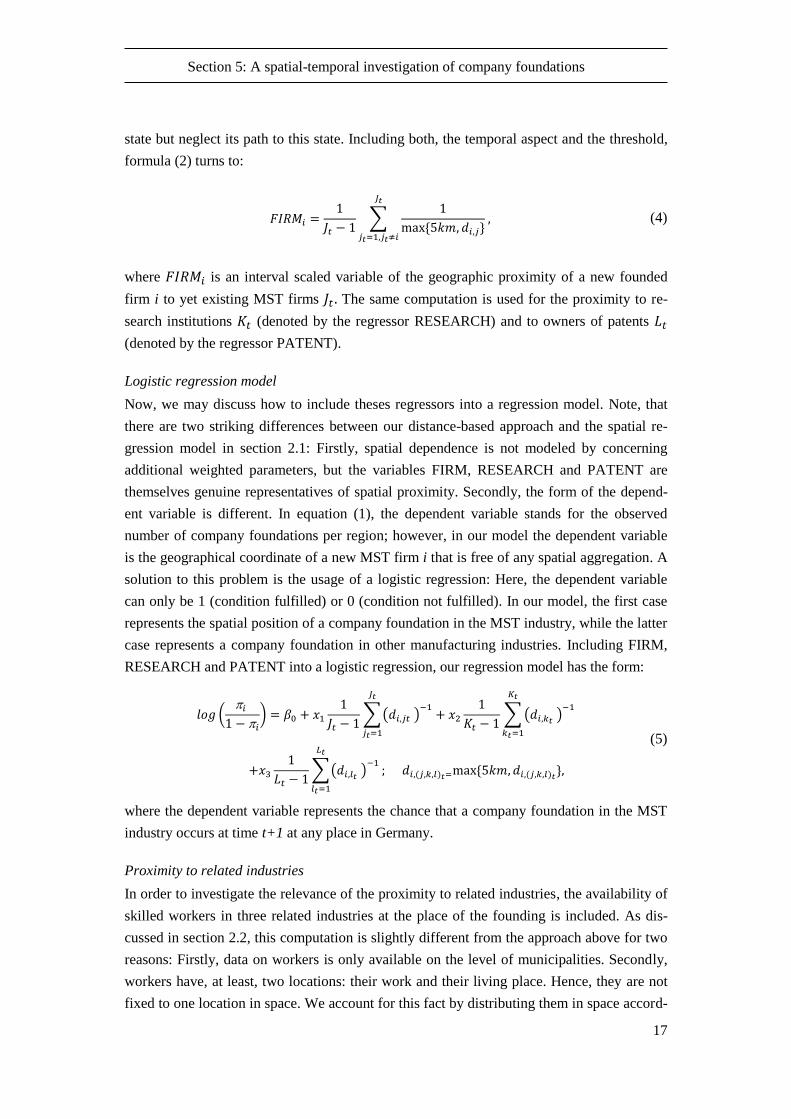
As an example, consider the new MST firm A, three existing MST-firms B-D and two re-
search institutions R1 and R2 (see Figure 4). According to formula (2), the cluster value of
firm A to other firms is:
(
) [
] (3)
while the cluster value to research institutions is 0.096 [
].
Using inverted distances ensures that only close objects have a significant influence on a
firm’s cluster value as the inverted distance to remote agents converges to zero. However,
inverting distances lead to problems when very short distances occur. Consider a firm E
located in the same building as firm A. Then the foundation of A would mainly be explained
by the distance to E as their inverted distance ( )
to each other is infinite. In order to
deal adequately with small distances, we need a threshold that groups such values. In our
empirical work, we tested three thresholds4 from which the 5km threshold performed best.
We suggest that the choice of the threshold should always depend on the object of research.
In our example, a 5 km threshold is a reasonable choice because the costs and ability for
communication and interaction between the observed actors should not differ that much
between 0 and 5 km. Furthermore, the same threshold was used by Kosfeld et al. (2011) in a
similar distanced-based investigation (Kosfeld et al. 2011: 320).
Temporal approach
A temporal component is included in the model in such way that the founding of a firm i in
period t+1 is only described by the distance to other firms that at least exist since period t.
In mathematical terms we use a Markov chain because we only regard a system’s actual
4 We tested a 0 km, 5 km and 10 km threshold
Figure 4: Exemplary distribution of firms and research institutions
17
Section 5: A spatial-temporal investigation of company foundations
state but neglect its path to this state. Including both, the temporal aspect and the threshold,
formula (2) turns to:
∑
(4)
where is an interval scaled variable of the geographic proximity of a new founded
firm i to yet existing MST firms The same computation is used for the proximity to re-
search institutions (denoted by the regressor RESEARCH) and to owners of patents
(denoted by the regressor PATENT).
Logistic regression model
Now, we may discuss how to include theses regressors into a regression model. Note, that
there are two striking differences between our distance-based approach and the spatial re-
gression model in section 2.1: Firstly, spatial dependence is not modeled by concerning
additional weighted parameters, but the variables FIRM, RESEARCH and PATENT are
themselves genuine representatives of spatial proximity. Secondly, the form of the depend-
ent variable is different. In equation (1), the dependent variable stands for the observed
number of company foundations per region; however, in our model the dependent variable
is the geographical coordinate of a new MST firm i that is free of any spatial aggregation. A
solution to this problem is the usage of a logistic regression: Here, the dependent variable
can only be 1 (condition fulfilled) or 0 (condition not fulfilled). In our model, the first case
represents the spatial position of a company foundation in the MST industry, while the latter
case represents a company foundation in other manufacturing industries. Including FIRM,
RESEARCH and PATENT into a logistic regression, our regression model has the form:
(
)
∑( )
∑(
)
∑( )
(5)
where the dependent variable represents the chance that a company foundation in the MST
industry occurs at time t+1 at any place in Germany.
Proximity to related industries
In order to investigate the relevance of the proximity to related industries, the availability of
skilled workers in three related industries at the place of the founding is included. As dis-
cussed in section 2.2, this computation is slightly different from the approach above for two
reasons: Firstly, data on workers is only available on the level of municipalities. Secondly,
workers have, at least, two locations: their work and their living place. Hence, they are not
fixed to one location in space. We account for this fact by distributing them in space accord-

18
Section 5: A spatial-temporal investigation of company foundations
ing to commuting distances. Form the German micro census 2004 we obtained the commut-
ing probabilities of German employees in km and computed the best fitting commuting
function:
(
) (6)
By means of formula (6), a proxy for the hypothetical number of available skilled workers at
the municipality of firm i at time t is computed. As an example, consider municipality M
that has 100 skilled workers. Municipality N has 45 workers and is located at a10 km dis-
tance from M. Hence, the number of available workers for firm i located in municipality M
is:
(7)
In comparison to Klier & McMillen's approach we do not only consider the municipality of
a firm’s location but all 15648 German municipalities are included to compute . This
allows a clear reduction of the MAUP but in contrast to the other variables, is still a
spatially aggregated variable and depends to the size of the municipality and its’ location.
For example values for municipalities close to borders are systematically underestimated.
To deal with this problem, we normalize the value through dividing it by the summed prox-
imity values to all municipalities given by function f. This value depends highly on the
number of close municipalities. Thus, the final formulation for the hypothetical number of
available skilled workers at the municipality i is:
∑
∑
(8)
where CL stands for the three considered industries. Hence, we compute three variables for
the related industries ELEC (Production of electronic devices), MED (Production of medical
devices and orthopedic appliances) and NAVI (Production of measuring, check and naviga-
tion instruments).
East-west dummy and complete model
The last aspect of the regression model is the dummy variable EAST that tests for the loca-
tion of a firm in Eastern Germany. This variable controls for the still existing notable differ-
ences in the economic structures between the former Federal Republic of Germany and the
former German Democratic Republic. Including all presented variables, formula (9) de-
scribes the probability of a company foundation in the MST industry at the time period t+1
by the spatial proximity to firms, research institutions and patent owners, the presence of
three other industries and its location in Eastern or Western Germany.

19
Section 5: A spatial-temporal investigation of company foundations
(
)
∑( )
∑(
)
∑(
)
(9)
Benchmarking with the overall founding activity
In order to estimate the regressors of a logistic regression, the observance of both possible
cases (condition fulfilled, condition not fulfilled) is mandatory. Thus, we need to compute
formula (9) also for the benchmark firms. For each observed year,1000 manufacturing firms
that were founded in the same year are selected from the MARKUS-database. For the whole
time period these are 12,000 firms. This procedure concerns possible global temporal shifts
in the spatial pattern of company foundations in the German manufacturing sector.
Note, that in a logistic regression, the parameters represent the factor of how the chances
multiply if the independent variable grows by one (expressed by the odds-ratio). Here we
have to consider that with exception of EAST all variables are interval-scaled and base on
different value ranges. In order to obtain a better comparability, their coefficients were nor-
malized.
Variable Description
FIRM Cluster index to other MST firms.
RESEARCH Cluster index to relevant research institutions.
PATENT Cluster index to patent owners.
EAST Localization of a firm in Eastern Germany (dummy variable).
ELEC Number of hypothetical available skilled workers from the production of
electronic devices.
MED Number of hypothetical available skilled workers from the production of
medical devices and orthopedic appliances.
NAVI Number of hypothetical available skilled workers from the production of
measuring, check and navigation instruments.
Table 1: Listing of included variables
5.2 Empirical results for the German MST-industry
The main aim of this paper is to study the local factors that influence the founding of new
MST firms. We conduct the study for the MST-industry here, while other industries might
be studied in a similar way in the future. The examination of the MST-industry is divided
into two parts: first the MST-industry is studied for the time period of 1998 to 2009; then
three successive time periods (1998-2001, 2002-2005 and 2006-2009) are studied separately
in order to analyze changes in the relevance of the various factors.

20
Section 5: A spatial-temporal investigation of company foundations
The analysis of the whole time period, 1998-2009, shows that three local factors influence
the start-up activity in the MST-industry positively (see Table 2): the proximity to existing
firms (FIRM), the proximity to public research (RESEARCH) and the number of employees
in the surrounding who work in the industry of measuring, control and navigation instru-
ments (NAVI).
Variable Estimate Odds ratio Sig. R²
FIRM .502*** 1.651 .000
.142
RESEARCH .464*** 1.590 .000
PATENT -.021 .979 .690
EAST .182 1.200 .436
ELEC .166 1.180 .409
MED -.699*** .497 .000
NAVI .321* 1.378 .037
Constant -6.167*** .002 .000
Table 2: Regression results for the total time period 1998-2009 (normalized values).
The proximity to existing MST firms and relevant scientific institutions has the highest posi-
tive influence on the chance that a MST firm is founded. This confirms our central theoreti-
cal expectation that most founders of MST firms originate from existing MST firms or from
scientific institutions and found their own company in proximity to their previous working
place. A comparison of the odds ratios suggests that both factors, existing MST firms and
scientific institutions play a similar role.
Surprisingly, the distance to workers in the field of MED (Production of medical devices
and orthopedic appliances) shows a highly significant negative relationship with the start-up
activity. We conclude from this that firms producing medical devices and orthopedic appli-
ances are no relevant source for founders of MST firms. Beyond this, places with many such
firms even seem to have characteristics that cause a lower start-up activity in the MST in-
dustry. A potential explanation is the fact that the production of medical devices and ortho-
pedic appliances is quite concentrated in Germany in a few less central places, such as Tut-
tlingen and Jena.
Considering all other industries that we included in the analysis (ELEC, MED and NAVI),
we obtain a clear picture: Only the presence of industry NAVI (measuring, control and nav-
igation instruments) has a positive relationship with the start-up activity in the MST indus-
try. Furthermore, this relationship is less significant and has a lower odds ratio than the rela-
tionships of the variables FIRM and RESEARCH. From a geographic perspective the MST
industry seems not to develop out of an already existing industry. However, the industry
NAVI seems to have, at least, some influence on the location of the MST industry.
Interestingly, we do not find a significant relationship between the local patent activity in

21
Section 5: A spatial-temporal investigation of company foundations
MST and the respective start-up activity. Locations that are characterized by a high patent
activity do not show higher numbers of company foundations. From a geographic perspec-
tive, the generation of innovations that are patented seems not to be a prerequisite for found-
ing companies in the MST industry.
The dummy variable EAST (a firm is located in the newly-formed German states) has no
significant relationship to company foundation. Hence, there seems to be no clear difference
in the MST start-up activity between the old and new German states.
5.3 Temporal changes in the relevance of local factors
Until now, we have conduced one regression for the whole period of investigation. In order
to study the impact of the industrial life-cycle on the relevance of the various local factors,
we separate the period into three subintervals and perform separate regressions for each
interval (Table 3).
Time period Variable Regressor Odds ratio Sig. R²
1998-2001
FIRM .465*** 1.591 .000
.173
RESEARCH .525*** 1.691 .000
PATENT .100 1.106 .261
EAST .400 1.491 .062
ELEC .216** 1.242 .001
MED -.425* .653 .022
NAVI .111 1.117 .529
Constant -6.142*** .002 .000
2002-2005
FIRM .488*** 1.629 .000
.142
RESEARCH .459*** 1.582 .000
PATENT .038 1.038 .690
EAST .171 1.187 .436
ELEC .067 1.069 .409
MED -.692*** .501 .000
NAVI .337* 1.400 .037
Constant -5.909*** .003 .000
2006-2009
FIRM .752*** 2.122 .000
.153
RESEARCH .482*** 1.619 .000
PATENT -.144 .866 .348
EAST -.944 .389 .059
ELEC .090 1.094 .536
MED -1.035** .355 .002
NAVI .288 1.334 .213
Constant -7.305*** .001 .000
Table 3: Regression results for the three time periods (normalized values).

22
Section 5: A spatial-temporal investigation of company foundations
FIRM and RESEARCH have the highest positive influence on company foundation in all
three periods. Hence, their influence is dominant and permanent. However, while the impact
of RESEARCH slightly decreases, the importance of proximity to other MST firms (ex-
pressed by the odds ratio for variable FIRM) grows constantly. This confirms the expecta-
tions that are formulated at the end of section 2.1. The more the MST industry is estab-
lished, the more the locations of new firms in this industry are determined by the locations
of the firms that already exist. This implies self-augmenting processes in company founda-
tion that are in line with the arguments on cluster formation by Klepper (2006) and Brenner
(2004). It also supports the idea that at the beginning of an industry the location of public
research is the dominant geographic factor, while at later stages the industry becomes more
self-contained from a geographic perspective. This might be due to a shift from tacit to ex-
plicit knowledge in the industry’s life-cycle.
While we do not observe any significant changes for the variables PATENT and EAST,
there are changes in the relevance of the other considered industries. We find the negative
relationship between workers in the industry MED (medical devices and orthopedic appli-
ances) in all three periods, so that the above discussed regional characteristics seem to be
constant in all phases. More interesting are the varying results for the other two industries,
ELEC and NAVI. Both show a significantly positive relationship with MST start-ups in one
of the three time periods: ELEC in the first time period and NAVI in the second time period.
In the third time period none of the considered industries shows a significant positive rela-
tionship. This supports the above finding that the MST industry has become more self-
contained in the third time period.
Instead, in the first two time periods it is influenced by the location of other industries, at
least to some extent. In the first time period the electronic devices industry matters, while in
the second time period the industry producing measurement, control and navigation instru-
ments matters. We might conclude that part of the founders originate from these industries
in the early stage of the industrial life-cycle of the MST industry or that spillover from other
industries are crucial for product innovation. This supports the argument that new industries
often develop out of existing industries, so that their spatial distribution is influenced by the
location of these already existing industries. Only later in their development - at later stages
of their industrial life-cycle - the spatial distribution becomes less dependent on factors out-
side of the industry, nevertheless still depending on the initial spatial development, which
was influenced by other factors.

23
Section 6: Conclusion
6 Conclusion
The aim of our paper was twofold: Firstly, we have investigated spatial dependencies of
company foundations in the German MST industry and their change over time. The results
have revealed some interesting findings that stand in line with well-established theories:
Spatial proximity to other MST firms and to relevant research institutions has a clear posi-
tive influence on where a new firm is founded. This might be due to positive local spillover
or to spinoffs from firms or research institutions. While this confirms that MST-firms de-
pend on a high local innovation capacity, the proximity to owners of patents and to qualified
workers in related industries has little or even a negative influence.
Furthermore, the influence of the different actors is not constant over time but evolves with
the industry’s life cycle. The increasing importance of spatial proximity to firms stands in
line with the self-augmenting process theory of Brenner (2004) while the parallel decreasing
importance of proximity to research institutions suggests a shift from tacit to explicit
knowledge. The analysis shows that the MST industry becomes more self-contained and
that proximity to related industries is of decreasing importance.
The second aim of the paper was the introduction of a new distance based framework for a
logistic regression. This framework enables the usage of micro geographic data that is free
of any spatial aggregation but also dummy variables and aggregated data can be included. A
temporal component was integrated by means of a Markov chain so that our model allows
both, a micro spatial and a micro temporal analysis. The model detects spatial dependencies
on a firm level instead on an aggregated regional level. Furthermore, results are bench-
marked with the overall distribution of German manufacturing firms.
Despite the interesting results, the global fit of the model is quite low. Primarily, this is due
to the benchmarking with real company sites of German manufacturing firms. On the other
hand it is reasonable to assume that the complexity of spatial patterns of company founda-
tions cannot be fully described by means of seven variables. Thus, a starting point for fur-
ther research might be the integration of additional distance based variables.

24
Section 7: References
7 References
Acs, Zoltan J.; Anselin, Luc; Varga, Attila (2002): Patents and innovation counts as
measures of regional production of new knowledge. In: Research Policy 31: 1069–
1085.
Anselin, Luc: (2010): Thirty years of spatial econometrics. In: Papers in Regional Science
89 (1): 3-25.
Audretsch, David B.; Lehmann, Erik E.; Warning, Susanne (2005): University spillovers
and new firm location. In: Research Policy 34 (7): 1113-1122.
Audretsch, David B; Feldman Maryann P. (1996): Innovative Clusters and the Industry Life
Cycle. In: Review of Industrial Organization 11: 253–273.
BMBF (2002): Spinoff-Gündungen aus der öffentlichen Forschung in Deutschland.
http://www.exist.de/imperia/md/content/studien/16_zew_studie_spinoff_gruendungen
.pdf (in German only).
Brenner, Thomas (2004): Local Industrial Clusters: Existence, Emergence, and Evolution.
London: Routledge..
Brenner, Thomas; Mühlig, André (2012): Factors and Mechanisms Causing the Emergence
of Local Industrial Clusters- A Meta-Study of 159 Cases. In: Regional Studies, elec-
tronic pre-publication.
Caniëls, Marjolein C. J. (2000): Knowledge Spillovers and Economic Growth: Regional
Growth Differentials Across Europe, Cheltenham, Northhampton.
Dumais, Guy; Ellison, Glen; Glaeser, Edward L. (2002): Geographic Concentration As A
Dynamic Process. In: Review of Economics and Statistics, 84, 193-204.
Duranton, Gilles; Overman, Henry G. (2005): Testing for Localization Using Micro-
Geographic Data. In: Review of Economic Studies 72: 1077–1106.
Gort, Michael; Klepper, Steven (1982): Time Paths in the Diffusion of Product Innovations.
In: The Economic Journal 92 (367):630-653.
IVAM-Research (2006): Gründungsmonitor Mikro-/Nanotechnik 2006. Erfolgsfaktoren für
Mikro- und Nanotechnik Start-ups in Deutschland (in German).
Jaffe, Adam B; Trajtenberg, Manuel; Henderson, Rebecca (1993): Geographic Localization
of Knowledge Spillovers as Evidenced by Patent Citations. In: The Quarterly Journal
of Economics, MIT Press, 108(3):577-98.
Klepper, Steven (1996): Entry, exit, growth, and innovation over the product life cycle. In:
American Economic Review 86 (03): 562-83.
Klepper, Steven (2006): The Evolution of Geographic Structure in New Industries. In: Re-

25
Section 7: References
vue de L'OFCE 97: 135-158.
Klepper, Steven; Buenstorf, Guido (2009): Heritage and Agglomeration: The Akron Tyre
Cluster Revisited. In: The Economic Journal 119: 705-733.
Klier, Thomas; McMillen, Daniel P. (2008): Evolving Agglomeration in the U.S. Auto Sup-
plier Industry. In: Journal of Regional Science 48 (1): 245–267.
Kosfeld, Reinhold; Eckey, Hans-Friedrich; Lauridsen, Jørgen (2011): Spatial point pattern
analysis and industry concentration. In: The Annals of Regional Science 47:311–328.
Marcon, Eric; Puech, Florence (2010): Measures of the geographic concentration of indus-
tries: improving distance-based methods. In: Journal of Economic Geography 10 (5):
745-762.
Miller, Harvey J. (2010): The data avalanche is here. Shouldn’t we be digging? In: Journal
of Regional Science 50 (1): 181–201.
Neffke, Frank; Henning, Martin Svensson; Boschma, Ron; Lundquist, Karl-Johan; Olander,
Lars-Olof (2008): Who Needs Agglomeration? Varying Agglomeration Externalities
and the Industry Life Cycle. In: Papers in Evolutionary Economic Geography
(08.08):1-34
Openshaw, S. (1984): The modifiable areal unit problem. In: Concepts and Techniques in
Modern Geography 38.
Porter, Michael (1998): Clusters and the New Economics of Competition. In: Harvard Busi-
ness Review:77-90.
Schmude, Jürgen (2003): Standortwahl und Netzwerke von Unternehmensgründern. In
Dowling, Michael; Drumm, Hans Jürgen (Hrsg.):Gründungsmanagement: Vom er-
folgreichen Unternehmensstart zu dauerhaftem Wachstum: 291-304 (in German).
Scholl, Tobias; Brenner, Thomas (2012): Detecting Spatial Clustering Using a Firm‐Level
Cluster Index. In: Working Papers on Innovation and Space 02.12: 1-29
Sorenson, Olav; Audia, Pino G. (2000): The Social Structure of Entrepreneurial Activity:
Geographic Concentration of Footwear Production in the United States, 1940–1989.
In: The American Journal of Sociology 106 (2): 424-462.
Stuart, Toby; Sorenson, Olav (2003):The geography of opportunity: spatial heterogeneity in
founding rates and the performance of biotechnology firms. In: Research Policy 32:
229–253.