evolving suburban form: dispersion or recentralization?
TRANSCRIPT
Urban Morphology (2012) 16(2), 101-119 © International Seminar on Urban Form, 2012 ISSN 1027-4278
Evolving suburban form: dispersion or recentralization?
Pierre FilionSchool of Planning, University of Waterloo, Waterloo, Ontario, N2L 3G1,
Canada. E-mail: [email protected]
Revised version received 5 July 2012
Abstract. Transformations in both the approach to suburban growthexpressed in planning documents and the reality of suburban development areexamined. The North American suburban model, characterized by nearuniversal reliance on the automobile, abundant land consumption, rigorousfunctional specialization and a dispersal of employment, retail and services,was pieced together between the late 1940s and the early 1960s. While plansfrom this period concentrated on the infrastructure and regulatoryfundamentals of this emerging model, subsequent plans expressed growingdisenchantment with this form of development, culminating in the formulationof a new vision of the suburb that breaks with the early post-war model.Examination of a Toronto suburban transect, with layers of development datingfrom the late 1940s to the present, reveals a mismatch between the profoundsuburban transformations proposed in plans and actual suburban form. Thepaper concludes with an assessment of the relative importance of land-useinertia and change. The possibility of an intensified, recentralized suburb thatis less automobile dependent is considered.
Key Words: post-war plans, suburbs, street patterns, land use, retailing,housing, Toronto
The building blocks of the North Americansuburban model were devised in a relativelyshort period from the late 1940s to the early1960s. Across the continent suburbs took alow-density and fully automobile-orientedform, marked by rigid functional segregationand a dispersal of employment, retailing andinstitutions. The paper investigates theprevalence of this pattern of suburban develop-ment in the face of changing economic andsocial circumstances and mounting calls byplanners for replacement of the early post-warsuburban model.
The object of study is a transect of Torontosuburban development that incorporates theformer municipality of Scarborough and mostof the present municipality of Markham,containing features of suburban development
from the late 1940s to the present. The focusis on the evolution of the content of planningdocuments and the actual form of suburbansectors over the past 65 years. The paperhypothesizes the existence from the late 1940sof three distinct periods regarding planningattitudes towards suburban development andplanning interventions in suburban areas. Thefirst period consists of the formulation andimplementation of the early post-war suburbanmodel. The second is shaped by the rise ofcriticism of this model and efforts to correct itsmore problematic aspects. Finally, the thirdperiod is marked by the emergence of analternative suburban model. The paperexamines the extent to which plans pertainingto Scarborough and Markham and theevolution of land use in these two jurisdictions

102 Evolving suburban form
conform to this pattern. The findings suggestagreement between the content of the plansand the hypothesized sequence. However, theactual evolution of suburban form has beendifferent: the fundamental features of thesuburb devised and adopted over the 15-20years following the Second World War haveremained and still shape suburban form.
The early post-war suburban model and itscriticism
A new form of development in the early yearsfollowing the Second World War quickly setthe norm for suburban growth. Affecting avariety of aspects of development, it was amarked break from previous urban patterns(Fishman, 1987). The entrenchment of thissuburban model was aided by post-war societaltrends and the rise of a transportation-land usedynamic based on near universal reliance onthe car. First, the formulation and actual-ization of the early post-war suburban modelwas driven by a widespread desire forrelaxation of the space constraints of trad-itional urban settings and, following severerestrictions during the Great Depression andthe Second World War, a pent-up appetite forconsumer goods (Aglietta, 1979; Silk, 1976).Demand for new housing burgeoned ashousehold formation and birth rates peaked.There was pressure for development standard-ization and replication: two features of theearly post-war suburban model (Checkoway,1980; Gottdiener, 1977; Knox, 2008, pp. 25-30).
The emergence of a new urban form wasfurther aided by reliance on Keynesian stimuliand a period of generally healthy public sectorbudgets. Conditions were thus favourable tothe building of elaborate infrastructures,notably expressways and arterials, and toprogrammes encouraging home ownership(Hayden, 2006; Wolfe, 1994). Suburbandevelopment, portrayed as the ‘spatial fix’ ofFordism, fuelled consumer demand, thusmoderating economic downturns (Bacher,1993; Checkoway, 1980; Harvey, 1985; Knox,2008, pp. 25-7).
It was primarily changes in accessibilitypatterns resulting from growing reliance on theautomobile, along with the need for all aspectsof urban development to accommodateincreasing numbers of cars, that account forthe radical break in urban development.Reduced accessibility gradients encouragedmore consumption of space (Brown et al.,2009; Friedman, 2002, p. 30; Institute ofTraffic Engineers, 1965; Southworth and Ben-Joseph, 1997). Enhanced mobility caused thephysical distance to lose much of its signifi-cance, which made it possible to emphasizeother locational considerations such astranquility and a taste for homogeneity(Webber, 1964, p. 109). Improved accessfostered mono-functional zones, inter-connected mainly by car journeys. It waspossible for structuring activities (employ-ment, retailing and services) to opt for avariety of locations with good highway orarterial connections; hence their dispersionthroughout the suburban landscape. Disper-sion was seen as the opposite of central-ization, a defining feature of previous urbanforms. The suburb was organized by thesuper-grid (the outcome of regularly spacedarterials) and resulting super-blocks, as well asby strict zoning. Meanwhile, thanks toautomobile-induced accessibility and thecapacity of super-blocks to insulate land usesfrom each other, any given location couldtheoretically be zoned for any activity (Dear,2000; Dear and Flusty, 2002; Knox, 1992, p.207; Lewis, 1983; Rowe, 1991).
Favourable circumstances associated withthe original formulation and materialization ofthe early post-war suburban model did not last.Criticism of the suburb was fanned byawareness of the disadvantages of this form ofdevelopment as it came to represent an everlarger share of metropolitan North America(Flint, 2006). An urban form conceived at atime of cheap energy was vulnerable to risingoil prices (Newman et al., 2009). Closelyrelated to energy preoccupations was mountingenvironmental awareness, first concerning airquality and, more recently, contributions togreenhouse gases. From the mid-1990s theenvironmental movement coalesced around the

Evolving suburban form 103
sustainable development concept, whichinspired visions of higher-density cities withmuch reduced reliance on the automobile(Knox, 2008, pp. 32-5; Myers and Gearin,2001; Speir and Stephenson, 2002). Arecentralization of activities in mixed-usenodes and a tight co-ordination between landuse and public transit development was calledfor (Moudon and Hess, 2000).
As the traditional family, the markettypically associated with suburban develop-ment, ceased to be the norm, the societalcontext deviated from the one that prevailedwhen the early post-war suburban model wasfirst framed and adopted (Haugen et al., 2010).In addition, the public sector lost some of itscapacity to engage in important infrastructureexpenditure, especially that needed to abatetraffic congestion, essential to the functioningof suburbs (Mauro, 2011). Finally, there wasa growing view that rising congestion wascausing a deterioration in the suburban qualityof life, and studies were linking obesity and itshealth consequences to the sedentary suburbanlifestyle (Frank et al., 2003).
The question is then whether or not thesechanging circumstances are mirrored inplanning documents and actual suburban form.Did suburban planning and development adaptto these societal changes, or has it remainedimpervious to them? Can both plan-makingand actual suburban development besegmented, as we have postulated, into: (1) theformulation and actualization of the early post-war suburban model; (2) critiques of andcorrections to this model; (3) the emergence ofan alternative vision of suburban development.
Case study and method
The present study focuses on a transect ofsuburban Toronto running northwards fromLake Ontario to the edge of the Markhamurbanized perimeter. It covers Scarborough inits entirety and most of Markham, that is, thoseparts of the municipality that are alignedbroadly with the boundaries of Scarborough(Figure 1). The population of the 292 km2
study area was 807 382 in 2006 (Statistics
Canada, 2007). The transect is well suited toour object of study, for growth in this areabegan in its southern portions during the earlypost-war years and spread northward overtime. Easternmost parts of Scarborough werealso the object of more recent urbanization.
During its period of developmentScarborough shared planning responsibilitieswith Metro Toronto, a regional government inplace from 1954 to 1997. After this Sca-rborough was amalgamated into the new Cityof Toronto with the other municipalities thatmade up Metro Toronto. Although MetroToronto provided public transit services toScarborough (primarily bus routes, but alsothree subway stations and one light rail transitline) and assured the presence of pockets ofhigh residential density, Scarborough mostlyconforms to the defining features of the typicalpost-war North American suburb: automobilereliance, specialized land use, dispersion andlow overall density.
From the early 1970s to the present,Markham has been administered by a regional(York Region) and a local government. Thedevelopment of Markham has taken place overtwo distinct periods from a planningperspective. From the early 1970s to the early1990s it adhered to conventional post-warsuburban planning norms but subsequently itsmunicipal administration has become apromoter of New Urbanism planningprinciples.
The remainder of this paper is divided intotwo parts, both of which examine changes overthe last 65 years. The first part consists of asurvey of plans pertaining to the two suburbanmunicipalities, concentrating on the successionof suburban planning models in these plans.To identify changes in suburban form, thesecond part concentrates on street layouts andthe distribution of activities within thetransect. It also examines the evolution of fivemajor types of land use that together accountfor much of the transect’s surface: residentialareas, retailing, workplaces, public institutionsand green space (Table 1). The focus is onchanges affecting the built environment overtime in order to establish whether eachobserved variable has followed the trends set

104 Evolving suburban form
in motion in the 1950s and early 1960s, orwhether there is evidence of departure fromthe early post-war suburban planning model.
To facilitate a longitudinal perspective onthe morphological features under consider-ation, the transect is divided into three sectors,each of which corresponds roughly to adistinct period of development. Sector Aincludes the southern part of Scarborough(from Lake Ontario to Highway 401); Sector Bcomprises the remainder of Scarborough, thatis, its portion located between Highway 401and Steeles Avenue (the municipal borderbetween Scarborough, now the City ofToronto, and Markham); and Sector C consistsof the urbanized portion of Markham alignedwith the transect (Figure 2). Table 2 shows thepercentage of housing units built in each of thethree sectors in three periods.
Changing planning objectives
The first period of plan making, the 1950s and1960s, was devoted to the formulation of the
suburban model. Zoning and building codesredefined all built forms according to therequirements of near universal automobilereliance and suburban development wasstructured by the super-grid, which providedmeans for efficient automobile circulationwhile sheltering low-density residential areasfrom heavy traffic. Another planning inno-vation was the segmentation of suburban spaceinto large mono-functional zones, generallydelineated by the super-grid/super-blockstructure (Township of Markham PlanningBoard, 1964, p. 10; Township of Scarborough,1957, pp. 3, 8).
As expected, plans from this period pro-posed infrastructures and regulations essentialto the implementation of the early post-warsuburban model. For example, they defineddifferent categories of retailing, all adapted tonear universal car use (neighbourhood andcommunity shopping, major business sub-centres, highway commercial uses), andproposed locations for these facilities that tookadvantage of new suburban accessibilitypatterns (Borough of Scarborough Planning
Figure 1. Study area within the extended Toronto region: residential density.

Evolving suburban form 105
Table 1. Classification and measurement of land uses
Object of study Method
Street pattern and land Identification of street layouts and activity distribution within super-blocks.use distribution Classification of super-blocks into categories and according to the three
sectors.
Residential density Population per km2 in residential portions of the three sectors (exclusive of non-residential uses such as retailing, institutions and arterial roads).Difference in housing type distribution in the three sectors.Changes in residential density in four sample detached-housing neighbourhoods.
Retail configurations Observations in each sector of different configurations as a proportion of allretailing.Ratio of surface parking area to building footprint in each sector.Total retail area (building footprint and surface parking) per capita for eachconfiguration in each sector.
Workplaces Nature of the layout and percentage of total space occupied by the footprintof buildings in sample employment areas in each sector.Proportion of urbanized land in each sector occupied by employment areas.Office buildings with 10 000 m2 or more in each sector: number of buildings andtotal floor space within this category of buildings.
Public institutions Observation of the location of schools.Footprint of schools: number of schools relative to the surface of residentialareas and population in each sector.
Green space Percentage of developed areas within each sector devoted to different categoriesof green space (excluding private yards).
Table 2. Percentage of housing units built in the three sectors in three periods
1946-1970 1971-1990 1991-2006
Sector A: Scarborough south of Highway 401 58.98 27.88 13.13
Sector B: Scarborough between Highway 401 and Steeles Avenue 17.35 63.44 19.21
Sector C: Markham (apart from areas west ofHighway 404) 6.08 41.42 53.68
Source: Statistics Canada, 2007.
Board, 1968; MacLaren, 1976). This firstgeneration of plans set rules defining the earlypost-war suburban model, made necessary bythe haphazard nature of rural fringe urban-
ization and the need to accommodateaccelerated growth (Beckett, 1958; Culham,1949; Harris, 1996).
Plans prepared over the second period (from

106 Evolving suburban form
the 1970s to the mid-1990s) proposed changesto the previous model (Borough of Scar-borough Planning and Buildings Department,1991; Short, 2006, pp. 85-99, 127-9). Someplans attempted to soften the rough edges of that model, as in the case of the improvementin the safety and appearance of strip-likeenvironments (Malik and Associates, 1975).Others put forward more pronounceddeviations from the model, such as inten-sification, mixed-use and alternatives toautomobile travel (Town of Markham, 1976,pp. 10-11). Under the influence of theenvironmental movement, this generation ofplans emphasized the preservation of greenspace, especially when of high ecologicalsignificance, such as wetlands, riparian zonesand woodlands (Borough of ScarboroughWorks Department, 1983; Town of Markham,1976, p. xvii, para. 5.12, 1997). The officialplan of Markham went so far as to protect the
municipality’s remaining agricultural land(Town of Markham, 1976, p. xiv). The mostconspicuous shift away from the dispersioninherent in the early post-war model was theproposal for a Scarborough multi-functionalcity centre with a rail transit connection.
From the mid-1990s, the ‘smart growth’perspective was reflected in proposals forforms of development that correct suburbandeficiencies – those relating to the environ-ment, energy conservation, sense of place, costof development, quality of life and health (Yeet al., 2005). The effects of reduced economicperformance on the capacity for public sectorintervention have exacerbated financialconcerns about prevailing suburban develop-ment and further fuelled calls for an alternativesuburban model. Expanding regions likeToronto face a mismatch between rapidgrowth, the brunt of it in suburbs, and laggingtransportation investment.
Figure 2. Three sectors (A, B and C), fourneighbourhoods of detached and semi-detached
houses (N. 1-4) and three industrial areas (I. 1-3).

Evolving suburban form 107
Alternatives to the prevailing suburbanform are clearly portrayed in the 2009 City ofToronto Official Plan (first adopted in 2002),which relates to the entire city, includingScarborough, and in the 2010 York RegionOfficial Plan, which embraces Markham alongwith the other York Region municipalities(City of Toronto City Planning, 2009; YorkRegion, 2010). The Toronto Official Planoffers a blueprint for the accommodation of544 000 more jobs and 537 000 more residentswithin its City of Toronto territory, which isfully built-up, so as to help contain sprawl(City of Toronto City Planning, 2009, pp. 2-11). In the Toronto plan, intensification andnew public transit investments are keyelements in fostering an urban form structuredby density, public transit corridors and anetwork of high-density multi-functionalnodes.
The York Region Official Plan alsosubscribes to an intensification agenda relyingon nodes, corridors and much increased publictransit use. ‘The approach combines theRegion’s significant investments in rapidtransit with a land-use planning system thatcreates sustainable and people-oriented places,bolsters the Region’s economic compet-itiveness, and preserves natural heritage andagricultural areas’ (York Region, 2010, p. 63).Inherent in the corridors and nodes concept asunderstood by the City of Toronto and YorkRegion official plans is the promotion of aform of land use that is pedestrian friendlywith buildings oriented to the street (YorkRegion, 2010, p. 64).
These objectives are mirrored in Markham,which is in the process of preparing a newofficial plan. Background reports and earlydiscussions of the content of the official plansuggest an aggressive intensification approach,which would result in a departure from theconventional suburban form. The goal inMarkham is to direct as much expected growthas possible to the current settlement area(Town of Markham Development ServicesCommittee, 2011a). Most major intensifi-cation areas are to be located along onehighway (Highway 7), destined to becomeMarkham’s main rapid transit spine, as well as
close to commuter train stations. Theproposed shift in planning trajectory is bestillustrated by anticipated changes in housingtypes. Whereas between 2000 and 2009, 53per cent of new residential units were detachedhouses and only 14 per cent were apartments,planners foresee that between 2006 and 2031the corresponding percentages will be 21 and54 (Baird, 2011; Town of Markham Develop-ment Services Committee, 2011a, 2011b).
Forms of development advanced by thisnew generation of plans break with thefundamentals of the post-war suburban model.The corridors and nodes strategy challengesthe dispersed type of development that hasshaped Scarborough and Markham. Attentionnow turns to the actual morphologicalevolution of the transect from the late 1940s tothe present.
Suburban form since the Second WorldWar
The super-grid/super-block structure plays adetermining role in defining suburban access-ibility and setting the scale at which develop-ment takes place and how it is regulated. Theshift from the grid and the block to the super-grid and super-block is a primary feature of theearly post-war suburban model. While allstreets, irrespective of their position in the roadhierarchy, make up the grid, the super-grid isdelineated exclusively by arterials (Southworthand Ben-Joseph, 1995; Southworth andOwens, 1993).
As is customary in post-war suburbs, thesuper-grid/super-block structure sets thepattern for the entire transect. The study areais made of 149 super-blocks, whose averagesize is approximately 2 km2 (but with widevariations) (Figure 2). The super-grid hasbeen an organizing force across time and spacewithin the study area, but road patterns andland-use distributions in super-blocks havevaried over time.
Eleven street- and land-use configurationshave been identified within super-blocks(Table 3). The first six listed are exclusivelyor primarily residential and are distinguished

108 Evolving suburban form
Table 3. Layout of super-blocks in the three sectors
Number (and percentage) Sector A Sector B Sector Cof super-blocks
1. Grid or modified grid: contrasts between interior and edge of super-block 10 (17.5)
2. Curvilinear: contrasts between interior andedge of super-block 28 (49.1) 16 (39) 13 (25.5)
3. Curvilinear: entirely low-density residential 4 (7) 2 (4.9) 7 (13.7)
4. Curvilinear: integration of super-blocks around a common centre 11 (26.8)
5. Contemporary street pattern (modified gridwith a radial presence): contrasts between interior and edge of super-block 5 (9.8)
6. Contemporary street pattern: entirely low-density residential 4 (7.8)
7. Employment 5 (8.8) 6 (14.6) 12 (23.5)
8. Multi-functional nodes 1 (1.8) 1 (2)
9. Shared land use: predominately residential 4 (7) 3 (7.3) 7 (13.7)
10. Shared land-use: predominately employment 4 (7) 3 (7.3) 1 (2)
11. Shared land use: predominately green space 1 (1.8) 1 (2)
Total 57 (100) 41 (100) 51 (100)
Source: 2006 Canadian Census (Statistics Canada, 2007) and aerial photographic analysis and measurements.
from each other by their street layout, thenature of their housing and the presence orabsence of retailing and its location within thesuper-blocks. The first category includes oldersectors, built in the late 1940s and the 1950s,where streets either conform to the gridpattern, consistent with configurations pre-dating the early post-war suburban model, orbegin to be distinguished from this layout byadopting a modified grid configuration. Thiscategory is also characterized by a distinctionbetween on the one hand the inner portions ofthe super-block, which are occupied by low-density housing, schools and parks, and on theother, edges along arterials taken up byretailing and medium- or high-density housing.The next three categories (2-4) are residentialsuper-blocks with curvilinear street config-urations. Category 2 super-blocks share withthose belonging to Category 1 the contrast
between a low-density and residential interior(with schools and parks) and the presence ofretailing and/or medium- or high-densityhousing at the edges. Category 3 comprisessuper-blocks that are uniformly residential andlow-density, and Category 4, the lastcurvilinear residential category, is made ofsuper-blocks that are grouped around acommon centre of activity (mostly composedof retailing and civic services). The tworemaining residential categories (5-6) includesuper-blocks adopting contemporary streetpatterns. In both instances, there has been areturn to modified grid configurations,occasionally with a radial component. Whatdifferentiates the two categories from eachother is that, as in some of the above instances,super-blocks in Category 5 exhibit contrastingland-use patterns between their interior andouter parts, whereas Category 6 super-blocks
Evolving suburban form 109
have a homogenous configuration made oflow-density housing, schools and parks.
Category 7 consists of employment areas,for the most part industrial/business parkswhich generally adopt a grid or modified-gridroad pattern, and Category 8, large multi-functional nodes. One multi-functional nodeis in place and the other is under development.The last three categories include super-blockswith shared land uses, that is, where at leastone quarter of the area is taken by a land usethat is not the dominant one. Category 9comprises shared land use super-blocks thatare predominantly residential, Category 10,those that are mainly occupied by workplaces,and Category 11, super-blocks that are mostlygreen space. Residential super-blockcategories that include retailing along arterialsdo not qualify as shared land use super-blocksbecause these non-residential uses compriseless than 25 per cent of their area.
Table 3 shows the distribution of thedifferent categories of super-blocks withineach sector of the transect. There is a clearpreponderance of functionally specializedsuper-blocks, which demonstrates that zoningdoes indeed take place within the frameworkprovided by this spatial structure. What ismore, the table reveals little inter-sectorvariation in the proportion of super-blocksregistering shared land use, which indicatesstability over time in the balance betweenfunctionally specialized super-blocks andthose where land use is shared. There is alsoa high incidence of residential super-blockconfigurations with retail and medium- orhigh-density housing along or close toarterials. This pattern dominates irrespectiveof the super-block’s street layout. Low-density housing occupies the inner parts of allresidential super-block categories.
In relation to the evolution of the super-block street layout, the rapid disappearance ofthe traditional grid (and early versions of themodified grid) is evident. It is found only inSector A and even within this sectorconstitutes a small minority. These layouts arerapidly replaced by curvilinear configurations,which are the dominant form of residentialsuper-blocks within each sector. Sector B
shows evidence of a fleeting fashion in the1970s and early 1980s for the integration oftwo to four super-blocks around a commoncentre. In the most recent super-blocks (thosefound in the northern part of Markham) thereis a return to the modified grid under theinfluence of New Urbanism. Figure 3 depictsthe four road patterns present in the categoriesof super-blocks. Finally, there are twodepartures from the specialized zoning thatprevails across the transect: the multi-functional nodes.
Table 4 shows population and householddensity statistics for each sector’s entireurbanized territory and for its residential areasonly. For all these measurements, except thatfor households within the urbanized area ofSector A, it is Sector B that registers thehighest density. The difference from Sector Ais in part related to the larger averagehousehold size in Sector B. The mostremarkable finding is the fall in densitybetween the first two sectors and Sector C,despite the fact that it has the largesthouseholds. The inter-sector distribution ofhousing types provides much of theexplanation for this phenomenon. Theproportion of units consisting of apartments inbuildings with five or more storeys declinesfrom Sector A to Sector B, and then falls verysharply between Sector B and Sector C. Theproportion of such units in Sector C isnegligible. Trends affecting other forms ofmultiples are less dramatic and take a numberof different directions. As expected, thedecline in medium- and high-rise apartments isechoed in a sharp increase in the proportion ofdetached houses in Sector C in comparisonwith Sector B. Household size and changes inhousing types do not, however, account for allthe inter-sector variations in residentialdensity. The effect that the decline in theproportion of apartments has on density is to asmall extent compensated for by morecompact detached-house developments. Thisis confirmed by the measurement of per unitland consumption in four detached-houseneighbourhoods developed at different times(Figure 2 and Table 4). Land consumption ishighest in Neighbourhood 2 where most

110 Evolving suburban form
residential building occurred between 1961and 1980, and lowest in Neighbourhood 3where most of it dates from 1986-1990. It hasincreased somewhat in the neighbourhooddeveloped for the most part in 2001-2006,Neighbourhood 4, while remaining muchlower than it was in the two olderneighbourhoods, Neighbourhoods 1 and 2(Table 4).
Table 5 shows the proportion of developedretail land (building footprint, parking, outdoorstorage and attendant landscaping) occupiedby different retail configurations (see Table 4,note 2 for a description of the configurations).There are very low proportions of street-facingretailing, which was the predominant form ofretailing before the Second World War. Infact, the presence of this configuration withinthe transect is associated in all except one casewith the few areas predating the War: the mainstreets of old Sector A neighbourhoods and thecommercial streets of two Sector C villagesnow engulfed by suburbanization. The onlynew development adopting this type ofretailing is the commercial centre of a NewUrbanism development, which contains
approximately ten shops.The automobile-age version of the trad-
itional main street is the retail strip consistingmostly of small, car-oriented retailing. Thepercentage of retail land devoted to small, car-oriented retailing declines between Sector Aand Sector C. Meanwhile, the proportion ofretail land allocated to medium and largeplazas and indoor malls is higher in Sector Bthan Sector A and somewhat lower in Sector Cthan Sector B.
The most recent retail format – big boxstores, power malls and mega-supermarkets –which has burgeoned over the last 20 years, isstrongly represented in all three sectors.Contrary to expectations, the second highestproportion of retail land occupied by thiscategory is in Sector A, the oldest sector. Theexplanation lies in the development of suchretailing on former brownfield sites. Asexpected, it is in Sector C that this configur-ation occupies the largest proportion of retailland, more than any other configuration. Partof the reason for a lesser prevalence of big-boxstores, power malls and mega-supermarkets inSector B is the fact that, when these retail
Figure 3. Super-block street patterns.

Evolving suburban form 111
Table 4. Residential density and housing types in the three sectors
Residential density and Sector A Sector B Sector Chousing types
Population 344 012 254 544 208 826Households 129 889 79 369 61 661Population/households 2.7 3.2 3.4Population/total urbanized area (km2) 3 251.5 3 743.3 2 148.4Households/total urbanized area (km2) 1 227.7 1 167.2 634.4Population/total residential areas (km2)1 6 075.8 7 999.5 4 502.5Households/total residential areas (km2)1 2 294 2 494.3 1 711.3Detached and semi-detached (%) 42.3 44.4 77Row houses (%) 5.2 14.4 9.8Apartments, duplexes (%) 8.1 6.1 8.4Apartments $ 5-floor building (%) 37.2 29.1 2.6Apartments < 5-floor building (%) 7 6.1 2.1Other (%) 0.3 0.1 0
Neighbourhood area (m2)/number of houses in four sample detached-housing neighbourhoods2
Neighbourhood 1: 690.5 Neighbourhood 2 : 952.3 Neighbourhood 3 : 473.8Neighbourhood 4 : 532.4
Source: 2006 Canadian Census (Statistics Canada, 2007) and aerial photographic analysis and measurements.
Notes1. The denominator consists of the areas of developed residential lots (including the footprints of buildings)
and local streets.2. Neighbourhood area used to calculate square metres per housing unit includes developed residential lots
(including building footprint) and local streets.Neighbourhood 1: St. Clair-Birchmount, 67.1% of housing built 1946-1970.Neighbourhood 2: Finch-Birchmount, 63.4% of housing built 1961-1980.Neighbourhood 3: McCowan-Denison, 61.9% of housing built 1986-1990.Neighbourhood 4: Kennedy-Major Mackenzie, 68.7% of housing built 2001-2006.See Figure 2 for location of neighbourhoods.
types became popular, this sector was alreadymostly developed, though too recently tocontain large brownfield sites ripe forredevelopment.
The ratio of parking area to buildingfootprint for different retail configurations(Table 5) reflects an adaptation to risingautomobile use as we move from Sector A tothe two other sectors. The ratio rises for allconfigurations. However, it is the same forSectors B and C. The amount of developedretail land per capita is similar in Sector A andSector C, despite variations in the distributionof different retail configurations. The presence
of small, car-oriented retailing is much higherin Sector A than Sector C, while the reverseholds for configurations of big-box stores,power malls and mega-supermarkets. A lesserpresence of these formats in Sector B accountslargely for its lesser retail land per capita.
With respect to workplaces, the industrial/business park formula was established in the1950s with mostly single-storey buildingssurrounded by space for storage, truck access,employee parking and some landscaping, anda modified-grid road pattern. From a morph-ological perspective, very little change inthese employment areas took place over the

112 Evolving suburban form
Table 5. Retailing in the three sectors
Sector A Sector B Sector C
Building footprint, parking and landscaped area as percentage of all retail categories1
Street-facing retailing2 1.5 0 3.2Small, car-oriented retailing2 53.6 47.9 34Medium and large plazas2 2.7 7.3 6.1Indoor malls2 13.7 19.3 17.9Big box stores, power malls and mega-supermarkets2 28.5 25.4 38.9
Ratio parking area/building footprint1
Street-facing retailing2 0.9 0 1.7Small, car-oriented retailing2 1.8 2.3 2.3Medium and large plazas2 1.3 1.9 1.8Indoor malls2 1.8 2 2.3Big box stores, power malls and mega-supermarkets2 1.7 1.9 1.9All retailing 1.7 2.1 2.1
Retail area (building footprint, m2) per person1
Street-facing retailing2 0.08 0 0.13Small, car-oriented retailing2 1.91 1.08 1.17Medium and large plazas2 0.12 0.19 0.25Indoor malls2 0.5 0.48 0.62Big box stores, power malls and mega-supermarkets2 1.07 0.65 1.51All retailing 3.68 2.41 3.69
Source: 2006 Canadian Census (Statistics Canada, 2007) and aerial photographic analysis and measurements.
Notes1. Retail area does not refer to floor space but to the surface of the land occupied by building footprint,
parking and attendant landscaping. Note that the vast majority of retailing in the transect is in single-floorstructures.
2. Street-facing retailing includes various types of stores built to the sidewalk in a traditional main streetfashion. Small, car-oriented retailing comprises self-standing stores with a building footprint below4000 m2 and outdoor malls with a footprint under 10 000 m2. In all instances within this configuration,there is parking space between structures and the street and often beside and behind buildings as well.Medium and large plazas are outdoor, car-oriented shopping malls with a footprint of 10 000 m2 or more,whose stores are generally smaller than those found in power malls. Within the transect, the footprint ofindoor malls ranges from 30 000 m2 to 70 000 m2. The big-box store, power mall and mega-supermarketcategory refers to retail formats that have become popular over the last 2 decades. Big-box stores arelarge automobile-oriented (in their suburban variant) structures, which are either medium- or low-costdepartment stores or specialize in one type of products. Power malls present an assemblage of suchstores. Mega-supermarkets are defined as food outlets with a footprint of 4000 m2 or more.
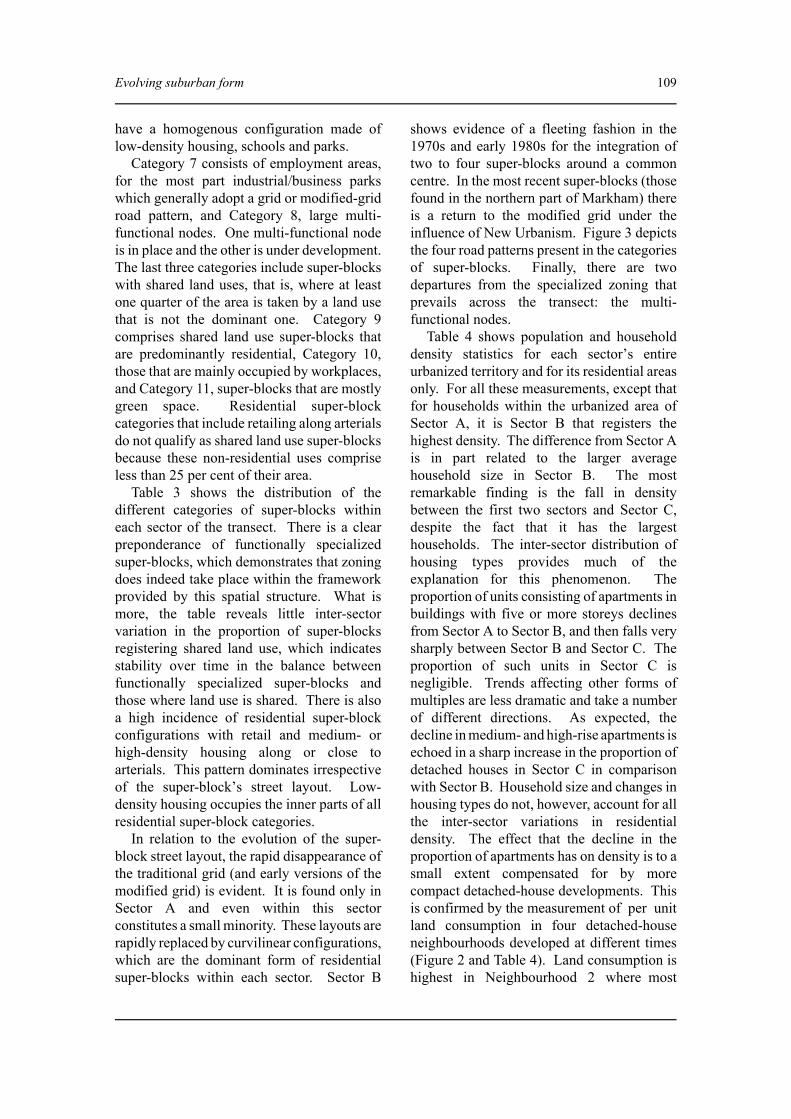
period under investigation. Table 6 indicatesonly very slight variation in overall buildingcoverage in three sample industrial areasselected from each sector, despite recordeddifferences in the size of structures. There are,however, considerable inter-sector differences
in the proportion of urbanized land occupiedby employment areas, which generally takethe form of large mono-functional zones.
Variations in the presence of officebuildings also distinguish the three sectors.Traditionally concentrated in Downtown
Evolving suburban form 113
Table 6. Workplaces in the three sectors
Sector A Sector B Sector C
Sample industrial areas: average size of buildings (m2)1 3207 5475 3789
Sample industrial areas: percentage of areas occupied by building footprints 46.2 48.8 44.6
Percentage of urbanized space occupied by employment areas 9.72 20.39 13.24
Office buildings ($ 10 000 m2 floor space): number of buildings 12 (8 of which 6 26
in Scarboroughtown centre)
Office buildings ($ 10 000 m2 floor space): total floor space 255 763 (of 91 891 602 181
which 215 777in Scarboroughtown centre)
Source: 2006 Canadian Census (Statistics Canada, 2007) and aerial photographic analysis and measurements.
Note1. See Figure 2 for location of sample industrial areas.
Toronto, office space began to decentralize inthe early 1980s. Planning policies of the timeencouraged office space construction insuburban nodes, one of which is Sector A’sScarborough Town Centre, in order tomoderate what was perceived as an over-concentration of employment in the downtown(Metro Toronto, 1981). The vast majority ofSector A office space in buildings with 10 000m2 or more of floor space is concentrated inScarborough Town Centre (Table 6). There islittle office space in Sector B, but a largeamount in Sector C, reflecting the growingattraction of office space in automobile-accessible suburban locations. The appeal ofsuburbs was further enhanced by lowerbusiness taxes (Canadian Urban Institute,2005; Lang, 2003). Downtown Toronto officedevelopment nearly stalled as office growth indeveloping suburbs gathered momentum fromthe early 1990s to the late 2000s.
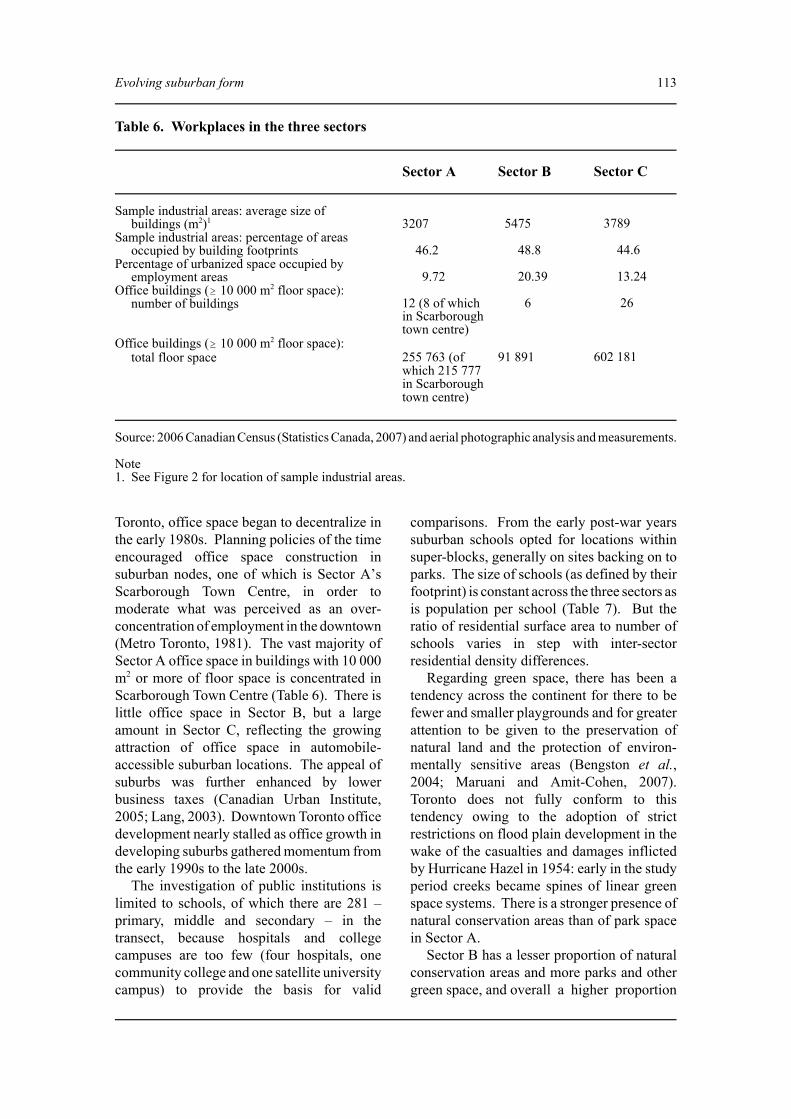
The investigation of public institutions islimited to schools, of which there are 281 –primary, middle and secondary – in thetransect, because hospitals and collegecampuses are too few (four hospitals, onecommunity college and one satellite universitycampus) to provide the basis for valid
comparisons. From the early post-war yearssuburban schools opted for locations withinsuper-blocks, generally on sites backing on toparks. The size of schools (as defined by theirfootprint) is constant across the three sectors asis population per school (Table 7). But theratio of residential surface area to number ofschools varies in step with inter-sectorresidential density differences.
Regarding green space, there has been atendency across the continent for there to befewer and smaller playgrounds and for greaterattention to be given to the preservation ofnatural land and the protection of environ-mentally sensitive areas (Bengston et al.,2004; Maruani and Amit-Cohen, 2007).Toronto does not fully conform to thistendency owing to the adoption of strictrestrictions on flood plain development in thewake of the casualties and damages inflictedby Hurricane Hazel in 1954: early in the studyperiod creeks became spines of linear greenspace systems. There is a stronger presence ofnatural conservation areas than of park spacein Sector A.
Sector B has a lesser proportion of naturalconservation areas and more parks and othergreen space, and overall a higher proportion
114 Evolving suburban form
Table 7. Schools and green spaces in the three sectors
Sector A Sector B Sector C
SchoolsAverage footprint of schools (m2) 4509 4311 4665Surface of residential areas1/schools (km2) 0.46 0.37 0.66Population per school 2774 2926 2983
Green space (percentage of urbanized area)Parks 4.0 9.3 6.2Nature conservation areas 6.0 1.7 6.4Other green spaces (excluding private yards) 3.9 9.9 2.2Total 13.9 20.9 14.8
Source: 2006 Canadian Census (Statistics Canada, 2007) and aerial photographic analysis and measurements.
Note 1. The numerator consists of the areas of developed residential lots (including the footprints of buildings)
and local streets.
of green space than other sectors (Table 7).The canalizing or piping of creeks accounts forthe near absence of natural conservation areason floodplains in Sector B, but conventionalpark space is abundant in that sector, as areother green spaces, principally comprisingutility corridors, a golf course and fallow landwithin urbanized areas. A return to the naturalconservation area conformations occurring inSector A is evident in Sector C: here creeks aremaintained in their natural condition andnatural conservation areas are sited alonghydrological features.
Planning and suburban form trajectories
The hypothesized suburban planning anddevelopment phases since the Second WorldWar are faithfully mirrored in plans relating tothe transect since the 1950s (Table 8). Plansfirst adopted the development norms of theearly post-war model. Then, as criticismsdeveloped of the resulting suburban form,plans incorporated modifications, recentlyadvancing an alternative vision that emph-asized recentralization and alternatives to caruse. However, analysis of the way in which
suburban form has actually developed withinthe study area reveals a different pattern fromthat in the plans. Some land uses in factperpetuated development patterns associatedwith the early post-war suburban model. Thesuper-grid contributed to an evening out ofaccessibility gradients and, thereby, to adispersion of activities, while promoting land-use specialization. While it is at the scale ofthe super-block that innovations in roadpattern and land-use distribution have takenplace, these innovations have generallyremained compatible with defining features ofthe early post-war model. And in the soleinstance in which an innovation departed fromdispersion and land-use specialization – thecase of the Scarborough multi-functional node– the super-block structure and its role as aframework for zoning prevented the diffusionof the land-use effects of this innovation toadjacent areas. Finally, in a context of heavyreliance on the car and overall dispersion,green space gaps in the suburban texture donot greatly hinder interconnections betweendifferent land uses.
Rather than following the new planningvision, the evolution of variables observed inthe study perpetuated and accentuated features

Evolving suburban form 115
Table 8. Trajectory of plans and land-use features in the study area
Nature of evolution Trajectory
Plans The evolution of the content of plans conforms to the threehypothesized periods: (1) plans formulate and provide theconditions for the adoption of the early post-war suburban model; (2) proposal of modifications of the suburban model; \(3) plans put forth an alternative version of suburban development.
Super-grid The super-grid provides the land-use structure of the suburb and results in a flattened automobile-oriented accessibility Ypattern favouring dispersion.
Super-block The layout of super-blocks and land-use distribution therein have experienced substantial change, but within the context set by the super-grid. Land-use innovations take place at the Yscale of super-blocks; these innovations do not challenge the super-grid.
Population density Major fall in population density between Sector C and the other sectors due to housing type distribution. [
Retailing Rise in the amount of parking and growing presence of big-box stores, power malls and mega-supermarkets, which are types of retailing that rely on extended catchment areas of [automobile users.
Workplaces Industrial areas do not experience much change but offices are increasingly present in newer suburban areas. Suburb-anization of office space results in shorter commuter journeys but much higher reliance on the car relative to [downtown office location.
Public institutions Larger catchment area for Sector C schools encourages(schools) more driving of students to schools. [Green space The return to natural conservation areas in Sector C is
consistent with accessibility and land-use patterns Yin an automobile dominated environment.
Departure from the early post-war suburban model (automobile orientation, land-use special-\ ization, low density).Y Perpetuation of the early post-war suburban model.[ Accentuation of the features of the early post-war suburban model.
of the early post-war model; more specificallythey increased automobile orientation, land-use specialization and dispersion and lesseneddensity. Much lower population density inSector C than in other sectors represents an
impediment to the delivery of public transitand results in additional and/or longer carjourneys in an environment where activitiesare more distant from each other. What ismore, lower Sector C density is the outcome of

116 Evolving suburban form
a much higher presence of detached and semi-detached houses and increased house-typehomogeneity, thereby perpetuating theresidential forms characteristic of the earlypost-war model. Retailing has quickly adaptedto growing reliance on the car and theaccessibility that ensues: configurations withlarge parking surfaces as well as formats –indoor malls and now big-box stores, powermalls and mega-supermarkets – that drawupon the large catchment areas of automobileusers, thus augmenting car reliance. There aretwo distinct tendencies regarding workplaces.Though industrial areas have undergonelimited change since the 1950s, this has notbeen the case for office buildings. As thehistorical downtown concentration of officesgave way to suburban decentralization, thetendency was for commuting to becomeshorter but far more car-reliant (Clark andKuijpers-Linde, 1994; Lee et al., 2006). Thecontribution of schools to the advancement ofthe early post-war model relates to largerservice areas in Sector C and, one can assume,to more children being driven to school.
Findings thus emphasize a glaringdiscrepancy between the trajectory of plansand that of actual suburban development.While the content of plans conforms to thehypothesis, the development reality is stronglyat odds with the expected departure from theearly post-war suburban model. Why is theresuch a gap between proposals voiced in plansand the reality of suburban development? Theanswer lies in the circumstances responsiblefor the deepening entrenchment of the earlypost-war model and limitations on the capacityto shift development tendencies.
A major factor in the lack of change in thenature of suburban development is theexistence of a transportation-land use dynamic,which results in continuing adaptation of thebuilt environment to the space requirements ofthe automobile and to the car-inducedreduction of accessibility gradients. Mean-while, such land uses encourage furtherreliance on the car and thereby contribute tothe reciprocal nature of the dynamic. There is,in addition, the influence of interest groupscoalesced around prevailing forms ofdevelopment. Likewise, existing patterns are
perpetuated by mutual expectations ofproducers and consumers of the built environ-ment and by the habits of the public. Alsohampering urban change is the difficulty formany residents to contemplate alternativeforms of development, especially when theyclash with their values and what they areaccustomed to.
The Toronto mayoral campaign of 2010highlights the resistance to urban transform-ation. During the campaign, one of the mainplatforms of Rob Ford, the successfulcandidate, was to favour subways rather thanlight rail transit in order to avoid taking roadspace away from automobiles (he opposedcycle lanes for the same reason) (Warren,2010). Naturally, this approach would requirefar fewer rail transit kilometres to be paid forout of public transit capital budgets. Hispreferred subway line was to run throughScarborough’s primarily dispersed and low-density environment, whose limited potentialpatronage and plentiful road surface make itbetter suited to surface light rail transit. Thepro-automobile message resonated withsuburban constituencies, which rallied aroundcandidate Ford and assured his victory(Siddiqui, 2010).
Only large-scale and well co-ordinatedinterventions have the potential for over-coming the deep entrenchment of the earlypost-war model. Modest, localized actionshave little effect on urban structure anddynamic because of their limited ability tosimultaneously improve public transit andintensify land use, and thus initiate a mutuallyreinforcing interrelation. Interventions mustbe well co-ordinated over time and space andbe of a sufficient magnitude to launch analternative dynamic of transportation and landuse and help bring to reality the vision of arecentralized and less automobile reliantsuburb.
Attempts at departing from the early post-war model collide with diminished state inter-vention capacity in matters of infrastructuredevelopment at a time of sluggish economicgrowth, heavy public sector debt and harshcompetition from other government spendingpriorities (especially health care). Gone arethe favourable investment conditions that

Evolving suburban form 117
prevailed from the 1950s to the 1980s whenthe majority of Toronto’s highway and publictransit networks (with more emphasis on theformer in suburban parts) were built.
Yet we cannot overlook signs – such asrising energy prices, the growing popularity ofhigh-density living and the success acrossNorth America of new public transit systems –that point to a possible urban transition.Presently, large parts of the study area areundergoing deep socio-economic change, chal-lenging aspects of the early post-war suburbanmodel. The settlement of low-income immi-grants in parts of Scarborough is, indeed,raising residential density and reliance onpublic transit (Hulchanski, 2010). To foster anurban environment that is both better adaptedto the needs of this new population andcorresponds to the recentralization and publictransit-focused vision, governments mustchannel their regulatory and limited financialcapacity to the creation of concentrated realmswithin the suburban environment. Theserealms would be made of interconnected nodesand dense public transit corridors. It would bepossible thereby to reach daily activities bywalking or using efficient public transit.When successful, such a strategy would launchan alternative suburban dynamic of transport-ation and land use whereby the built environ-ment would adapt to the presence of qualitypublic transit and to additional walking, andthus contribute to the animation of sidewalkswhile generating additional transit riders.
What is the relevance of the findingsreported in this paper beyond Toronto? Inspite of the dispersion, automobile orientationand lower density in its latest layer ofdevelopment, suburban Toronto registershigher density and less automobile reliancethan most of its North American counterparts(Filion et al., 2004). At the same time, areview of metropolitan-scale planning docu-ments across North America has revealed awidely-shared interest in public transit systemexpansion and recentralization objectives(Filion and Kramer, 2010). It follows that thestriking gap between planning visions andsuburban reality in Toronto may actually beless pronounced than in most other NorthAmerican metropolitan regions.
Conclusion
This paper has shown how changes tosuburban form since the late 1940s in aToronto transect have either conformed to theearly post-war model or further accentuatedsome of its key features. There has been a lossof residential density, rising automobiledependence of retailing and offices, and onlysporadic departures from the early post-warmodel. Meanwhile, recent plans advance analternative to that model, substitutingconcentrated development structured aroundcorridors and nodes for low density anddispersion, and replacing near universal caruse by additional reliance on public transit andwalking. The gap between planning proposalsand the reality of suburban development canbe accounted for by resistance to changestemming from the continuing momentum ofpatterns of development inherited from theearly post-war model and from interests andhabits perpetuating these patterns.
References
Aglietta, M. (1979) A theory of capitalistregulation: the US experience (NLB, London).
Bacher, J. C. (1993) Keeping to the marketplace:the evolution of Canadian housing policy(McGill-Queen’s University Press, Montréal).
Baird, J. (2011) ‘Managing growth in Markham to2031’, paper presented to the Canadian Instituteof Planners Conference, July (http://cip2011.cip-icu.ca/English/pdfs/TCS25%-%20Managing%20Growth%20in%20Markham%to%202031.pdf ) accessed July 2011.
Beckett, H. E. (1958) ‘Letter from the LegalDepartment of Township of Scarborough to K.Grant Crawford, Deputy Minister, OntarioDepartment of Municipal Affairs, February 26’(accessed at Ontario Archives).
Bengston, D. N., Fletcher, J. O. and Nelson, K. C.(2004) ‘Public policies for managing urbangrowth and protecting open space: policy instru-ments and lessons learned in the United States’,Landscape and Urban Planning 69, 271-86.
Borough of Scarborough Planning Board (1968)Retail commercial standards: a study (Boroughof Scarborough, Scarborough, Ontario).
Borough of Scarborough Planning and BuildingsDepartment (1991) Official plan: office consoli-

118 Evolving suburban form
dation (City of Scarborough, Scarborough,Ontario).
Borough of Scarborough Works Department (1983)An assessment of natural areas in Scarborough– part 2 (Borough of Scarborough, Scarborough,Ontario).
Brown, J. R., Morris, E. A. and Taylor, B. D.(2009) ‘Planning for cars in cities: planners,engineers, and freeways in the 20th century’,Journal of the American Planning Association75, 161-78.
Canadian Urban Institute (2005) Business competi-tiveness in the GTA: why Toronto is losingground (Canadian Urban Institute, Toronto).
Checkoway, B. (1980) ‘Large builders, federalhousing programs, and postwar suburban-ization’, International Journal of Urban andRegional Research 4, 21-45.
City of Toronto City Planning (2009) Torontoofficial plan (City of Toronto, Toronto).
Clark, W. A. V. and Kuijpers-Linde, M. (1994)‘Commuting in restructuring urban regions’,Urban Studies 31, 465-83.
Culham, G. (1949) ‘Suburban fringe problems’,paper given at the Southwestern OntarioPlanning Conference, London, Ontario, March2-3 (accessed at Ontario Archives).
Dear, M. J. (2000) The postmodern urban condition(Blackwell, Oxford).
Dear, M. J. and Flusty, S. (2002) ‘Los Angeles aspostmodern urbanism’, in Dear, M. J. and Dish-man, J. D. (eds) From Chicago to L.A.: makingsense of urban theory (Sage, Thousand Oaks,CA) 55-83.
Filion, P., Bunting, T., McSpurren, K. and Tse, A.(2004) ‘Canada-U.S. metropolitan densitypatterns: zonal convergence and divergence’,Urban Geography 25, 42-65.
Filion, P. and Kramer, A. (2010) ‘Urban intensi-fication models and metropolitan-scale planningin the US’, paper presented at the ACSP AnnualConference, Minneapolis, MN, October.
Fishman, R. (1987) Bourgeois utopias: the rise andfall of suburbia (Basic Books, New York).
Flint, A. (2006) This land: the battle over sprawland the future of America (Johns HopkinsUniversity Press, Baltimore, MD).
Frank, L. D., Engelke, P. O. and Schmid, T. L.(2003) Health and community design: theimpact of the built environment on physicalactivity (Island Press, Washington, DC).
Friedman, A. (2002) Planning the new suburbia:flexibility by design (UBC Press, Vancouver,BC).
Gottdiener, M. (1977) Planned sprawl: public andprivate interests in suburbia (Sage, Beverly
Hills, CA).Harris, R. (1996) Unplanned suburbs: Toronto’s
American tragedy (Johns Hopkins UniversityPress, Baltimore, MD).
Harvey, D. (1985) The urbanization of capital:studies in the history and theory of capitalisturbanization (Johns Hopkins University Press,Baltimore, MD).
Haugen, D. M., Musser, S. and Kalambakal, V.(eds) (2010) The middle class (GreenhavenPress, Detroit, MI).
Hayden, D. (2006) ‘Building the American way:public subsidy, private space’, in Nicolaides, B.M. and Wiese, A. (eds) The suburb reader(Routledge, New York) 273-80.
Hulchanski, D. (2010) The three cities withinToronto: income polarization among Toronto’sneighbourhoods (University of Toronto, CitiesCentre Press, Toronto).
Institute of Traffic Engineers (1965) Recommendedpractice for subdivision streets (Institute ofTraffic Engineers, Washington, DC).
Knox, P. L. (1992) ‘The packaged landscapes ofpost-suburban America’, in Whitehand, J. W. R.and Larkham, P. J. (eds) Urban landscapes:international perspectives (Routledge, London)207-26.
Knox, P. L. (2008) Metroburbia, USA (RutgersUniversity Press, New Brunswick, NJ).
Lang, R. E. (2003) Edgeless cities: exploring theelusive metropolis (Brookings Institution Press,Washington, DC).
Lee, S., Gook Seo, J. and Webster, C. (2006) ‘Thedecentralising metropolis: economic diversityand commuting in the US suburbs’, UrbanStudies 43, 2525-49.
Lewis, P. F. (1983) ‘The galactic metropolis’, inPlatt, R. H. and Macinko, G. (eds) Beyond theurban fringe (University of Minneapolis Press,Minneapolis, MN) 23-49.
MacLaren, J. F. Ltd (1976) Scarborough OfficialPlan Review (Borough of Scarborough, PlanningBoard, Scarborough, Ontario).
Malik and Associates (1975) Streetscape study,Eglinton Avenue East, from Victoria ParkAvenue to Kennedy Road (Borough of Scar-borough, Planning Board, Scarborough,Ontario).
Maruani, T. and Amit-Cohen, I. (2007) ‘Character-istics of developers and their relations to openspace conservation’, Land Use Policy 28, 887-97.
Mauro, P. (ed.) (2011) Chipping away at publicdebt: sources of failure and keys to success infiscal adjustment (Wiley, Hoboken, NJ).
Metro Toronto (1981) Official plan for the urban
Evolving suburban form 119
structure (Metro Toronto, Toronto, ON).Moudon, A. V. and Hess, P. M. (2000) ‘Suburban
clusters: the nucleation of multifamily housingin suburban areas of the Central Puget Sound’,Journal of the American Planning Association66, 243-65.
Myers, D. and Gearin, E. (2001) ‘Current prefer-ences and future demand for denser residentialenvironments’, Housing Policy Debates 12, 633-59.
Newman, P., Beatley, T. and Boyer, H. (2009)Resilient cities: responding to peak oil andclimate change (Island Press, Washington, DC).
Rowe, P. G. (1991) Making a middle landscape(MIT Press, Cambridge, MA).
Short, J. R. (2006) Albaster cities: urban U.S. since1950 (Syracuse University Press, Syracuse,NY).
Siddiqui, H. (2010) ‘Ford gave voice to city’svoiceless citizens’, Toronto Star 17 October,A19.
Silk, L. S. (1976) The United States and the worldeconomy: the postwar years (Arno Press, NewYork).
Southworth, M. and Ben-Joseph, E. (1995) ‘Streetstandards and the shaping of suburbia’, Journalof the American Planning Association 61, 65-81.
Southworth, M. and Ben-Joseph, E. (1997) Streetsand the shaping of towns and cities (McGraw-Hill, New York).
Southworth, M. and Owens, P. M. (1993) ‘Theevolving metropolis: studies of community,neighborhood, and street form at the urbanedge’, Journal of the American PlanningAssociation 59, 271-87.
Speir, C. and Stephenson, K. (2002) ‘Does sprawlcost us all? Isolating the effects of housingpatterns on public water and sewer costs’,Journal of the American Planning Association68, 56-71.
Statistics Canada (2007) Toronto, Ontario: 2006community profiles, catalogue no. 92-591-XWE(Statistics Canada, Ottawa, ON).
Town of Markham (1976) Draft official plan of theTown of Markham (Town of Markham, Mark-ham, Ontario).
Town of Markham (1997) Town of Markham
official plan (Revision of 1987 Version), OfficialPlan Amendment No. 52: Policies to Protect,Enhance and Restore Natural Features (UrbanDevelopment Area) (Town of Markham, Mark-ham, Ontario).
Town of Markham Development ServicesCommittee (2011a) New Markham official plan(PowerPoint presentation, 8 February) (Town ofMarkham, Markham, Ontario) (http://www.markham.ca/markham/ccbs/indexfile/Agendas/2011/Development%20Services/pl110208/Official%20lan.pdf ) accessed September 2011.
Town of Markham Development ServicesCommittee (2011b) New Markham official plan(PowerPoint presentation, 22 February) (Townof Markham, Markham, Ontario) (http:// www.markham.ca/markham/ccbs/indexfile/Agendas/2011/Development%20Services/pl110222/Official%Plan%20-%20Presentation.pdf ) accessedSeptember 2011.
Township of Markham Planning Board (1964)Official plan of the Township of Markhamplanning area (Township of Markham,Markham, Ontario).
Township of Scarborough (1957) Official plan(Township of Scarborough, Scarborough,Ontario).
Warren, M. (2010) ‘Smitherman’s the ticket ontransit: Ford’s plan to spend big on subways andget rid of streetcars will do nothing to easeToronto gridlock’, Toronto Star 12 October,A27.
Webber, M. M. (1964) “The urban place and thenonplace urban realm”, in Webber, M. M.,Dyckman, J. W., Foley, D. L., Guttenberg, A.Z., Wheaton, W. L. C. and Bauer Wurster, C.(eds) Explorations into urban structure(University of Pennsylvania Press, Philadelphia,PA) 79-153.
Wolfe, J. M. (1994) ‘Our common past: aninterpretation of Canadian planning history’,Plan Canada, July, 12-34.
Ye, L., Mandpe, S. and Meyer, P. B. (2005) ‘Whatis “smart growth” – really?’ Journal of PlanningLiterature 19, 301-15.
York Region (2010) York Region official plan(York Region, Newmarket, Ontario).
Infrastructure and the rebuilt post-war city
A one-day workshop on this theme is beingorganized at Birmingham City University on 25March 2013. Contributions are invited on transport
and communications, retail, administrative, servicesand other infrastructure: please contact ProfessorPeter Larkham, email [email protected].