evolving the core design principles: the coevolution of ... · the coevolution of institutions and...
TRANSCRIPT

Evolving the Core Design Principles:
The Coevolution of Institutions and Sustainable
Practices
Timothy M. Waring1, Sandra Go↵1, and Paul E. Smaldino2
1University of Maine, Orono, ME USA2Johns Hopkins University, Baltimore, MD USA
[email protected],[email protected],[email protected]
Abstract. The sustainable use of limited resources presents a loomingcooperation problem for the global human population. A number of re-searchers have proposed that certain social norms and institutions canstabilize resource conservation behavior within groups, but a mechanismby which those norms might emerge is as yet unestablished. We speculatethat such norms may emerge via a process of cultural evolution amongstsocial-ecological systems. We present a model of endogenous group for-mation to assess whether cultural multilevel selection may facilitate theemergence of sustainable cultures, even when individual conservationbehavior remains costly. We show that conservation and population per-sistence is enhanced by the endogenous emergence of two social norms:boundary defense (or ‘property’) and cooperative production, and thatthe associated evolutionary process requires selection at the group level.We also show that longer-lasting institutions rely on the ability of indi-viduals to form clearly-marked social groups. Our findings provide a newdynamic theory of the emergence of sustainable institutions and societies,and also have broad impacts for theories of human social evolution.
Keywords: sustainability, group selection, cultural evolution, Ostrom
1 Introduction
We live in a world in which the likelihood of environmental catastrophe loomslarger every day. We are pulling food, fuel, and forest out of the earth at unsus-tainable rates. Industrial fisheries, for instance, have reduced the biomass of largepredatory fish in the North Atlantic to only 10% of pre-industrial levels [1]. Ourglobal climate has just entered a state that it has not seen for many thousands ofyears. It is therefore vital to understand how to advance the widespread adoptionof sustainable practices. A persistent problem when considering the stewardshipof common resources, however, is the vulnerability of socio-ecological systemsto free riders. Although countless programs promote sustainable or low-impactliving, any proposal for a behavioral or institutional solution is useless unlessone can show that (1) we can get there from here (i.e., the solution can evolve

2 Waring, Go↵, & Smaldino
from the present conditions), and (2) we can stay there when we do (i.e., thesolution is resistant to invasion by free-riding strategies).
Using an agent-based model, we investigate the co-evolution of sustainablepractices with normative institutions that allow groups to maintain such prac-tices. Our approach relies on the theory of cultural evolution [2, 3], which ac-counts for the influences of culture and social learning on human behavior andorganization. This is based on the recognition that natural selection does notrequire genes, but only a population of individuals (or other units of selection)among which there is variation, transmission of traits between individuals, anda selection for certain traits. Before introducing the model, we will first discussinstitutions related to sustainability, followed by an introduction to key evolu-tionary principles.
1.1 Institutions for sustainability: Ostroms core design principles
Institutions are the formal and informal rules that govern human social behavior[4]. The primacy of institutions in determining the success of resource manage-ment regimes is well documented. Elinor Ostrom developed a set of institutional‘design features’ that were commonly associated with successful resource man-agement [5, 6]. These eight principles, abbreviated in Table 1, emerged fromdecades of comparative case study research. Groups that successfully managedcommon pool resources without succumbing to the “tragedy of the commons”[7] appeared to follow some subset of these principles, each of which can becharacterized as an institution or institutional feature.
Although these institutions seem to be associated with e↵ective sustainablemanagement of common resources, it is unclear how they would arise initially.Many normative institutions and traditions themselves require cooperation andcoordination among group members. Cooperative endeavors are often vulnerableto free riders who might cause such endeavors to fail before institutions thatsafeguard cooperation have the chance to emerge. It is therefore important toadopt a perspective that accounts for processes of social change in order tounderstand how institutions like Ostrom’s design principles could have emerged,and perhaps even to understand how they could spread in a modern world so inneed of sustainable practices.
1.2 Evolutionary principles
To guide the understanding and implementation of sustainable practices, we needto understand how they can arise and be maintained. A cultural evolutionaryapproach is useful here, because it is based on understanding the dynamics ofsocial norms and cultural institutions. One important concept is the evolution-arily stable strategy (ESS) [8]. In order for a phenotypic trait – or “strategy” –to be evolutionarily viable, it must be able to resist an invasion by individuals orgroups with competing strategies. Importantly, whether or not a strategy is anESS depends not only on the pool of competing strategies, but also on existingsocial institutions and socio-spatial structure. For example, if a population is

Evolving the Core Design Principles 3
Table 1. Ostrom’s eight core design principles (adapted from [5]).
Principle Description
1 Boundaries Clearly defined boundaries (e↵ective exclusion of externalun-entitled parties);
2 Rules Rules regarding the appropriation and provision of commonresources that are adapted to local conditions;
3 Collective-choice Collective-choice arrangements that allow most resource ap-propriators to participate in the decision-making process;
4 Monitoring E↵ective monitoring by those who are part of or accountableto the appropriators;
5 Sanctions Graduated sanctions for resource appropriators who violatecommunity rules;
6 Conflict Resolution Mechanisms of conflict resolution that are cheap and of easyaccess;
7 Self-determination Self-determination of the community recognized by higher-level authorities;
8 Nested Organization In the case of larger resources, organization in the form ofmultiple layers of nested enterprises.
well-mixed and interactions occur at random, then a free-riding strategy can-not be invaded by a purely cooperative strategy. However, even without explicitinstitutions of monitoring or punishment, cooperation can arise if there is rigidspatial or group structure [9–11]. The presence of punishment or reputationalinstitutions can also stabilize cooperation [12–14].
Importantly, selection pressures for cooperation typically vary by the level atwhich selection operates. Well known psychological and cultural forces stabilizecultural groups, minimizing within-group di↵erences and accentuating di↵er-ences among groups, which allows selection to act at the group level [15–17].Group selection can thereby select for cultural traits that would be maladaptiveindividually but can be favored by selection because they produce a group ben-efit [18]. Recently, cultural group selection has emerged as a general frameworkto explain the group-driven evolutionary processes that influence cultural andinstitutional evolution [15, 19, 20]. Henrich [15] lists four mechanisms that drivecultural group selection; di↵erential imitation, di↵erential migration, di↵erentialreproduction, and di↵erential extinction. In all cases, the strength of group-levelselection increases as fitness relevant between-group di↵erences increase and asvariation among individuals within a group declines [19].
Research on cultural group selection has largely been in the context of basicscience research on the evolution of human institutions and propensities (e.g.,[21–23]). However, there is scope for using this framework in more applied set-tings, such as the evolution of resource management institutions.

4 Waring, Go↵, & Smaldino
1.3 The coevolution of institutions and sustainable practices
We consider the coevolution of three cultural traits that interact with individual-level resource usage. The behavior we are most interested in is whether or notan individually costly practice of sustainable harvesting can be maintained in apopulation via the mechanisms of cultural group selection operating on relevantcultural traits. The traits we investigate are:
1. Shared production, whereby individuals share resources with others to pro-duce a surplus;
2. Boundary defense, whereby individuals pay a cost to defend their resourcesfrom others;
3. Group markers, whereby individuals of di↵erent groups can be identified assuch, allowing di↵erential action towards in- and out-group members.
Shared production In an uncertain world in which individuals may experiencedroughts and gluts of resources, an institution through which current resourcesare shared and create surplus resources can mitigate this risk [24, 21]. We allowa simple cooperative economic production institution to evolve endogenouslyamong individuals. Cooperative surplus production occurs through a two-personpublic goods game, so that there is no guarantee of even benefits.
Boundary defense The ability to declare a resource ones own, and to defend itfrom the hands of others, is common to most societies. Rousseau [25] wrote “Thefirst man who, having enclosed a piece of ground, bethought himself of saying‘This is mine,’ and found people simple enough to believe him, was the realfounder of civil society.” The first of Ostrom’s [5] design principles is the existenceand maintenance of clearly defined resource use boundaries (see Table 1). Weallow the institution of boundary defense (or property) to evolve endogenouslyamong individuals, whereby individuals can pay a cost to prevent others fromexploiting resources on their land.
Shared production and boundary defense are costly and cooperative behav-iors. Shared production is modeled as a symmetrical, dyadic public goods gamein which individuals stand to benefit from a value-added collaborative process,but their contributions to the shared production may be taken advantage of bypartners who do not contribute. Maintaining property is individually costly, andis also a cooperative act when property is shared with group members, becausethere is no guarantee that group members will pay the same costs or reciprocateby allowing harvesting on their patch.
Group markers Ethnic groups and other cultural divisions are often explic-itly marked, and individuals identify themselves outwardly as a member of theirgroup. One theory of human evolution posits that humans evolved the abilityto form well-marked ethnic or social groups because doing so facilitates solv-ing collective action problems such as resource procurement and inter-group

Evolving the Core Design Principles 5
conflict. Group markers can allow selective cooperation within groups [26], orfacilitate increased payo↵s due to the greater ease with which individuals withcommon knowledge can coordinate [27]. Ostrom also discusses her principle ofclear boundaries such that the identity of the group and the boundaries of theshared resources are clearly delineated ([6], p. 2). This implies that the abilityto easily distinguish in- and out-group members is an important component ofboundary defense. By facilitating positive assortment among members of thesame cultural groups, group markers promote decreased within-group variationand increased between-group variation, which strengthens selection at the levelof groups. We investigate the inclusion of group markers, which allow individualsto preferentially share with members of their own group ? with whom they arealso likely to share behavioral characteristics and to preferentially defend theirresources only against out-group members.
1.4 Modeling the coevolution of institutions and sustainablepractices
We apply the framework of cultural group selection to the emergence and per-sistence of sustainable practices, with a focus on the endogenous coevolution ofOstrom’s first design principle: boundaries. We present an agent-based modelin which individuals must harvest limited but renewable resources in order tothrive and survive. Sustainably-harvesting individuals avoid over-exploiting lo-cal resources, but can be out-competed in the short run by exploitative over-harvesters. We consider the simultaneous coevolution of social institutions andgroup markers.
Other multilevel selection models of social-ecological systems evolution havein general not allowed for endogenous group formation or allowed groups to varyin size [21, 28–31]. A recent model by Smaldino et al. [32] included endogenousgroup formation and variable population size, but did not investigate the in-fluence of institutions. In our model, groups emerge endogenously from spatialorganization. We do not fix population or group size, spatial extent, or groupmembership; therefore group selection arises entirely through individual-levelprocesses.
We render three hypotheses:
1. When conservation is individually costly, population persistence and sustain-able resource management requires social norms or institutional features,including shared production and boundary defense.
2. When resource conservation, sharing, and boundary defense are individuallycostly, they should not be stable without selection acting at the level of thesocial group.
3. For group-level selection to occur, social group markers must be present topromote preferential behavior toward group members.

6 Waring, Go↵, & Smaldino
2 Methods
The model simulates a simple society in which individuals harvest resources inorder to survive and reproduce. Interactions occur on a discrete square latticewith toroidal topology. The lattice is comprised of patches, each of which growsa renewable resource over time according to a logistic function with a maximumgrowth rate (r) and a carrying capacity (K). Agents occupy only one patch ata time and, similarly, patches may have only a single occupant within a giventime step. Agents can harvest resources from the patch they occupy as well asthe eight surrounding patches (their Moore neighborhood). Agents have a binaryharvesting trait (hi) which may take either high or low states. An agent with ahigh harvest trait (HH) prefers to harvest more than the maximum sustainableyield (MSY ) for a single patch, while an agent with a low harvest trait (HL)prefers to harvest less than the MSY , and is by definition sustainable.
Agents interact through the two additional behavioral traits, sharing (si) anddefense (di), and a social marker trait (gi). The behavioral traits direct agentsto share access to the resources on their patch with, or defend them against,one of three sets of neighbors: all neighbors, ingroup neighbors only, or no one.The marker trait (gi) may take one of nine possible values. The agent traitssi, di, hi, and gi are allowed to change both within an agents lifetime throughpayo↵-biased local imitation, as well as between generations through mutationof traits of o↵spring. These behavioral traits represent social norms that a↵ectthe actions taken by agents.
The model is initialized with nine groups of twelve identical, spatially clus-tered agents to allow for all combinations of the two ternary behavioral traits(sharing, defense). Agents in each group are assigned a combination of the twobehavioral traits, and groups may additionally be assigned a unique marker. Allagents are initialized with low harvesting preferences (HL), and are assigned aninitial random amount of harvested resource. Patches are initialized with a ran-dom amount of resource. In treatments where markers are active, markers areby default correlated with behavioral trait combinations (at least initially).
2.1 Simulation process order each time step
Each time step in a simulation run consists of the following processes, executedin sequential order.
1. Patch defense: Agents pay a cost to defend their focal patch from neighbors,determined by the agents exclusion criteria (no one, non-group members,everyone).
2. Harvesting: Agents harvest raw resources from their focal and neighboringpatches according to their harvesting preference.
3. Sharing: Agents have the opportunity to collaborate with a neighbor to pro-duce value-added processed resources.
4. Pay cost of living: Agents lose resources in order to stay alive.
Evolving the Core Design Principles 7
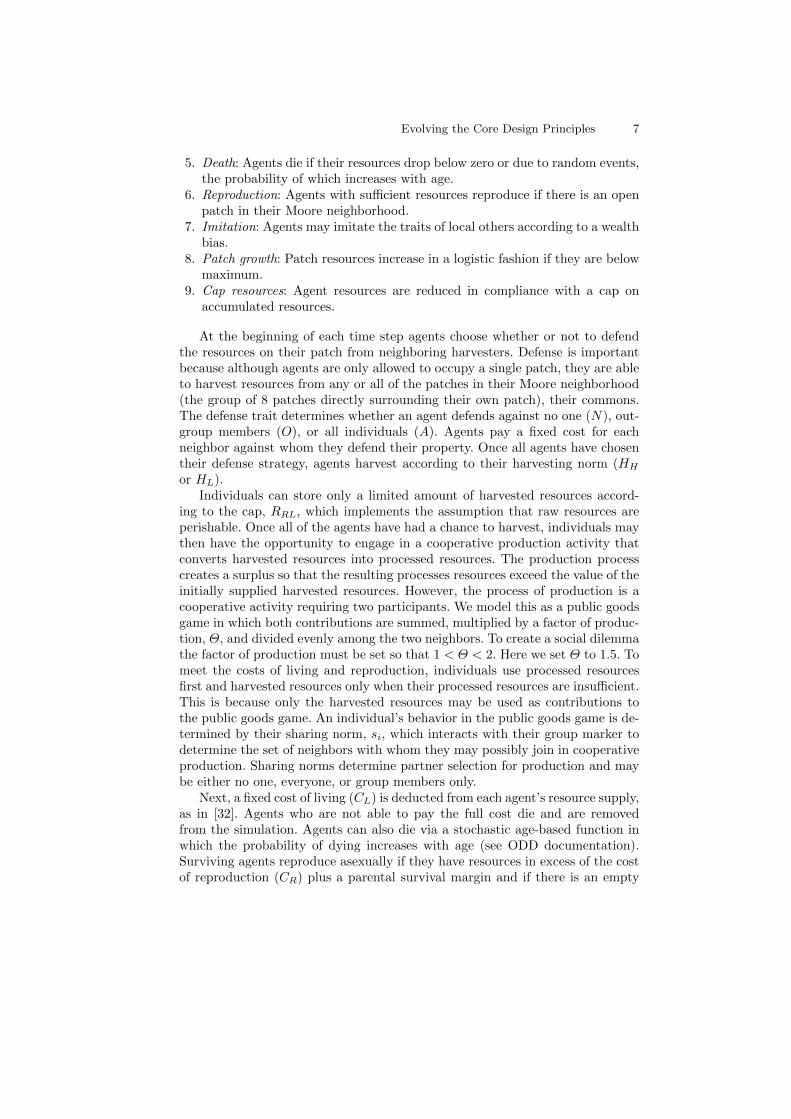
5. Death: Agents die if their resources drop below zero or due to random events,the probability of which increases with age.
6. Reproduction: Agents with su�cient resources reproduce if there is an openpatch in their Moore neighborhood.
7. Imitation: Agents may imitate the traits of local others according to a wealthbias.
8. Patch growth: Patch resources increase in a logistic fashion if they are belowmaximum.
9. Cap resources: Agent resources are reduced in compliance with a cap onaccumulated resources.
At the beginning of each time step agents choose whether or not to defendthe resources on their patch from neighboring harvesters. Defense is importantbecause although agents are only allowed to occupy a single patch, they are ableto harvest resources from any or all of the patches in their Moore neighborhood(the group of 8 patches directly surrounding their own patch), their commons.The defense trait determines whether an agent defends against no one (N), out-group members (O), or all individuals (A). Agents pay a fixed cost for eachneighbor against whom they defend their property. Once all agents have chosentheir defense strategy, agents harvest according to their harvesting norm (HH
or HL).Individuals can store only a limited amount of harvested resources accord-
ing to the cap, RRL, which implements the assumption that raw resources areperishable. Once all of the agents have had a chance to harvest, individuals maythen have the opportunity to engage in a cooperative production activity thatconverts harvested resources into processed resources. The production processcreates a surplus so that the resulting processes resources exceed the value of theinitially supplied harvested resources. However, the process of production is acooperative activity requiring two participants. We model this as a public goodsgame in which both contributions are summed, multiplied by a factor of produc-tion, ⇥, and divided evenly among the two neighbors. To create a social dilemmathe factor of production must be set so that 1 < ⇥ < 2. Here we set ⇥ to 1.5. Tomeet the costs of living and reproduction, individuals use processed resourcesfirst and harvested resources only when their processed resources are insu�cient.This is because only the harvested resources may be used as contributions tothe public goods game. An individual’s behavior in the public goods game is de-termined by their sharing norm, si, which interacts with their group marker todetermine the set of neighbors with whom they may possibly join in cooperativeproduction. Sharing norms determine partner selection for production and maybe either no one, everyone, or group members only.
Next, a fixed cost of living (CL) is deducted from each agent’s resource supply,as in [32]. Agents who are not able to pay the full cost die and are removedfrom the simulation. Agents can also die via a stochastic age-based function inwhich the probability of dying increases with age (see ODD documentation).Surviving agents reproduce asexually if they have resources in excess of the costof reproduction (CR) plus a parental survival margin and if there is an empty

8 Waring, Go↵, & Smaldino
patch within their Moore neighborhood. O↵spring inherit parental behavioraltraits and markers, each of which mutates with probability µ.
Finally, each individual attempted, with probability �, to learn from thewealthiest peer agent within a local radius, regardless of the traits or marker sta-tus of the model agent. Depending upon the treatment conditions being tested,each agent alters its harvesting, sharing, property, and/or marker traits to matchthose of the agent within a globally specified radius of the focal agent’s patchwith the highest total accumulated resources (raw and processed).
This sequence of agent-focused events is followed by the regrowth of patchresources based upon a logistic growth function such that each patch has amaximum carrying capacity of raw resources. See the ODD documentation forfurther model specification.
2.2 Design of simulation experiments
We conducted simulation experiments to address our three hypotheses. Five sim-ulation treatments varied the existence of social markers or the availability ofbehavioral or institutional options for either shared production or property de-fense. Treatments were constructed according to Table 2. The global parametersused within these treatments can be found in the ODD appendix.
Table 2. Simulation treatment conditions and hypothesis tests.
# Treatment Production Property Markers Hypothesis
1 no norms Y 12 no property Y Y 13 no production Y Y 14 both norms Y Y Y 1, 2, 35 no markers Y Y 3
For each treatment within each hypothesis test we ran 500 simulations for1000 time steps under varying conditions, with benchmark parameter values.All runs were initialized with nine groups of 12 individuals each Individualswere homogenous within groups, and all individuals are set to harvest sustain-ably. High harvesting behavior was allowed to invade through both genetic andcultural transmission, and always did. Parameter values used in our simulationsare listed in the ODD Appendix.
3 Results
In all simulations, populations underwent an initial boom as they consumed allavailable resources and grew to fill the entire spatial extent, followed by a crashwhen those resources became depleted (Fig. 1). As expected, once resources

Evolving the Core Design Principles 9
were depleted and populations crashed, the fitness advantage to harvesting ata lower rate aided the spread of conservation behavior (low harvesting) in thepopulations that manage to survive the initial crash (Fig. 2).
0
300
600
900
0 250 500 750 1000step
mea
n po
pula
tion
Population Size over time
Fig. 1. Simulated populations undergo an initial boom and bust in all conditions. (1000simulation mean ± SD)
3.1 Hypothesis 1: Long term persistence requires property andproduction norms
Over the long run, our model requires that agents consume resources sustain-ably for population persistence, but does not guarantee the emergence of thisbehavior. Here we ask if property and cooperation norms are required to stabilizealtruistic resource conservation practices (H1). To evaluate this hypothesis wecompared treatments in which social norms were allowed to evolve endogenouslywith ones in which they were fixed at a base institutional level. Treatments 1-4(Table 2) examine each of the four possibilities for the norms of cooperative pro-duction and boundary defense. These social norms did prove necessary for pop-ulation persistence and the stabilization of conservation behavior. When neitherproduction nor boundary defense norms were allowed to evolve endogenously, allpopulations went extinct by ⇠260 time steps. When only cooperative produc-tion could evolve, all populations went extinct by ⇠700 time steps. When onlyproperty rights norms evolved, ⇠12.5% of populations persisted for the entire1000 time steps, and when both property and production norms were allowed tovary endogenously, ⇠40% of populations persist through the entire time course(Fig. 3).
Persistence in the model was determined by the frequency of sustainable(low) harvesters in the population over time. Examination of the model dy-

10 Waring, Go↵, & Smaldino
0.0
0.3
0.6
0.9
0 250 500 750 1000step
cons
erva
tion
frequ
ency
Conservation frequency over time
Fig. 2. Conservation frequency grows to high levels in populations that persist. (1000simulation mean ± SD)
0.00
0.25
0.50
0.75
1.00
0 250 500 750 1000step
fract
ion
of p
opul
atio
ns re
mai
ning
Treatment
noProp−noProd
noProp−Prod
Prop−noProd
Prop+Prod
Population Persistence
Fig. 3. Population survivorship curves decline for all treatments, but populations per-sist when the norms of property and production are allowed to evolve.

Evolving the Core Design Principles 11
namics indicates that initial conservation behavior is quickly invaded by highconsumption behavior in all treatment scenarios. Thereafter, however, the thecapacity for social norms of production and boundary defense could, in someinstances, stabilize conservation and thereby potentiate population persistencein the long run.
The fraction of populations surviving declined over time for all treatmentconditions. This pattern suggests norms of boundary defense and cooperativeproduction are not su�cient to stabilize sustainable practices in the long run.Other research on the evolution of cooperative institutions suggests that addi-tional mechanisms such as conformity and punishment [12] might further stabi-lize cooperation and population persistence. One intriguing possibility is that theadditional institutional traits and social norms identified by Ostrom [5] may alsoslow this rate of decline by stabilizing resource management. Future simulationstudies will include these additional variables.
Examining the relationship between conservation frequency and populationsurvival over time, we find that while all populations experienced an initialdrop in conservation, those without necessary social norms could not bounceback by evolving a resurgence in conservation behavior, while those treatmentswith endogenous norm evolution more frequently rebound, and as a result, maypersist (Fig. 4). Thus, we find that property rights are su�cient for long-termpopulation persistence (1000 time steps) but that when production and propertynorms both evolve, chances of populations survival increases three-fold.
0.00
0.25
0.50
0.75
1.00
0.00 0.25 0.50 0.75 1.00endogenous conservation frequency
fract
ion
of p
opul
atio
ns re
mai
ning
step
0
250
500
750
1000
Treatment
noProp−noProd
noProp−Prod
Prop−noProd
Prop+Prod
Conservation Trajectories
Fig. 4. Population survivorship as a function of endogenously evolved conservationbehavior, by time and treatment.

12 Waring, Go↵, & Smaldino
3.2 Hypothesis 2: Group selection stabilizes property andcooperation norms
Having determined that the endogenous evolution of property and cooperationnorms is necessary to stabilize altruistic resource conservation practices andmaintain populations (H1), we now ask if the evolution of those norms is dueto selection between endogenously forming groups or amongst individuals (H2).To test this question we conducted two treatments; one in which the initialgroups are given distinct social markers that are inherited (and mutate at a lowrate), and a second in which the initial groups are given a single marker andmarkers are not allowed to evolve. With distinguishing groups markers, ⇠40%of populations persisted, compared with only ⇠10% without group markers.
The Price equation [33, 34] allows us to separate the components of selectioninto those acting at the level of the individual and those acting at the level of thegroup. We computed Price’s components of selection for the trait of conserva-tion behavior (low harvesting), which correspond the covariances of conservationbehavior and fitness (as measured by reproductive success) for both individu-als and group averages (Fig. 5). Individual conservation-fitness covariance wasnearly always negative in both treatments, because individuals who harvestedat high rates could outcompete those who harvested at low rates, at least in theshort run. By definition, there is no computable covariance by groups when onlyone group exists.
0.0
0.5
1.0
1.5
0 250 500 750 1000step
mea
n gr
oup
cons
erva
tion−
fitne
ss
cov
aria
nce
(nor
mal
ized)
treat
markers
nomarkers
Group selection for resource conservation
Fig. 5. Group selection of resource conservation (mean ±1 SD).
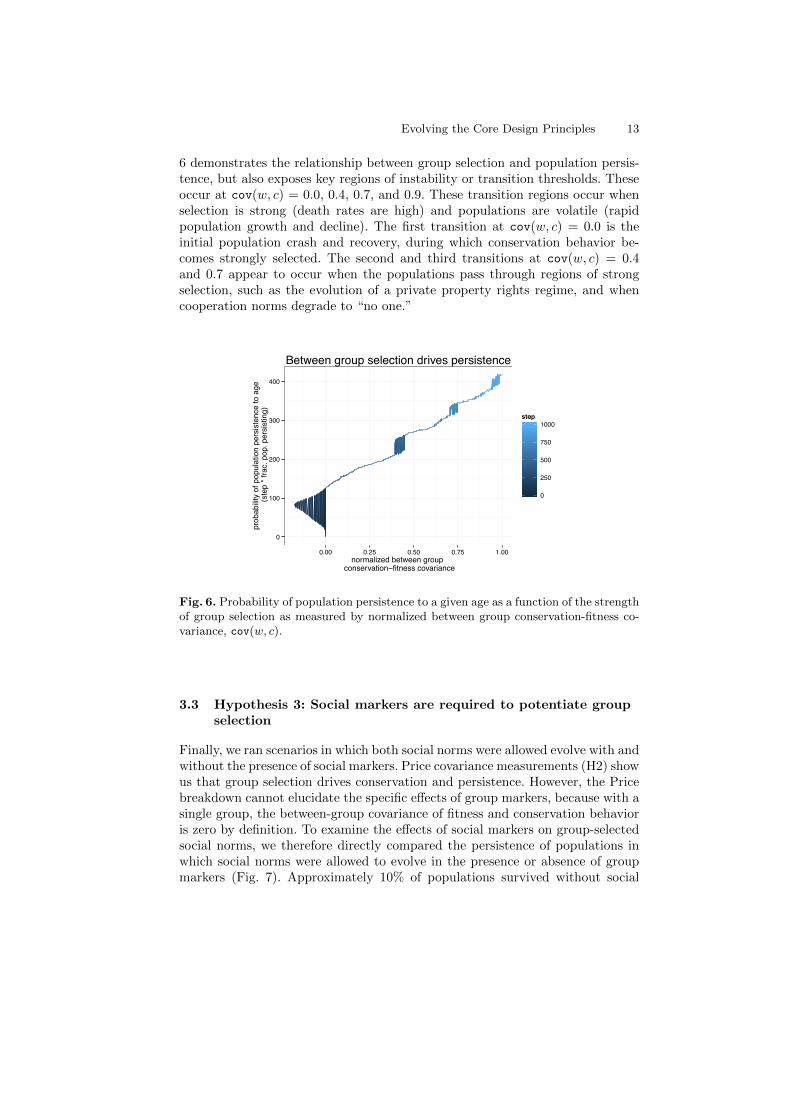
Selection for longer-lasting groups was responsible for the emergence of individual-level resource conservation and the supporting norms of production and bound-ary defense. To see this we plot the frequency with which populations persist toa given age as a function of group-level conservation-fitness covariance. Figure
Evolving the Core Design Principles 13
6 demonstrates the relationship between group selection and population persis-tence, but also exposes key regions of instability or transition thresholds. Theseoccur at cov(w, c) = 0.0, 0.4, 0.7, and 0.9. These transition regions occur whenselection is strong (death rates are high) and populations are volatile (rapidpopulation growth and decline). The first transition at cov(w, c) = 0.0 is theinitial population crash and recovery, during which conservation behavior be-comes strongly selected. The second and third transitions at cov(w, c) = 0.4and 0.7 appear to occur when the populations pass through regions of strongselection, such as the evolution of a private property rights regime, and whencooperation norms degrade to “no one.”
0
100
200
300
400
0.00 0.25 0.50 0.75 1.00normalized between group
conservation−fitness covariance
prob
abilit
y of
pop
ulat
ion
pers
iste
nce
to a
ge (s
tep
* fra
c. p
op. p
ersi
stin
g)
0
250
500
750
1000step
Between group selection drives persistence
Fig. 6. Probability of population persistence to a given age as a function of the strengthof group selection as measured by normalized between group conservation-fitness co-variance, cov(w, c).
3.3 Hypothesis 3: Social markers are required to potentiate groupselection
Finally, we ran scenarios in which both social norms were allowed evolve with andwithout the presence of social markers. Price covariance measurements (H2) showus that group selection drives conservation and persistence. However, the Pricebreakdown cannot elucidate the specific e↵ects of group markers, because with asingle group, the between-group covariance of fitness and conservation behavioris zero by definition. To examine the e↵ects of social markers on group-selectedsocial norms, we therefore directly compared the persistence of populations inwhich social norms were allowed to evolve in the presence or absence of groupmarkers (Fig. 7). Approximately 10% of populations survived without social

14 Waring, Go↵, & Smaldino
marking. In these runs, populations were able to make a successful evolutionarytransition to resource conservation. The availability of group markers, however,enabled much more rapid evolution of the same social norms of property andproduction, thereby allowing a much greater fraction of populations to survive.
0.00
0.25
0.50
0.75
1.00
0 250 500 750 1000step
Frac
tion
of p
opul
atio
ns re
mai
ning
treat
markers
nomarkers
Population Persistence
Fig. 7. Population persistence by the availability of social marking.
4 Conclusion
A model of endogenous group formation and evolution was built to examine thee↵ects of group selection on individually costly resource conservation and relatedsocial norms. We have shown population persistence is dramatically enhanced bythe endogenous emergence of two social norms, property defense and cooperativeproduction, and that such an emergence occurs roughly 40% of the time. We thendemonstrated that costly conservation behavior is favored by selection at thegroup level. Finally we have shown that the evolution of norms and institutionsthat promote cooperation – in the form of sustainable harvesting – is stronglyfacilitated by the presence of group markers that enable di↵erential behaviortoward in- and out-group individuals.
These findings have two major implications. First, our results show thatevolutionary models that allow for group structure can elucidate mechanismsby which cooperative cultural institutions in general, and Ostrom’s core designprinciples in particular, can emerge. The very first of Ostrom’s principles forrobust social-ecological systems management is that of usage boundaries on re-source consumption. In our model, property regimes in the form of boundarydefense emerge endogenously when social markers are allowed to evolve. Whenproperty regimes emerge, they dramatically enhance resource conservation and

Evolving the Core Design Principles 15
population sustainability. Our model therefore demonstrates that key social andinstitutional conditions for sustainability can be understood as the dynamic re-sult of an ongoing process of cultural evolution at multiple organizational levels.It therefore stands to reason that the rest of Ostrom’s principles may also beso modeled. This paper represents the first stage of a project aiming to do justthat.
Secondly, our findings support an evolutionary theory of human socialitysometimes called the “tribal social instincts” model [35, 16]. The theory suggeststhat human social groups, and the psychological capacities that make socialgroups possible (ethnic marking, parochial altruism, etc.) evolved because theyaided groups in solving collective action problems such as resource capture andmanagement. Increasingly, research and theory suggest that our psychology wasshaped by our extreme levels of sociality, particularly social organization intodistinguishable groups [36, 37] . Our model shows that the ability to belongto a clearly delineated group – to distinguish individuals based on social cuesand di↵erentiate ones self with new social markers – is a feature that aids theevolution of institutions that solve the prisoner’s dilemma of limited resource use.In fact our model supports the idea that group psychology – including cognitivecapacities for cultural norms [17] such as property – enhance the evolution ofcollective action solutions.
References
1. Myers, R.A., Worm, B.: Rapid worldwide depletion of predatory fish communities.Nature 423 (2003) 280–283
2. Boyd, R., Richerson, P.J.: Culture and the evolutionary process. University ofChicago Press, Chicago, IL (1985)
3. Mesoudi, A.: Cultural evolution: How Darwinian theory can explain human cultureand synthesize the social sciences. University of Chicago Press, Chicago, IL (2011)
4. North, D.C.: Institutions, institutional change and economic performance. Cam-bridge University Press, Cambridge, UK (1990)
5. Ostrom, E.: Governing the commons: The evolution of institutions for collectiveaction. Cambridge University Press, Cambridge, UK (1990)
6. Wilson, D.S., Ostrom, E., Cox, M.E.: Generalizing the core design principles forthe e�cacy of groups. J Econ Behav Organ in press (2013)
7. Hardin, G.: The tragedy of the commons. Science 162 (1968) 1243–12488. Smith, J.M.: Evolution and the theory of games. Cambridge University Press,
Cambridge, UK (1982)9. Nowak, M.A., May, R.M.: Evolutionary games and spatial chaos. Nature 359
(1992) 826–82910. Killingback, T., Bieri, J., Flatt, T.: Evolution in group-structured populations can
resolve the tragedy of the commons. Proc R Soc Lond B 273 (2006) 1477–148111. Smaldino, P.E., Schank, J.C.: Movement patterns, social dynamics, and the evo-
lution of cooperation. Theor Popul Biol 82 (2012) 48–5812. Boyd, R., Richerson, P.J.: Punishment allows the evolution of cooperation (or
anything else) in sizeable groups. Ethol Sociobiol 13 (1992) 171–195

16 Waring, Go↵, & Smaldino
13. Hauert, C., Traulsen, A., Brandt, H., Nowak, M.A., Sigmund, K.: Via freedom tocoercion: The emergence of costly punishment. Science 316(5833) (2007) 1905–1907
14. Nowak, M., Sigmund, K.: Evolution of indirect reciprocity. Nature 437 (2005)1291–1298
15. Henrich, J.: Cultural group selection, coevolutionary processes and large-scalecooperation. J Econ Behav Organ 53 (2004) 3–35
16. Richerson, P.J., Boyd, R.: Not by genes alone: How culture transformed humanevolution. University of Chicago Press, Chicago, IL (2005)
17. Chudek, M., Henrich, J.: Culture-gene coevolution, norm-psychology and the emer-gence of human prosociality. Trends Cogn Sci 15 (2011) 218–226
18. Wilson, D.S., Wilson, E.O.: Rethinking the theoretical foundation of sociobiology.Q Rev Biol 82 (2007) 327–348
19. Bell, A.V., Richerson, P.J., McElreath, R.: Culture rather than genes providesgreater scope for the evolution of large-scale human prosociality. Proc Natl AcadSci USA 106 (2009) 17671–17674
20. Smaldino, P.E.: cultural evolution of emergent group-level traits. Behav Brain Sciin press (2013)
21. Bowles, S., Choi, J.K., .Hopfensitz, A.: The co-evolution of individual behaviorsand social institutions. J Theor Biol 223 (2013) 135–147
22. van der Bergh, J.C.J.M., Gowdy, J.M.: A group selection perspective on economicbehavior, institutions and organizations. J Econ Behav Organ 72 (20009) 1–20
23. Richerson, P.J., Henrich, J.: Tribal social instincts and the cultural evolution ofinstitutions to solve collective action problems. Cliodynamics 3 (2012) 38–80
24. Winterhalder, B.: Diet choice, risk, and food sharing in a stochastic environment.J Anthropol Archaeol in press (1986) 451–463
25. Rousseau, J.J.: A discourse on inequality. Penguin Books, London (1755/1984)26. Hammond, R.A., Axelrod, R.: The evolution of ethnocentrism. J Conflict Res 50
(2006) 926–93627. McElreath, R., Boyd, R., Richerson, P.J.: Shared norms can lead to the evolution
of ethnic markers. Curr Anthropol 44 (2003) 122–12928. Bowles, S., Choi, J.K.: Coevolution of farming and private property during the
early holocene. Proc Natl Acad Sci USA in press (2013)29. Boyd, R., Gintis, H., Bowles, S., Richerson, P.J.: The evolution of altruistic pun-
ishment. Proc Natl Acad Sci USA 100 (2003) 3531–353530. Garcıa, J., van der Bergh, J.C.J.M.: Evolution of parochial altruism by multilevel
selection. Evol Hum Behav 32 (2011) 277–28731. Safarzynska, K.: The coevolution of culture and environment. J Theor Biol 322
(2013) 46–5732. Smaldino, P.E., Schank, J.C., McElreath, R.: Increased costs of cooperation help
cooperators in the long run. Am Nat 181 (2013) 451–46333. Price, G.R.: Extensions of covariance selection mathematics. Annu Hum Genet
Lond 35 (1972) 485–49034. Okasha, S.: Evolution and the levels of selection. Oxford University Press, Oxford,
UK (2006)35. Richerson, P.J., Boyd, R.: The evolution of subjective commitment to groups:
A tribal instincts hypothesis. In Neese, R., ed.: Evolution and The Capacity forCommitment, New York, Russell Sage Foundation (2001) 186–220
36. Caporael, L.R.: Coordinating bodies, minds and groups: Evolution and humansocial cognition. J Soc Evol Sys 19 (1996) 261–275

Evolving the Core Design Principles 17
37. Brewer, M.B.: Taking the origins of human nature seriously: Towards a moreimperialist social psychology. Pers Soc Psychol Rev 8 (2004) 107–113

1
Group Selection and Sustainability - ODD Protocol
1. Purpose
This model was constructed for the purpose of exploring the conditions under which sustaina-ble management of a renewable and exhaustible natural resource is able to emerge within a simple society characterized by the potential for collaborative production for surplus and ru-dimentary group structure and mechanisms. Specifically, the model aims to simulate the emergence of key social and economic norms, Elinor Ostrom’s Core Design Principles, com-monly found in successful resource management institutions. The model allows social groups and economic regimes to emerge endogenously, and proliferate when successful, and fail due to resource collapse, to uncover those factors which increase the frequency of sustainable re-source management.
2. Entities, state variables, and scales
Entities in the model include agents (individuals) and spatial units (patches of land). Although social groups exist, they do not act collectively, rather the agents’ behavior is at times dependent upon group affiliations.
− Agents. The agents in the model have four primary traits which govern behavior; group identity, sharing trait, harvesting trait, and defense trait. In addition, agents are identified by the NetLogo program by a number, who, and their location is defined by the patch upon which they are standing. Agents are also characterized by their age, their lifetime reproductive success and the individual they choose to imitate. Three resource variables are associated with agents; a running total of the resources accumulated within a time step, as well as two accumulated resource totals, raw and processed. Table 1 lists the state variables and provides a brief description of each.
Table 1. Agent variables Variable Description Bounds
Group identity, gi Marker that identifies agent as a member of a given social group [1,9]
Sharing trait, si Ternary trait determining agent’s behavior in a pairwise sharing encounter: share with no one (N), group members (G), or all indi-viduals (A)
A,N,G
Harvesting trait, hi Binary trait (high harvesters and low harvesters) determining max-imum raw resources an agent attempts to harvest from its available land
H,L
Defense trait, di Ternary trait determining which neighboring agents an agent will defend its property (and, specifically, its harvestable resources) against: defend against no one (N), out-group members (O), or all individuals (A)
A,N,O

2
Agent identity, whoi Identifier associated with the agent (internal to NetLogo) positive integer
Agent location, patch_ati
Location associated with the agent (internal to NetLogo) as defined by the patch the agent is currently standing on
(x,y) integer pair
Agent age, agei Number of simulation time steps the agent has survived positive integer
Harvested amount, Hi Running total of the amount of resource that has been harvested at a given time step
positive integer
Raw resources, ri Accumulated resources harvested from the land positive integer
Processed resources, pi
Accumulated resources produced by contributing raw resources to a cooperative process (modeled as a two-person public goods game)
positive integer
Agent to copy, copyi Neighboring individual that the agent has chosen to imitate within the time step
positive integer
Reproductive success, rsi
Running total of the number of offspring of an agent within its lifespan
positive integer
− Patches. These entities have only two attributes, patch resources and patch regrowth rate.
These are listed in Table 2 below along with their descriptions.
Table 2. Patches and their state variables Variable Description Bounds!Patch resources, cropj Amount of resource currently growing upon the patch positive inte-
ger!Patch regrowth, prj Local patch maximum intrinsic rate of growth positive inte-
ger!
− Environment. The model has no externally varying environmental conditions. − Collectives. Although agents have a group identity, this group does not act as a collective. No joint decisions are made, and although social identity is shared, all actions are individual.
− Spatial and Temporal Scales. Each grid cell or patch represents a one hectare plot of land. The model is a 32 x 32 torus. Each time step represents approximately one year.

3
3. Process overview and scheduling
The following provides a general version of the process overview and scheduling followed by pseudo-code detail. For more detail regarding each of the procedures, please see the submodels section.
1. Set up model world: Agents, patches and globals are set up. 2. Patch defense: Agents pay a cost to defend their focal patch. 3. Harvesting: Agents harvest raw resources from their focal and neighboring patches. 4. Sharing: Agents have the opportunity to collaborate with a neighbor to produce added-
value processed resources. 5. Pay cost of living: Agents lose resources in order to stay alive. 6. Death: Agents die if their resources drop below zero or due to a random events, the
probability of which increases with age. 7. Reproduction: Agents with sufficient resources attempt to reproduce. 8. Migration: Agents move to an empty neighboring patch. 9. Imitation: Agents may imitate the traits of others with certain biases. 10. Patch growth: Patch resources increase if they are below maximum. 11. Aging: Agents grow older. 12. Cap resources: Agents cannot hold resources above a threshold between rounds.
− Process overview and scheduling, pseudo-code.
1. Setup the model world • clear all entities and variables • set up the treatments for testing hypotheses (set global parameters) • set up the remaining global parameters that are not set within the treatments set the
amount of resources on the patches to some random number between 0 and the carrying capacity
• set all patches to initially be unowned/undefended • color the patches according to the amount of resource on the patch (for visualization
purposes only) • create an agent for each combination of defense trait and share trait • have each agent create n-1 more agents where n is the desired total number of agents
per group • move these new agents to the closest patch to the group-creating agent that is empty • apply treatment conditions to agent traits • set all of the agents to be low harvesters • set the agents' initial processed resources to a random amount between 0 and the cost
of reproduction • if the agent is a low harvester
o set the agent's shape to be a circle o otherwise, set the agent's shape to be a square
• reset the time step counter 2. Go/actions - repeated until simulation is aborted
• if there are no agents left in the world o stop the simulation

4
• agents choose to defend their property based upon their defense trait and pay cost of defense
• agents harvest their preferred amount based upon their harvest trait • if there is another individual in the agent's Moore neighborhood
o play a public goods game with a random neighbor • agents' resources, starting with processed resources, are reduced by the cost of living • if agent's resources are less than 0 or stochastic age-based expression is true
o agent dies • if agent's total resources exceed the cost of reproduction and there is an empty patch in
the Moore neighborhood o agent creates an offspring
• if a random number between 0 and 99 is less than the probability of migration and there is an empty patch in the Moore neighborhood
o agent migrates to the patch in the Moore neighborhood with the most resource • if a random number between 0 and 99 is less than the probability of imitation and
there is another individual available o imitate an individual according to imitate trait
• if the resources on the patch are greater than zero • regrow resource according to logistic growth function subject to a given carrying ca-
pacity o otherwise, allow a very small chance of regrowth on an empty patch
• increase agents' age by 1 • reduce agents' resources to comply with resource caps • recolor patches based upon the amount of resource remaining • if the agent is a low harvester
o set the agent's shape to be a circle o otherwise, set the agent's shape to be a square
• advance to next time step
4. Design concepts Basic principles. This model places a spatially-explicit ABM of the evolution of cooperation within the context of a social-ecological system. It draws upon theory regarding cooperation, commons dilemmas, group selection, and Elinor Ostrom’s Core Design Principles. Emergence. Spatially coherent social groups of like agents emerge endogenously. Groups that persist sometimes consist of “groupish” and cooperative agents who harvest at low levels. Adaptation. Agents adapt at both genetic and cultural levels. Agents have a simple 4 locus ‘behaviorome’ [share, harvest, defense, marker]. In the analog of genetic adaptation, muta-tion of all these traits occurs with some given probability at reproduction. Death and differen-tial reproduction then create selection and adaptation on these loci over time. In the cultural analog, agents adapt every round through a process of payoff-biased imitation.
Objective. Agents do not have internalized goal states, or encoded objectives. Learning. There is no learning in this model.

5
Prediction. There is no prediction in this model.
Sensing. Agents can sense the group marker of the other agents in its neighborhood or within a certain radius of their patch. Agents are also able to sense the amount of resource on their current patch as well as the amount of resource on neighboring patches. At times, agents are able to observe the wealth of neighbors.
Interaction. Agents interact with patches by harvesting resources. Agents interact with other agents through defense of their patch, engagement in cooperative production and imitation.
Stochasticity. There is stochasticity in the initialization of patch resources, in the placement of the initial agents, in the assignment of traits to agents, in migration, imitation, and mutation of offspring traits, and in all probabilistic procedures. Collectives. Each agent-agent interaction for the purposes of cooperative production can be seen as a brief collective in that the payoff received from the public goods game is dependent upon the participation of both actors and is split between the two parties. The collective then splits at the end of the round. Alternatively socially-marked groups can be seen as collectives, with common social marking, (and, depending on the group) common sharing, and harvesting traits. Collectives do not however perform collective behaviors per se. Each Moore neigh-borhood of patches is a resource collective, a commons. Agents are able to harvest from any of the patches in their commons subject to the defense traits of any owners of those patches. Observation. We collected population size, frequency of low harvest norm, frequencies of each production norm, frequencies of each property norm, number of groups, mean individual conservation-fitness covariance, and group conservation-fitness covariance by timestep.
5. Initialization
The model world is initialized with nine groups of 12 agents each. Groups are located ran-domly on the 32x32 patch grid. All individuals begin the simulations with the conservative harvesting trait.
The following global parameters, listed below in Table 3, are set at model initialization. The values at which they are set within the model are detailed in section eight, Simulation experi-ments/model analysis.
Table 3. Global parameters Parameter Symbol Description Value Max growth rate! r! The maximum rate of (logistic) growth for the patch re-
sources!0.5!
Carrying capacity K The maximum resources a patch can contain 200 Lattice size L The width and length of the square lattice 32 x 32 numGroups Ginit The initial number of groups. 9 Harvest gap GH The proportion of MSY by which high harvesting amount
exceeds low harvest amount 1
Sharing propor-tion
γ The maximum proportion of an agent’s raw resources it contributes to a pairwise public goods game.
0.5
Marginal defense cost
CD The cost of defending a patch for each neighbor an agent defends against
1
Imitation proba- λ The probability that an agent imitates a trait of another agent. 5%

6
bility Independent for each trait (sharing, harvesting, defense). (0.05) Imitation radius The radius (neighborhood size) within which models for
imitation can be found. 2
Public goods production factor
Θ The amount the raw resources contributed to the public goods game are multiplied by to yield the payoffs in pro-cessed resources. Constraint: 1 < Θ < 2.
1.5
Mutation rate µ The independent probability that each offspring trait is not copied from the parent but is randomly selected.
0.3% (0.003)
Migration rate m The probability that an agent attempts to move to a neighbor-ing patch. Set to zero in the current model.
0
Mutate markers Boolean. If true, agents may also mutate their group markers. [0,1] Raw resource cap The maximum amount of raw resources an agent can accu-
mulate 1,000,000
Processed re-source cap
The maximum amount of processed resources an agent can accumulate
1,000,000
Production Boolean. If true, cooperative production may take on values other than the base institution (no production).
[0,1]
Property Boolean. If true, property defense may take on values other than the base institution (no defense).
[0,1]
Markers Boolean. If true, agents may take on markers values that differentiate them from other agents.
[0,1]
Calculated Parameters!
Description!
Calculation!
Maximum sus-tainable yield
MSY Maximum sustainable yield. floor ((K * r) / 4)
High harvesting rate
HH The maximum amount of raw resources a high harvester attempts to extract from its commons.
floor ((1 - (GH / 2)) * MSY)
Low harvesting rate
HL The maximum amount of raw resources a low harvester attempts to extract from its commons.
floor ((1 + (GH/ 2)) * MSY)
Cost of living CL The amount of resources lost by an agent each time step. Agents can use either raw or processed resources to pay this cost.
floor (0.2 * MSY)
Cost of reproduc-tion
CR The amount of resources an agent loses when it reproduces.
floor (2 * (HH - CL))
6. Input data
This model does not use input data to represent time-varying processes or spatial patterns.
7. Submodels
Patch defense – Agents pay a cost to defend their focal patch. − If di = N, the agent does not pay a cost and the patch is undefended. − If di = O, the agent pays CD for each out-group agent in its neighborhood. Those
agents are then prevented from harvesting on the agent’s focal patch this time step. − If di = A, the agent pays CD for each agent in its neighborhood (including in-group
neighbors). Those agents are then prevented from harvesting on the agent’s focal patch this time step.
− If the agent does not have sufficient resources to pay its costs, it does not pay them and its patch can be harvested by neighbors.

7
− Costs are deducted first from processed resources, and are only deducted from raw re-sources once processed resources are depleted.
Harvesting – Agents harvest raw resources from their focal and neighboring patches.
− Agents are able to harvest (defined as decreasing a patch’s patchResource by some amount and adding the same amount to the agent’s agentWealth) from their commons, defined as their focal patch plus the patches in their Moore neighborhood, excluding any patches that are defended against them.
− This procedure starts by asking the agent to add up all the resources in their commons. If this amount is less than the agent’s harvest amount as determined by their harvest-ing trait, they harvest the entire commons by adding the resources to their raw re-sources and setting patchResource of all of the patches in their commons to 0.
− If there are more resources in the commons than they need, they start by harvesting from the patch with the most resources and continue harvesting from decreasingly plentiful patches until they have harvested the desired amount of resource.
− This procedure relies upon NetLogo’s internal scheduling capabilities to ensure that the same agents do not always harvest first, thereby avoiding any resource harvesting bias.
Sharing – Agents have the opportunity to collaborate with a neighbor to produce added-value processed resources.
− Each agent executes the following process in random order. − An agent chooses a random agent in their neighborhood (if any), and the two play a
two-person public goods game. − An agent’s contribution xi is equal to zero if the agent shares with no one (N) or if the
agent shares with in-group members (G) and its partner is not a member of its group. Otherwise, the agent contributes a proportion of its raw resources. An agent’s contri-bution is calculated using the following algorithm:
o if pi + ri < CL ! xi = 0
o else if pi + (1 – γ)ri ≥ CL ! xi = γri
o else ! xi = pi + ri – CL
− If an agent has insufficient resources, it only contributes the fraction of its raw re-sources such that it retains enough total resources to pay the cost of living.
− The total contribution of both agents is multiplied by a factor Θ and divided evenly be-tween both agents.
Pay cost of living – Agents lose resources in order to stay alive.
− Each agent loses CL resources. Resources are first taken from processed resources, and then raw resources if the agent does not have enough processed resources.
Death – Agents die if their resources drop below zero or due to a random events, the probabil-ity of which increases with age.
− Agents are removed from the simulation if either o Their total resources are less than zero. o They randomly die as per an age-linked function:
Pr !"# = !!!!"#![!"!!"#! ]

8
Reproduction – Agents with sufficient resources attempt to reproduce. − If an agent has total resources greater than or equal to the cost of reproduction (i.e., pi
+ ri ≥ CR) and if there is an empty space somewhere in the agent’s Moore neighbor-hood, the agent loses the cost of reproduction (with deductions from processed re-sources first) and produces an offspring on the chosen patch.
− The offspring’s initial resources are set to zero. − The offspring’s sharing, harvesting, and defense traits are each identical to the parent’s
with probability 1 – µ, and are randomly selected otherwise. Mutation for each trait is independent.
Migration – Agents move to an empty neighboring patch.
− With probability m, an agent attempts to move. − The agent selects a random empty patch in its Moore neighborhood (if any), and
moves there. − In the current model, m = 0.
Imitation – Agents may imitate the traits of others with certain biases.
− An agent decides to imitate the trait(s) of another agent with probability λ. − If so, the agent looks among the other agents in its imitation radius for a model to imi-
tate. − If the imitation treatment is group (G), the model must also be chosen from among on-
ly those agents who have the focal agent’s group identity. Otherwise, if the imitation treatment is all (A), the model can be chosen from among all agents in the imitation radius.
− A model is chosen using one of the following imitation biases: o Payoff (P): The model is the agent with the most total (raw + processed) re-
sources. o Green (G): The model is chosen randomly from among those agents with a low
harvesting trait. o Random (R): The model is chosen randomly. o Conformity (C): The most common behavior among the other agents in its imi-
tation radius is selected. ! These imitation biases may be merged.
− Depending on the global parameters, any or all of the following traits – harvesting, sharing, and group identity – may be imitated.
Patch growth – Patch resources increase if they are below maximum.
− If the patch resources are nonzero, they grow according to a density-dependent logistic function:
o !!!! = !! 1− ! 1− !!!
o where r is the maximum intrinsic rate of growth and K is the carrying capacity. − Otherwise, if the patch resources are zero (i.e., they have been completely depleted,
they are set to 3 (a low number) with probability of 0.001. Aging – Agents grow older.
− Agents increase their age by 1. − This only affects their probability of dying randomly.
Cap resources

9
− The raw and/or processed resources are capped at their maxima each time step.
8. Simulation experiments/model analysis
We tested our hypotheses with a set of five experimental treatments. These five treatments vary three parameters, each of which represents the possibility of endogenous cultural evolu-tion in a certain type of individual trait. The three traits are: production norms, property norms, and social markers. These parameters are combined in treatments as follows:
Table 4. Treatment conditions Treatment Name Production Property Markers Hypothesis
1 no norms Y 1
2 no prop Y Y 1
3 no prod Y Y 1
4 both norms Y Y Y 1,2,3
5 no markers Y Y 3
These treatments were applied to test the three hypotheses as follows
1. Hypothesis 1: When conservation is individually costly, population persistence and sustainable resource management requires social norms or institutional features, in-cluding shared production and boundary defense.
• Treatments 1,2,3,4 2. Hypothesis 2: When resource conservation, sharing, and boundary defense are indi-
vidually costly, they should not be stable without selection acting at the level of the social group.
• Treatment 4, within and between group covariance 3. Hypothesis 3: For group-level selection to occur, social group markers must be present
to promote preferential behavior toward group members.
• Treatment 4,5 All individuals begin the simulations with the conservative harvesting trait, and social norms are initialized so that individuals are homogenous within groups. When markers are present, groups begin with different markers, which may then evolve via imitation and mutation. When social marking is disabled, all individuals have a single marker trait that does not vary. Likewise, when either production or property norms are active, one entire group is initialized with each unique combination of norms, so that initial populations are always identical. For instance, if only one norm type is active, for instance, then three groups will be initialized with each of the three property norm states. When both norms are active, then one group will be initialized with each of the nine combinations of states of the two norms. Global variable values used within the treatments are as detailed in Table 3.