evolving treatment and management strategies · evolving treatment and management strategies ......
TRANSCRIPT
Indeterminate Thyroid Nodules Evolving Treatment and Management
Strategies
Jennifer Sipos, MD Associate Professor of Medicine
Director, Benign Thyroid Disorders Program Division of Endocrinology
Disclosures
• Genzyme Advisory Board • Research Funding Veracyte
Outline
• Epidemiology • Risk of malignancy with indeterminate
cytology • Clinical and imaging considerations of
nodules with indeterminate cytology • Molecular markers in FNA
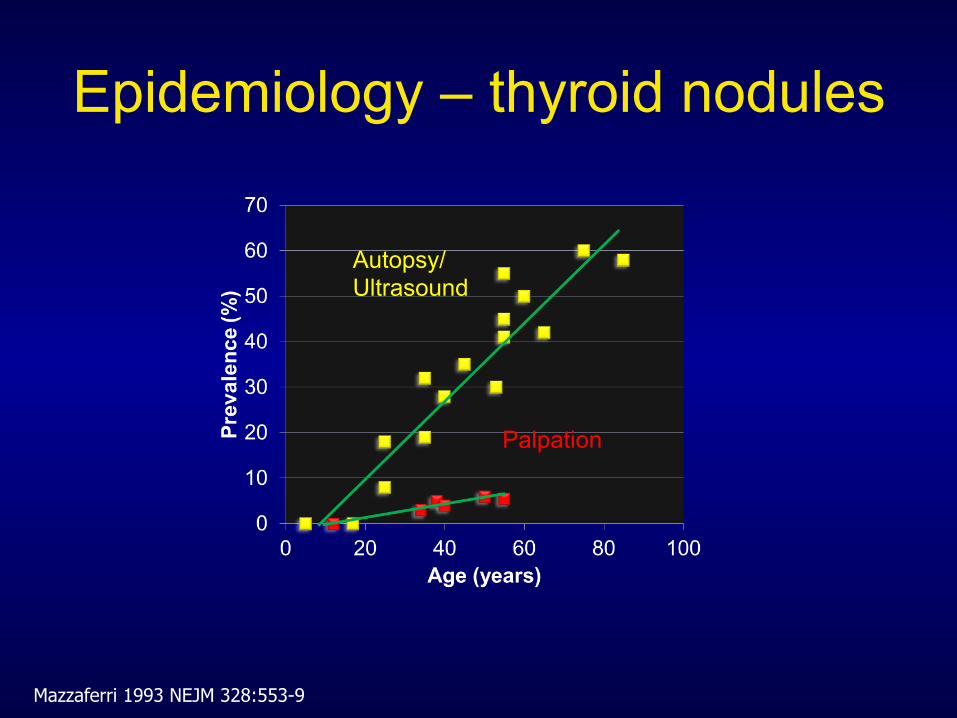
Epidemiology – thyroid nodules
Mazzaferri 1993 NEJM 328:553-9
Palpation
Autopsy/ Ultrasound
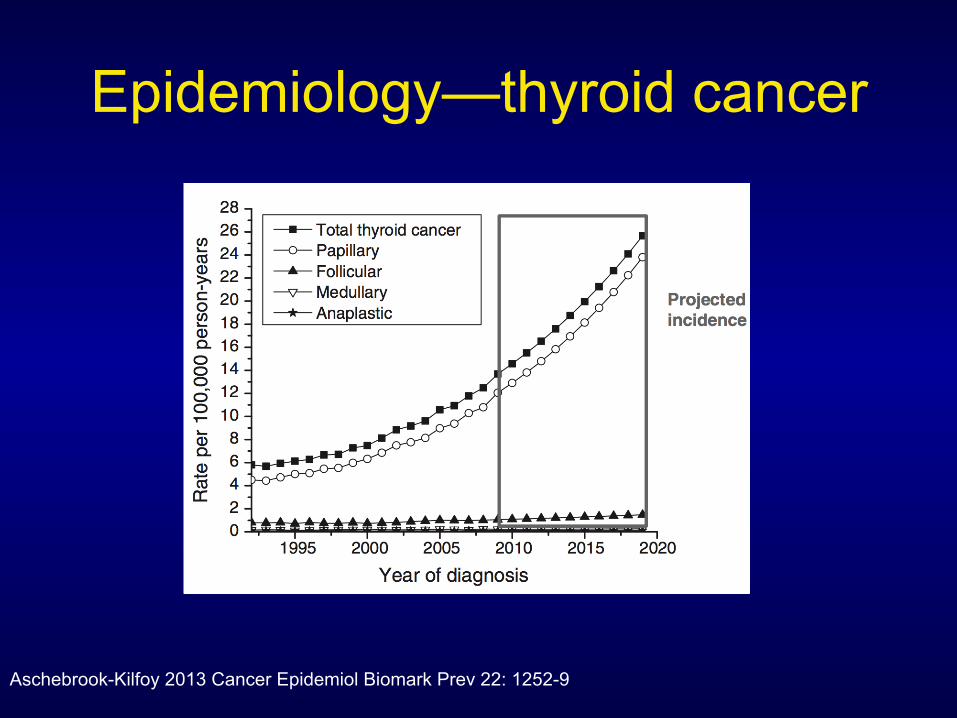
Epidemiology—thyroid cancer
Aschebrook-Kilfoy 2013 Cancer Epidemiol Biomark Prev 22: 1252-9
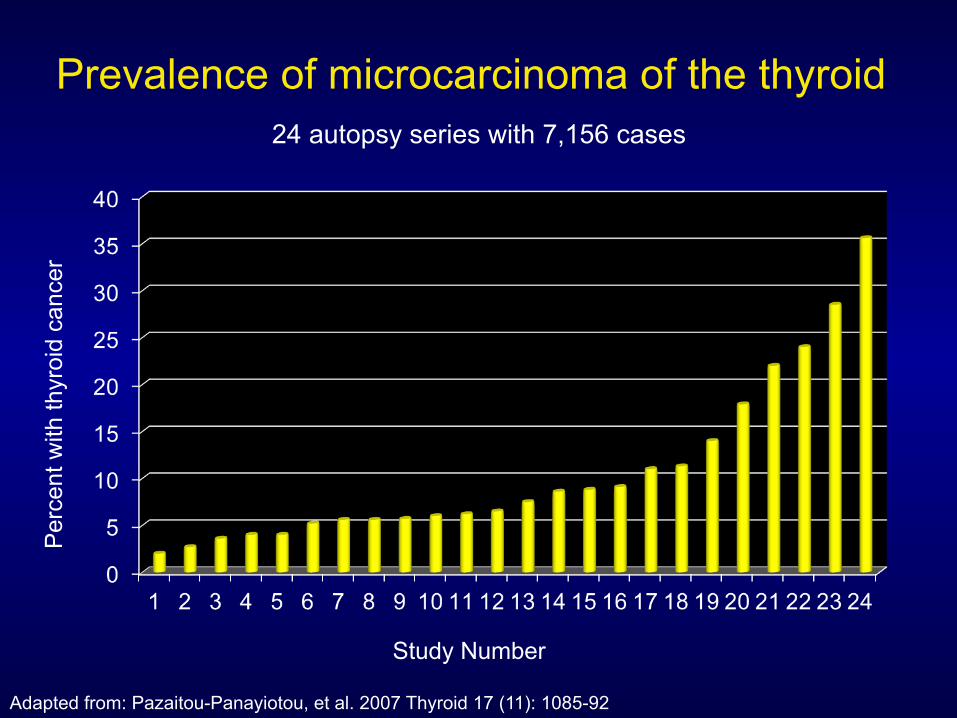
Prevalence of microcarcinoma of the thyroid 24 autopsy series with 7,156 cases
Per
cent
with
thyr
oid
canc
er
Study Number
Adapted from: Pazaitou-Panayiotou, et al. 2007 Thyroid 17 (11): 1085-92
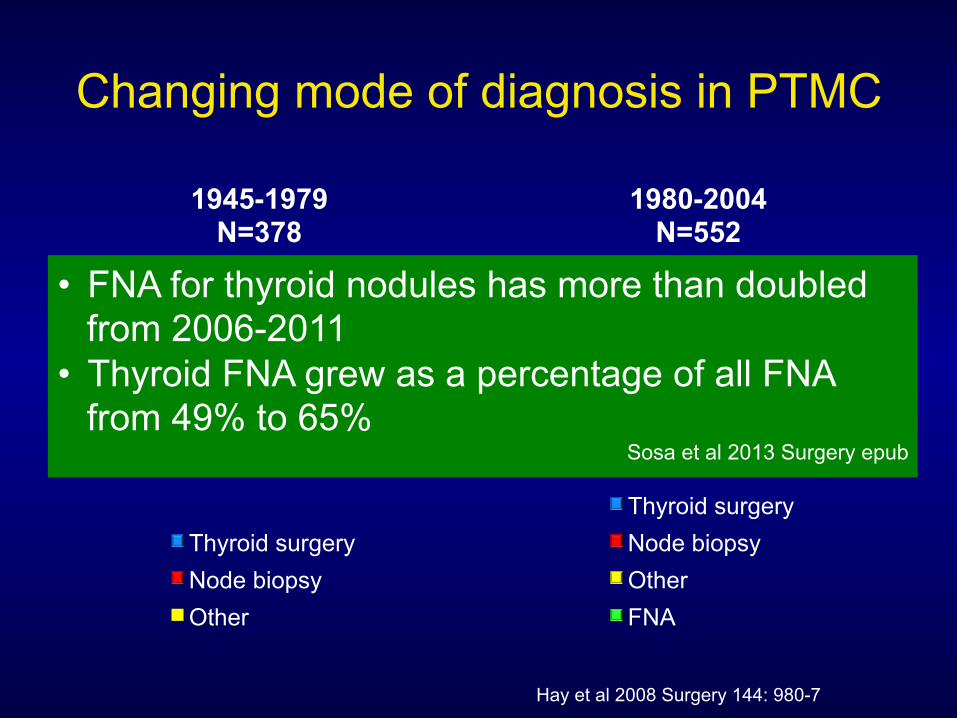
Changing mode of diagnosis in PTMC
69%
19%
12%
1945-1979 N=378
Thyroid surgery Node biopsy Other
32%
13% 13%
42%
1980-2004 N=552
Thyroid surgery Node biopsy Other FNA
Hay et al 2008 Surgery 144: 980-7
• FNA for thyroid nodules has more than doubled from 2006-2011
• Thyroid FNA grew as a percentage of all FNA from 49% to 65%
Sosa et al 2013 Surgery epub
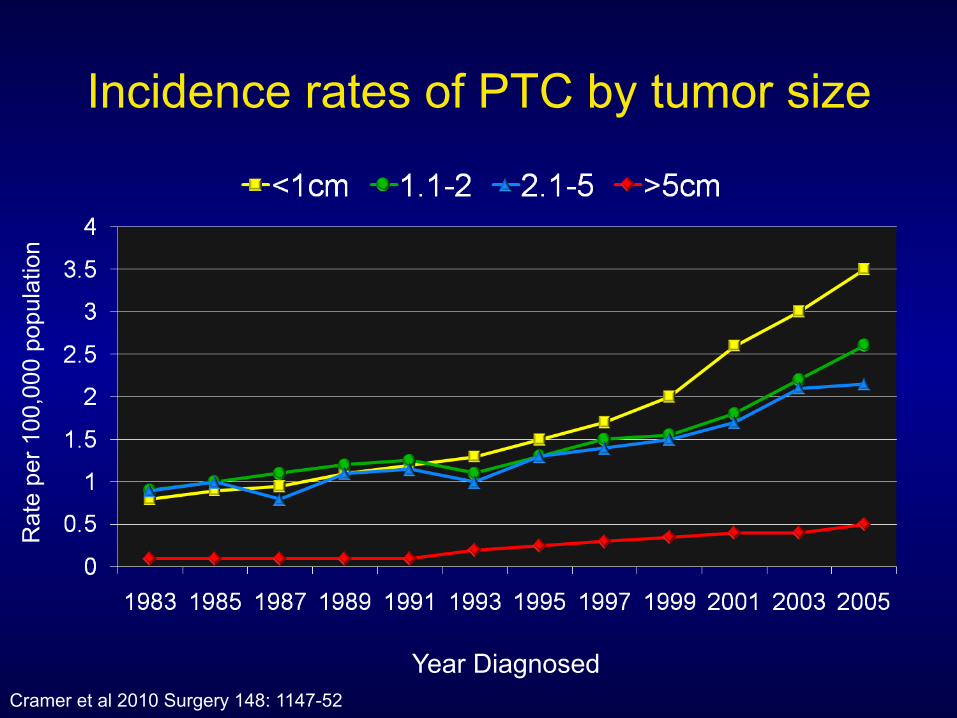
Incidence rates of PTC by tumor size R
ate
per 1
00,0
00 p
opul
atio
n
Year Diagnosed Cramer et al 2010 Surgery 148: 1147-52
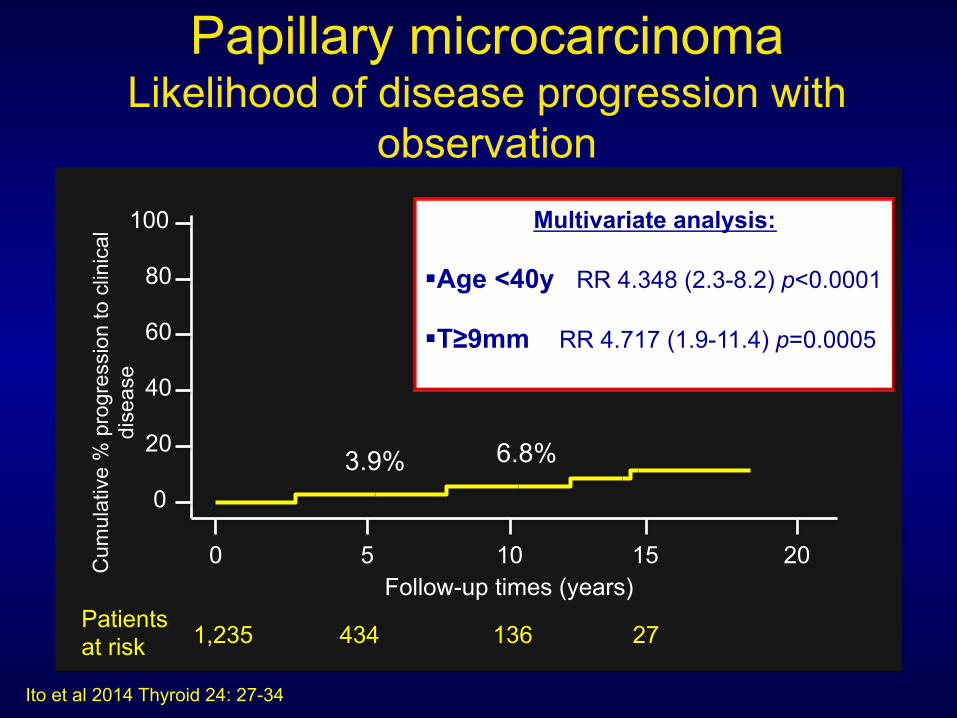
Papillary microcarcinoma Likelihood of disease progression with
observation
Ito et al 2014 Thyroid 24: 27-34
0 5 10 15 20
20
0
40
60
80
100
Follow-up times (years) Patients at risk 1,235 434 136 27
Cum
ulat
ive
% p
rogr
essi
on to
clin
ical
di
seas
e
3.9% 6.8%
Multivariate analysis: ! Age <40y RR 4.348 (2.3-8.2) p<0.0001
! T≥9mm RR 4.717 (1.9-11.4) p=0.0005
Thyroid Nodules
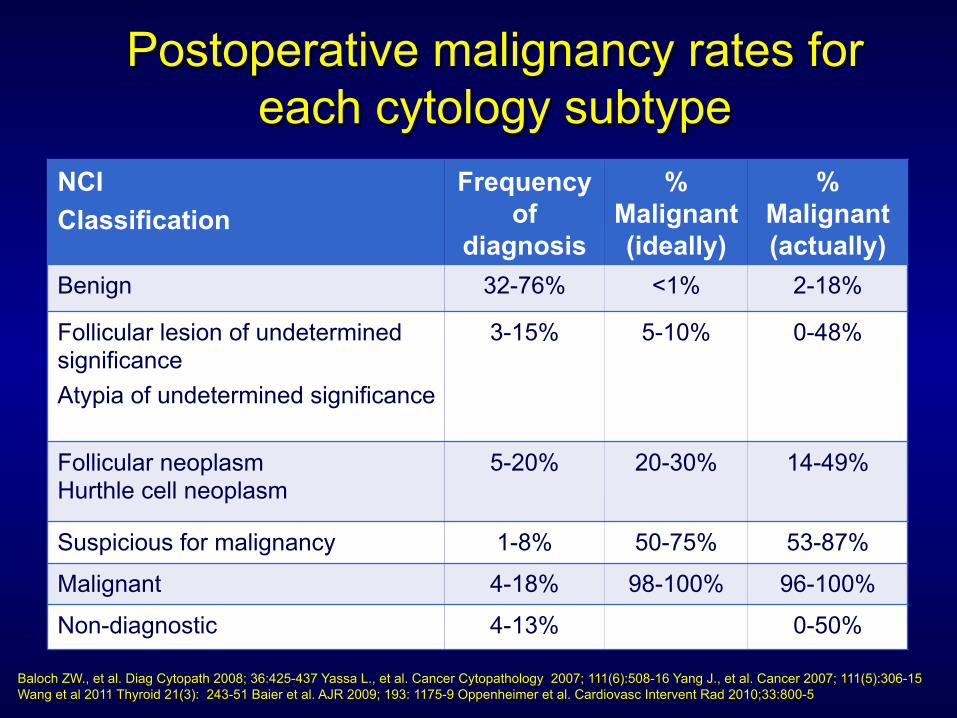
Postoperative malignancy rates for each cytology subtype
NCI Classification
Frequency of
diagnosis
% Malignant (ideally)
% Malignant (actually)
Benign 32-76% <1% 2-18%
Follicular lesion of undetermined significance Atypia of undetermined significance
3-15% 5-10% 0-48%
Follicular neoplasm Hurthle cell neoplasm
5-20% 20-30% 14-49%
Suspicious for malignancy 1-8% 50-75% 53-87%
Malignant 4-18% 98-100% 96-100%
Non-diagnostic 4-13% 0-50%
Baloch ZW., et al. Diag Cytopath 2008; 36:425-437 Yassa L., et al. Cancer Cytopathology 2007; 111(6):508-16 Yang J., et al. Cancer 2007; 111(5):306-15 Wang et al 2011 Thyroid 21(3): 243-51 Baier et al. AJR 2009; 193: 1175-9 Oppenheimer et al. Cardiovasc Intervent Rad 2010;33:800-5
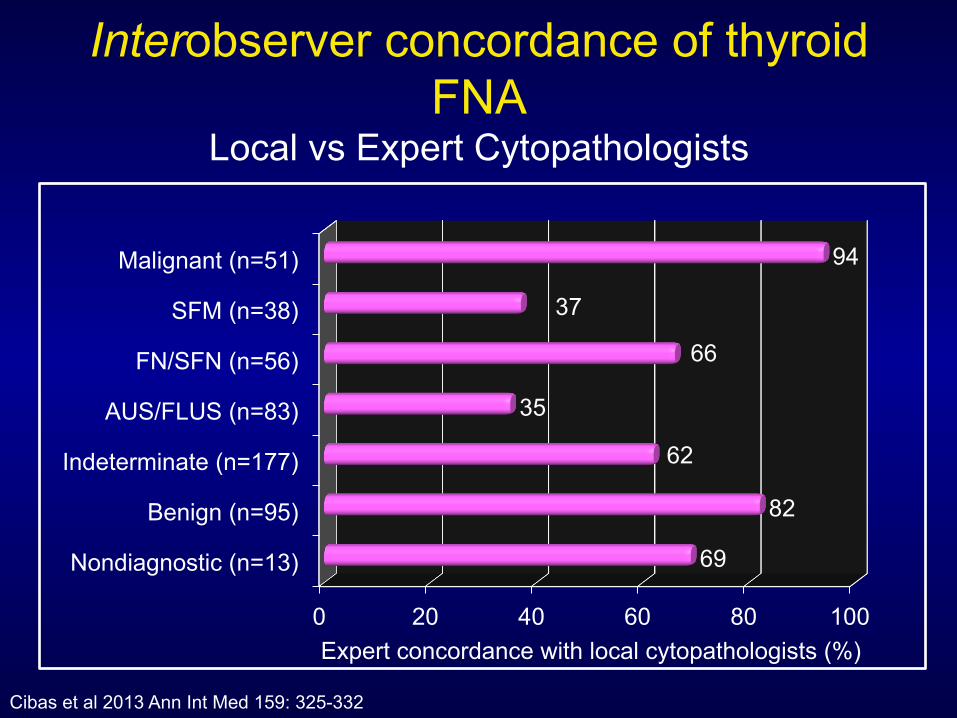
Interobserver concordance of thyroid FNA
Local vs Expert Cytopathologists
0 20 40 60 80 100
Nondiagnostic (n=13)
Benign (n=95)
Indeterminate (n=177)
AUS/FLUS (n=83)
FN/SFN (n=56)
SFM (n=38)
Malignant (n=51)
69
82
62
35
66
37
94
Cibas et al 2013 Ann Int Med 159: 325-332
Expert concordance with local cytopathologists (%)
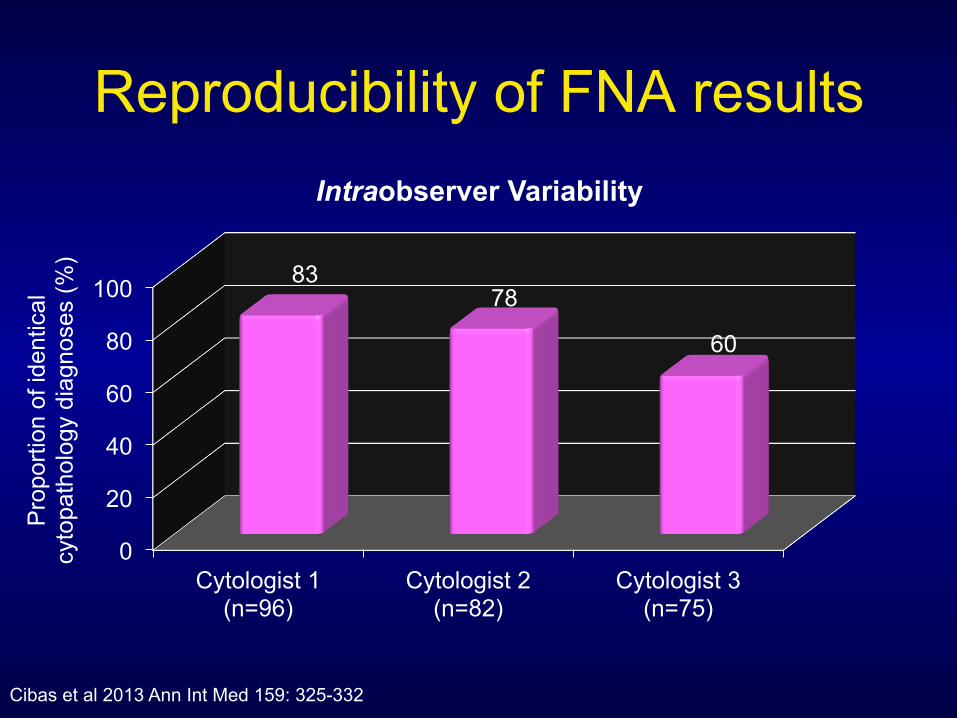
Reproducibility of FNA results
0
20
40
60
80
100
Cytologist 1 (n=96)
Cytologist 2 (n=82)
Cytologist 3 (n=75)
83 78
60
Intraobserver Variability
Pro
porti
on o
f ide
ntic
al
cyto
path
olog
y di
agno
ses
(%)
Cibas et al 2013 Ann Int Med 159: 325-332
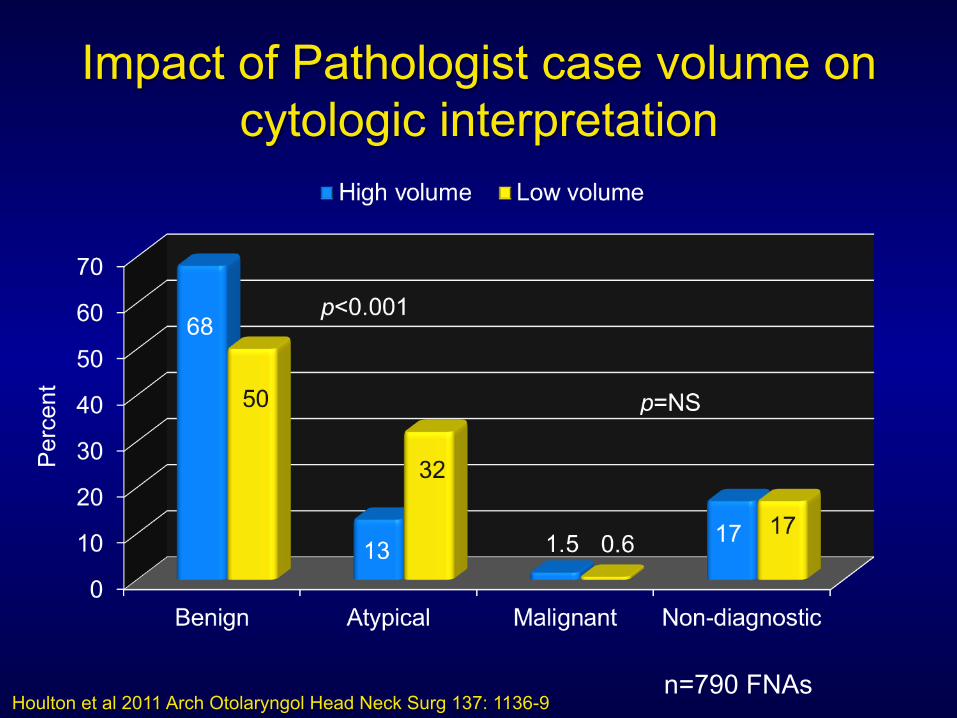
Impact of Pathologist case volume on cytologic interpretation
Houlton et al 2011 Arch Otolaryngol Head Neck Surg 137: 1136-9
Per
cent
n=790 FNAs
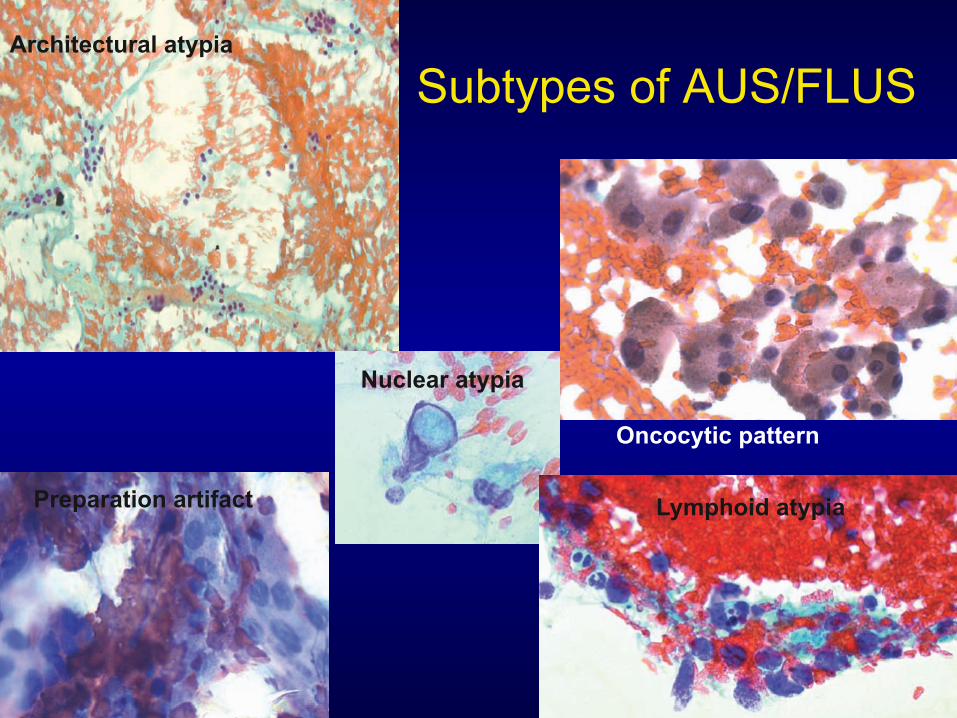
Subtypes of AUS/FLUS Architectural atypia
Nuclear atypia
Oncocytic pattern
Preparation artifact Lymphoid atypia
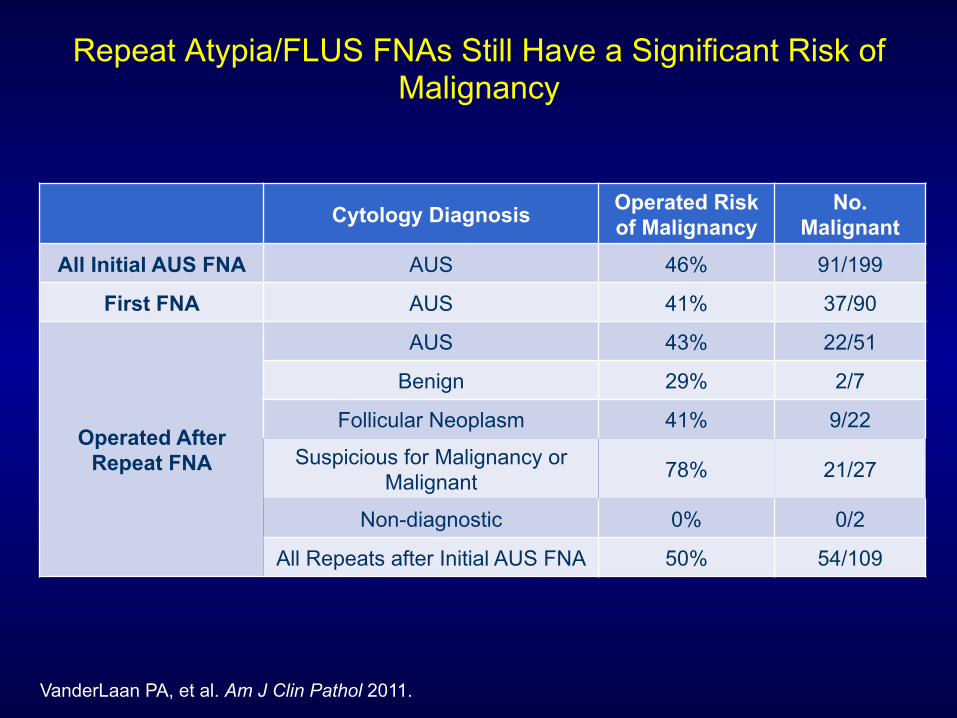
Repeat Atypia/FLUS FNAs Still Have a Significant Risk of Malignancy
VanderLaan PA, et al. Am J Clin Pathol 2011.
Cytology Diagnosis Operated Risk of Malignancy
No. Malignant
All Initial AUS FNA AUS 46% 91/199
First FNA AUS 41% 37/90
Operated After Repeat FNA
AUS 43% 22/51
Benign 29% 2/7
Follicular Neoplasm 41% 9/22
Suspicious for Malignancy or Malignant 78% 21/27
Non-diagnostic 0% 0/2
All Repeats after Initial AUS FNA 50% 54/109

RET/PTC
Ras
BRAF
MEK 1/2
ERK
PTEN
PI3K
AKT
mTor
c-jun c-fos
Cell growth, proliferation, survival
Mechanisms of neoplastic transformation
PTC
PTC
FTC PTC
FTC/ATC
Receptor Tyrosine Kinase
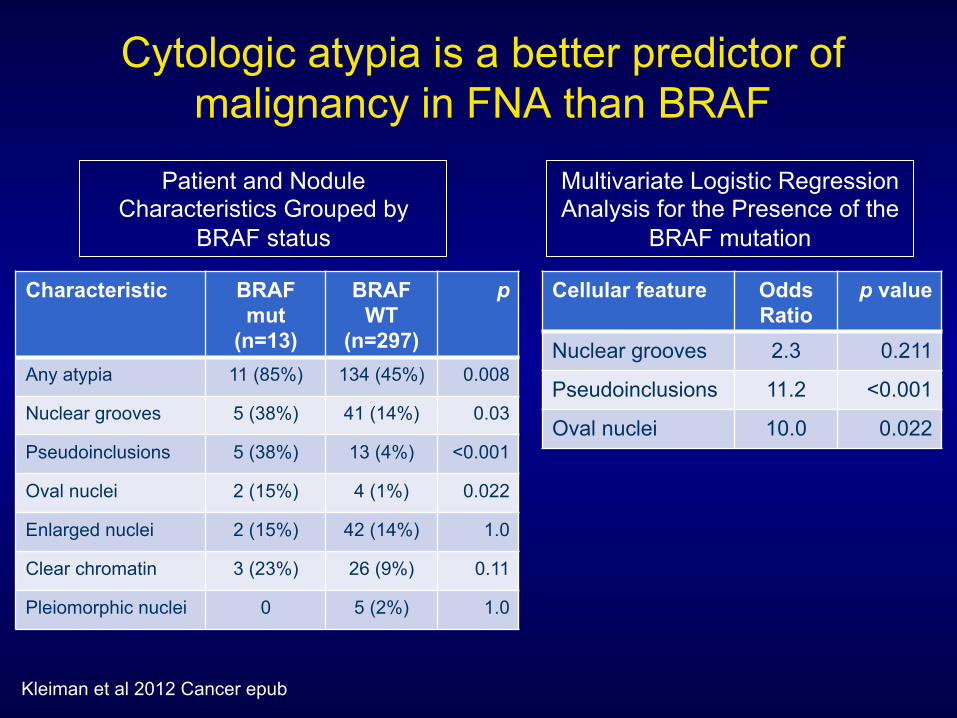
Cytologic atypia is a better predictor of malignancy in FNA than BRAF
Cellular feature Odds Ratio
p value
Nuclear grooves 2.3 0.211
Pseudoinclusions 11.2 <0.001
Oval nuclei 10.0 0.022
Patient and Nodule Characteristics Grouped by
BRAF status
Kleiman et al 2012 Cancer epub
Characteristic BRAF mut
(n=13)
BRAF WT
(n=297)
p
Any atypia 11 (85%) 134 (45%) 0.008
Nuclear grooves 5 (38%) 41 (14%) 0.03
Pseudoinclusions 5 (38%) 13 (4%) <0.001
Oval nuclei 2 (15%) 4 (1%) 0.022
Enlarged nuclei 2 (15%) 42 (14%) 1.0
Clear chromatin 3 (23%) 26 (9%) 0.11
Pleiomorphic nuclei 0 5 (2%) 1.0
Multivariate Logistic Regression Analysis for the Presence of the
BRAF mutation
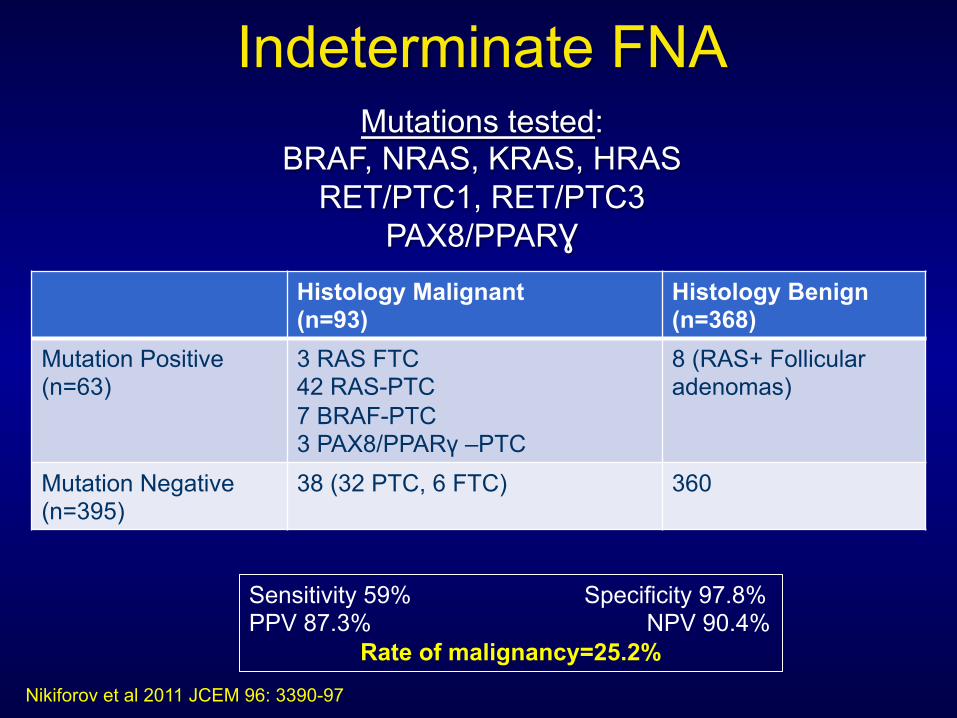
Indeterminate FNA
Nikiforov et al 2011 JCEM 96: 3390-97
Mutations tested: BRAF, NRAS, KRAS, HRAS
RET/PTC1, RET/PTC3 PAX8/PPARƔ
Histology Malignant (n=93)
Histology Benign (n=368)
Mutation Positive (n=63)
3 RAS FTC 42 RAS-PTC 7 BRAF-PTC 3 PAX8/PPARγ –PTC
8 (RAS+ Follicular adenomas)
Mutation Negative (n=395)
38 (32 PTC, 6 FTC) 360
Sensitivity 59% Specificity 97.8% PPV 87.3% NPV 90.4%
Rate of malignancy=25.2%
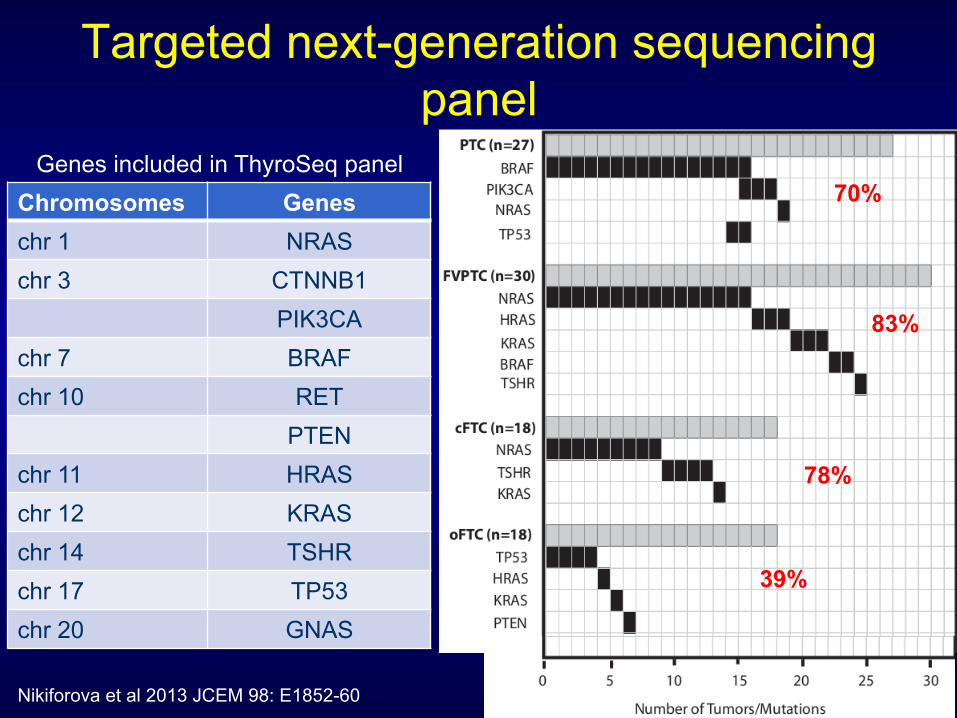
Genes included in ThyroSeq panel Chromosomes Genes chr 1 NRAS chr 3 CTNNB1
PIK3CA chr 7 BRAF chr 10 RET
PTEN chr 11 HRAS chr 12 KRAS chr 14 TSHR chr 17 TP53 chr 20 GNAS
Nikiforova et al 2013 JCEM 98: E1852-60
Targeted next-generation sequencing panel
70%
78%
83%
39%
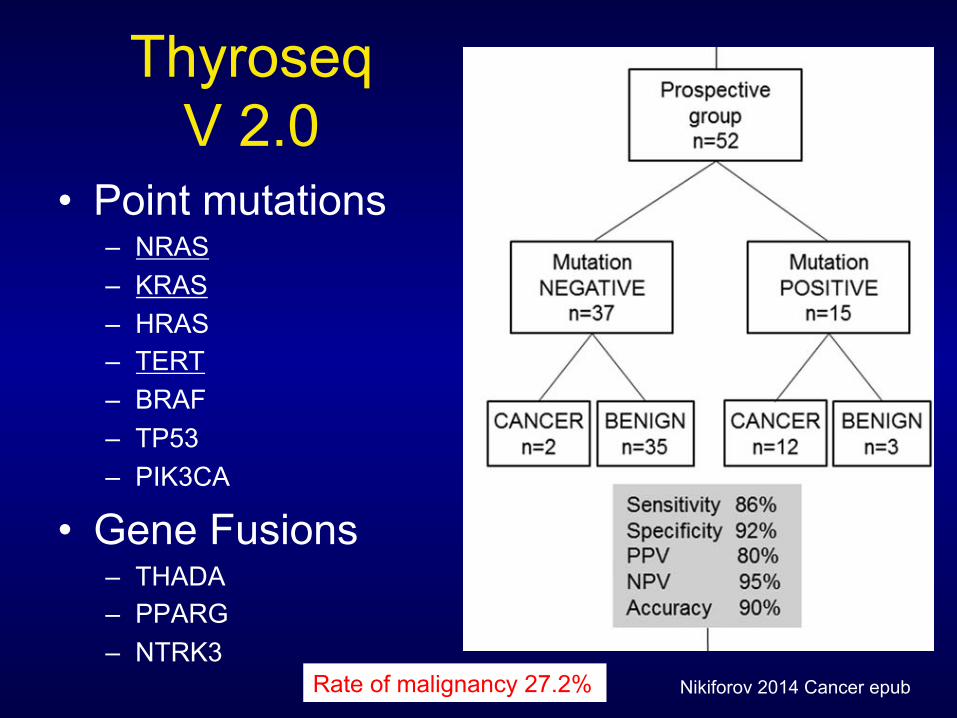
Thyroseq V 2.0
• Point mutations – NRAS – KRAS – HRAS – TERT – BRAF – TP53 – PIK3CA
• Gene Fusions – THADA – PPARG – NTRK3
may significantly affect the PPV and NPV of any diagnos-tic test.24 Indeed, the risk of malignancy in nodules withFN/SFN cytology ranged from 14% to 34% in 8 studiessummarized by Bongiovanni et al.8 To estimate the per-formance of ThyroSeq v2 in patients with FN/SFN nod-ules in populations with different pretest cancerprobability, we calculated the expected PPV and NPV ofthe test using the Bayes theorem based on the sensitivityand specificity determined in the current study (Fig. 2).The analysis demonstrated that, with a cancer probabilityranging between 14% and 34%, the NPV of the testwould range between 98% and 95%, and the PPV wouldrange between 68% and 87%.
DISCUSSIONIn this study, we validated the performance of a novelgenetic test based on a comprehensive panel of pointmutations and gene fusions occurring in thyroid cancer in
a large series of thyroid nodules with FN/SFN cytologyand demonstrated that it allows accurate cancer risk assess-ment in these nodules, opening the possibility forimproved management of these patients. On the basis ofThe Bethesda System, the cytologic diagnosis of FN/SFNis established in those aspirates that: 1) have follicular cellsarranged in an architectural pattern characterized by cellcrowding and/or microfollicle formation and lacking nu-clear features of papillary carcinoma, or 2) are comprisedalmost exclusively of oncocytic (Hurthle) cells.3 Suchcytologic patterns are observed in follicular and oncocyticcarcinomas and in the follicular variant of papillary carci-noma, but they also are common in FAs and cellularhyperplastic nodules. Because such benign lesions arecommon, they determine a high false-positive rate on FN/SFN cytology, because only approximately 25% of nod-ules (range, 14%-34% of nodules) with FN/SFN cytologyare identified as malignant after surgery.8 Typically, the
Figure 1. This is a schematic representation of the study cohorts, test results, and overall performance of the targeted next-generation sequencing panel of thyroid cancer-related genetic markers (ThyroSeq v2). FN/FSN indicates follicular (or oncocytic)neoplasm/suspicious for a follicular (or oncocytic) neoplasm; PPV, positive predictive value; NPV, negative predictive value; CI,confidence interval.
ThyroSeq NGS Test for Thyroid FNAs/Nikiforov et al
Cancer Month 00, 2014 5
Nikiforov 2014 Cancer epub Rate of malignancy 27.2%
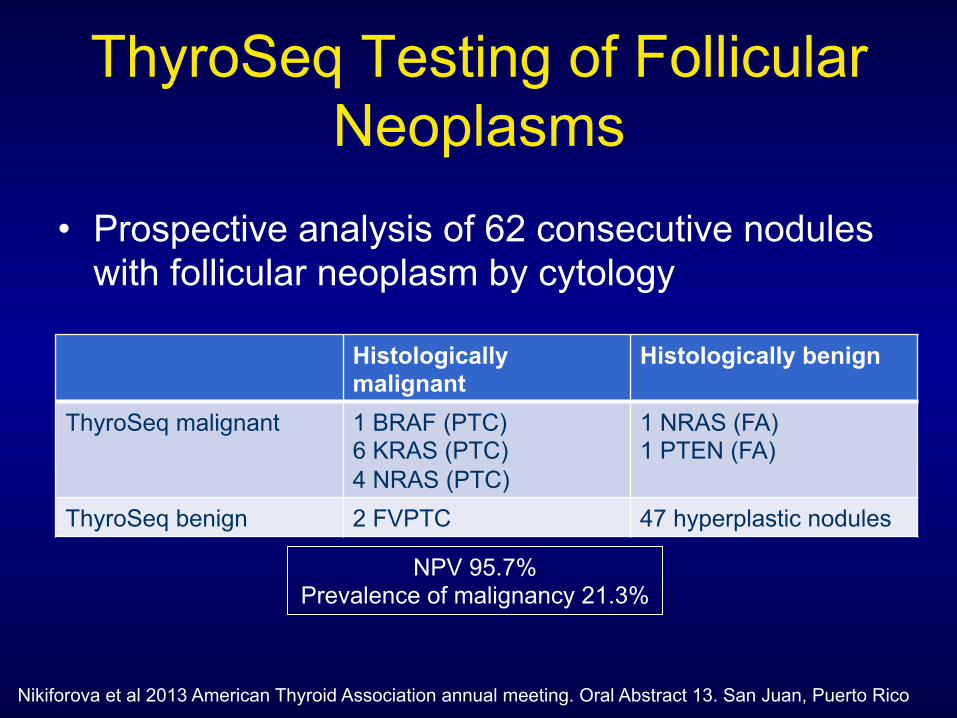
ThyroSeq Testing of Follicular Neoplasms
• Prospective analysis of 62 consecutive nodules with follicular neoplasm by cytology
Histologically malignant
Histologically benign
ThyroSeq malignant 1 BRAF (PTC) 6 KRAS (PTC) 4 NRAS (PTC)
1 NRAS (FA) 1 PTEN (FA)
ThyroSeq benign 2 FVPTC 47 hyperplastic nodules
NPV 95.7% Prevalence of malignancy 21.3%
Nikiforova et al 2013 American Thyroid Association annual meeting. Oral Abstract 13. San Juan, Puerto Rico
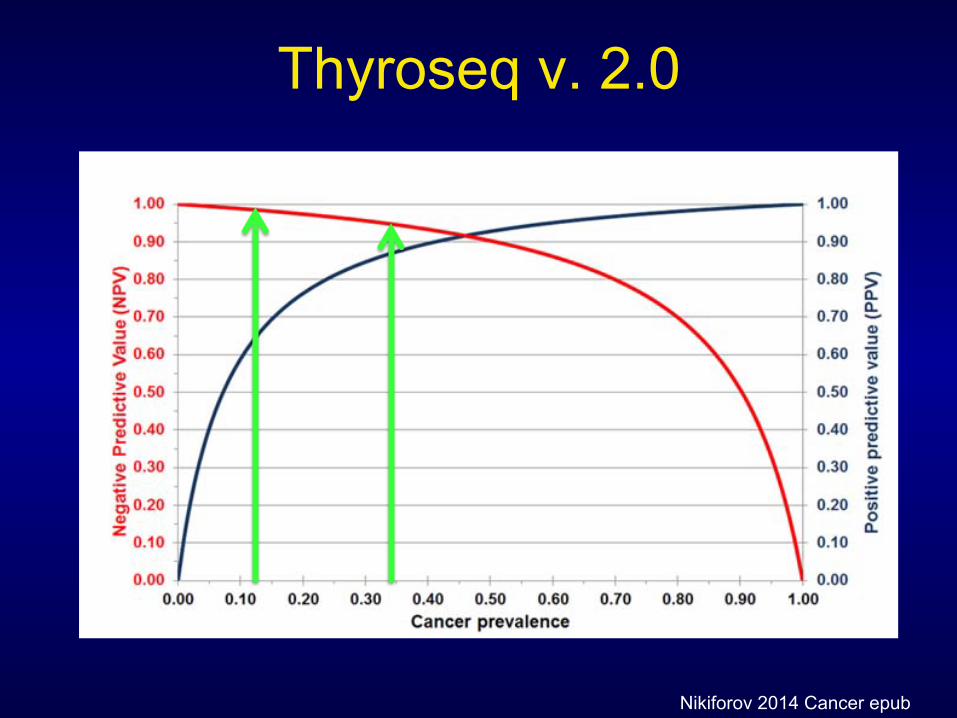
Thyroseq v. 2.0
accepted management of patients who have nodules thatfall in this cancer risk category is diagnostic lobectomy,which could be avoided for nodules that are identified asbenign after surgery.
Currently available ancillary molecular tests improveeither the PPV or the NPV for FN/SFN nodules, but notboth at the same time. The gene expression classifier(GEC) test, commercially known as Afirma (Veracyte,South San Francisco, Calif), offers a high NPV, but itsPPV is as low as 15% to 37%.12,24 Therefore, the GECtest does not prevent surgery (ie, diagnostic lobectomy) inthe majority of patients with this cytologic diagnosis whoare classified as GEC suspicious but ultimately have be-nign histology. In contrast, testing for a 7-oncogene paneloffers a high PPV but a low NPV,9-11 which helps to selectpatients with a higher cancer risk for the appropriate ther-apeutic surgery (ie, total thyroidectomy) but does not pre-vent diagnostic surgeries for most patients with benignnodules. Although it is highly specific for thyroid cancer,the limited NPV of the 7-gene panel is expected, becausefrom 30% to 35% of all thyroid cancers do not harbor 1of these 7 genes.
In the current study, we took advantage of morerecent discoveries of point mutations and gene fusions indifferent types of thyroid cancers and of new technologythat allows simultaneous testing for a large variety ofmutations in FNA samples, expanding the diagnosticpanel to include approximately 60 genetic markers andincreasing the sensitivity of cancer detection to 90%. Adramatic improvement in sensitivity led to a similar effecton the NPV, which was 96% in this study. It is notewor-thy that our study also was based on the largest series ofFN/SFN nodules with molecular testing reported to date,
and the cancer prevalence in the series was 27%, which issimilar to the average cancer rate reported in many studiesof nodules with FN/SFN cytology.8 Moreover, even in abroad range of pretest cancer probability reported in FN/SFN nodules (ie, 14%-34%), the NPV of this test wouldnot drop below 95%.
Furthermore, the 4 cancers that were missedbecause of the lack of any mutations included 2 encapsu-lated follicular variant PTCs, 1 classic PTC, and 1 mini-mally invasive oncocytic FTC, all of which wereintrathyroidal tumors with no histologic features ofaggressive behavior at presentation. That no aggressivetumors were missed in this study may be because many ofthe more aggressive thyroid cancers are expected to bepositive for TERT mutations,19,20,25 BRAF muta-tions,26,27 or to carry multiple mutations18,28 and, thus,can be detected by this broad panel of genetic markers, aswe observed in 3 tumors with multiple mutations. Onthe basis of the high NPV and missing a few low-gradecancers, it is reasonable to propose that patients who havethyroid nodules with FN/SFN cytology and no muta-tions identified using this broad panel of molecularmarkers can be followed with active surveillance, ie, with-out surgery. Possible exceptions would include high-riskultrasonographic features of the nodule or other signifi-cant risk factors, such as prior irradiation, a strong familyhistory of thyroid cancer, or a clinical setting with anunusually high pretest probability of cancer. Indeed, forthose practices in which the cancer prevalence of noduleswith FN/SFN cytology is very high (ie, approaching50%), the achieved NPV of this test will drop to 90%. Inthose situations, the NPV of the test may not be suffi-ciently robust to avoid diagnostic surgery.
Despite a significant increase in NPV because of add-ing a large number of additional genetic markers, the PPVof ThyroSeq v2 did not decrease substantially from the86% reported for the prior 7-oncogene panel.11 The overallPPV of ThyroSeq was 83%, and the risk of cancer was dif-ferent in specific mutation groups. A finding of TERT,HRAS, BRAF V600E, TP53, and PIK3CA mutations andany gene fusion conferred a 100% risk of cancer in these se-ries. The risk of cancer in the nodules with NRAS or KRASmutations was 81% to 83%, similar to previously reportedrates.9-11,29 Finally, only 1 of 3 TSHR mutation-positivenodules was identified as cancer after surgery; therefore,additional features are needed for more accurate cancer pre-diction in nodules that are positive for TSHR mutations.The knowledge of cancer risk associated with specific muta-tions, together with prognostic associations conferred byTERT and other mutations, should help in choosing the
Figure 2. Expected negative and positive predictive valuesfor the targeted next-generation sequencing panel (ThyroSeqv2) are illustrated in relation to cancer prevalence based onthe specificity and sensitivity of the test detected in the cur-rent study.
Original Article
6 Cancer Month 00, 2014
Nikiforov 2014 Cancer epub
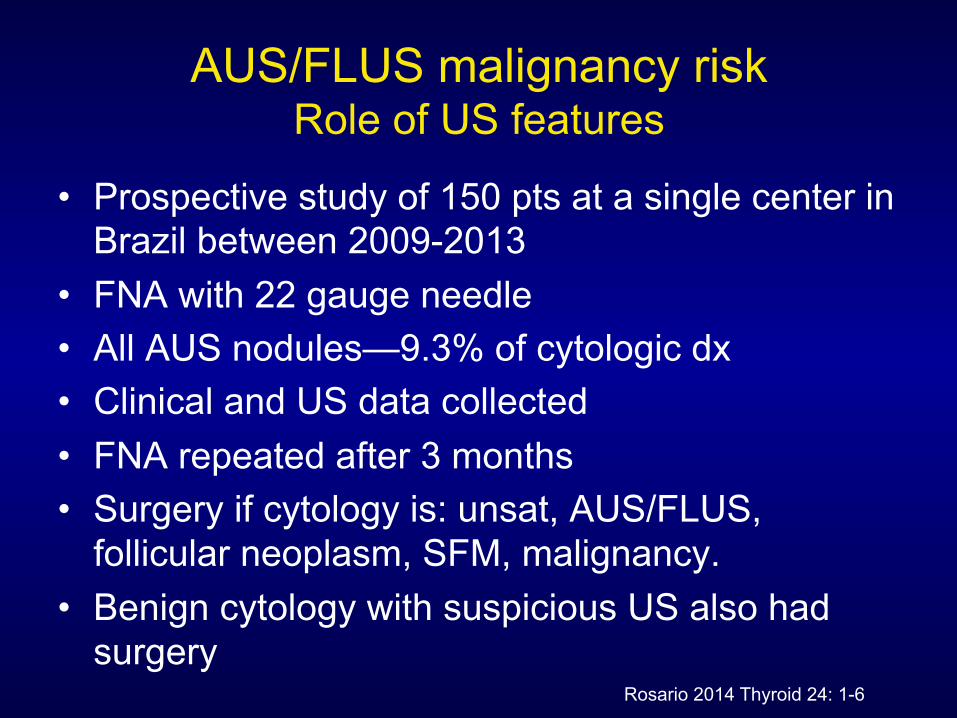
AUS/FLUS malignancy risk Role of US features
• Prospective study of 150 pts at a single center in Brazil between 2009-2013
• FNA with 22 gauge needle • All AUS nodules—9.3% of cytologic dx • Clinical and US data collected • FNA repeated after 3 months • Surgery if cytology is: unsat, AUS/FLUS,
follicular neoplasm, SFM, malignancy. • Benign cytology with suspicious US also had
surgery Rosario 2014 Thyroid 24: 1-6
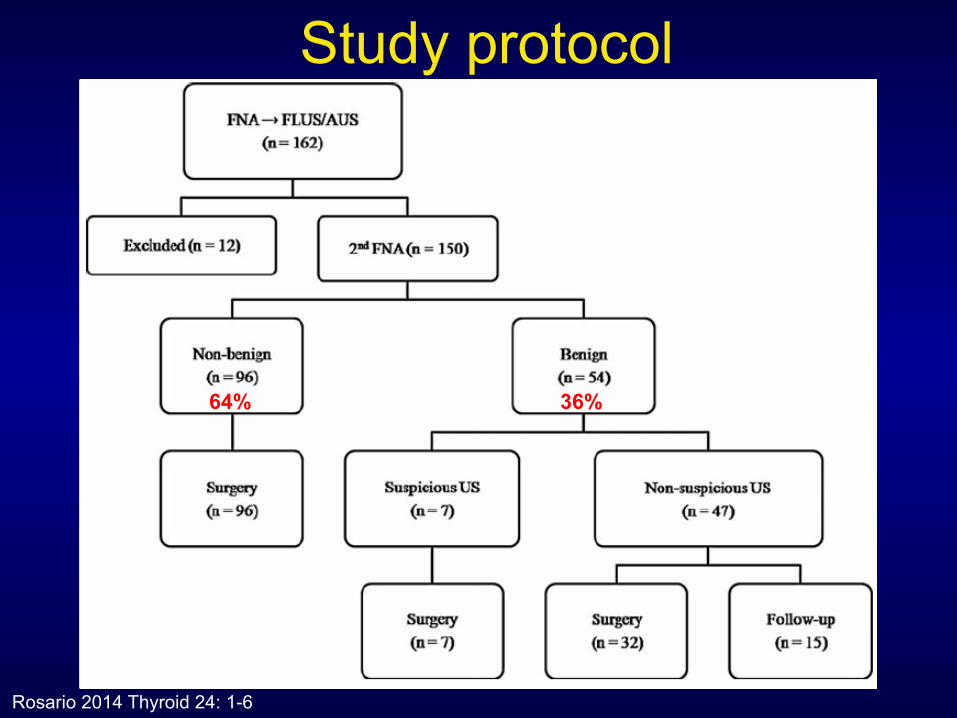
Study protocol
Rosario 2014 Thyroid 24: 1-6
36% 64%
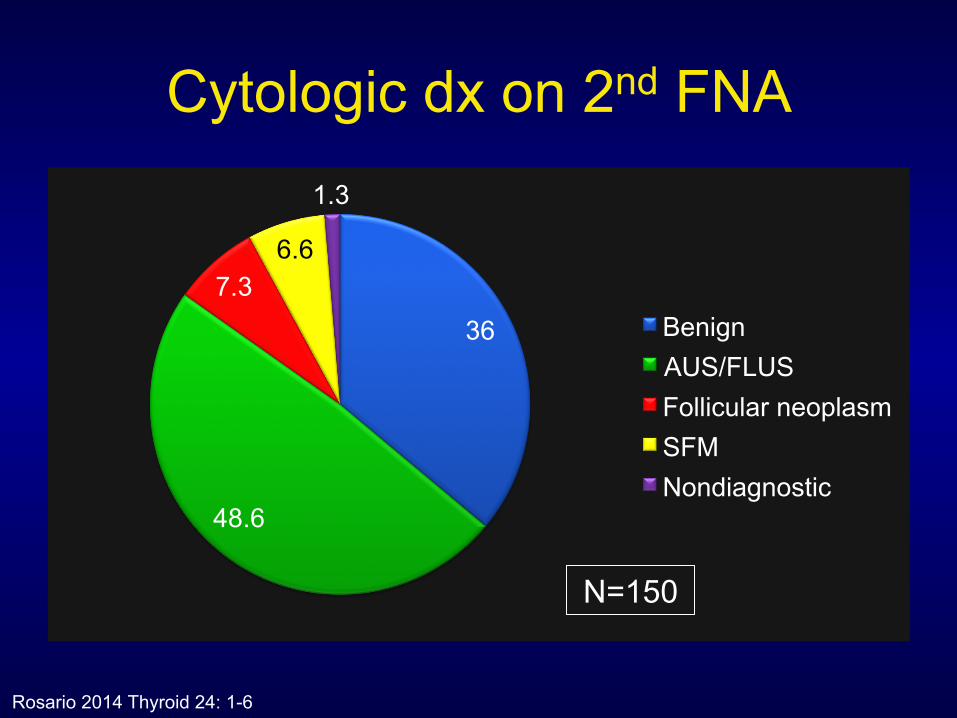
Cytologic dx on 2nd FNA
36
48.6
7.3 6.6
1.3
Benign AUS/FLUS Follicular neoplasm SFM Nondiagnostic
Rosario 2014 Thyroid 24: 1-6
N=150
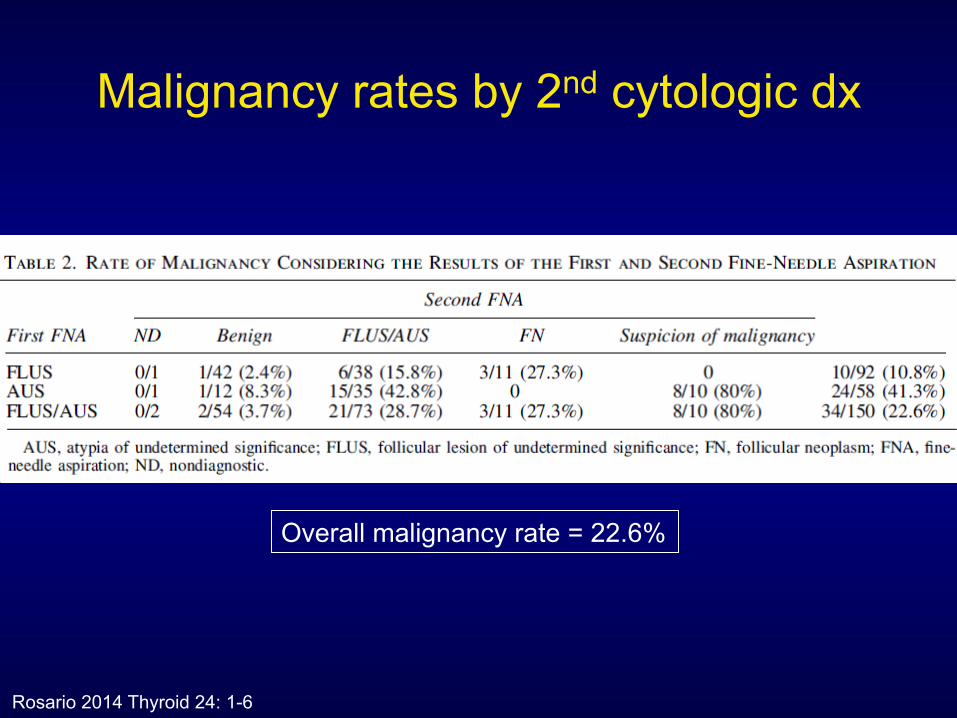
Malignancy rates by 2nd cytologic dx
Rosario 2014 Thyroid 24: 1-6
Overall malignancy rate = 22.6%
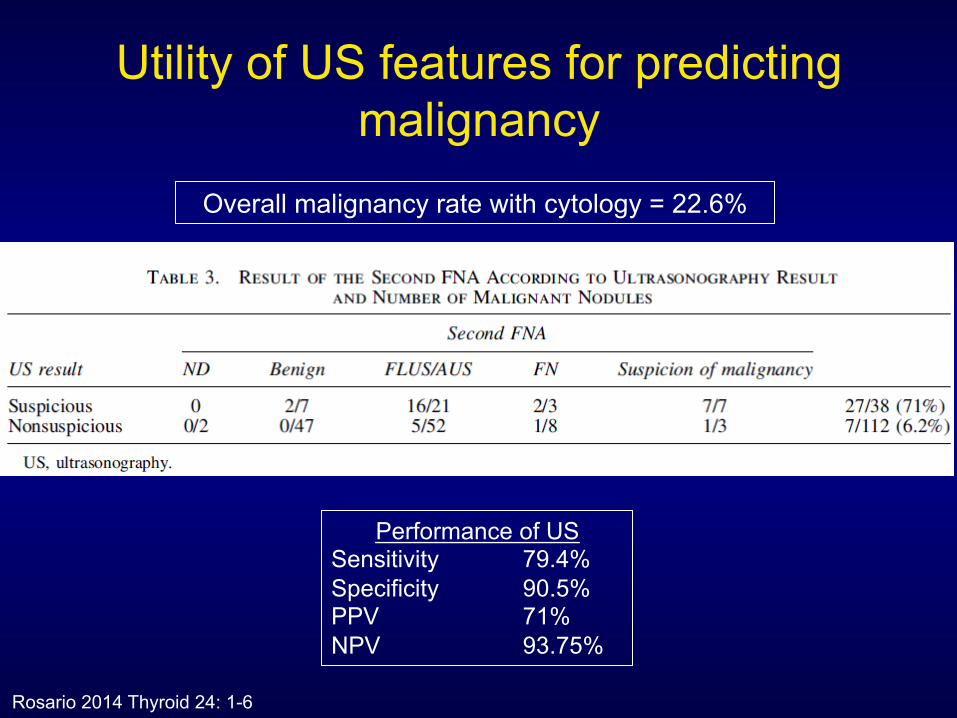
Utility of US features for predicting malignancy
Rosario 2014 Thyroid 24: 1-6
Performance of US Sensitivity 79.4% Specificity 90.5% PPV 71% NPV 93.75%
Overall malignancy rate with cytology = 22.6%
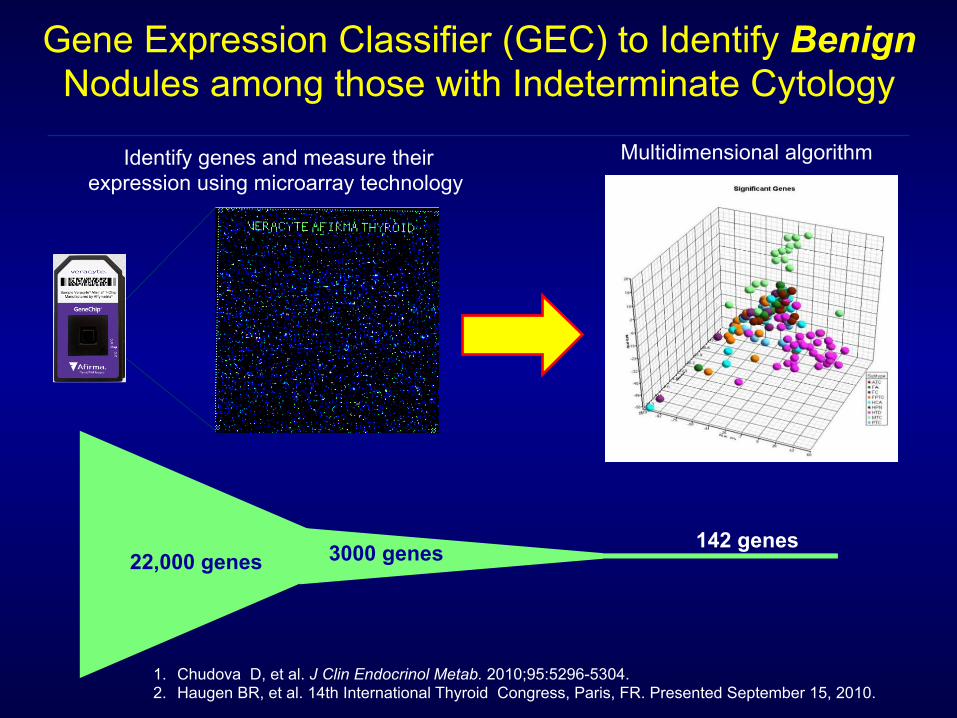
Multidimensional algorithm Identify genes and measure their expression using microarray technology
Gene Expression Classifier (GEC) to Identify Benign Nodules among those with Indeterminate Cytology
22,000 genes 3000 genes 142 genes
1. Chudova D, et al. J Clin Endocrinol Metab. 2010;95:5296-5304. 2. Haugen BR, et al. 14th International Thyroid Congress, Paris, FR. Presented September 15, 2010.

0
10
20
30
40
50
60
70
Benign (47) AUS/FLUS (129)
FN/HCN (81) SFM (55)
6
24 25
62
5 6
15
Pretest probability of malignancy Posttest probability of malignancy
Afirma GEC Identifies Cytologically Indeterminate Thyroid Nodules with a Low Risk of Malignancy
Cytopathology Diagnosis (N) Alexander EK, et al. N Engl J Med 2012.
Ris
k of
Mal
igna
ncy
(1 –
NP
V)
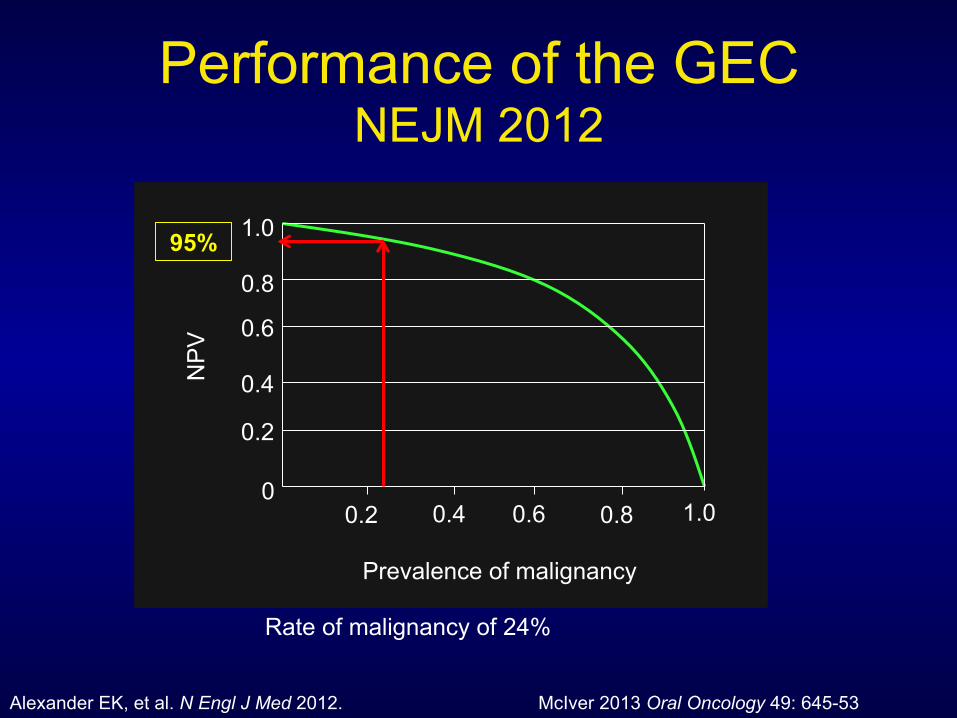
Performance of the GEC NEJM 2012
1.0
0.8
0.6
0.4
0.2
0 0.2 0.4 0.6 0.8 1.0
NP
V
Prevalence of malignancy
McIver 2013 Oral Oncology 49: 645-53 Alexander EK, et al. N Engl J Med 2012.
95%
Rate of malignancy of 24%
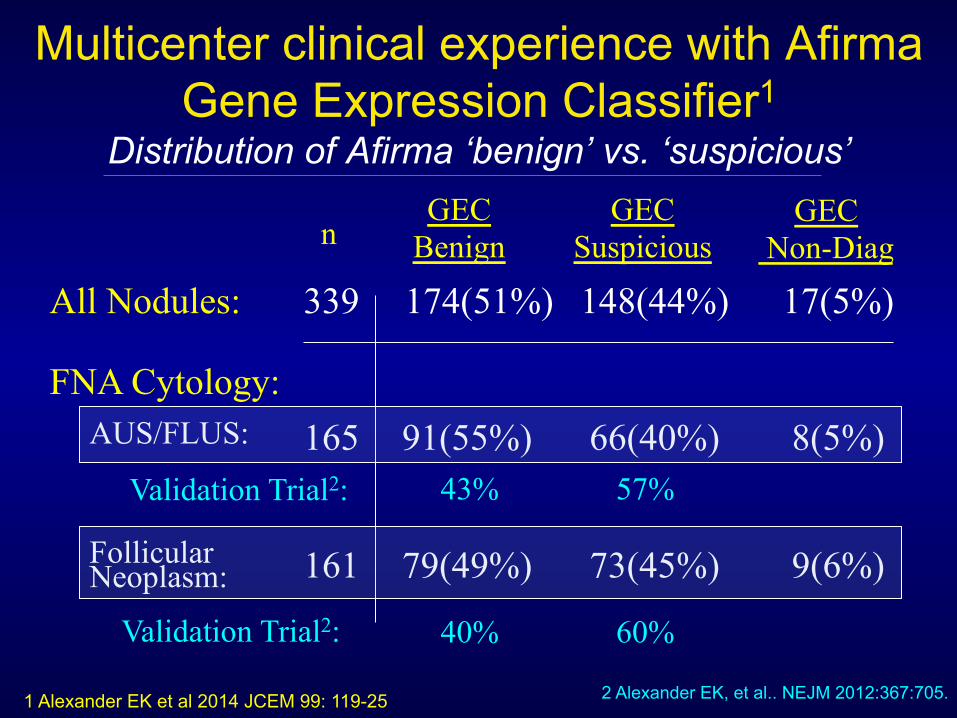
Multicenter clinical experience with Afirma Gene Expression Classifier1
Distribution of Afirma ‘benign’ vs. ‘suspicious’
All Nodules:
AUS/FLUS:
Follicular
FNA Cytology:
GEC Benign
GEC Suspicious
GEC Non-Diag
339 174(51%) 148(44%) 17(5%)
165 91(55%) 66(40%) 8(5%)
161 79(49%) 73(45%) 9(6%)
n
Neoplasm:
Validation Trial2: 43% 57%
Validation Trial2: 40% 60%
2 Alexander EK, et al.. NEJM 2012:367:705. 1 Alexander EK et al 2014 JCEM 99: 119-25
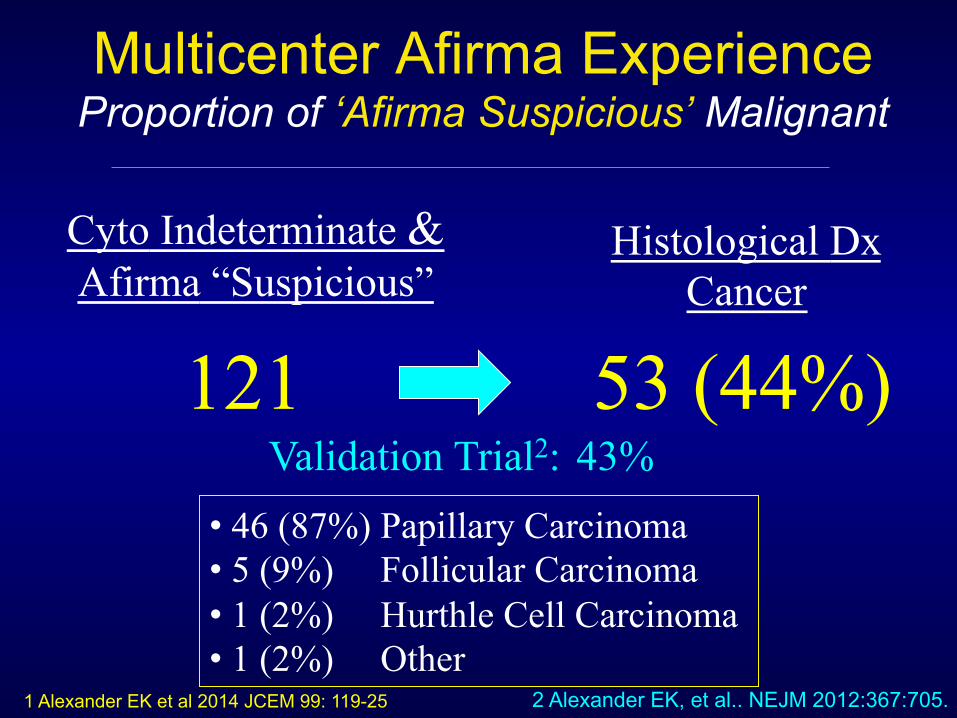
Multicenter Afirma Experience Proportion of ‘Afirma Suspicious’ Malignant
121
Cyto Indeterminate & Afirma “Suspicious”
53 (44%)
Histological Dx Cancer
• 46 (87%) Papillary Carcinoma • 5 (9%) Follicular Carcinoma • 1 (2%) Hurthle Cell Carcinoma • 1 (2%) Other
Validation Trial2: 43%
2 Alexander EK, et al.. NEJM 2012:367:705. 1 Alexander EK et al 2014 JCEM 99: 119-25
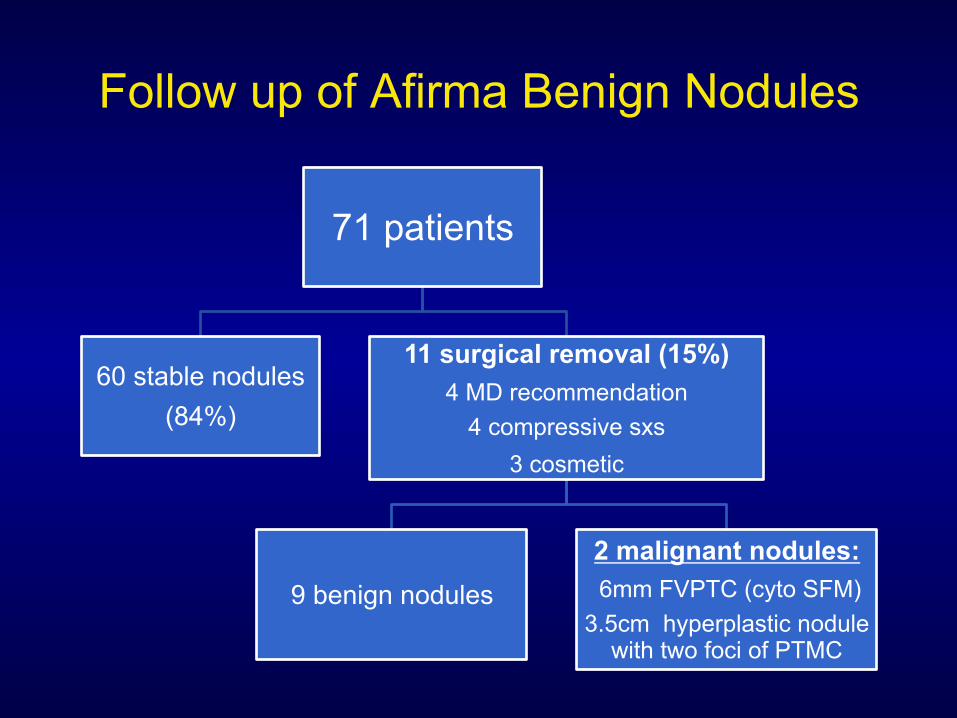
Follow up of Afirma Benign Nodules
71 patients
60 stable nodules (84%)
11 surgical removal (15%) 4 MD recommendation
4 compressive sxs 3 cosmetic
9 benign nodules
2 malignant nodules: 6mm FVPTC (cyto SFM)
3.5cm hyperplastic nodule with two foci of PTMC
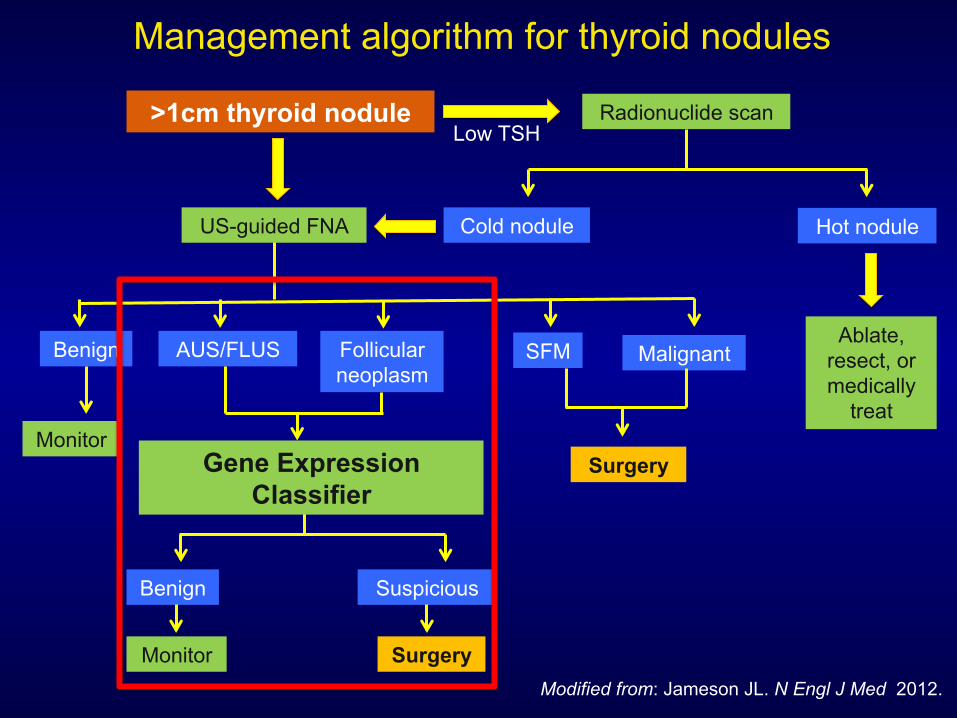
Management algorithm for thyroid nodules
Modified from: Jameson JL. N Engl J Med 2012.
>1cm thyroid nodule Low TSH
Radionuclide scan
Cold nodule Hot nodule
Ablate, resect, or medically
treat
US-guided FNA
Benign AUS/FLUS Follicular neoplasm
SFM Malignant
Monitor Surgery
Benign Suspicious
Monitor Surgery
Gene Expression Classifier
Questions?