ewm 1014 close 10-29-14 · pdf fileplease see general disclaimers on the last page of this...
TRANSCRIPT

Please see General Disclaimers on the last page of this report.
Current Environment ............................................................................................ 1
Industry Profile .................................................................................................... 11
Industry Trends ................................................................................................... 13
How the Industry Operates ............................................................................... 28
Key Industry Ratios and Statistics ................................................................... 35
How to Analyze an Environmental Company ................................................. 36
Glossary ................................................................................................................ 41
Industry References ........................................................................................... 43
Comparative Company Analysis ...................................................................... 45
This issue updates the one dated November 2013.
Industry Surveys Environmental & Waste Management Joseph Agnese, Environmental Services & Water Utilities Equity Analyst
OCTOBER 2014
CONTACTS:
INQUIRIES & CLIENT SUPPORT 800.523.4534 clientsupport@ standardandpoors.com
SALES 877.219.1247 [email protected]
MEDIA Michael Privitera 212.438.6679 [email protected]
S&P CAPITAL IQ 55 Water Street New York, NY 10041

Topics Covered by Industry Surveys
Aerospace & Defense
Airlines
Alcoholic Beverages & Tobacco
Apparel & Footwear: Retailers & Brands
Autos & Auto Parts
Banking
Biotechnology
Broadcasting, Cable & Satellite
Chemicals
Communications Equipment
Computers: Commercial Services
Computers: Consumer Services & the Internet
Computers: Hardware
Computers: Software
Electric Utilities
Environmental & Waste Management
Financial Services: Diversified
Foods & Nonalcoholic Beverages
Healthcare: Facilities
Healthcare: Managed Care
Healthcare: Pharmaceuticals
Healthcare: Products & Supplies
Heavy Equipment & Trucks
Homebuilding
Household Durables
Household Nondurables
Industrial Machinery
Insurance: Life & Health
Insurance: Property-Casualty
Investment Services
Lodging & Gaming
Metals: Industrial
Movies & Entertainment
Natural Gas Distribution
Oil & Gas: Equipment & Services
Oil & Gas: Production & Marketing
Paper & Forest Products
Publishing & Advertising
Real Estate Investment Trusts
Restaurants
Retailing: General
Retailing: Specialty
Semiconductors & Equipment
Supermarkets & Drugstores
Telecommunications
Thrifts & Mortgage Finance
Transportation: Commercial
Global Industry Surveys
Airlines: Asia
Autos & Auto Parts: Europe
Banking: Europe
Food Retail: Europe
Foods & Beverages: Europe
Media: Europe
Oil & Gas: Europe
Pharmaceuticals: Europe
Telecommunications: Asia
Telecommunications: Europe
S&P Capital IQ Industry Surveys 55 Water Street, New York, NY 10041
CLIENT SUPPORT: 1-800-523-4534
VISIT THE S&P CAPITAL IQ WEBSITE: www.spcapitaliq.com
S&P CAPITAL IQ INDUSTRY SURVEYS (ISSN 0196-4666) is published weekly. Redistribution or reproduction in whole or in part (including inputting into a computer) is prohibited without written permission. To learn more about Industry Surveys and the S&P Capital IQ product offering, please contact our Product Specialist team at 1-877-219-1247 or visit getmarketscope.com. Executive and Editorial Office: S&P Capital IQ, 55 Water Street, New York, NY 10041. Officers of McGraw Hill Financial: Douglas L. Peterson, President, and CEO; Jack F. Callahan, Jr., Executive Vice President, Chief Financial Officer; John Berisford, Executive Vice President, Human Resources; D. Edward Smyth, Executive Vice President, Corporate Affairs; and Lucy Fato, Executive Vice President and General Counsel. Information has been obtained by S&P Capital IQ INDUSTRY SURVEYS from sources believed to be reliable. However, because of the possibility of human or mechanical error by our sources, INDUSTRY SURVEYS, or others, INDUSTRY SURVEYS does not guarantee the accuracy, adequacy, or completeness of any information and is not responsible for any errors or omissions or for the results obtained from the use of such information. Copyright © 2014 Standard & Poor's Financial Services LLC, a part of McGraw Hill Financial. All rights reserved. STANDARD & POOR’S, S&P, S&P 500, S&P MIDCAP 400, S&P SMALLCAP 600, and S&P EUROPE 350 are registered trademarks of Standard & Poor’s Financial Services LLC. S&P CAPITAL IQ is a trademark of Standard & Poor’s Financial Services LLC.

INDUSTRY SURVEYS ENVIRONMENTAL & WASTE MANAGEMENT / OCTOBER 2014 1
CURRENT ENVIRONMENT
Significant volumes of commercial collection should follow C&D recovery
While core pricing increases continue to drive top-line organic growth, we think the economy will continue to gradually recover, aiding commercial and industrial waste collection volumes. In our view, recycling prices should stabilize at low levels, before slowly moving higher in 2015. In addition, the largest North American waste collection and disposal companies are generating strong cash flows, which they are targeting for share repurchases, increased dividends, debt reduction, and strategic acquisitions.
We also see continued price increases from major haulers. For example, Waste Management Inc. reported an increase of 3.9% in its core price component of total solid waste pricing in the second quarter of 2014, compared with a 3.8% increase in the second quarter of 2013. (The core price includes price increases and fees, but excludes fuel surcharges, and is net of rollbacks.) In the first quarter of 2014, the company reported a 4.2% core price increase, compared with a 3.2% increase in the first quarter of 2013. For full year 2013, a 3.8% increase was reported, compared with a 2.9% increase for full year 2012. We note that much of the organic revenue growth for haulers in recent quarters has come from such price increases.
The bigger haulers have pushed through price increases more easily in the commercial waste segment than on the residential side. Apart from price increases, another top-priority item for solid waste haulers is to reduce costs.
Following a rebound in construction and demolition (C&D) volumes, we expect commercial collection volumes to recover. We also expect C&D volumes to continue increasing as housing starts rise further. Commodity prices, which increased through much of 2011 but dropped in 2012 and 2013, remained weak in the first half of 2014.
Smaller haulers find it difficult to operate in a soft environment, and we therefore expect “tuck-in” acquisitions to pick up.
In addition, acquisition multiples near or below the historical average (in the range of 6X to 7X earnings before interest, taxes, depreciation, and amortization—or EBITDA) remain attractive for the major players, though private equity firms are again showing interest in this industry, which could drive up selling prices.
Waste management firms are increasing their focus on core operations. On July 29, 2014, Waste Management divested its waste-to-energy and power-producing business, Wheelabrator Technologies Inc., to Energy Capital Partners for $1.94 billion in cash. To drive incremental shareholder value, the company plans to use the net proceeds to acquire assets related to its core business and repurchase shares. Another waste management company, Casella Waste Systems Inc., noted in its 2013 annual report that it is expanding its core operations, which include collection, landfill, and municipal solid waste (MSW) operations.
Overall, we consider this industry to be somewhat recession-resistant, although it tends to lag behind economic recovery by six to nine months. Leading haulers, such as Waste Management and Republic Services, which had suspended their share buyback programs in 2009, have again used cash for share repurchases—a sign of better times ahead, in our view—while also raising their quarterly dividend
Chart H15: MUNICIPAL SOLID WASTE GENERATION
0
1
2
3
4
5
0
60
120
180
240
300
1965 70 75 80 85 90 95 00 05 07 08 09 10 11 2012
MSW tonnage (left scale)
Pounds per person per day (right scale)
Source: US Environmental Protection Agency.
MUNICIPAL SOLID WASTE GENERATION
(Million tons) (Pounds)

2 ENVIRONMENTAL & WASTE MANAGEMENT / OCTOBER 2014 INDUSTRY SURVEYS
payments. We think these strong generators of free cash will look to allocate their capital for internal growth, “tuck-in” acquisitions, and debt paydowns, along with returning cash to shareholders via buybacks and dividends.
ECONOMIC RECOVERY SEEN AIDING COLLECTION AND INDUSTRIAL WASTE MARKET
The economy is on the mend after five years of Americans cleaning up their balance sheets. Jobs are trickling back, and consumers are spending, despite higher taxes. Commercial construction is starting to improve, and the housing market has shown signs of strength. As of the second quarter of 2014, growth in real gross domestic product (GDP) was 2.5%, more robust than the September forecast of 2.2% that Standard & Poor’s Economics (which operates separately from S&P Capital IQ) projected for full year 2014, thanks to stronger trade data and more inventory accumulation. An upward revision to construction data suggests the final number may be even stronger, possibly closer to 2.7%. The commercial and industrial waste collection markets are expected to gain from the recovering economy.
Cold, snowy winter hurt economic growth and demand for waste management services Many businesses in the waste management sector experience seasonal fluctuations in revenues and operating income. During the winter months, waste flows are generally lower. One reason is that as C&D activities slow down, the volume of C&D waste decreases. Another reason is that tourism tends to slow down during the winter months, resulting in a lower volume of solid waste from commercial establishments and restaurants. In addition, inclement weather causes service disruptions, which can significantly affect operating results. Companies normally experience these trends during the first and fourth quarters.
Waste Management reported revenues of $3.4 billion in the first quarter of 2014, down from $3.5 billion in the fourth quarter of 2013 and $3.6 billion in the third quarter. However, revenues in the third quarter were up from $3.5 billion in the second quarter and $3.3 billion in the first quarter of 2013.
C&D WASTE PROJECTIONS RISING WITH NEW HOUSING STARTS
In our view, C&D waste volumes, as well as commercial volumes, will gradually recover as housing starts rise, implying a likely growth in the amount of debris being disposed of in landfills.
Housing starts dropped around 38.8% in 2009, to 554,000, but rose 5.9% in 2010 to 586,900, 3.7% in 2011 to 608,800, 28.2% in 2012 to 780,600, and 18.5% in 2013 to 924,900. As of August 2014, housing starts stood
at a seasonally adjusted annual rate (SAAR) of 956,000, registering an 8.0% growth from August 2013. As of September 2014, Standard & Poor’s Economics was projecting that housing starts would rise 9.7% in 2014 to 1,020,000 units.
As new housing starts continue to rise, we also expect the amount of C&D waste to continue to increase. A 2009 study by investment bank Goldman Sachs Group Inc. noted that most large waste haulers limit their C&D waste to 5%–15% of total revenues, offsetting some of the impact from
an economic downturn. Republic Services, for example, said that C&D waste accounts for 15% of revenues in “good times” and probably 7%–10% in recent years.
GROWING COMMODITY RECYCLING VOLUME, WHILE PRICING REMAINS WEAK
Recycling commodity prices rebounded to levels more consistent with historical averages, following record low prices in late 2008 and early 2009. While commodity recycling prices remained elevated during the
TABLE B02: CONSTRUCTION & DEMOLITION DEBRIS PROJECTIONS
CONSTRUCTION & DEMOLITION DEBRIS PROJECTIONS(In millions of tons)
2008 2009 2010 2011 2012 2013
Disposal 103.4 83.1 81.0 79.9 82.9 87.2C&D landfills 49.1 39.4 38.5 37.9 39.3 41.4MSW landfills 42.7 34.3 33.5 33.0 34.2 36.0Waste-to-energy 0.9 0.7 0.7 0.7 0.7 0.8All others 10.7 8.6 8.4 8.3 8.6 9.0
Recovery 40.2 31.5 30.0 31.1 33.0 35.6Recovery % 28.0 27.5 27.0 28.0 28.5 29.0
TOTAL GENERATION 143.6 114.6 111.0 111.0 115.9 122.8
Source: Waste Business Journal.

INDUSTRY SURVEYS ENVIRONMENTAL & WASTE MANAGEMENT / OCTOBER 2014 3
second and third quarters of 2011, they fell in the fourth quarter. The decline continued in 2012 and into the first half of 2013, though volumes picked up in the second quarter of 2013.
In the second quarter of 2014, Republic Services reported a 5.4% increase in total revenue, helped by a 2.6% increase in volume. For 2013, the company reported a 1.0% decline in volume. According to Republic Services, commodity recycling prices averaged $103.5 per ton in the second quarter of 2014. In the first quarter of 2014, prices averaged $108.5 per ton, down 2.7% year over year. In its second-quarter earnings call in July 2014, the company noted that its 2014 guidance was based on an average commodity price of $110 per ton. Republic Services further noted that a $10 per ton change in commodity would change annual revenue and operating income by approximately $31 million and $19 million, respectively.
Meanwhile, Waste Connections reported a 1.5% increase in volume in the second quarter of 2014, after reporting a 2.5% increase in the first quarter of 2014. The company said that old corrugated containers (OCC) averaged $134 per ton in the second quarter of 2014, up 1.5% year over year, but down 1.5% from the first quarter of 2014. In its second-quarter earnings call in July 2014, Waste Connections said that OCC prices were holding at around $121 per ton, down about 6.0%–6.7% from the prior-year period.
CHINA EXTENDS “GREEN FENCE” FURTHER, LIMITING IMPORTS OF RECYCLABLE MATERIALS
Concerns about the global economy and tightening measures taken by China’s government have slowed the country’s growth. In July 2014, the International Monetary Fund (IMF) lowered its forecast for China’s GDP growth in 2014 to 7.4% (from the 7.5% it had projected in April), and projected growth of 7.1% in 2015. Manufacturing trends in China that drive demand for recycled materials from the US have also been sluggish. The largest supplier to China, North America (mainly the US), exported 14.5 million metric tons of recovered paper in 2013, according to RISI Inc., a forest products industry information provider. Further, according to RISI, waste paper imports to China totaled 29.2 million metric tons in 2013, down 2.0% from 29.8 million metric tons in 2012.
Operation “Green Fence” has affected imports of recycling material to China. In February 2013, China announced that it would no longer be accepting poorly sorted or “dirty” shipments of recyclable waste from foreign exporters. Chinese authorities have rejected more than 800,000 tonnes of recyclable scrap since February 2013; exports to China fell 3.1% in June. We had expected “Green Fence” to come down in time for the 2013 holiday shipping season, but China has extended its ban on importing “dirty” scrap materials into 2014 (though some regions recently lifted the moratorium). The ban has led to higher processing costs for US recyclers. In the long run, however, we think these stricter regulations should lead to US recyclers doing a better job of cleaning up their waste materials before exporting them overseas.
Environmental protection has been especially emphasized in China’s 2011–2015 five-year plan, which implies a greater focus on domestic recycling. Even though per capita paper consumption is rising in China, it remains below that of developed countries such as the US. There is room for continued growth in the paper sector in China; however, the growth may not be forthcoming due to inefficiencies and the huge capital expenditures (capex) required by paper mills to meet new and improved environmental standards.
The containerboard segment in China, which has been a major market for waste recycling companies in the US, is also growing. According to RISI estimates, China will expand its containerboard capacity by nine million tons between 2012 and 2014. According to Pöyry Management Consulting (London) Ltd., a consultant in the pulp and paper supply industry, Chinese paper producers will be using around 81 million tons of recovered paper by 2015 and around 98 million tons by 2020, which would be more than a 50% increase from current levels. This increase in demand for recovered paper should ensure that China’s demand for imported recovered paper remains at least at current levels, as some of this paper will be used domestically within China. With China boosting its domestic growth, its reliance on imports of recovered paper and plastics is likely to go down, as more materials will be available within the country. Demand remains strong, however, and China will likely continue to import recycled paper and plastics.

4 ENVIRONMENTAL & WASTE MANAGEMENT / OCTOBER 2014 INDUSTRY SURVEYS
MAJOR HAULERS BENEFIT FROM COST SAVINGS
Results of restructuring efforts taken in 2012 In July 2012, Waste Management Inc. announced a restructuring plan to streamline management and support staff to reduce costs. The plan includes removal of the management layer consisting of four existing geographic groups; consolidation and reduction of the number of areas managing the core collection, disposal, and recycling businesses from 22 to 17; and reduction of corporate support staff in an effort to better align support with the needs of the operating units. The restructuring, which was completed in the fourth quarter of 2012, led to the elimination of nearly 700 employees. In 2012, the company recognized a total of $56 million worth of restructuring charges related to this reorganization. In 2013, Waste Management recognized a total of $7 million of restructuring charges related to employee severance and benefit costs, including costs associated with its acquisitions of Greenstar and RCI.
In October 2012, Republic Services restructured its field and corporate operations. The changes included consolidating field regions from four to three, and areas from 28 to 20; relocating office space; and reducing administrative staffing levels. In 2012 and 2013, the company incurred $11.1 million and $8.6 million of restructuring charges, respectively, which consisted of severance and other employee termination benefits, relocation benefits, and the closure of offices with lease agreements. In the first half of 2014, Republic incurred $1.8 million of restructuring charges and expects to incur a further $2.7 million in the second half of the year. The company expects that the restructuring will reduce selling, general, and administrative expenses by $23 million annually.
SINGLE-STREAM RECYCLING ADDS INCENTIVE
Single-stream recycling provides a huge incentive for consumers to recycle paper, plastic, glass, and metal rather than throwing those items into the trash. Each customer receives a large container that resembles a regular garbage cart, complete with wheels and a lid that protects the contents against rain and wind. Because the recyclables are separated mechanically at the recycling plant, these materials can go into the cart without any sorting, stacking, or bundling. This makes it easier for customers, who also gain extra space in their own trash carts.
Such single-stream recycling increases consumer participation and reduces the amount of waste that goes into landfills. According to an article published in October 2011 in Waste & Recycling News (now Waste360), since its rollout of single-stream recycling in 2010, Cincinnati has been able to increase participation by nearly 75% and has increased the amount of recyclables collected curbside by nearly 50%. Austin, Texas, which began phasing in such recycling in 2008, saw its curbside waste drop by nearly 10%, which translates to a 13,000-ton reduction in landfill use, and its curbside recycling increase by more than 50%. Providence, Rhode Island, introduced its program in October 2012 and reached a recycling rate of 25% in December 2012, much higher than the 15% rate before the introduction of the single-stream recycling program. With the 25% recycling rate, the city can save $250,000 annually on tipping fees in central landfills.
Waste haulers are also converting their facilities to single stream. For instance, in April 2013, ReCommunity, a North Carolina-based recycling company, converted its dual-stream materials recycling facility (MRF) in Memphis into a single-stream facility. The company noted that the modernized facility will automatically process and sort glass, aluminum, steel, plastic, newspapers, magazines, and cardboard, resulting in less manual sorting and higher quality end products. In November 2012, Waste Management opened its new single-stream recycling facility in North Carolina. The company noted that the facility employs advanced recycling technology, which can result in an average recovery of up to 30% more recyclable materials.
HAULERS CONVERTING THEIR FLEETS FROM DIESEL TO CNG
The rising cost pressure of diesel-fueled fleets is prompting more waste haulers to convert to vehicles powered by cleaner alternative fuels, such as compressed natural gas (CNG). Some larger companies are even investing in their own filling stations to save costs and improve operational efficiencies. In June 2012, Ace Solid Waste Inc., a Minnesota-based waste and recycling company, announced its plans to convert its

INDUSTRY SURVEYS ENVIRONMENTAL & WASTE MANAGEMENT / OCTOBER 2014 5
60-truck fleet to CNG over the next several years. The hauler has also contracted for the construction of a “time-fill” station in Minnesota that can fuel 40 trucks overnight.
The spurt in US natural gas production because of fracking has made fuel a far more attractive alternative for companies in various industries. According to Energy Vision, a nonprofit group working toward greater use of natural gas, transit buses form the largest market for natural gas-powered heavy-duty vehicles in the US, followed by waste haulers. Companies see cleaner burning of natural gas and quieter rides as additional benefits of this transition.
Waste Management is the most prominent example among waste haulers adopting cleaner fuels to run their garbage truck fleets. The company started migrating its fleet to liquefied natural gas (LNG) in 2000 and has turned toward converting landfill gas into LNG to fuel its fleet. The company is known for having the largest alternative fuel fleet in North America, consisting of more than 2,200 CNG and LNG trucks. In April 2013, Waste Management said that 90%–95% of new refuse trucks purchased by the company would operate on natural gas. According to the company, every diesel-to-natural gas vehicle conversion reduces diesel use by an average of 8,000 gallons per year and cuts annual greenhouse gas emissions by an average of 22 metric tons.
On July 31, 2013, Waste Management announced the opening of its 50th company-owned CNG station. Some of these stations are accessible to the public, and are therefore equipped with “fast-fill” capability (in contrast to the “time-fill” stations used by the company). With the $2 million CNG station that Waste Management opened in North Portland in August 2012, the company applied for a tax credit under Oregon’s new alternative fuel incentive program. Two other Portland-based haulers (Gresham Sanitary Service and Heiberg Garbage & Recycling) have also applied for tax credits for adding CNG vehicles to their fleets. Republic Services is another company that has been working toward converting its fleet to CNG. In 2013, 40% of the new trucks that the company ordered were CNG vehicles. Republic Services aims to have around 20% of its vehicles fueled by natural gas and other alternative fuels by 2016.
GOVERNMENT REGULATIONS
In February 2009, Congress passed the American Recovery and Reinvestment Act of 2009, a $787 billion economic stimulus plan. About $40 billion of that amount was allocated to the US Department of Energy (DOE); $18 billion slated for water infrastructure, flood prevention, and environmental cleanup; and $6.4 billion for the cleanup of nuclear weapons production sites. Of the DOE funds, $11 billion was earmarked for efficient electricity grids, $3.4 billion for fossil-fuel research and development, and $2 billion for advanced vehicle battery systems.
In 2009, the government predicted that it would take several more decades to clean up the Savannah River nuclear site in South Carolina and the Hanford site in Washington State, at a cost of $274 billion to $330 billion. The government started cleaning the Hanford site in 1989.
Diesel emission standards for light vehicles In August 2012, the Obama Administration finalized the emission standards for light-duty vehicles. Cars and trucks for the model years 2017 through 2025 will be required to have an average carbon dioxide (CO2) level of 163 grams per mile, or 54.5 miles per gallon, by 2025, assuming all reductions are made through fuel-economy improvements. The program is expected to cut six billion metric tons of greenhouse gases (GHG) over the lifetimes of the vehicles sold through 2012–2025. Consumers who purchase a new model-year 2025 vehicle will save more than $8,000 in fuel costs over that vehicle’s lifetime (compared with a vehicle that meets the current Corporate Average Fuel Economy, or CAFE, standards).
In March 2013, the Environmental Protection Agency (EPA) released Tier 3 emission standards for light-duty vehicles. The standards require a gradual reduction in non-methane organic gases and nitrogen oxides to reach 30 mg/mi (Federal Test Procedure, or FTP) and 50 mg/mi (Supplemental FTP) for passenger cars and light-duty trucks by 2025.

6 ENVIRONMENTAL & WASTE MANAGEMENT / OCTOBER 2014 INDUSTRY SURVEYS
Revised CO2 fuel standards for heavy vehicles In April 2011, the Obama Administration laid out the first fuel efficiency standards for heavy vehicles in the US. The standards apply to vehicles made between 2014 and 2018, and are expected to save $50 billion in fuel costs and 530 million barrels of oil over this period. By the end of 2018, long-haul trucks will be required to reduce fuel consumption and GHG emissions by 23%. Federal officials said the stricter limits will increase the cost of vehicles, but will also reduce fuel costs. For instance, the price of a tractor-trailer may go up by $6,220, but the fuel cost savings over its operating life will total $73,000. Regulations for heavy-duty pickup trucks and vans will differ according to the type of vehicle. Gas-fueled vehicles will be required to reduce fuel use by 10% and carbon emissions by 12%, while diesel-powered trucks and vans will be required to reduce oil use by 15% and emissions by 17%.
The President’s climate action plan released in June 2013 requires the development of post-2018 fuel economy standards for heavy-duty vehicles to further reduce fuel consumption. The administration plans to collaborate with other key stakeholders to come up with new standard through the application of advanced cost-effective technologies.
THE WATER INDUSTRY
According to the TechKNOWLEDGEy Strategic Group, a management consulting firm that focuses on the commercial water and environmental services industries, the US water industry generated revenues of more than $151 billion in 2013, up 3.9% from 2012. However, the sector faces challenges, such as rising infrastructure needs due to aging water systems, increasing demand, more stringent regulations, and budget cuts. Trends like public-private partnerships (PPPs) and consolidation are gaining momentum. The move to consolidate, coupled with a strong potential for growth, have
drawn increasing interest from private equity investors. Strategic acquisitions are still guiding the growth of the market players. New regulations continue to govern the sector.
Government budget cuts hurt water infrastructure funding The US drinking water infrastructure needs an additional investment of around $1 trillion in the next 25 years, according to the February 2012 American Water Works Association (AWWA) report Buried No
Longer: Confronting America’s Water Infrastructure Challenge. The report said that the investment is required almost equally for both expansion and replacement efforts.
A report published by the American Society of Civil Engineers (ASCE) in March 2013 (latest available) graded US water systems with a “D” rating, which means the risk of failure is strong. According to the report, the main problem is funding. The report noted that federal support for water infrastructure has dropped drastically. The Congressional Budget Office estimates that an investment of more than $300 billion is required in sewage collection and treatment over the next 20 years to keep waterways safe and clean. Congressional appropriations have declined over the five-year period from 2008 to 2012, totaling only $6.9 billion—an average of $1.4 billion
TABLE B03: US WATER INDUSTRY
THE US WATER INDUSTRY—2013
REVENUES % CHG.
(MIL.$) 2012- 2013
Water treatment equipment 11,900 4.0Delivery and infrastructure equipment 12,550 2.8Water treatment chemicals 4,900 5.0Contract operations 3,180 3.3Consulting and engineering 10,740 4.3Instruments and testing 2,300 3.5Wastew ater utilities 53,160 4.5Drinking w ater utilities 52,600 3.6
Total 151,330 3.9Source: TechKNOWLEDGE y Strategic Group.
Chart H05: WATER INFRASTRUCTURE INVESTMENT NEEDS
0
25
50
75
100
125
2011 2020 2040 2011 2020 2040
Funded Unfunded
*Latest availableSource: American Society of Civil Engineers.
WATER INFRASTRUCTURE INVESTMENT NEEDS*
WASTEWATER DRINKING WATER

INDUSTRY SURVEYS ENVIRONMENTAL & WASTE MANAGEMENT / OCTOBER 2014 7
annually. The report also noted that failure to act would undo decades of improvement to public health standards and put 1.4 million jobs at risk by 2040.
In May 2009, the Senate Environmental Committee passed the Water Infrastructure Financing Act, which was to increase the Clean Water State Revolving Fund to $20 billion and the Drinking Water State Revolving Fund to $14.7 billion, both over five years. The funds provide low-interest loans to communities for infrastructure upgrades.
However, the White House’s sequestration order on March 1, 2013 cut the EPA’s fiscal 2013 budget by $472 million. These budget cuts have made it difficult for states and municipalities to deal with the rising infrastructure needs and stringent regulations governing the sector. Furthermore, in the proposed budget for fiscal 2014, the EPA has seen a decrease of $296 million from the 2012 enacted levels, to under $8.2 billion. The budget by appropriation includes $3.2 billion (38.7%) for state and tribal assistance grants; $2.8 billion (34.5%) for environmental programs and management; $1.2 billion (14.5%) for the Superfund program; and $784 million (9.6%) for science and technology. Meanwhile, the state revolving funds (SRFs) have seen
a decrease of $472 million. The fiscal 2014 budget request included $817 million for the Drinking Water SRF (down $100 million from the fiscal 2012 enacted level) and $1.1 billion for the Clean Water SRF (down $350 million from the fiscal 2012 enacted level).
Public-private ventures to operate water systems The EPA believes that this country’s SRFs will not be able to address the above-mentioned infrastructure needs, and therefore feels that it is important to explore other approaches to raise the required funds. One such approach is PPPs, a growing trend over the past few years. In 2010 and 2011, contract renewal rates dipped, but reversed in 2012. Overall, the last decade has been remarkably steady. According to Public Works Financing (PWF), renewal rates in most years have exceeded 85%, indicating a high degree of satisfaction with water partnerships among municipal clients.
In January 2013, Veolia Water North America won a 30-year contract to manage water and wastewater systems for the city of Rialto, California, and its water agency. The contract is valued at approximately $300 million. In July 2012, CH2M Hill received a contract from Charlotte, North Carolina, to manage the city’s PPP venture called “Smart Water Now.” CH2M Hill will run the program in conjunction with companies such as Verizon Communications Inc., Itron Inc., and Siemens AG, which will provide support services. The program aims to reduce the city’s water usage by 20% by 2016. In April 2012, United Water Inc. received a two-year renewal of its contract (effective January 2012 and valued at $4 million) to maintain the wastewater system serving Bensenville, Illinois.
Consolidation in highly fragmented sector: water utilities acquire water systems in core regions In the first nine months of 2014, Aqua America purchased seven water and wastewater utility systems: three in Virginia and one each in North Carolina, New Jersey, Illinois, and Pennsylvania. The most significant was the acquisition of the wastewater system of Penn Township, Chester County on March 31 for $3.7 million. The wastewater system provides service to 776 residential and 25 commercial customers, including Jennersville Regional Hospital. The latest transaction was on September 8, when the company’s subsidiary in Virginia acquired Caroline Water Company, Inc. for $1.1 million. As Aqua America targets core markets, it is also divesting underperforming assets. In March 2013, the company sold about two-thirds of its Florida operations to the Florida Governmental Utility Authority (FGUA) for $52 million. Aqua America sold its
Chart H16: EPA BUDGET
0
2
4
6
8
10
12
2005 06 07 08 09 10 11 12 13 14 2015
Source: US Environmental Protection Agency.
EPA BUDGET
(Billions of dollars)

8 ENVIRONMENTAL & WASTE MANAGEMENT / OCTOBER 2014 INDUSTRY SURVEYS
remaining operations in Sarasota, Florida, on December 13 for $36.8 million. The utility has also agreed to sell its water unit in Fort Wayne, Indiana, for an additional $50 million (nearly $17 million already paid by the city) in 2014.
American Water Works is another company that has been active in acquiring assets. On March 10, 2014, its subsidiary, Indiana American Water, acquired Merom Water System for $390,000. In addition, on April 28, Indiana American Water acquired Yankeetown Water System, which serves a population of approximately 1,700 residents, for $2 million.
Major players in the industry, such as Aqua America and American Water Works, are also engaged in asset swaps. In May 2012, Aqua America acquired American Water Works’ regulated operations in Ohio for $101 million in cash (including $11 million in assumed debt) and sold its regulated operations in New York to American Water Works for $39 million in cash (including $23 million in assumed debt). This transaction was the final step in the property swap between the two companies. In January 2012, Aqua America completed the sale of its Maine operations for $53.5 million to Connecticut Water Service Inc. In January 2012, American Water Works sold off its regulated water and wastewater operations in Arizona and New Mexico to EPCOR USA, a unit of EPCOR Utilities Inc., for $470 million. The deal allowed American Water Works to focus on its core areas.
Meanwhile, the cost of water continues to rise, as aging water systems need to be replaced and budget-strapped municipalities pass the costs on to consumers. However, water reuse is growing in popularity for irrigation and other uses that do not require the same costly treatment as potable water. More municipalities are seeking reuse and desalination projects as technology continues to become more cost efficient.
Aqua America: new water pipeline for shale gas drilling eliminates truck use Subsidiaries of Aqua America and Penn Virginia entered into a joint venture in late 2011 to form Aqua-PVR Services LLC in order to build and operate a pipeline system that will provide fresh water to natural gas producers drilling in the Marcellus Shale in Pennsylvania. The 18-mile steel pipeline, which cost $24 million, began operations in April 2012. Phase II construction of the second 18-mile stretch began in June and was completed by December. In Phase III, which was completed in early 2013, the company extended the pipeline by 20 miles to Tioga County.
The company feels that it is playing an important role in cleaning the environment and reducing the use of non-renewable sources of energy by eliminating the need for truck trips to the drilling sites. Every one million gallons of water that the pipeline carries eliminates the need for 200 truck trips. In its 2012 fourth-quarter earnings announcement in February 2013, the company estimated that it had eliminated the need for 24,000 truck trips to date. In the first-quarter 2013 earnings call in May 2013, Aqua America noted that the joint venture added $0.01 per share to its earnings in 2012. In 2013, however, the joint venture reduced earnings by $0.01 per share. Every year from 2014, Aqua America expects to double the $0.01 per share it earned in 2012, until it reaches $0.10 per share.
The company is also stepping up its efforts to encourage natural gas usage, as evidenced by its announcement in May 2012 that it would migrate its large-vehicle fleet to CNG. Aqua Pennsylvania, the company’s largest subsidiary, has been running CNG vehicles on a pilot basis for more than a year, and is planning to build a slow-fill fueling station in Delaware County. Furthermore, the company’s Pennsylvania and New Jersey subsidiaries have built four solar farms over the past two years to meet the power needs of their treatment facilities.
Tax strategy in Pennsylvania eliminates need for customer rate hike Aqua America announced in December 2012 that it has adopted the repair tax accounting change, as permitted under the Internal Revenue Service (IRS) regulations, for its largest subsidiary, Aqua Pennsylvania, and accounted for the change in accordance with the company’s last Pennsylvania rate case order. The company will use flow-through accounting for the tax benefits of the repair tax accounting change, according to a previously disclosed Pennsylvania rate order from June 2012. This change will allow a tax deduction for infrastructure investments that were earlier capitalized for tax purposes. The ongoing tax accounting change will allow Aqua Pennsylvania to continue its infrastructure improvement program

INDUSTRY SURVEYS ENVIRONMENTAL & WASTE MANAGEMENT / OCTOBER 2014 9
without increasing customer rates, while still allowing the company to maintain its financial performance. Implementation of the new tax accounting method led to a 2.82% reduction in rates for Aqua Pennsylvania customers, starting in January 2013 (through the suspension of its Distribution System Improvement Charge, or DSIC). No rate increases are projected for 2014, even though the company continues to invest in infrastructure improvements at record levels.
INDUSTRY REVIEW AND OUTLOOK
Environmental and waste management As of October 2014, we had a positive fundamental outlook for the environmental and facilities services sub-industry for the next 12 months, based on our view that market conditions will continue to improve gradually, with the industrial and commercial sectors starting to recover. We expect core pricing to continue to drive top-line organic growth, despite a still-competitive environment. In our view, commodity recycling prices should stabilize at low levels, before slowly moving higher later in 2014, as we think China will lift its “Green Fence” ban on the import of contaminated recycling materials, and manufacturing in China will pick up. We look for solid free cash generation to continue to be targeted for share repurchases, debt reduction, strategic “tuck-in” acquisitions, and dividend increases.
We think that the largest North American haulers will continue to divest underperforming assets and make selective and accretive acquisitions, while seeking to enhance their customer service as an incentive to maintain a high retention rate. We expect C&D volume to remain fairly strong, assuming housing starts strengthen again. Although landfill capacity averages over 20 years, landfill prices (landfills tend to generate higher margins) should rise during 2014, as more third-party waste is disposed of in the largest waste hauler landfills. Longer term, we see a growing environmental trend from the conversion of methane gas at landfills into energy.
We expect acquisitions to gain momentum as smaller haulers continue to experience operating difficulties in this highly regulated and capital-intensive industry, with acquisition multiples remaining attractive for the major players, near or below the average historical 6X to 7X EBITDA range. However, private equity firms could drive up selling prices, while the possibility of conversions to Real Estate Investment Trust (REIT) or Master Limited Partnership (MLP) status could enhance shareholder value as landfill assets are separated from the rest of the company and 90% of income is paid out as dividends.
Year to date through October 3, 2014, the S&P Environmental & Facilities Services Index advanced 4.3%, while the S&P 1500 Composite Stock Index gained 5.7%. In 2013, the Environmental & Facilities Services group increased 24.8%, compared with a 30.1% increase in the S&P 1500 index.
Water utilities As of October 2014, our fundamental outlook for the water utilities sub-industry remains neutral, based on our view that tight customer spending budgets will continue to impact near-term performance while the housing market recovery slows somewhat, limiting new customer volume growth. Longer term, we think aging water systems will require repair, while demand for clean water, especially in warm and dry regions where population is expanding, drives capital investments.
We expect more budget-strapped municipalities to look to sell their water systems to private companies or establish public-private operating partnerships, despite some opposition from residential customers due to service and economic concerns. The EPA’s plans to overhaul drinking water regulations will likely require water systems to use more advanced and costlier technologies. Additional new revenue should come from water stations and pipelines set for refracking shale gas wells, which Aqua America has been installing in the Marcellus region in Pennsylvania.
We see modest global growth near term in desalination, a process by which salt is removed from seawater as a source for drinking water. However, as costs gradually decline, more desalination projects are likely in dry areas such as Nevada, Arizona, California, and Texas, and developing regions of the world, especially in the Middle East. According to Global Water Intelligence, a trade publication, annual spending on desalination will rise from $10 billion to $16 billion by 2020. The AWWA forecasts that the cost to replace

10 ENVIRONMENTAL & WASTE MANAGEMENT / OCTOBER 2014 INDUSTRY SURVEYS
deteriorating water pipes will more than double to nearly $30 billion annually by the 2040s. In June 2013, an EPA survey projected total investments for US drinking water system repairs and improvements of $384 billion through 2030.
Year to date through October 3, 2014, the S&P Water Utilities Index climbed 2.0%, versus a 5.7% rise for the S&P 1500 Composite Index and a 10.5% rise in the S&P Utilities Index. In 2013, the group advanced 16.8%, versus a 30.1% gain for the broader market index. We think long-term investors view this group as a safe haven during cyclical downturns. However, with more favorable economic indicators and signs of higher interest rates ahead, we expect investors to turn to sectors with lower debt-to-capital ratios, as utilities will likely incur higher interest expense when they roll over their long-term debt.

INDUSTRY SURVEYS ENVIRONMENTAL & WASTE MANAGEMENT / OCTOBER 2014 11
INDUSTRY PROFILE
A broad and diverse environmental services industry
The environmental services industry includes a wide variety of businesses. Solid waste and hazardous materials management providers pick up waste and deposit it in landfills or incinerators. Water utilities provide wastewater treatment and supply water to residences and businesses. Manufacturers of air pollution equipment make products that limit toxic emissions and smog, which environmental engineering and construction companies then install or retrofit on smokestacks or other facilities. Environmental consultants provide research and advice to numerous businesses.
The major companies in these segments, detailed in the “Environmental Sectors” table below, are estimated to generate revenues of more than $200 billion in the US each year. This Survey focuses mainly on water, wastewater, and solid waste companies.
SOLID WASTE MANAGEMENT
The municipal solid waste (MSW) business mainly involves the collection, disposal (through landfills and incineration), and recycling of nonhazardous solid waste. The MSW industry comprises five lines of business. The largest is waste collection, which accounts for the majority of revenues. North America’s largest hauler, Waste Management Inc., generated around 52% of its revenues from its collection businesses in 2013. This was followed by landfills (17%), recycling (9%), transfer stations (8%), the company’s Wheelabrator Technologies waste-to-energy incineration business (5%), and other (10%). While the industry remains relatively fragmented and highly competitive, it continues to consolidate.
Table B10: Environmental sectors
ENVIRONMENTAL SECTORS(As of September 2014)
MAJOR COMPANIES
WATER SUPPLY AND TREATMENT
Water utilities American Water Works, Aqua America, United Water (a unit of Suez Environnement), American States Water, California Water Services Group
Water infrastructure Insituform TechnologiesConsumer bottled w ater, residential/ commerical w ater f ilter products
Perrier Group, Culligan International (a unit of Clayton, Dubilier & Rice, Inc.), Groupe Danone (France), Pepsico Inc., Coca-Cola Co., Pentair Inc., Watts Water Technologies Inc.
Water supply/treatment Tetra Tech, CH2M Hill Ltd., Roy F. Weston, URS Corp., MWH Global, Bechtel, Veolia Environnement North America, Layne Christensen
SOLID- WASTE MANAGEMENT
Municipal solid w aste (MSW) Waste Management, Republic Services, Casella Waste Systems, Waste Connections, Veolia Environnement North America
Hazardous solid w aste Veolia Environnement North America, Clean Harbors, Jacobs Engineering Group, CH2M Hill Ltd., URS Corp., Waste Management, Stericycle, Arcadis, Aecom Technology
Nuclear Waste EnergySolutions LLC, Bechtel, CH2M Hill Ltd., Fluor Corp., URS Corp., Jacobs Engineering Group, Tetra Tech
AIR POLLUTION CONTROL
Vehicle emissions control equipment Allied Signal, Corning Inc., De Gussa-Hüls AG, Engelhard Corp., Johnson Matthey PLC, NGK-Locke Inc.
Industrial emissions control equipment Bechtel, URS Corp., Air-Cure Inc., Comfort Systems, Hamon Research-Cottrell, CLARCOR, Donaldson, Fluor Corp., Tetra Tech
ENVIRONMENTAL REMEDIATION Fluor Corp., Tetra Tech, CH2M Hill, CET Environmental Services Inc., Jacobs Engineering Group, Kiew it Corp., Sevenson Environmental Services Inc., Roy F. Weston, Bechtel Corp., URS Corp., Earth Tech, Insituform Technologies
Sources: Engineering New s-Record, industry associations, and other.

12 ENVIRONMENTAL & WASTE MANAGEMENT / OCTOBER 2014 INDUSTRY SURVEYS
According to S&P Capital IQ estimates, market leaders Waste Management and Republic Services hold a combined solid waste market share of about 40%, while less than 25% is held by municipalities (in which around 10,000 companies operate), down from about 35% 20 years ago. The US generated a total of about 250 million tons of MSW waste each year; the all-time high was 255 million tons in 2007, according to the Environmental Protection Agency (EPA). According to RISI, an information provider for the global forest products industry, 39.9% of total US recovered paper was exported out of the country in 2013, up from 24% in 1994.
As of year-end 2013, the top two investor-owned, publicly held waste hauling and disposal companies—Waste Management and Republic Services—accounted for almost 70% of the revenues generated by such publicly owned companies and served approximately 37 million customers. Almost 4,000 small private firms (annual revenues of $2 million or less) remain as potential acquisition candidates.
The maturing hazardous waste management segment generated $13.1 billion in revenues in 2013, according to a survey of the top 200 environmental firms conducted by Engineering News-Record (ENR), up nearly 13.9% from 2012. (ENR is an industry publication published by a unit of McGraw-Hill Financial, the parent company of S&P Capital IQ.) Segment leader Clean Harbors Inc. accounted for nearly $1.9 billion of those revenues in 2013. In Canada and the US, 22 landfills are permitted to accept hazardous wastes, according to American Recycler, an industry news source.
WATER SUPPLY AND TREATMENT
Revenues for the US water and wastewater industry grew in the low single digits in 2013. The sector is highly fragmented. According to the EPA, utilities owned by municipal systems account for around 84% of total community water and wastewater utilities in the US. The non-municipal water supply sector consists of 10 publicly traded, investor-owned water utilities (down from 23 in the 1990s), about 16,500 privately held, investor-owned companies, and 12,000 ancillary systems serving less than 1% of the population. According to the National Association of Water Companies, a trade group,
private firms operate more than 2,400 municipal water and wastewater facilities.
In addition to regulated water utilities (both municipal and privately owned), the industry includes non-regulated companies in various segments. Looking at the revenues for the top 200 environmental firms in 2013, as reported by ENR in August 2014, wastewater segment revenues totaled $9.8 billion, while water supply segment revenues amounted to $10.8 billion. Together, these two segments accounted for around 38.3% of
Table B09: Leading investor-owned US water utilities
LEADING INVESTOR-OWNED US WATER UTILITIES(Ranked by 2013 revenues)
- - - - - - REVENUES (MIL.$) - - - - - -
COMPANY 2012 2013 % CHG.
American Water Works Co. 2,877 2,902 0.9
Aqua America Inc. 758 769 1.4California Water Service Group 560 584 4.3American States Water Co. 467 472 1.1SJW Corp. 262 277 5.9
Note: Percent changes based on unrounded data.Source: Company reports.
Table B07: LARGEST PUBLICLY TRADED US ENVIRONMENTAL WASTE COMPANIES
LARGEST PUBLICLY TRADED US ENVIRONMENTALWASTE COMPANIES(Ranked by 2013 revenues)
- - - - - - REVENUES (MIL.$) - - - - - -
COMPANY 2012 2013 % CHG.
Waste Management Inc. 13,649 13,983 2.4Republic Services 8,118 8,417 3.7Clean Harbors 2,188 3,520 60.9Stericycle 1,913 2,143 12.0Waste Connections 1,662 1,929 16.1Covanta Energy 1,644 1,630 (0.9)Casella Waste Systems† 455 498 9.3†Fiscal years ended April 2013 and 2014.Source: Company reports.
Table B06: Top 20 hazardous waste companies
TOP 20 HAZARDOUS WASTECOMPANIES—2013
REVENUES
(MIL.$)
1. Clean Harbors 1,911.32. CB&I 1,027.83. Arcadis 695.04. CH2M Hill 626.05. URS 612.26. Veolia Environment 524.07. North Star Group 515.78. Bechtel 501.49. AMEC 468.010. Aecom Technology 322.111. Parsons 300.712. GHD 248.413. ERM 215.414. Sevenson Environ SVS Inc. 209.415. Golder Associates 172.116. CDM Smith 166.817. Cardino 157.018. SCS Engineers 153.819. Weston Solutions 152.720.Leidos 150.9
Total, Top 20 9,130.7% of total sector revenue 69.9
Source: Engineering News Record.

INDUSTRY SURVEYS ENVIRONMENTAL & WASTE MANAGEMENT / OCTOBER 2014 13
total revenues in 2013 for the top 200 environmental firms. Other segments among ENR’s 200 firms include hazardous waste (24.3% of revenues), nuclear waste (11.2%), and air pollution control (6.5%).
AIR POLLUTION CONTROL
The air pollution control industry provides equipment and services to the automotive industry and various smokestack industries. It has four main sectors. The two largest—vehicle pollution control equipment (mobile source control) and industrial plant pollution control equipment and chemicals (end-of-pipe stationary source control)—account for 90% of the market. The other two sectors are indoor air pollution control and consulting, and monitoring equipment.
ENVIRONMENTAL REMEDIATION
Proposed new coal and natural gas facilities require a variety of consulting and permitting services, which has benefited the US remediation consulting market. The remediation industry is fragmented and competitive, but consolidation has been on the rise.
INDUSTRY TRENDS
This section discusses trends in the various segments of the environmental and waste management industry—solid waste management (including recycling), water supply and treatment, air pollution control, and environmental remediation.
Waste volumes trending upward as economy improves According to the August 12, 2014 issue of Engineering News-Record (ENR), revenues for its top 200 environmental firms increased 3.9%
to $53.7 billion in 2013, versus a 4.5% drop in 2012, 5.5% growth in 2011, and 6.2% growth in 2010, following a recession-caused decline in 2009. International business recorded considerable growth of 6.6%, with double-digit increases in Latin America and Australia. Domestic (US) revenues increased by 2.2% to $38.9 billion, after a 9.0% falloff in 2012. The weakness in domestic revenues in 2012 reflected significant drops reported in the construction and remediation category, and the wastewater category. In 2011, domestic revenue had increased 0.7% versus a 4.3% growth reported in 2010.
Revenues declined 8.2% in 2009 following five consecutive years of growth. The private sector has been grappling with problems of funding; however, the sector witnessed considerable growth of nearly 23% in
2011, following growth of nearly 9% in 2010. Most of the environmental firms are facing problems on the funding front. The emerging trend of a rise in public-private partnerships (PPPs) is filling the funding gap to
Chart H09: TOTAL ENVIRONMENTAL SERVICES MARKET REVENUE BREAKDOWN
4.2%
6.5%
6.6%
8.9%
11.2%
18.2%
20.1%
24.3%
0 1 2 3 4 5 6 7 8 9 10 11 12 13 14 15
Others
Air
Environmentalmanagement
Environmentalscience
Nuclear waste
Wastewater
Water supplytreatment
Hazardous waste
Source: Engineering News Record; S&P Capital IQ.
TOTAL ENVIRONMENTAL SERVICES MARKET REVENUE BREAKDOWN—2013
Billions of dollarsTotal: $53.7 billion
Table B08: TOP 20 WATER TREATMENT/SUPPLY COS.
TOP 20 WATER TREATMENT/SUPPLY COMPANIES—2013
REVENUES
COMPANY (MIL.$)
1. Tetra Tech 1,288.12. CH2M Hill 1,155.93. Suez Environment 805.04. Aecom Technology 624.95. MWH Global 574.46. Bechtel 451.27. Garney Holding 439.08. Black & Veatch 436.49. Kiew it 345.810. The Walsh Group 322.411. Veolia Environment 314.412. CDM Smith 313.713. Layne Christensen 290.914. GHD 213.915. PCL Construction 212.016. HDR 181.917. McCarthy Holdings 166.418. URS 161.119. Stantec 158.320.Barnard Construction 141.1
Total, Top 20 8,596.8% of total sector revenue 79.8
Source: Engineering News Record.

14 ENVIRONMENTAL & WASTE MANAGEMENT / OCTOBER 2014 INDUSTRY SURVEYS
some extent, but a simultaneous increase in competition is not helping resolve the situation fully. Too many contractors are competing to get a single project, with newer contractors, who are underestimating the cost of a project in their bids, adding to the problem.
SOLID WASTE MANAGEMENT: STRONG CASH GENERATION
In 2013, the solid waste management segment saw a strong trend of huge cash generation, which companies target for financing share buyback programs and strategic acquisitions, payment of dividends, and reduction in debt capital.
Waste Management, for instance, is planning to make tuck-in acquisitions to gain significant synergies, and is seeking acquisitions at 5.5X–6X earnings before, interest, taxes, depreciation, and amortization (EBITDA) multiples. The company is also looking at growth fueled by partnerships and joint ventures, with opportunities looking bright in China and the UK. In 2013, Waste Management had cash flow from operating activities of $2.5 billion (an increase of $160 million from 2012), and it invested $724 million in acquisitions.
In 2013, Republic Services generated operating cash flow of $1.5 billion. The company repurchased 6.5 million shares for $213.6 million during 2013; a $760.6 million repurchase authorization remained in effect through 2013. In July 2013, the board of directors approved a 10.6% increase in the quarterly dividend, to $0.26 per share. The company completed deals worth $68.7 million against a target of $100 million in acquisitions in 2013.
Increasing competition and rising commodity prices are constantly pressurizing haulers to achieve greater operating efficiencies. Companies are adopting restructuring initiatives, which involve possible reductions in workforce. They are also attempting to achieve higher fleet efficiencies, to minimize safety and health insurance costs and to rework routes to make them more cost efficient.
Companies also intend to replace their fuel-based vehicles with natural gas-based vehicles as fuel costs continue to rise and affect profitability. At the end of 2013, Waste Management had 58 company-owned natural gas stations, with plans to build more in 2014. The company has the largest alternative fuel fleet in North America, consisting of more than 2,000 compressed natural gas (CNG) and liquefied natural gas (LNG) trucks. Similarly, Republic Services said that it is continuing to invest in fleet automation and the conversion of its fleet to CNG. In 2013, approximately 50% of the company’s replacement vehicle purchases were CNG vehicles, and approximately 12% of its fleet was operating on natural gas at the end of 2013.
LARGER LANDFILLS, BUT MORE DIVERSION
Although the number of landfills in the US has dropped considerably, from 8,000 in 1988 to about 1,900 recently, the average size (measured by disposal volume) has more than tripled since 1991—to 3.5 million tons of capacity—as new, larger facilities have replaced older, smaller ones. However, a rise in recycling and other programs means that more trash is being diverted away from traditional landfills. Much goes to material recovery facilities (MRFs) and waste-to-energy (WTE) plants, while more electronic waste is being returned to manufacturers and other waste is composted. Municipalities and businesses are setting zero-waste goals, while renewable energy and climate change initiatives are gaining momentum. Industry experts expect diversion to continue to increase, lowering the amount of waste going to landfills.
Over 88 million tons of municipal solid waste (MSW) was generated in the US in 1960, with only 5.6 million tons (6%) recycled, according to the 2011 Facts and Figures study by the US Environmental Protection Agency (EPA). In 1980, almost 152 million tons of MSW was generated, with nearly 10% recycled and 1.8% sent to WTE facilities. The recycling rate continued to trend upward: of the 251 million tons of MSW generated in 2012 (latest available), nearly 87 million tons was composted, representing a recycling rate of 34.5%. One executive at the Environmental Research and Education Foundation believes solid waste generation will begin to decline over the next 10 to 15 years, with the amount of landfilled material declining back to 1970 levels, or less than 113 million tons annually.

INDUSTRY SURVEYS ENVIRONMENTAL & WASTE MANAGEMENT / OCTOBER 2014 15
Zero waste: an industry shift Waste360 (formerly Waste Age) noted that since 1980, the waste stream has shifted away from materials that are mostly sent to landfills, toward trash that is recycled, sent to WTE facilities, or composted. The recycled materials category has expanded to include construction and demolition (C&D) debris, tires, e-waste, paper, glass, metals, and plastics. According to the latest available EPA data, the breakdown of the waste stream in 2012 was 34.5% recycled or composted, 11.7% incinerated to generate energy, and the remaining 53.8% disposed of at landfills.
A number of companies, as well as states and municipalities, are increasingly adopting goals under the sustainability movement. There is rising consciousness in the corporate world to be responsible for the end state of the products being manufactured and sold.
According to Waste360, the goals pertaining to solid waste management usually fall into four categories: waste minimization; reduced carbon emissions; greater use of renewable energy or fuel; and zero waste. Cities and businesses alike are looking at not only reducing the volumes of waste they deliver to landfills, but also generating minimal waste in the first place. San Francisco’s diversion rate more than doubled from 35% in 1990 to over 70% in 2009, with a target of 100% by 2020.
In September 2014, Century Foods International, a division of Hormel Foods Corp., announced that four of its locations achieved a zero waste-to-landfill status and reached a recycling rate of 93%. In April 2013, Bridgestone Americas Inc. noted that two of its North
American manufacturing facilities had achieved zero waste-to-landfill status. Also in April 2013, Procter & Gamble announced that 45 of its facilities across the world had reached zero-landfill status. SCA, a paper manufacturer, became the first zero waste-to-landfill plant in North America in April 2012. The facility adopted a zero waste-to-landfill program, which includes separating manufacturing, office, distribution, and maintenance waste into three categories, namely combined recyclable materials, compostable materials, and engineered fuel. Retailer Wal-Mart Stores Inc. has a zero waste-to-landfill goal, diverting nearly 60% of the waste generated by its stores. Wal-Mart’s pizza boxes are made of recycled cardboard, which equates to 8,600 tons of waste diverted from landfills.
TABLE B04: RECOVERY OF MATERIALS IN US MUNICIPAL SOLID WASTE
RECOVERY OF MATERIALS IN US MUNICIPAL SOLID WASTE
MATERIAL 1960 1970 1980 1990 2000 2010 2011 2012
RECOVERY (MIL. TONS)
Paper & paperboard 5.08 6.77 11.74 20.23 37.56 44.57 45.90 44.36Glass 0.10 0.16 0.75 2.63 2.88 3.13 3.17 3.20Metals 0.05 0.48 1.22 3.97 6.60 7.87 7.51 7.62
Steel 0.05 0.15 0.37 2.23 4.68 5.71 5.45 5.55Aluminum † 0.01 0.31 1.01 0.86 0.68 0.72 0.71Other nonferrous metals † 0.32 0.54 0.73 1.06 1.48 1.34 1.36
Plastics † † 0.02 0.37 1.48 2.55 2.65 2.80Rubber and leather 0.33 0.25 0.13 0.37 0.82 1.17 1.31 1.35Textiles 0.05 0.06 0.16 0.66 1.32 1.97 2.00 2.25Wood † † † 0.13 1.37 2.30 2.38 2.41Other materials* † 0.30 0.50 0.68 0.98 1.41 1.28 1.30Other w astes † † † 4.20 16.45 20.17 20.70 21.33
Food, other** † † † † 0.68 0.97 1.40 1.74Yard trimmings † † † 4.20 15.77 19.20 19.30 19.59Miscellaneous inorganic w astes † † † † † † † †
TOTAL MSW RECOVERED 5.61 8.02 14.52 33.24 69.46 85.14 86.90 86.62
RECOVERY AS A PERCENT OF GENERATION OF EACH MATERIAL
Paper & paperboard 16.9 15.3 21.3 27.8 42.8 62.5 65.6 64.6Glass 1.5 1.3 5.0 20.1 22.6 27.1 27.6 27.7Metals 0.5 3.5 7.9 24.0 34.8 35.1 34.2 34.0
Steel 0.5 1.2 2.9 17.6 33.1 33.8 33.0 33.0Aluminum † 1.3 17.9 35.9 27.0 19.9 20.7 19.8Other nonferrous metals † 47.8 46.6 66.4 66.3 70.5 68.4 68.0
Plastics † † 0.3 2.2 5.8 8.2 8.3 8.8Rubber and leather 17.9 8.4 3.1 6.4 12.3 15.0 17.5 17.9Textiles 2.8 2.9 6.3 11.4 13.9 15.0 15.3 15.7Wood † † † 1.1 10.1 14.5 14.8 15.2Other materials* † 39.0 19.8 21.3 24.5 29.4 27.9 28.3Other w astes † † † 6.8 25.8 28.0 28.0 28.7
Food, other** † † † † 2.3 2.8 3.9 4.8Yard trimmings † † † 12.0 51.7 57.5 57.3 57.7Miscellaneous inorganic w astes † † † † † † † †
TOTAL MSW RECOVERED 6.4 6.6 9.6 16.0 28.6 34.1 34.7 34.5*Recovery of electrolytes in batteries; probably not recycled. **Includes recovery of other MSW organics for composting. †Less than 5,000 tons (or 0.05%).Source: US Environmental Protection Agency.

16 ENVIRONMENTAL & WASTE MANAGEMENT / OCTOBER 2014 INDUSTRY SURVEYS
Automaker Honda announced in August 2011 that 10 out of its 14 manufacturing plants in North America will send “zero waste” to the landfills and the other four plants will send “virtually zero waste.” This initiative was part of Honda’s “Green Factory” program, and the waste reductions have been significant: approximately 1.8 pounds per automobile in 2013, down from 62.8 pounds in 2001. General Motors is making similar efforts, with 10 more of its manufacturing facilities achieving landfill-free status this year. The company’s facilities recycled 92% of the waste they generated last year and 76 of the company’s facilities have already achieved landfill-free status.
Landfills will still play a role in sustainable waste management strategies as technologies to recycle all sorts of waste materials are not yet in place. However, this waste diversion trend will likely lead to opportunities for companies to diversify their operations. For example, Republic Services provides education to customers on how to evaluate waste streams and determine the most environmentally efficient and cost-effective solutions for materials; the company also offers different services at different prices. The company notes that a zero-waste program is more costly, based on transportation and processing.
Large haulers, such as Waste Management Inc., have already become resource management companies, with WTE and recycling operations, according to the National Solid Waste Management Association (NSWMA). For example, Waste Management is coming up with a new single-stream MRF in Northeast Philadelphia. The company has invested more than $20 million in state-of-the-art technology. It is also planning to construct a single-stream facility in Detroit, which will increase recycling volumes by 20%–30%, and one in Pennsylvania, which will require an investment of $10 million–$15 million.
While diversification will work for larger haulers, mid-sized haulers who rely on collection and landfilling services for their revenue, with no recycling or composting facilities in their portfolios, will be affected. Smaller haulers that primarily offer collection services will adjust to the trend, as collection of waste is required, irrespective of its end treatment. Another trend that is emerging is that of larger haulers partnering with waste-generators, such as major businesses. This kind of partnership entails benefits for both. For example, Pepsi has joined with Waste Management to create the “Dream Machine,” which is a reverse vending machine created to increase beverage recycling rates.
Composting: a scrappy business The composting services market is growing, as consumers are increasingly demanding alternatives to conventional fertilizers for lawn and garden care, and municipalities and businesses seek to increase the recycling of organic materials. Organic compost, which has been growing 20% annually, is part of the green retail market. North America generates over 80 million tons of organic waste each year. In the US, about 33% of municipal solid waste (MSW) is organic, which includes food, yard, and wood waste. Approximately 65% of yard waste and 2.5% of food waste collected in the US is diverted from disposal.
The US generates around 14 million tons of food waste every year (not including leaves, branches, and yard waste), according to the EPA. When disposed of in an oxygen-poor environment, organic waste emits methane gas, which is almost 25 times more potent than carbon dioxide. With landfill gas-to-energy plants gaining ground, this methane can be put to efficient use when diverted from the landfill. The US composting industry has seen a huge surge in the number of composting facilities, which has risen from less than 1,000 in 1988 to 3,800 in 2000, according to the EPA. Further, an estimated 56.9% of yard trimmings were recovered from composting in 2000, as opposed to a 12% recovery rate in 1990.
According to a Center for a Competitive Waste Industry study of 121 cities, partially funded by the EPA, food scraps, soiled paper, and yard trimmings comprise up to 50% of all household waste, and up to 75% of that material is eligible for composting. The study, called Beyond Recycling: Composting Food Scraps and Soiled Paper, as reported in Waste & Recycling News (now Waste360) in February 1, 2010, also found that more cities are starting to look at a centralized composting program as part of a residential recycling program. While some cities, like San Francisco, adopted the organics-composting program in an effort to reach its zero-waste goals, other cities were seeking a way to reduce greenhouse gas emissions from landfills to protect groundwater from leachate and to avoid high landfill costs. The study found that tipping fees and processing fees are less expensive for composting organic material than landfilling or incinerating.

INDUSTRY SURVEYS ENVIRONMENTAL & WASTE MANAGEMENT / OCTOBER 2014 17
A new technology coming up in the field of composting is anaerobic digestion. An anaerobic digester helps in breaking down organic waste and produces biogas. This gas is then converted into electricity, pipeline-grade natural gas, or CNG.
Recology, an integrated resource recovery company that handles San Francisco’s waste and recycling streams, produces about 95,000 yards of compost from the food scraps and green waste diverted from landfills, according to a Solid Waste Report released on May 2, 2011. Furthermore, in September 2011, Waste Management announced a new organics processing and transfer facility in California. The facility, with a capital investment of $11 million, can process 150,000 tons of yard and food waste per annum.
Rising landfill capacity Over the years, the cost of developing landfills has risen dramatically, and with more attention to global warming, sources of greenhouse gases are receiving increased scrutiny. Landfills emit about 55% methane gas and 45% carbon dioxide. In the past, the main concerns about landfill development were groundwater protection and traffic. In the 1980s and early 1990s, landfill development slowed as recycling programs were expected to reduce the need for landfill space.
New technology is being used to expand the remaining life of landfills. Bioreactor technology, for example, which rapidly breaks down organic waste by adding liquid and air to the entombed waste, can increase the airspace in a typical landfill by 10% to 15%. Compactors are being used to condense waste.
The remaining landfill capacity of the leading waste management firms has increased since 2000, even though the number of landfills has fallen. The remaining permitted capacity in 2013 at Waste Management’s 267 landfills (including five hazardous waste landfills) was nearly 4.8 billion tons, up from 4.6 billion tons in 2012 and 4.5 billion tons in 2011. Average remaining landfill life was 46 years in 2013, up from 43 in 2012 and 42 in 2011. According to Waste Business Journal (WBJ), the remaining landfill capacity for MSW in the US is about 6.5 billion tons, or 19.2 years, down from 22.8 years in 1991.
In 2010, landfill tipping fees averaged $43.99 a ton. In 2013, Waste & Recycling News (now Waste360) found that the average tipping fee had increased to $49.78 a ton. WBJ Weekly Bulletin has noted that increased consolidation in the waste industry is providing more pricing power, with landfill operators focusing more on return on invested capital (ROIC) and appropriately pricing their valuable landfill capacity.
Exporting of trash is on track A common method of transporting waste is by truck, but volatile fuel costs and adverse market conditions have increased the popularity of rail. This is especially the case in the Northeast, where the distance involved in transporting waste has risen significantly since 1995, due in part to fewer landfills in that region. Over the last three years, roughly 50 million tons of solid waste has been exported to other states, up from 42.1 million tons in 2008 and only 9.5 million tons in 1991.
New York City, which manages and transports more than 12,000 tons of garbage per day, would like to decrease traffic and emissions by hauling MSW by rail, and eventually reduce the amount of trash being exported by truck from 84% of residential waste to only 13%. Since 2006, the city has entered into contracts to transport 4,000 tons of waste per day by rail, with an additional 1,200 tons per day from a Queens, New York, contract that began rail export service in early 2011. To meet its goal, the city had planned to build four marine transfer stations that would export an average of 5,770 tons of waste per day. The city’s plan included a marine transfer station in Manhattan at a cost of $125 million, a recycling facility in Manhattan on the Hudson River at a cost of $80 million, retrofits totaling $50 million to another marine transfer station in Manhattan, and a marine transfer station in Brooklyn at a cost of $108 million. However, due to budget constraints, Mayor Bloomberg plans to postpone the stations in Manhattan and Brooklyn until 2016 to 2019.
Other municipalities are also focusing on rail transport of MSW. New Jersey’s Essex County reported that, from January 2006 through May 2008, it avoided 35,366 truck trips and saved 2.2 million gallons of diesel fuel by moving waste on the tracks. The report noted that, over five years, rail transport produces 8.7 million fewer pounds of carbon monoxide than trucks and 832,869 fewer pounds of nitrous oxide. The NSWMA

18 ENVIRONMENTAL & WASTE MANAGEMENT / OCTOBER 2014 INDUSTRY SURVEYS
noted that the EPA has a policy supporting rail transport of solid waste, as many substandard landfills in operation in the early 1990s were replaced with regional landfills intended to serve large areas. Rail is a more efficient method of shipping waste long distances to these landfills. The trend appears to be growing in many communities and major cities, such as New York, Seattle, Portland (Oregon), and Los Angeles.
Pennsylvania and Virginia are among the largest importers of solid waste. According to the Department of Environmental Quality (DEQ), four states and the District of Columbia accounted for about 98.1% of all waste received in Virginia in 2013, with Maryland contributing 43.0% of the total, New York 26.0%, Washington, D.C., 18.4%, New Jersey 5.7%, and North Carolina 5.1%. However, the amount of waste received in Virginia dropped 3.7% in 2013, to 5.2 million tons.
Waste-to-energy The renewable energy drive has resulted in favorable trends for waste-to-energy (WTE) plants that produce refuse-derived fuel (RDF). According to the EPA, 16 of the 86 WTE facilities in the US as of 2011 (latest available) are RDF projects in which solid waste is processed to prepare a fuel for existing or new solid fuel boilers. This process increases the quality of the fuel, and can extract noncombustible recyclables, such as metals and glass, from the waste stream. Meanwhile, 63 plants are mass burn and seven are modular plants that handle small volumes of MSW. Leading states with WTE plants are Florida, New York, Minnesota, and Massachusetts. WTE plants reduce waste volume by 90%, with the residual ash going to a landfill, according to Ecomaine, a municipally owned waste company in southern Maine. Mass burn plants operate at about 25% of efficiency, compared with the 35% operating efficiency rate of coal plants.
Statistics from the US Energy Information Administration (EIA), suggest that in 2013, coal contributed the highest percentage (39.1%) to total electricity generation in the US, followed by natural gas (27.4%) and nuclear power (19.4%); the share of renewable sources was nearly 12.9%. According to the EPA, out of 251 million tons of waste generated in the US in 2012 (latest available), 87 million tons (34.5%) of waste were recovered. Of the unrecovered waste, about 11.7% was sent to WTE facilities, while 53.8% was diverted to landfills.
With diversion of waste from landfills and reduction in emission of greenhouse gases gaining priority globally, advanced WTE technologies are again becoming popular. According to the Journal of Environmental Engineering, for every ton of MSW processed, WTE offsets around one ton of greenhouse gas emissions, thus avoiding methane emissions from landfills, greenhouse gases generated from transporting waste to landfills, and replacing fossil fuels used in generating electricity. Among the various WTE technologies, conversion technologies such as pyrolysis, gasification, and plasma arc are the most advanced in terms of efficiency and financial feasibility.
The National Energy Technology Laboratory, part of the Department of Energy (DOE), predicts that the US will lead the growth on a worldwide level, with a 63% increase in capacity by 2016, implying a considerable rise in demand and supply for gasification systems. In May 2011, a law was passed in Maryland, which made WTE a Tier 1 renewable energy resource. Thus, the state receives sustainable waste management options and cleaner electricity. The state aims at achieving 20% of its energy from Tier 1 renewable sources by 2022. It is planning to reduce its reliance on coal-fired generation of electricity, which accounts for 55% of the state’s electricity needs.
WTE as a technology has a big role to play in improving the recycling rates across the US. According to the Waste to Energy Power Report published by the Maine Governor’s Office of Energy Independence and Security in April 2011, a study of over 500 communities with WTE facilities conducted in 2010 has revealed that the aggregate recycling rate in these communities is at least 5% more than the national average.
According to an article published on September 17, 2014 by BioEnergy Consult, an energy and waste management consulting firm, about 130 million metric tons of MSW are combusted annually in some 600 WTE facilities globally, producing electricity and steam for district heating and recovered metals for recycling. Since 1995, the global WTE industry has risen by more than 16 million metric tons of MSW. Incineration, with energy recovery, is the most common WTE method employed worldwide. Over the last five years, waste incineration in Europe has generated 4%–8% of electricity and 10%–15% of heat.

INDUSTRY SURVEYS ENVIRONMENTAL & WASTE MANAGEMENT / OCTOBER 2014 19
Currently, the European nations are recognized as global leaders of WTE projects, followed by the Asia Pacific region and North America, respectively. The US processes 14% of its trash in WTE plants, while Denmark processes 54%, more than any other country.
Waste-to-vehicle fuel Another concept that is emerging is the conversion of MSW and C&D waste into renewable vehicle fuels. The trend is likely to pick up owing to concerns over the supply and cost of petroleum. The waste is converted into vehicle fuels (diesel) using the Fischer-Tropsch (F-T) synthesis process. The infrastructure for collection has helped in boosting the availability of MSW and C&D waste for the biomass fraction. Various companies operating in the petrochemical and energy sector across the world have been developing and researching such technologies, which are known as biomass-to-liquids (BTL) technology. The DOE estimates that the biomass fraction of MSW and C&D waste could supply around nine billion gallons of renewable fuels in the US each year.
Federal government tests of F-T diesel have shown that this variety of diesel has low emissions of sulfur, nitrogen oxides, and particulates, low aromatics, and good compatibility with petroleum diesel. However, the EPA has not recognized F-T diesel from biomass as an “alternative fuel.” In 2008, Green Power Inc. started a plant in Washington for producing 12,000 gallons of diesel fuel supplement from 150 tons of MSW. However, the plant was stopped due to concerns over air pollution violations in 2009. Operation of F-T diesel plants on a small scale currently faces constraints in terms of optimization of the F-T reactor and catalyst performance, which will help in offsetting high production costs. It could be many years before scaled-down plants (producing 25,000 gallons–250,000 gallons per day) could serve US municipalities.
RECYCLING: COMMODITY PRICES STABILIZING AT LOW LEVELS
Commodity recycling prices, in our view, will remain weak in 2014 before stabilizing at low levels in 2015, based on still challenging global economic conditions and less rapid growth in China. In late 2008, China drastically reduced the purchase of recycled commodities as global demand weakened, sending prices for raw materials such as scrap metal, paper, plastic, and glass down 75%–90% in some regions. According to the Institute of Scrap Recycling Industries (ISRI), of the $87.4 billion in scrap metal generated in the US in 2013, 27.1% was exported. China was the biggest consumer of US scrap metal, importing $8.8 billion worth; Canada was a distant second, with $2.0 billion in scrap imports.
With more manufacturers moving overseas, US scrap supplies have declined, while the remaining US producers are using more of their own scrap. Meanwhile, China’s purchases continue to push prices higher and tighten the supply, while freight costs for delivering the materials rise further. China buys close to 50%
of all plastics collected in the US, controlling pricing. Thus, most reclaimers purchase material from Mexico, Canada, and Central and South America to supplement their US supplies. More than 70% of PET reclaimers and 40% of HDPE reclaimers have sought new sources of supply, according to a study by Resource Recycling Inc.
Paper Recycling prices for paper had rebounded in 2011, from the low levels seen in 2009—prices for old corrugated containers (OCC) peaked at $197 per ton in the US in the third quarter of 2011, compared with $41 per ton in the first quarter of 2009. However, prices started falling from the fourth quarter onward. In 2012 and 2013, prices averaged about $117 and $120 per
Chart H17: PAPER & PAPERBOARD RECOVERY
0
10
20
30
40
50
60
70
1998 99 00 01 02 03 04 05 06 07 08 09 10 11 12 2013
Tons recovered (mil.) Recovery rate (%)
Source: Paper Industry Association Council.
PAPER & PAPERBOARD RECOVERY

20 ENVIRONMENTAL & WASTE MANAGEMENT / OCTOBER 2014 INDUSTRY SURVEYS
ton, respectively, according to RISI. In the September 2014 issue of Newsletter of the Maine Resource Recovery Association, the reported price for OCC was $90 per ton, compared with $100–$105 per ton in June 2014 and $115–$120 per ton in September 2013. Typically, OCC prices for US mills peak in the June through August period. However, export demand continued to weaken.
The market’s weakness can be attributed to a general dip in demand for recycled paper from a few primary international markets, including China, Mexico, and India. While we expect demand to be stable in 2014, as markets remain challenging, we believe the longer-term positive trend will remain in place.
There might be a rise in demand from China, which is likely to pull prices up. China started another series of mill construction projects in June 2011, which has continued into 2012 and boosted demand for OCC and office paper supplies. Consumption of paper used in magazines, newspapers, and book publishing in North America is expected to fall by around 21% by 2015 and by around 50% over the next 15 years, according to a study titled “The impact of media tablets on publication paper markets” published by RISI in August 2011. The recycling rate for paper has risen since 1993, when 35.5 million tons were recycled (of 91.5 million tons consumed), for a 38.7% recycling rate, according to the American Forest & Paper Association (AF&PA), a paper industry trade group. The rates improved through 2013, when the paper and paperboard recycling recovery rate reached a record 63.5%, down from 65.1% in 2012, but up significantly from 46% in 2000.
Plastic beverage containers According to the Association of Postconsumer Plastic Recyclers, a trade association, the PET recycling rate is expected to rise further due to Oregon’s expanded bottle bill, as well as bills in New York and Connecticut that added water bottles to mandatory deposit programs. The group estimates that demand could absorb an additional 1.0 billion to 1.5 billion pounds of PET and 500 million pounds of high-density polyethylene (HDPE) per year.
According to the 2012 United States National Post-Consumer Plastics Bottle Recycling Report, published by the Association of Postconsumer Plastic Recyclers (APR) and the American Chemistry Council (ACC), the plastic bottle recycling rate was 30.5% in 2012 (latest available), up 1.6 percentage points from 2011.
After reaching a high of 37.5% in 1994, US plastic recycling rates for soda bottles and other PET containers faltered for several years, falling to 19.6% in 2003. However, a rebound in recycling rates has occurred over the past decade, with the figure above 25% in 2009, versus 21.6% in 2004.
Chart H19: PAPER RECOVERY
Net Exports40%
Containerboard32%
Boxboard12%
Tissue9%
Other5%
Newsprint2%
Total: 50.1 million tons
PAPER RECOVERY
Source: paperrecycles.com.
WHERE RECOVERED PAPER GOES
10
20
30
40
50
60
1995 97 99 01 03 05 07 09 11 2013
Recovered Landfilled
RECOVERED & LANDFILLED PAPER(In millions of tons)

INDUSTRY SURVEYS ENVIRONMENTAL & WASTE MANAGEMENT / OCTOBER 2014 21
Aluminum and glass The recycling rate for aluminum beverage cans in the US stood at 66.7% in 2013, almost unchanged from 67% in 2012, according to a report by the Aluminum Association, the Can Manufacturers Institute, and the Institute of Scrap Recycling Industries. This was the third consecutive year that the rate has been above 65%. By 2015, the aluminum industry hopes to recycle 75% and 90% by 2030 of the used beverage containers it manufactures. In 2009, the aluminum can recycling rate exceeded 57%. However, more than 50 billion cans are thrown away each year in the US. Industry officials note that it needs to be more aggressive in recycling, as aluminum is valuable from both an economic and environmental standpoint. Aluminum produced from recycled cans uses 95% less energy than making it from bauxite ore. Recycling these cans could reduce emissions of heat-trapping carbon pollution by nearly six million tons—equal to the pollution from more than one million cars.
The Aluminum Association, a trade group for producers of primary aluminum, recyclers, and semi-fabricated aluminum products, plans to increase public awareness and possibly pursue deposit legislation for all beverage containers, as it reports that states with deposits have an average aluminum can recycling rate of 74%, versus 38% for non-deposit states. It notes that the aluminum can recycling rate peaked at almost 68% in 1992, but subsequently dropped (though it has held steady in recent years). The rate declined due to high recycling costs, a lack of marketing, and an easing of recycling.
From 2008 through 2013, glass manufacturers targeted the use of 50% recycled material in bottles and jars, according to the Glass Packaging Institute (GPI). The institute plans to support recycling at bars, restaurants, and hotels, in addition to residential curbside collection, noting that away-from-home venues account for more than 28% of beverages packaged in glass containers sold in the US. However, glass recycling remains relatively weak, as more glass is being used for non-recoverable applications, such as road filler and landfill cover. In its Clear Solutions report in September 2014, the GPI stated that, since the approval of the initiative to increase the recycled content of glass containers, the industry has seen an increase in the use of recycled content for the manufacture of glass bottles and jars (from 25% to approximately 33%).
Beverage container deposit laws Ten states (California, Connecticut, Hawaii, Iowa, Maine, Massachusetts, Michigan, New York, Oregon, and Vermont) have bottle laws that require refundable deposits on beverage containers. According to the Container Recycling Institute (CRI), these states have beverage recycling rates ranging from 66.8% to 95.9%. Ten other states have bottle bill legislation.
In late May 2013, the Massachusetts Senate voted for an amendment to the state’s budget to update the state’s Bottle Bill law to include water, sports drinks, and flavored teas. However, the bill was dropped during conference committee talks, when lawmakers privately work out differences between House and Senate bills. If passed by the House and signed into law, the state would follow Maine, Connecticut, and New York, all of which have added more containers to their deposit laws over the past several years.
During 2009, New York and Connecticut expanded their bottle deposit laws to include bottled water. The bill in New York allows the state to retain 80% of the unclaimed bottle deposits, which officials estimate will translate into an additional $115 million for the state’s budget. In June 2011, Oregon expanded its 40-year-old bottle bill, which is expected to take effect by 2018 or when redemption centers collect 60% of the items covered under the bill, whichever takes place earlier. Further, as per the expansion, the five-cent deposit has been raised by another five cents, which will be payable if redemption rates fall below 80% for two consecutive years. The law has also proposed a pilot system for stand-alone redemption centers for the state.
Recycling C&D waste Construction and demolition (C&D) waste comprises 25% to 45% of the waste stream in North America, depending on the region. According to estimates by the Construction Materials Recycling Association, no more than 25% of the C&D waste stream is recycled.
In 2009, Waste Management in conjunction with McGraw-Hill Construction conducted a survey in which 200 building contractors were interviewed in order to understand the current state of the C&D recycling industry and to project its growth through 2014. The survey suggested that client demand and federal

22 ENVIRONMENTAL & WASTE MANAGEMENT / OCTOBER 2014 INDUSTRY SURVEYS
regulations were the drivers of growth in this business. In 2009, 52% of the contractors surveyed had no goals to divert their construction waste. However, 80% of them believed that C&D recycling would gain tremendous importance by 2014. According to the study, contractors generate 143 million tons of C&D waste each year, out of which 35 million tons is recycled.
More companies are entering the C&D recycling business, which means that supply will increase. This will cause prices to decline and will result in companies moving out of this business. The situation can be resolved by introducing new processing standards for recyclers and new products for manufacturers, who use processed recyclable materials. There are, however, concerns over acceptability of recycled products among manufacturers. For instance, the market for processed cement is not very large because the Department of Transportation in many states does not approve the use of this cement as a road-base building material. Similarly, there are concerns that if plants operate at full capacity, the supply of processed wood would exceed demand. Recycled asphalt shingles have also only started to gain popularity.
The National Association of Demolition Contractors, an industry group, estimates that demolition projects account for 70% of the C&D debris produced annually; 40% of this is recycled. The remaining 30% of C&D waste is estimated to come from new residential and commercial construction. The National Association of Home Builders estimates that constructing the average 2,000-square-foot home yields a ton of drywall waste alone.
With state and local governments requiring more waste to be recycled, solid waste companies are looking toward processing C&D waste in an effort to help meet their goals. WBJ expects this trend to continue, and is forecasting at least 10% average annual growth over the next decade.
Hazardous waste recycling The EPA is seeking to increase the amount of secondary hazardous waste that is recycled, which could save businesses $95 million annually. The EPA believes that 5,600 facilities in 280 industries (in particular, specialty chemicals) generate or recycle hazardous secondary materials that are classified as solid waste currently. In order for the materials to qualify for exemption from hazardous waste rules, numerous conditions must be met. One condition is that the materials need to be generated and reclaimed under the control of the generator, or generated and transferred to another company for reclamation under specific conditions.
ELECTRONICS RECYCLING GAINING MOMENTUM
E-waste laws are being enacted to deal with e-waste recycling from a more responsible perspective. Under a bill proposed in Congress in June 2011, the export of hazardous electronic waste will be prohibited, since such waste is usually recycled in a manner that causes harm to both the environment and human health. The categories of e-waste that cannot be exported were identified. The bill also asks for recycling research to come up with ways to recycle such waste in a more effective way.
The total volume and weight of e-waste will more than double by 2025, according to a December 2011 report by Pike Research (acquired by Navigant Research), a market research and consulting firm focusing on global clean technology markets. The report estimates that the amount of e-waste will rise from six million tons in 2010 to around 14.9 million tons by 2025. Further, the report states that the end-of-life (EOL) electronics recycling and reuse will grow from 1.1 million tons in 2010 to as much as 7.9 million tons by 2025. Pike also published a study in November 2009 revealing that 76% of Americans prefer to have their obsolete electronic equipment recycled rather than disposed of in landfills. Pike estimated that it costs $20 per item to recycle and dispose of electronic waste, and noted that the average consumer has 2.8 pieces of unused, broken or obsolete electronic products in his or her home.
According to Waste360 (formerly Waste Age), there are two different e-waste models. One is the Extended Producer Responsibility (EPR) model. Some states (e.g., Maine, Maryland, Minnesota, and Washington) require manufacturers to implement their own take-back programs, while others require manufacturers to pay for recycling based on the amount returned for recycling or on how much they sell. The other, the Advanced Recovery Fee (ARF) model, is used only in California, which funds its program with a recycling fee paid in advance by the consumer at the time of sale.

INDUSTRY SURVEYS ENVIRONMENTAL & WASTE MANAGEMENT / OCTOBER 2014 23
WATER SUPPLY AND TREATMENT: HUGE INVESTMENT NEEDED
According to S&P Capital IQ (S&P), a flood of consolidation continues in the water industry, with popular PPPs having potential investment implications for publicly traded water-related securities. Typically, the public sector provides funding for water infrastructure in the US. However, the prolonged economic malaise is making it difficult for municipalities to find sources of water infrastructure funding, thus the growing interest in partnerships with private companies.
More than 2,000 community water and wastewater facilities in the US operate as PPPs. Some communities held off on infrastructure projects with the hope that additional federal stimulus funding would supplement the cost of their water system upgrades. When this did not happen, many decided to seek help from the private sector in order to improve their decaying systems. We expect more such partnerships in the future, since actual spending on upgrades of US water infrastructure has not kept pace with the need. According to the final Failure to Act report from the American Society of Civil Engineers (ASCE) in January 2013, the required spending on water infrastructure in 2012 was around $126 billion, while the actual spending was around $42 billion, resulting in a gap of
$84 billion by 2020 and as much as $144 billion by 2040. Moreover, according to a report from the American Water Works Association (AWWA) in February 2012, investments of more than $1 trillion will be needed for drinking water infrastructure over the next 25 years, with the need more than doubling from $13 billion a year to about $30 billion annually in the 2040s.
The US water industry generated revenues of about $151 billion in 2013, up 3.9% from the previous year, and we expect even stronger growth rates in the near future. We estimate 2%–3% organic revenue growth for the industry over the next year, improving modestly to at least 3% over the next two to three years. Meanwhile, demand for water is only growing. In addition to the ever-increasing population in the US (that requires water for everyday uses like drinking and bathing) and existing industrial uses, energy companies have begun to use great quantities of water for fracking, a way of extracting oil or gas from below-ground reserves.
For example, in late 2011, Aqua America and Penn Virginia formed Aqua-PVR Services LLC to build and operate a pipeline system that would provide fresh water to natural gas producers drilling in the Marcellus Shale in Pennsylvania. Aqua America has estimated that the new venture will add $0.01 to per-share profits in 2012, and possibly $0.10 in five years. During the five-year period through 2013, Aqua completed 84 acquisitions or growth ventures. We think the company could expand further in terms of delivering water to energy companies. Fracking could be another source of revenues for water companies. However, there has been a lot of resistance, and some people are calling for a more thorough evaluation of the potential health risks on local communities. Fracking sends chemical-laced water into the ground, and some environmental groups fear this water could contaminate the groundwater from which drinking water is drawn.
We expect PPPs to increase outside the US as well. The World Bank is set to spend billions on privatization efforts despite failures in the water and sewerage sector, which had a 34% failure rate in the last decade. From 2013 onwards, the Bank’s private-sector arm aims to increase investments to $1 billion each year.
Chart H18: WATER SUPPLY, SEWAGE, AND WASTE DISPOSAL CAPITAL CONSTRUCTION SPENDING
(10)
(5)
0
5
10
15
20
25
30
35
40
0
5
10
15
20
25
30
35
40
45
50
2002 04 06 08 10 12 2014*
Spending (Bil. $, left scale)
Year-to-year % change (right scale)
*Annualized estimate based on data through July.Source: Census Bureau.
WATER SUPPLY, SEWAGE, AND WASTE DISPOSAL CAPITAL CONSTRUCTION SPENDING

24 ENVIRONMENTAL & WASTE MANAGEMENT / OCTOBER 2014 INDUSTRY SURVEYS
More public-private partnerships S&P thinks that the demand drivers for the water supply and treatment segment (population growth, industrial growth, deteriorating systems, and new environmental regulations) will experience more rapid growth over the next 10 years. Meanwhile, the forces behind private involvement—the need for new infrastructure and the unpopularity of tax increases—remain intact.
Although some municipalities prefer operating their water systems themselves, budget constraints continue to force local governments to turn over control to private water utilities. Considerable funding is required to upgrade the water infrastructure. According to the latest Drinking Water Infrastructure Needs Survey and Assessment published by the EPA in April 2013, the US needs $384.2 billion through 2013 for its drinking water infrastructure investments, which include thousands of miles of pipe, as well as thousands of treatment plants, storage tanks, and other key assets. According to the ASCE, drinking water infrastructure investments will reach nearly $50 million by 2020 and $75 million by 2040, with about half funded in 2020 and 35% funded in 2040.
S&P does not expect the water industry to deregulate in the manner of the electric utilities sector. Given the difficulty and expense of transporting water long distances, it is more cost-effective to develop water supplies locally. Although tight credit markets have stemmed the tide of private equity investments in recent years, private money seems to be on the rebound as global markets recover. In our view, if this trend continues, publicly traded water utilities will likely have to pay more for acquisitions as private equity firms offer a premium price for water assets.
In some cases, the preference for an outright sale of water facilities to private interests may give way to PPPs. These ventures are being formed to handle such projects as drinking water treatment plants, wastewater treatment, and groundwater remediation plants. According to National Association of Water Companies, more than 2,000 community water and wastewater facilities are currently running as PPPs. Municipalities gain from the PPP model in terms of access to trained professionals, access to requisite funding for system improvements, and access to cost-optimization mechanisms.
In order to fight budget shortfalls, municipal systems are increasingly selling their assets to private companies. In December 2011, the city of Los Angeles awarded an $88.6 million contract to Honeywell Process Solutions to revamp the control systems used to manage the city’s wastewater treatment system. The project, which began in 2012, will last for seven years, after which Honeywell will offer support services for another eight years. However, in 2013, Aqua America sold all of its water and wastewater assets in Florida to the Florida Governmental Utility Authority (FGUA). According to GWI, the water industry will grow by 20% in the next five years, and it is this expected growth, along with increasing water scarcity, that makes privatization attractive to buyers.
Mixed reviews for desalination projects Due to increasing water shortages in many US cities, particularly in the West and Southwest, more desalination projects are being explored. However, not everyone is in favor of these projects. A May 2013 report by the Pacific Institute—an Oakland-based nonprofit organization that conducts research and analysis with a focus on global and regional freshwater issues—outlined the high energy costs and impact of operating a desalination plant, which underscores local efforts to control the potential costs of California American Water’s (unit of American Water) proposed facility. The report concludes that desalination is so energy intensive—consuming more energy per gallon than most other water supply and treatment options—that it replaces water reliability risks with energy price risk. The report added that desalination plants require additional energy not only to produce water, but also to deliver the water and dispose of the brine and other waste. It was also noted in the report that desalination plants can cause an increase in greenhouse gas emissions, thus “running counter to the state’s greenhouse gas reduction goals” as expressed in legislation which requires the state to reduce emissions to 1990 levels by the end of this decade. A few ways to reduce emissions were suggested in the report, including cutting a desalination plant’s total energy requirements, powering a plant with renewable energy, and purchasing carbon credits.

INDUSTRY SURVEYS ENVIRONMENTAL & WASTE MANAGEMENT / OCTOBER 2014 25
Meanwhile, a desalination project running in the City of Long Beach (California) has received approval for an extension until May 2017. It is an Under Ocean Floor Seawater Desalination Intake Project, which treats nine million gallons of water per day.
Hydraulic fracking: potentially harmful for drinking water Natural gas, an alternative source of energy, is increasingly gaining importance globally. According to the EIA’s Annual Energy Outlook 2014, natural gas accounted for 27% of US energy consumption in 2012, and the share will increase to 35% by 2040. Hydraulic fracturing (or fracking) is used to extract natural gas from deep-water sources. The technology involves blowing millions of gallons of water mixed with a certain quantity of chemicals in order to create fissures in the rock to release natural gas. The Marcellus Shale formation, covering areas from West Virginia and Ohio to the Northeast through Pennsylvania and New York, is gaining a lot of attention as an unconventional source of natural gas. In August 2011, Noble Energy, a major drilling concern, invested $3.4 billion to develop 663,350 acres in the shale formation.
However, the expansive use of hydraulic fracturing has not come without a chorus of detractors. Environmentalists note several potential concerns. For example, the extent to which wastewater created by fracking is properly disposed of so that it does not enter natural aquifers used for drinking water, is a major concern. Fracking fluids are currently exempt from the Clean Water Act and as such, in many cases, frack providers do not disclose the ingredients or the concentration of their fracking fluids. Advocates at the Environmental Defense Fund have also noted that any perceived benefit to greenhouse gas emissions from fracking (e.g., by enabling the switch from coal-fired electric power generation to natural gas-fired generation) depend on stringent gas leakage controls, since even a small amount of gas leakage (6%–7%) can obviate the claimed benefits. In addition, with fracking often requiring one million gallons of water per fracking stage, and wells now routinely using multiple stages (10- or 15-stage frack jobs are not uncommon), that is a lot of water that could be used for other purposes, such as irrigation for farmers, or simply conserving it better.
Other initial criticisms of fracking included its brute-force nature: several fracking stages are employed when one or more does not keep the cracks open. Resentment against fracking in some communities, such as in the Marcellus Shale, has put oilfield services companies somewhat on the defensive. There has been further public resentment caused by denial of sanctions to pursue research efforts in the direction. In June 2012, a House committee rejected a request by the Obama Administration to carry out research costing $4.25 million to study the effects of drilling on water quality. Similarly, in early 2012, Pennsylvania withdrew $2 million of funds that were intended for a statewide health registry to track respiratory problems, skin conditions, and other possible illnesses allegedly caused by fracking.
The Obama Administration is looking to strike a balance between aiming at increased natural gas production, which would be good for the economy, and showing concern for the potential deterioration in the environment caused by hydraulic fracking. The Securities and Exchange Commission (SEC) has also shown interest in the matter, in what has been described as an effort to provide investors with information about the operational risks a company may face. The SEC is requiring exploration and production (E&P) companies involved in natural gas drilling to disclose what chemicals they are injecting, and what steps they are taking to minimize water usage and mitigate any harmful impact on the environment.
The EPA was working on a study to find out whether fracking has any ill effects on drinking water. For this study, nine companies provided information about the chemicals they inject in the water. The industry is coming out with ways to make fracking environmentally friendly. Processes are being devised to recycle greater amounts of water generated during fracking. On December 8, 2011, the EPA released a report detailing the results of the three-year study. For the first time, a study showed that fracking for natural gas can lead to contamination of groundwater. The study found traces of chemicals used for drilling in the samples of groundwater from west-central Wyoming. The findings have put the agency under pressure to expedite its rule-making process concerning drilling activities.
In April 2012, the EPA released the first-ever regulations for fracking. The rules require that companies disclose the chemicals they use in the fracking process. Further, drillers will be required to test physical robustness of the wells to avoid any potentially dangerous leakages that can pollute the water. Also, the

26 ENVIRONMENTAL & WASTE MANAGEMENT / OCTOBER 2014 INDUSTRY SURVEYS
rules have broadened the definition of water to include all kinds of usable water, such as fresh water (as previously included in the definition), along with water treated for drinking purposes, and water used for agricultural and construction purposes. However, the rules will only apply to drilling being conducted by the Bureau of Land Management (BLM) and on tribal land (which account for only a small part of the drilling activity), but barely any US Forest Service, state-owned or private lands, where the majority of the drilling takes place.
Key drivers, trends, and developments In the 2014 Water Market Review, TechKNOWLEDGEy Strategic Group listed the key drivers, trends, and developments in the global water market. There are four key drivers identified in the report:
Water quality and water scarcity, which are reaching crisis proportions globally Increased public awareness and concern about these water problems, enhancing education on the
topic Continued increase in the regulation of water management and enforcement, while new policies and
approaches emerge The need to focus on the huge capital and human investments required in this industry
The report notes that these four fundamental drivers give rise to a broad spectrum of 19 key trends and critical developments in the water business with respect to supply, demand, markets, and competitive conditions. These trends include: increasing regulation, failed infrastructure; greater conservation and efficiency; recycling and reuse; desalination; interdependence between energy and water; water and food nexus; enhanced monitoring and measurement; smart water; green infrastructure; technological advances; residential consumption concerns; controversy regarding privatization; water security; consistently growing commercial markets; industry investments; ownership changes and consolidation; public sector consolidation; and concerns about global climate change.
AIR POLLUTION CONTROL
Vehicle emissions control and industrial emissions control are the two largest sub-segments of the air pollution control business. Both sub-segments should benefit somewhat from regulations passed by the EPA in recent years.
Vehicle emissions control The EPA and the National Highway Traffic Safety Administration (NHTSA) have announced a first-ever program aimed at reducing greenhouse gas (GHG) emissions and improving the fuel efficiency of heavy-duty trucks and buses. The new rules require improvements in fuel efficiency of a huge 23% by 2018. Along with standards on carbon dioxide (CO2) emissions, the EPA released standards on nitrous oxide (N2O) and methane (CH4) emissions in July 2011 under the Cross-State Air Pollution Rule. The rules require utilities in 27 states to cut emissions or buy allowances starting from 2012. In 2014 and onwards, the utilities will have to reduce their sulfur dioxide (SO2) emissions by 73% and NO2 emissions by 54% from their 2005 levels.
The federal government continues to focus on stricter regulations, raising fuel efficiency standards for cars and light trucks. In June 2011, a Presidential Memorandum was issued, under which all federal agencies and departments are required to use only alternative fuels for their vehicle fleets by the end of 2015. In May 2010, President Obama directed the EPA and the US Department of Transportation (DOT) to create a new national policy to reduce pollution from medium- and heavy-duty trucks, while further reducing exhaust from cars and light-duty trucks beyond the current requirements. New cars will be required to average 35.5 miles per gallon (mpg) by 2016, which the administration believes would reduce emissions of CO2 and other gases by about 30% from 2012 to 2016. The plan also intends to improve fuel efficiency for cars and light trucks manufactured in 2017 and beyond, and medium and heavy trucks in 2014 through 2018. Trucks use more than two million barrels of oil daily and average six mpg, emitting 20% of transportation-related GHG emissions despite accounting for only 4% of the vehicles on US highways. Automakers will be eligible for credits for exceeding Corporate Average Fuel Economy (CAFE) standards.

INDUSTRY SURVEYS ENVIRONMENTAL & WASTE MANAGEMENT / OCTOBER 2014 27
The EPA projected that the diesel rules would add $1,200 to $1,900 to the cost of a new truck or bus, and four to five cents per gallon to the cost of diesel fuel. The agency expects these rules to prevent annual emissions of 2.6 million tons of nitrogen oxide and 110,000 tons of particulates. Trash hauler Waste Management has stated that it has set a goal to decrease fleet emissions by 15% and increase fuel efficiency by 2020. Automakers are also developing cleaner diesel engines for possible sale in the US, as well as dual electric/gas cars that can achieve in excess of 200 mpg.
Industrial emissions control In December 2012, the EPA finalized its changes to incorporate the Clean Air Act standards for boilers and certain incinerators. The rules call for a dramatic decrease in toxic air pollution, including mercury and particle pollution. As a result, 99% of the nearly 1.5 million boilers in the US will not be in compliance or must meet the new standards by conducting periodic maintenance or regular tune-ups.
An emerging trend is to recover waste heat from the smoke emitted by smokestacks. Companies, such as Recycled Energy Development (RED), Cain Industries, and GTS Energy, retrofit the smokestacks with waste-heat recovery boilers. According to RED, of the 500,000 smokestacks in the US, the 475,000 that produce heat over 260 degrees Celsius could produce 50,000 megawatts of power. Although vehicles are commonly assumed to be the biggest contributor to air emissions in the US, it is the heat and power sector that actually generates the majority. The sector generates a lot of waste (i.e., heat), which, if recycled, could greatly increase efficiency. However, the concept of retrofitting is still not popular among businesses.
HAZARDOUS WASTE BUSINESS REMAINS WEAK
In our view, the competitive and capital-intensive $10 billion-plus hazardous waste management business will remain fairly weak over the next few years. As part of an ongoing transformation, many industry participants are rationalizing their traditional hazardous waste operations by divesting assets or changing the makeup of their sites. Some firms have diversified into the on-site industrial operation and maintenance services market, a highly fragmented and low-margin market valued at more than $30 billion.
With the hazardous waste industry evolving into more of a general industrial services market, the outsourcing of noncore activities and a reduction in the number of vendors used may be the main drivers toward a return to growth. Supply and demand may come into balance within the next few years, as some companies exit the hazardous waste industry and others consolidate.
However, with the use of fracking technology picking up among drillers, hazardous waste firms see a ray of hope. According to the CEO of Clean Harbors, the company is boosting its role in the fracking business. Most of the drillers require as much as four to six million gallons of water to release shale gas from a well, and that is where these companies would step in to treat this water.
Superfund impacted by funding issues Federal funding for hazardous waste cleanup projects has been shrinking, which has slowed the pace of completing these projects over the past ten years. According to the Government Accountability Office (GAO), the program lacks the resources necessary to complete construction at the existing and future sites on the priority list. The GAO projected that EPA’s remediation costs would range from $335 million to $681 million annually from fiscal 2010 through fiscal 2014 (September), versus $220 million to $260 million allocated annually from fiscal 2000 through fiscal 2009.
The proposed total Superfund budget for fiscal 2014 (ended September 30, 2014) was nearly $1.2 billion. The budget again included a proposal to reinstate the Superfund tax (expired in 1995) for tax years 2013 through 2021. Reinstating the tax could generate $1 billion a year in taxes for the program, rising to $2 billion a year by 2019, all of which would be used to fund necessary cleanups across the US.
Since the fund ran out of money in 2000, sites have been financed mainly from the general fund, with outlays ranging from $1.2 billion to $1.3 billion a year. These efforts focus on ensuring that contaminated sites are ready to be returned to beneficial use in their communities. As of September 23, 2014, the EPA had 1,323 sites on the Superfund National Priority List (NPL), plus 49 proposed sites and 383 deleted. In addition,

28 ENVIRONMENTAL & WASTE MANAGEMENT / OCTOBER 2014 INDUSTRY SURVEYS
there were 1,163 construction completions (73 federal) and 61 partially deleted sites (19 federal). The EPA’s program addresses public health and environmental threats from uncontrolled releases of hazardous substances. The EPA notes that those responsible for the pollution clean up 70% of all Superfund sites.
Since 1995, when Congress abolished the industry taxes that financed the Superfund (a program to fund EPA cleanups of high-priority toxic industrial sites), funding has been based almost completely on general tax revenue. The US Public Interest Research Group, an advocacy group, noted that taxpayers paid for 18% of the Superfund’s budget in 1995, with a trust fund providing the balance. In recent years, taxpayers financed about 80% of the program. Some environmental groups believe that a corporate tax would prevent the public from having to pay (via the Superfund) for polluters’ cleanup projects.
Brownfield projects receive some funding Despite funding issues concerning the Superfund program, President Obama’s economic stimulus plan does allocate funding for environmental cleanup projects, which could boost the cleanup and development of brownfield sites by private owners and developers. (Brownfields are contaminated sites that do not pose serious health or environmental threats, according to the EPA, but are being cleaned for industrial and commercial redevelopment.) The proposed budget for fiscal 2014 provided nearly $159 million in the form of brownfield grants, down from $167 million in fiscal 2013. The brownfield program is designed to help states, tribes, local communities, and other stakeholders work together to assess, safely clean up, and reuse brownfields. Revitalizing these properties helps communities by removing blight, satisfying the growing demand for land, enabling economic development, and improving quality of life.
In fiscal 2014, it was projected that brownfield program grantees would assess more than 1,200 properties, clean up more than 120 properties, help to create at least 5,000 cleanup and redevelopment jobs, and leverage more than $1.2 billion in cleanup and redevelopment funding.
HOW THE INDUSTRY OPERATES
The US environmental industry encompasses numerous sub-industries. This Survey focuses on four main segments: solid waste management, water supply and treatment, air pollution control, and environmental remediation and consulting. Each of the main segments can be divided into numerous lines of business. The industry includes large investor-owned companies and government-controlled utilities, as well as small consulting and equipment manufacturing firms.
The market for skilled labor in the waste management business is tight, and unions represent many workplaces. Waste Management, for instance, employed 42,700 full-time workers at December 31, 2013 (down from 43,500 in 2012), of whom about 7,400 worked in sales and administration (down from 7,500 in 2012), and the balance in operations. The number of employees covered by collective bargaining agreements has increased to 9,200 in 2013, from 8,900 in 2012. Republic Services had 31,000 full-time employees as of year-end 2013, with 26% covered by collective bargaining agreements.
Regulations, including pricing rules, vary by segment. Companies within the industry are generally vertically integrated, focusing on acquisitions within their core businesses and areas of specialization. Customers include large municipalities and major US corporations, as well as individual clients.
The industry is generally resistant to recession. Historically, it has grown in line with gross domestic product (GDP), about 3%–4% annually, on average.
SOLID WASTE MANAGEMENT
S&P Capital IQ (S&P) divides the solid waste collection and disposal segment into five lines of business, the largest of which is waste collection (the gathering and disposal through landfills and incineration of nonhazardous solid waste), followed by landfill operation, transfer stations, recycling, and waste-to-energy (WTE) incineration. Hazardous waste is a sub-segment of the solid waste industry.

INDUSTRY SURVEYS ENVIRONMENTAL & WASTE MANAGEMENT / OCTOBER 2014 29
The municipal solid waste operating cycle Commercial municipal solid waste (MSW) collection services are generally performed under one- to three-year contracts. With residential services, contracts are typically one to five years in length, and usually are granted by municipalities or regional authorities. Municipal contracts are usually awarded to the lowest bidder.
Commercial accounts offer high profit margins because they involve larger volumes than residential accounts do. For this reason, waste haulers seek them, according to Waste360 (formerly Waste Age), an industry magazine on waste management. Between 35% and 45% of MSW comes from commercial establishments such as retail stores and restaurants, according to the US Environmental Protection Agency (EPA).
Residential contracts grant the waste hauler the exclusive right to service all or part of the municipality’s jurisdictions. Waste collection fees are usually determined by several factors: collection frequency; type of collection equipment used; type, volume, or weight of the waste collected; and the distance from the collection sites to the disposal facility.
Once waste has been collected, it may be hauled directly to landfills or incinerators for disposal, or it may be transported to transfer stations. After leaving the transfer station, it may be deposited in a landfill, recycled, or incinerated.
Landfills. Landfills are either owned by full-service waste collection firms or operated as stand-alone companies. Landfill operations generate revenues from disposal charges (or “tipping fees”) that are charged to waste haulers or transfer stations. Charges are based on several factors: industry supply and demand; type, volume, or weight of the MSW; and the type and size of waste trucks. Given the time required to get a new landfill permit (more than five years in some cases) and the monitoring by the EPA and local municipalities, along with the excess capacity in the industry, S&P sees little incentive for waste companies to develop new landfills.
Transfer stations. Transfer stations collect waste from the smaller garbage trucks, separate recyclable material, and compact non-recyclable waste, which is placed in trailers or on barges for transport to disposal facilities. The stations are located near residential and commercial collection routes; waste haulers generally use them when the main disposal facilities are located too far from original MSW collection sites.
Transfer stations are either owned by full-service waste haulers or operated as stand-alone companies. Stand-alone transfer stations generate revenues through tipping fees, which they charge waste haulers based on the type and volume of waste compacted, the distance to disposal sites, and disposal costs. (Full-service waste haulers also charge tipping fees to other companies that use their transfer stations.)
Transfer stations will likely become the preferred method for handling MSW on a local basis. As these facilities take on waste diversion functions (including materials segregation, recovery, and composting), they extend landfill life and enable communities to control waste disposal without incurring a large financial risk.
Recycling. Recycling involves the collection, separation, and recovery of reusable MSW. Recyclables are collected for the most part through curbside recycling programs sponsored by municipalities, and, to a lesser extent, at drop-off sites, transfer stations, and landfill sites. Ultimately, recyclables find their way to recovery centers, which sort, bale, and market recyclables. The largest single category of recyclables is paper of various types, followed by scrap metal and yard trimmings.
Recycling programs tend to be more numerous in crowded regions where disposal costs are higher and incentives to recycle are greater. Single-stream recycling systems, in which material is sorted by the recovery facility rather than the resident, are growing in popularity. Although these programs are labor-intensive, requiring high initial costs for salaries and benefits, they reduce operating costs, as fewer trucks and drivers are needed to run recycling collection routes.
The American Forest & Paper Association, a paper industry trade group, estimates that every ton of paper that is recycled saves 3.3 cubic yards of landfill space. The industry has undertaken efforts to raise the paper

30 ENVIRONMENTAL & WASTE MANAGEMENT / OCTOBER 2014 INDUSTRY SURVEYS
and paperboard recovery rate, which reached 51.2% (44.5 million tons) in 2013 (down from a record high of 66.8% in 2011) versus 38.7% (35.5 million tons) in 1993.
Incineration. Waste is incinerated primarily at WTE plants, which generate and sell the energy produced. According to the Solid Waste Association of North America (SWANA), there are about 89 WTE plants currently operating in the US, processing over 29 million tons of trash to generate the equivalent of 2,500 MW hours of electricity.
MSW versus hazardous waste The services of both the MSW and hazardous waste businesses are capital intensive and heavily regulated. With MSW, large amounts of capital are needed to develop new landfills and/or incineration plants, maintain existing facilities, build and operate transfer stations, purchase and maintain collection trucks and related equipment, and comply with government regulations. Capital requirements are especially intensive for companies that operate hazardous waste incinerators. MSW companies tend to grow through acquisitions, whereas hazardous waste firms expand through diversification or the pursuit of niche markets.
Regulation In the US, the MSW industry is regulated primarily by the Solid Waste Disposal Act (SWDA). As amended by the Resource Conservation and Recovery Act of 1976 (RCRA), the SWDA regulates the handling, transportation, treatment, and disposal of municipal and hazardous wastes. The hazardous waste industry is primarily regulated under Subtitle C of the RCRA.
Subtitle D of the RCRA, adopted in 1991, established a framework for federal, state, and local government cooperation in controlling MSW management. Although the EPA provides overall regulatory direction, state and local governments are responsible for planning and implementation of Subtitle D programs. One effect of Subtitle D provisions during the 1990s was to drastically reduce the number of landfills in the country, while average capacity more than tripled. Small landfill owners, who could not afford the equipment to control leachate and gas emissions and bring their landfills into compliance with the law, were forced out of business, while large, financially sound companies built big new landfills that met the regulations.
What drives the market? Demand for MSW services is driven mainly by gross US economic output and population growth. Historically, nearly one percentage point of the industry’s internal growth (revenue growth not driven by acquisitions, recycling commodity prices, or fuel surcharges) has come from population increases; rising prices account for the rest. For hazardous waste services, government regulation is the market’s main driver.
In the waste management business, pricing initiatives have historically been related to inflation. However, in recent years, major solid waste companies have been willing to sacrifice market share in favor of maintaining a pricing strategy, while offering quality service as an incentive to retain their largest and most loyal customers. Waste Management noted that a 1% price hike could translate into a 3% to 5% drop in volume, while it believes a 1% reduction in its “churn” rate (customer turnover, reflecting price spread between new work and business lost) adds $25 million to earnings before interest and taxes (EBIT). Generally, rising costs encourage firms to try to push through higher prices to customers, who are more likely to accept them at such times than when prices are stable. Significantly higher fuel costs have led to fuel surcharges, hedging programs, and higher contractual pricing.
Waste generation has expanded slightly less rapidly than the economy as a whole, suggesting that the US is generating less trash per unit of total economic output, due to an economy based more on services than manufacturing, as well as to pollution and waste minimization efforts.
Meanwhile, US production of industrial waste byproducts, which make up the bulk of hazardous waste, is falling due to changes in manufacturing technology and the decline of manufacturing. In addition, in 1980, the EPA began a program in which people or facilities that generate hazardous wastes could petition to have the substances removed from Subtitle C, or “delisted.”

INDUSTRY SURVEYS ENVIRONMENTAL & WASTE MANAGEMENT / OCTOBER 2014 31
Accordingly, the number of contracts for treating such waste is falling as well. Capacity is more in line with demand than it was between 1995 and 1997, years that were characterized by pricing pressures. However, the industry still suffers from landfill overcapacity, particularly in solvent recovery and fuel blending. These factors have affected the hazardous waste industry’s profit margins, which have narrowed substantially.
WATER SUPPLY AND TREATMENT
The US water supply and treatment market comprises numerous segments, with wastewater treatment, water supply systems, and water infrastructure construction accounting for the majority of the market. Because water is the only utility that is ingested, it requires public health oversight. Municipal and investor-owned water utilities are regulated by various entities. This monopoly industry has high barriers to entry due to large capital requirements and regulatory obligations. Non-regulated companies in various water-related segments include infrastructure construction, consulting, chemicals, equipment, bottled water, water treatment, and operations and maintenance.
The EPA still considers water the lowest cost utility and believes that a cost equal to 2% of household income is affordable. The current cost is less than 0.5% of average household income.
Market segments Following are descriptions of the segments that comprise the water supply and treatment market.
Municipally owned and operated public wastewater treatment. Municipalities own and operate about 98% of wastewater systems, consisting of 21,000 wastewater collection (pipe) systems and 16,000 public wastewater treatment plants in the US. Discharge of the treated sewage-to-surface water is regulated by a national pollution discharge elimination system (NPDES) permit, which may be issued by the EPA or by a state agency. Each system is the exclusive provider for a designated local area.
Water supply systems. Water supply (or public drinking water) systems involve extraction from surface water or groundwater sources, transport to a water treatment plant, and distribution of water via pipelines to end users (municipalities and private industry). Municipalities are responsible for about 85% of water-segment revenues, while investor-owned utilities account for the balance. State public utility commissions regulate water quality and the rates that private investor-owned water utilities may charge.
According to the EPA, the US has approximately 52,000 community water systems (CWS). These systems are defined as public systems that supply water to the same population year round. Although 78% of these systems have groundwater as a source, 70% of the population drinks from a surface water system.
In terms of population served, 404 US community water supply utilities are considered “very large” (serving more than 100,000 people); 3,728 are “large” (10,001 to 100,000); 4,838 are “medium” (3,301 to 10,000); 13,858 are “small” (501 to 3,300); and 29,160 are “very small” (up to 500 people). Approximately 83% of US water systems serve fewer than 3,300 people. Smaller water systems have consolidated operations to better manage rising costs.
Although large and very large water supply utilities constitute about 8% of all such utilities in the US, they serve about 82% (by volume) of the population. Medium firms comprise almost 9% of water supply utilities and serve 10% of the market; small firms contain 27% of such utilities and serve 7% of the market; and very small firms account for 56% of water supply utilities and serve less than 2% of the market.
Water supply utilities operate as regulated local monopolies. About 40% of the municipally owned and operated systems serve 85% of the population. The non-municipal water supply sector consisted of 10 publicly traded, investor-owned water utilities as of 2012; this total is down from 23 companies in the 1990s. More than 26,000 drinking water facilities provide 51% of US drinking water, and are privately owned, according to the EPA. More than 1,300 government entities contract with private firms to provide water and wastewater facilities.

32 ENVIRONMENTAL & WASTE MANAGEMENT / OCTOBER 2014 INDUSTRY SURVEYS
Water infrastructure construction. This segment consists of companies that provide consulting services for water pollution cleanup projects. Water infrastructure construction primarily involves the installation of sewer pipes and the building of water facilities. Some 3,000 consulting and design-engineering firms cater to the water supply and treatment market. These firms tend to be small, and the market is fragmented.
Water treatment equipment. Companies in this sector design, manufacture, and sell equipment—including purification and filtration devices, desalination systems, pumps, and filters—to the water supply and municipal wastewater treatment segments. The sector is highly fragmented, consisting of 10,000 small water equipment makers. Following the acquisition of USFilter Corp. by France’s Vivendi Universal SA in 1999 (subsequently sold to Germany’s Siemens AG), and American Water Works’ return via a spinoff from RWE AG in April 2008, only five large publicly traded concerns now exist in the US.
Water treatment chemicals. This sector comprises companies that make water treatment chemicals for water suppliers and wastewater treatment facilities.
Contract operations and maintenance (O&M). The contract O&M industry consists of third-party, investor-owned companies that operate municipal water supply and wastewater treatment facilities, as well as industrial water treatment facilities. Municipal privatization accounts for about two-thirds of the market, while industrial outsourcing accounts for the balance.
Water-related consulting. This overlapping segment consists of companies that provide consulting services for water pollution cleanup projects. We think that these services are included in the water infrastructure construction and contract O&M segments.
Operations overview Public wastewater (sewage) treatment utilities provide two related services: collection (through pipe systems into which sewage drains) and treatment (performed at special facilities). Primary treatment uses large basins to separate solid wastes from wastewater. Secondary treatment typically uses a biological process to remove organic waste from the water. Sometimes a third step is taken, to remove salts and certain metals. Once wastewater is treated to regulatory standards, it is released into lakes, streams, or groundwater sources.
Municipally owned water supply and wastewater treatment facilities are typically funded by taxes or the issuance of tax-exempt private-activity bonds. Traditionally, most tax-exempt bonds limit third-party operations contracts to five years, thus precluding widespread privatization of plants and operations.
The responsibility for wastewater management can be transferred to private companies, however, and these privatization agreements can take several forms. A private company may purchase a municipal system outright. A municipality may make a single-purpose investment, in which it contracts with a private company to build, own, and service a plant. Alternatively, the two parties could form a public-private partnership, in which the municipality may finance the improvement of a private water system, or could contract with the private firm for operations, maintenance, billing, or other services. Privatization can benefit municipalities by creating a new source of funding to support municipal services.
To build or upgrade its water supply or treatment infrastructure, a municipality will hire third-party engineering design firms and construction companies. Although most municipalities are required by local law to use separate firms for each function to minimize conflicts of interest, there is a growing trend toward hiring a single firm to do both jobs.
Municipal water supply and wastewater treatment utilities generate revenues from user fees that are established by public commissions through a rate-setting process. When a rate change is requested—typically, by a water utility—the commission will conduct public hearings to consider several factors before issuing a ruling. Those factors include the size of current investments in facilities, current operating costs, estimated capital costs needed to finance future facility expansions, and equitable rate increase allocations across the customer base.

INDUSTRY SURVEYS ENVIRONMENTAL & WASTE MANAGEMENT / OCTOBER 2014 33
Water utilities in Pennsylvania, namely Aqua America, are permitted to add a Distribution System Improvement Charge (DISC) to their bills, reflecting capital costs and depreciation related to certain projects completed and put into service between rate filings, which sometimes leads to regulatory lag. Regulatory lag is the gap between the time a capital improvement project is completed and the utility recovers its costs through rate hikes.
Operations and maintenance contracts Operations and maintenance (O&M) contracts for water supply and wastewater treatment facilities are described below. This emerging sub-segment consists of independent firms that operate a water treatment facility for a municipality or an industrial company.
Short-term operating contract. Under a short-term contract, an O&M firm operates a facility for up to five years. The municipality issuing the contract is typically responsible for long-term capital improvements as well as for customer billing and collection. Until early 1997, one- to five-year operating contracts were the most common form of third-party operations of water utilities.
Long-term operating contract. An O&M firm operates a water facility for up to 20 years under a long-term operating contract. The municipality retains ownership of the wastewater facility, while the operator is generally responsible for long-term capital improvements, short-term operating expenses, and customer billing and payment collection. Long-term contracts (20-year contracts are the current norm) give investor-owned O&M firms the time needed to recoup costs of large upfront capital investments.
Own-operate-transfer contract. An own-operate-transfer contract includes the sale of a water utility to an O&M company. Such contracts usually include a provision allowing the municipality to repurchase the facility from the O&M firm.
Own-leaseback-operate contract. An own-leaseback-operate contract entails the initial sale of a utility to an O&M firm, the subsequent leaseback of the utility to the municipality, and a long-term operating contract.
Design-build-operate contract. A design-build-operate contract is made when a construction company designs, builds, and operates a water utility.
Elements of revenue growth Demand for water supply and wastewater treatment services is driven mostly by population and industrial development, both of which are growing slowly in the US. Revenues are driven by increases in water-use volume and charges.
Demand for water infrastructure construction and equipment depend on the availability of funding for municipal projects, and on population and industrial growth. Operations and maintenance work increase when publicly owned municipal water facilities are privatized and when industrial companies outsource their water treatment operations.
Demographics. Population growth has a direct impact on the waste management industry. The number of people in the population affects the use and discarding of materials, and the amount of water that needs to be managed.
Weather. Excessive rain, droughts, or cool temperatures can limit volume growth. Aqua America notes that cool, wet weather between May and September can reduce earnings by 5%–10%, while a hot, dry summer can provide an earnings boost, as long as reservoirs are near full capacity.
Economic growth. A rebound in economic conditions can increase state and municipal budgets, expanding the number of projects, while a rise in industrial production also enhances the need for infrastructure. Economic slowdowns can hurt revenues by cutting into capital spending or delaying infrastructure projects.

34 ENVIRONMENTAL & WASTE MANAGEMENT / OCTOBER 2014 INDUSTRY SURVEYS
Water-use charges. Water supply charges continue to rise in the high single digits each year. Water utilities have been able to receive approval from state commissions for at least 75% of their rate hike requests, as they have increased capital spending for new water systems.
Privatization. Municipalities that hire privately owned firms to operate their water systems, or that sell the systems to such companies, can free up funds for other uses. In turn, the process generates business revenues for the private firms.
Outsourcing. Corporations with capital-intensive water treatment operations that are not part of their core business drive outsourcing demand for independent O&M firms. Contracting with an outside provider to run these operations can help to boost a company’s profitability.
AIR POLLUTION CONTROL
The air pollution control industry provides equipment and services to the automotive industry and various smokestack industries. It comprises four main sectors: vehicle pollution control equipment; industrial plant pollution control equipment and chemicals; indoor air pollution control; and consulting and monitoring equipment. The first two sectors account for 90% of the total market.
Demand for vehicle emissions control devices is driven by the automotive industry as well as by government regulations. The markets for smokestack emissions control equipment and chemicals and for consulting and monitoring services are both driven by federal and state regulations.
The primary federal legislation addressing air pollution control is the Clean Air Act Amendments of 1990. The enforcement of federal regulations (which ultimately falls to state environmental agencies, which are overseen by the federal EPA) has been improving. Stricter vehicle emissions standards continue to be imposed on cars, sport-utility vehicles and trucks, while hybrid and electric vehicles enter the market.
Industrial plant pollution control Also known as end-of-pipe stationary source control, this industry makes emissions-control equipment and chemicals for electric utilities and industrial companies. Significant types of equipment include scrubbers for electric utilities and organic compounds control equipment for a broad range of industrial companies. Electric utilities use scrubbers to remove sulfur dioxide from coal- or oil-burning generators. Scrubber systems, which are installed in new and existing power plants, can cost hundreds of millions of dollars. Other key industry groups include pulp and paper, cement, metals smelting and refining, and petrochemicals.
This segment’s primary market driver consists of amendments to the federal Clean Air Act. The most significant change to the law was made in 2005, when the EPA adopted the Clean Air Interstate Rule.
The smokestack emissions-control market is fragmented, comprised of large firms that have long-standing relationships with the electric utility industry, suppliers that offer a broad line of air pollution control equipment for a variety of industries, replacement market service providers, engineering firms that install air pollution control systems in new plants, and a host of relatively small firms.
Power plants are responsible for nearly 70% of the sulfur dioxide, 25% of the nitrogen oxide, and 40% of the carbon dioxide emitted from industry and transportation sources, according to the EPA. Electric power plants built before 1972 still produce over 40% of the electricity made from burning fossil fuels, mainly coal, according to the US Government Accountability Office (GAO). These older plants, which are located primarily in the US Southwest, Midwest, and mid-Atlantic states, produce about 60% of the sulfur dioxide and nearly 50% of nitrogen oxides emitted by utilities.
Electric utilities are the major purchasers of air pollution control systems, but other industries are likely to become customers as Title V permit applications, submitted for approval over the past few years, take effect. (A Title V permit is an operating permit awarded under the Clean Air Act Amendments of 1990 to new plants that meet air quality regulations.)

INDUSTRY SURVEYS ENVIRONMENTAL & WASTE MANAGEMENT / OCTOBER 2014 35
Air pollution consulting and monitoring This industry serves markets for both vehicle emissions control and smokestack pollution control. The vehicle emissions control monitoring market is made up primarily of motor vehicle inspection stations, which check automotive exhausts for emissions that exceed required levels. Smokestack pollution comes from a broad range of industries, with power plants and manufacturing facilities producing the bulk of emissions.
ENVIRONMENTAL REMEDIATION AND CONSULTING
The environmental remediation (or cleanup) industry contains five segments: remediation consulting (including hazardous waste consulting), remediation construction, wastewater treatment, water supply, and air and solid waste. The process of cleaning toxic sites can be long and costly. Generally, it begins with initial cleanup investigations and feasibility studies conducted by remediation consulting firms.
Large remediation construction companies perform the actual site cleanup. The work may consist of either digging up contaminated soil and hauling it away, or mixing toxic waste with concrete and fly ash and burying it under rock and clay. Remediation construction companies may be hired to work on Superfund sites, non-Superfund sites, or brownfield redevelopment. Brownfields are contaminated sites that do not pose serious health or environmental threats according to the EPA. These sites are being cleaned for industrial and commercial redevelopment.
Customers include private industry and the US government, including the US Department of Defense and the US Department of Energy (DOE). Despite declines in federal funding, the US Navy and the US Air Force have been active in the remediation market and have been outsourcing or privatizing cleanup projects. The DOE has turned to both medium-size and large firms as subcontractors.
The Superfund segment of industrial remediation consists of sites on the National Priority List (NPL)—a list of the worst hazardous waste sites in the nation that the EPA Superfund has identified and approved for cleanup. These nongovernmental sites are considered highly toxic, posing health risks to surrounding communities. The non-Superfund segment primarily involves voluntary and transaction-driven cleanups by corporations, certain jobs mandated by regulations, and underground storage tank cleanups.
Regulation drives funding Federal and state regulations are the main demand drivers for remediation consulting and construction services. The Comprehensive Environmental Response, Compensation, and Liability Act of 1980 (CERCLA) was the primary force behind the creation of the Superfund and the remediation industry. This law created a tax on the chemical and petroleum industries that generated $1.6 billion over five years in a trust fund for cleaning abandoned or uncontrolled hazardous waste sites. In October 1986, CERCLA was amended by the Superfund Amendments and Reauthorization Act (SARA). Most companies in this industry operate in multiple businesses, and are not unduly affected by changes in environmental remediation spending.
Industrial cleaning Services performed include equipment repair, cleaning and replacement of parts, spill containment and cleanup, and general facility and fleet maintenance. While industrial cleaning generally is not considered part of the environmental remediation sector, some engineering and construction firms also provide these services. The industrial cleaning industry generates revenues of about $15 billion annually (excluding specialty and mechanical contractors). The 10 largest firms (with revenues of more than $100 million each) control 15% of the market; 50 firms ($20 million to $100 million in revenues) account for 20%; and 9,000 firms (less than $20 million in revenues) claim 65% of the market.
KEY INDUSTRY RATIOS AND STATISTICS
Gross domestic product (GDP). Compiled quarterly by the US Department of Commerce, GDP measures the total value of goods and services produced in the US. GDP is an important indicator used to gauge the health of the US economy, which in turn drives demand for municipal solid waste (MSW) services. Volume growth tends to fluctuate with economic activity. As of September 2014, Standard & Poor’s Economics

36 ENVIRONMENTAL & WASTE MANAGEMENT / OCTOBER 2014 INDUSTRY SURVEYS
(which operates separately from S&P Capital IQ) was projecting a 2.2% rise in real GDP for 2014 and a 3.0% rise for 2015, following an increase of 2.2% in 2013.
Housing starts. Released monthly by the Department of Commerce and reported as a seasonally adjusted annualized rate, housing starts indicate the number of residences on which construction has begun in a given period. These data are a key indicator of solid waste generation.
As of September 2014, Standard & Poor’s Economics was projecting that housing starts would rise to 1,020,000 units in 2014, representing growth of 9.7% from 930,000 units in 2013. A decline in housing starts limits solid waste generation, as construction and demolition (C&D) debris can account for more than 15% of total volume.
US population growth. This growth is a primary demand driver for the municipal water supply and treatment industry, as well as for the MSW industry. According to the US Census Bureau, the US population was over 317 million in 2013, up from over 315 million in 2012. It was projected to have reached 319.1 million in September 2014. The Census Bureau projects total population increase of 7.9% between 2013 and 2023, to 341.4 million (0.8% annually).
Daily MSW generated per capita. This measure directly drives demand for the MSW industry. The US Environmental Protection Agency (EPA) publishes annual statistics on this category. Daily MSW generated per person was about 4.38 pounds in 2012 (latest available), down slightly from 4.40 pounds per person in 2010. The generally flat rate of per capita MSW generation—the result of increased recycling and composting efforts, and a reduction in discarded waste—contributes to the low MSW industry growth rates.
Landfill and incinerator capacity. Reported by several private waste industry publications and by individual companies, this statistic is important in gauging the MSW industry’s ability to increase landfill charges or tipping fees in a given area. In general, the less capacity that is available, the higher the fees that can be charged. The two largest waste haulers (Waste Management Inc. and Republic Services Inc.), which handle more than 40% of the nation’s trash, together operated 457 landfills as of December 31, 2013, with Waste Management operating 267 landfills.
Landfill disposal charges. These are important in gauging the MSW industry’s profitability. Because of the high cost of transport charges, the waste management business is predominantly local. Thus, the fees charged in a given market indicate the potential profitability for a firm operating a landfill in that market. For waste haulers, they indicate the firms’ expenses for dumping waste.
Disposal charges, called tipping fees or “gate rates,” vary significantly by market. The average tipping fee on a national basis is less useful than are local fees in assessing a company, market, or profit level. Gate rates for MSW were strongest in the Northeast and the Western regions, as industry consolidation enhances pricing power.
HOW TO ANALYZE AN ENVIRONMENTAL COMPANY
Some useful factors to consider when analyzing an environmental company include financial statement ratios and statistics, internalization rates (for waste management companies), and business life cycles.
LOOKING AT THE NUMBERS
An environmental company’s main financial statements—balance sheet, income statement, and statement of cash flows—provide an important basis for assessing the firm’s overall performance.
Measures of financial condition There are three main measures used to evaluate financial condition: current ratio, debt-to-capital ratio, and interest coverage ratio.

INDUSTRY SURVEYS ENVIRONMENTAL & WASTE MANAGEMENT / OCTOBER 2014 37
Current ratio. This commonly used ratio helps in assessing a company’s ability to service its short-term financial obligations. To derive it, divide current assets by current liabilities. Current assets are those that can be readily converted to cash or used up in the course of a firm’s operating cycle (typically, one year). Current liabilities generally encompass short-term debt, accounts payable, and other short-term obligations.
Debt-to-capital ratio. A company’s financial strength and flexibility can be assessed according to the level of debt it holds relative to its total invested capital. The debt-to-capital ratio is calculated by dividing long-term debt (including lease obligations) by the sum of long-term debt and equity. Many large, publicly traded waste haulers tend to be highly leveraged, due in part to acquisition strategies and the capital-intensive nature of the business. These companies continue to focus on reducing their debt levels, while generating a lot of excess cash. The two largest waste haulers in North America—Waste Management Inc. and Republic Services Inc.—had debt-to-capital ratios of 55.7% and 47.0%, respectively, as of December 31, 2013.
Interest coverage ratio. This measure is calculated by dividing earnings before interest, taxes, depreciation, and amortization (EBITDA) by interest expense. In times of low interest rates, interest coverage can improve, as interest expense tends to be lower.
Leverage ratio. This measure is calculated by dividing debt by EBITDA. As a company reduces its debt level, and/or increases its EBITDA, the leverage ratio improves.
Measures of profitability There are three main measures used to evaluate profitability: return on equity, depreciation expense, and the waste internalization rate.
Return on equity (ROE). A common measure of a company’s performance, ROE is calculated by dividing net income (less preferred stock dividends) by average common shareholders’ equity. Water utilities seek rate hikes from state commissions to cover their capital-intensive upgrades of deteriorating water systems; they focus on maintaining ROEs above 10%.
Return on invested capital (ROIC). This measures the company’s efficiency at allocating the capital under its control to profitable investments. ROIC gives a sense of how well a company is using its money to generate returns. Comparing a company’s ROIC with its weighted average cost of capital (WACC) reveals whether invested capital was used effectively. ROIC is calculated by dividing net operating profit after-tax by total capital (average shareholders’ equity plus debt).
Depreciation expense. When analyzing an environmental company’s profit performance, depreciation expense is particularly important, especially for capital-intensive waste management firms, and is probably the best measure of a company’s quality of earnings. Waste companies generally own collection trucks, transfer stations, and landfills. Depreciation of trucks and transfer stations is straightforward; companies typically use a “straight-line” method to depreciate trucks and transfer stations, presuming an eight- to 10-year life for trucks and related equipment and a 30-year life for transfer stations.
In depreciating landfill, however, waste companies have wide discretion. The choice of depreciation methods and useful life calculations can materially affect the amount of depreciation expense and thus reported income. Which method a company chooses depends on the total landfill capacity and the projected life of the landfill. Companies can depreciate less expense in the early years, thus boosting net income early on. From a tax standpoint, a more aggressive stance would entail depreciating a larger amount initially, which would result in lower reported earnings (and thus taxes) during the first few years.
There are four basic landfill depreciation methods. From most conservative to most aggressive, they are life cycle/permitted-only capacity; life cycle/permitted and potential capacity; non-life cycle/existing capacity; and non-life cycle/existing and potential capacity.
In the years 2009 through 2011, free cash flow generation has benefited from President Obama’s cash tax credit related to “bonus depreciation,” which is an acceleration of a tax deduction for depreciation on vehicles and equipment purchases. The benefit will reverse in future years following new legislation in late

38 ENVIRONMENTAL & WASTE MANAGEMENT / OCTOBER 2014 INDUSTRY SURVEYS
2010 that extended bonus depreciation for 2011. The bonus depreciation was further extended for 2012 and 2013 tax years, but only at a 50% rate.
Waste internalization rate. This figure is a measure of the profitability of waste hauling and disposal firms. The waste internalization rate is defined as the percentage of refuse a waste company deposits in its own disposal facilities, rather than in third-party disposal facilities.
In general, paying a third party to dispose of waste costs more than depositing the waste in a company’s own landfill. Many solid waste companies are focused on improving this metric. Waste Management’s internalization rate was 67.6% at year-end 2013, up from 67.0% a year earlier. According to the company, for every 100 basis points that it gains in its internalization rate, about $0.02 per share are added to earnings.
Some companies decide whether to internalize their waste based on the economic benefits in each marketplace. Republic Services, for instance, employs a “disposal optimization model,” by which it determines the markets where it is more profitable (or less costly) either to use the company’s own landfills or to contract with another waste company or entity. In Orange County, California, the company’s internalization rate is zero, because a long-term contract with the municipal landfill is more cost effective than the capital investment and other costs associated with running a landfill in that market.
ACQUISITIONS VERSUS INTERNAL GROWTH
With the consolidation of the water treatment and MSW industries, several large, fast-growing, publicly traded water conglomerates and waste management companies have acquired smaller water treatment and MSW companies. Some companies have financed their acquisitions by exchanging stock, with the acquirers’ shares generally valued at higher price/earnings (P/E) multiples than those of the acquirees’ stock. When economic conditions are soft, smaller companies may have difficulty raising capital or generating enough cash to run their operations, leading to more attractive acquisition multiples.
In the past, this stock-for-stock financing strategy produced strong increases in per-share operating earnings for the acquirer. As long as an acquirer pursues a high-P/E for low-P/E stock swap method, these transactions are usually accretive to earnings. However, integration problems and high debt levels in the solid waste industry following large mergers in 1998 and 1999, have led to a decrease in major stock deals and more of a focus on internal growth, asset swaps, and niche “tuck-in” acquisitions, as well as divestitures of underperforming assets. Nevertheless, activity picked up again in 2008, with the third largest North American waste hauler, Republic Services, acquiring the No. 2 player, Allied Waste Industries, in December. Prior to completing the deal, Republic had rejected two takeover bids from the No. 1 hauler, Waste Management.
Once the acquisition pace slows, acquirers have to place more of a focus on growth through internal expansion. However, with about 50,000 small, private, municipally owned water companies in the US, major water utilities, especially Aqua America, continue to use acquisitions to expand their customer base and geographic diversity. With many of the acquired companies having deteriorating water and wastewater systems, their operations and maintenance expense as a percentage of revenues (operations and maintenance, or O&M, efficiency ratios) tend to be high, which the acquirers seek to improve through capital upgrades via rate cases submitted to state commissions. Aqua America’s efficiency ratio had climbed to near 45% following the acquisitions in 2003 and 2004 of two companies with ratios exceeding 60%. However, the water utility was targeting a 100- to 150-basis point annual decline in its O&M ratio, following about a 38.7% efficiency ratio in 2010. In 2011, the company recorded an efficiency ratio of 38%, and the efficiency ratio dropped further to 36.7% in 2012, but rebounded to 37.1% in 2013. Air pollution and environmental cleanup firms have not followed the same acquisition strategy.
Retained earnings Analysts can see if a company is generating earnings growth through internal operations by disaggregating retained earnings growth from book-value growth. Retained earnings consist of accumulated net income kept by the company as cash, investments, securities, and so on. Book value, or total equity, primarily includes common stock, paid-in capital, and retained earnings.

INDUSTRY SURVEYS ENVIRONMENTAL & WASTE MANAGEMENT / OCTOBER 2014 39
In general, the total equity of an acquiring company increases when it exchanges its higher P/E stock for the lower P/E stock of its target. However, if its retained earnings growth does not keep pace with total equity growth, then most of its earnings gains are the result of financial transactions, not internal operations. If a company depends on acquisitions for growth, then its growth rate, and the price of its stock, may become vulnerable once the pace of acquisitions slows.
Pooling of interest, goodwill amortization eliminated Both stock-for-stock (or pooling of interest) and cash acquisitions have figured in environmental firms’ growth strategies during past years. However, the Financial Accounting Standards Board (FASB) decided to eliminate pooling of interest accounting methods as of July 1, 2001. The FASB believes that the purchase method reflects the underlying economics of business combinations by requiring that the current values of assets and liabilities exchanged be reported to investors.
In the past, an increase in cash transactions would also boost the amount of overall industry goodwill (reflecting premiums paid above the acquirees’ book value), which ordinarily would lead to lower reported earnings. However, the FASB also eliminated goodwill amortization, which has boosted profits for many companies. Under the 2001 rule, goodwill is not steadily amortized against earnings but is reviewed for impairment, and thus is written down and expensed against earnings only in the periods in which the recorded value of goodwill exceeds its fair value.
Acquisition multiples have been averaging about five to seven times EBITDA in the solid waste sector. For the water sector, acquisition multiples have averaged five to six times EBITDA in recent years.
BUSINESS LIFE CYCLES AND PROFITABILITY
As an environmental product or service progresses along the business life cycle, it becomes increasingly price sensitive, according to the environmental industry marketing research firm BTI Consulting Group. As it becomes more price sensitive, its profit margins are likely to decline. BTI’s business life-cycle analysis describes each stage of the cycle for environmental companies. It sees each service progressing from new, developing, and growth phases, to maturity and stagnation. The analysis identifies the stage that each principal environmental offering has attained.
The new stage is typically the domain of venture capitalists and entrepreneurs. This stage requires capital for investment in research and development and start-up costs for new business operations and products. Companies seek financing and managers experienced in the respective fields.
In the development stage and the early part of the growth stage, the environmental company works with customers to develop a product or service that meets their needs. Customers usually do not ask for a specific service if it does not exist yet, or if they do not know it exists; all they know is that they have needs. Innovative companies can tap into these needs by providing services to satisfy them.
During the growth stage, the market begins to expand as it becomes easier for environmental companies to develop a product or service offering. Supply reaches equilibrium with demand as a large amount of supply enters the market. Once customers gain experience buying the product or service and competitors enter the market, they begin to dictate prices.
The maturity and stagnation stages see too much supply chasing too little demand. At these times, an environmental company has little to differentiate itself from other suppliers, and therefore must compete on price. Profit margins typically decline in these stages.
According to BTI, most environmental management and information services are in the development stage of the service life cycle. The outsourcing of service functions—such as industrial treatment operations—lies between the development and growth stages. Both toxic cleanup consulting and third-party industrial water-quality contract operations are in the growth stage.

40 ENVIRONMENTAL & WASTE MANAGEMENT / OCTOBER 2014 INDUSTRY SURVEYS
Remediation consulting services are more price sensitive than industrial water quality services. Remediation construction services (which involve actual cleanup) and air pollution control consulting services may be moving toward the mature stage. Finally, both hazardous and nonhazardous solid waste disposal and treatment services are in the middle of the mature stage of the business life cycle.
EQUITY VALUATION
A solid waste company’s intrinsic value can be measured by estimating the present value of future free cash flows (the discounted cash flow, or DCF, model). Free cash flow consists of after-tax net income plus depreciation and amortization, less capital expenditures, the change in working capital, and preferred dividends. These figures are available from a company’s balance sheets and cash flow statements, which are found in its annual report, 10-K filing, or quarterly 10-Q reports filed with the US Securities and Exchange Commission (SEC).
Free cash flow is important to calculate because it paints a relatively accurate picture of a company’s true profit performance, or earnings allocated to shareholders after capital costs are expended to maintain the company’s operations. It is especially important in evaluating a municipal solid waste (MSW) company’s intrinsic value, as waste haulers are currently focused on generating free cash flow in order to pay down debt, and, more recently, repurchase stock and initiate quarterly cash dividends.
Waste Management increased its quarterly dividend nine times between 2004 and 2013. As of October 2014, based on an annualized dividend of $1.50, the company’s yield was 3.15%. Republic Services has raised its quarterly dividend 10 times since initiating a $0.02 quarterly dividend in 2003. Its recent yield was 2.72%. In recent years, several large waste haulers have boosted their free cash flows via proceeds from asset sales and reduced acquisition budgets. In 2013, Waste Management’s free cash flow (as a percentage of revenues) was 9.5%, versus 7.9% in 2012.
Capital costs are not reflected on the income statement; in essence, they are deducted from retained earnings and thus from equity attributable to shareholders. Capitalized expenses can be found on the company’s balance sheet.
P/E ratios are a common method of valuing a company. For solid waste companies, the two largest haulers—Waste Management and Republic Services—in October 2014 were trading at about 19.9X and 19.5X our 2014 operating EPS estimates, respectively, and 18.2X and 17.9X our 2015 projections. Both discounts to the P/E ratios for the S&P Environmental & Facilities Services sub-industry group, but above the projected P/E multiplesfor the S&P 500 index. Historically, this group has traded at average multiples in the mid-to-high teens, on a trailing 12-month basis. Other key valuation metrics for environmental services companies include Total Enterprise Value-to-EBITDA and price-to-book value. In the past five years, the major waste companies have averaged about 7.4X Total Enterprise Value-to-forward EBITDA and 2.1X price-to-book.
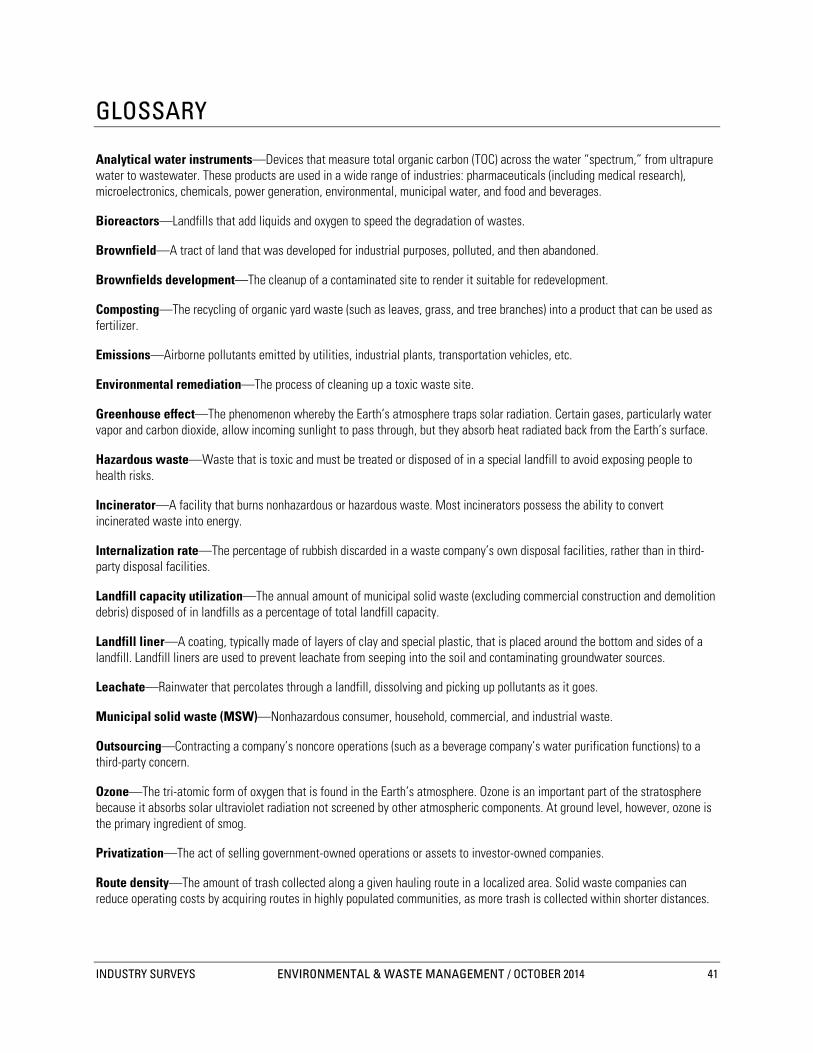
INDUSTRY SURVEYS ENVIRONMENTAL & WASTE MANAGEMENT / OCTOBER 2014 41
GLOSSARY
Analytical water instruments—Devices that measure total organic carbon (TOC) across the water “spectrum,” from ultrapure water to wastewater. These products are used in a wide range of industries: pharmaceuticals (including medical research), microelectronics, chemicals, power generation, environmental, municipal water, and food and beverages.
Bioreactors—Landfills that add liquids and oxygen to speed the degradation of wastes.
Brownfield—A tract of land that was developed for industrial purposes, polluted, and then abandoned.
Brownfields development—The cleanup of a contaminated site to render it suitable for redevelopment.
Composting—The recycling of organic yard waste (such as leaves, grass, and tree branches) into a product that can be used as fertilizer.
Emissions—Airborne pollutants emitted by utilities, industrial plants, transportation vehicles, etc.
Environmental remediation—The process of cleaning up a toxic waste site.
Greenhouse effect—The phenomenon whereby the Earth’s atmosphere traps solar radiation. Certain gases, particularly water vapor and carbon dioxide, allow incoming sunlight to pass through, but they absorb heat radiated back from the Earth’s surface.
Hazardous waste—Waste that is toxic and must be treated or disposed of in a special landfill to avoid exposing people to health risks.
Incinerator—A facility that burns nonhazardous or hazardous waste. Most incinerators possess the ability to convert incinerated waste into energy.
Internalization rate—The percentage of rubbish discarded in a waste company’s own disposal facilities, rather than in third-party disposal facilities.
Landfill capacity utilization—The annual amount of municipal solid waste (excluding commercial construction and demolition debris) disposed of in landfills as a percentage of total landfill capacity.
Landfill liner—A coating, typically made of layers of clay and special plastic, that is placed around the bottom and sides of a landfill. Landfill liners are used to prevent leachate from seeping into the soil and contaminating groundwater sources.
Leachate—Rainwater that percolates through a landfill, dissolving and picking up pollutants as it goes.
Municipal solid waste (MSW)—Nonhazardous consumer, household, commercial, and industrial waste.
Outsourcing—Contracting a company’s noncore operations (such as a beverage company’s water purification functions) to a third-party concern.
Ozone—The tri-atomic form of oxygen that is found in the Earth’s atmosphere. Ozone is an important part of the stratosphere because it absorbs solar ultraviolet radiation not screened by other atmospheric components. At ground level, however, ozone is the primary ingredient of smog.
Privatization—The act of selling government-owned operations or assets to investor-owned companies.
Route density—The amount of trash collected along a given hauling route in a localized area. Solid waste companies can reduce operating costs by acquiring routes in highly populated communities, as more trash is collected within shorter distances.

42 ENVIRONMENTAL & WASTE MANAGEMENT / OCTOBER 2014 INDUSTRY SURVEYS
State revolving fund (SRF)—A state-managed fund providing loans for specific water pollution control purposes. Under the SRF program, states and municipalities are primarily responsible for financing, constructing, and managing wastewater treatment facilities.
The Superfund Program—A program set up by the US government to fund Environmental Protection Agency (EPA) cleanups of high-priority toxic industrial sites; formally known as the Comprehensive Environmental Response, Compensation, and Liability Act (CERCLA).
Tipping fees—Fees charged by operators of transfer stations and landfills to solid waste collectors for the disposal of nonhazardous and/or hazardous waste, usually expressed in dollars per ton. Also called “gate” or “user” fees.
Transfer station—A facility that compacts collected municipal solid waste. The compacted waste is then transported to a disposal site (either a landfill or an incinerator). Increasingly, transfer stations are being used to sort recyclable materials.
Tuck-in acquisitions—Waste hauling acquisitions that increase the acquirer’s waste collection operations without its having to build additional capital-intensive waste-disposal capacity.
Waste-to-energy (WTE) plant—A facility that converts incinerated waste into electric power.
Wastewater treatment plant—A facility that treats and purifies municipal and industrial sewage.

INDUSTRY SURVEYS ENVIRONMENTAL & WASTE MANAGEMENT / OCTOBER 2014 43
INDUSTRY REFERENCES
PERIODICALS
American Recycler http://www.americanrecycler.com Monthly; salvage, waste, and recycling.
BioCycle http://www.biocycle.net Monthly; primarily covers the recycling industry.
Chemical & Engineering News http://cen.acs.org Weekly; covers the chemical processing industries. Includes news on remediation and toxic substances; presents industrial, commercial, and government viewpoints.
Engineering News-Record (ENR) http://enr.construction.com Weekly; covers engineering and construction news.
Environmental Business Journal http://environmental-industry.com Monthly; provides marketing research information and statistics for all segments of the environmental industry.
Environmental Site Assessment Report http://edrnet.com A monthly newsletter serving the environmental consulting industry.
Waste360 http://waste360.com Provides news, information, and resources about the solid waste industry via daily, weekly, and monthly eNewsletter.
Waste Business Journal (WBJ) http://www.wastebusinessjournal.com Provides information on the solid waste industry via a weekly news bulletin, monthly volume and pricing service, market reports and annual industry overview.
INDUSTRY ASSOCIATIONS
Air & Waste Management Association http://www.awma.org Serves the air quality and solid waste industries.
American Forest & Paper Association (AF&PA) http://www.afandpa.org Serves the forest, pulp, paper, paperboard, and wood products industries.
American Water Works Association (AWWA) http://www.awwa.org Serves the water utility and sewage treatment industries.
Energy Recovery Council http://www.wte.org Serves the waste-to-energy (WTE) industry.
Institute of Clean Air Companies (ICAC) http://www.icac.com Serves the air quality industry.
Manufacturers of Emission Controls Association http://www.meca.org Serves air quality equipment makers.
Municipal Waste Management Association http://www.usmayors.org/mwma Serves the municipal solid waste (MSW) industry; affiliated with the US Conference of Mayors.
National Association of Water Companies (NAWC) http://www.nawc.org Serves the water utilities industry.
National Association for PET Container Resources (NAPCOR) http://www.napcor.com Serves the polyethylene terephthalate (PET) plastics industry.
National Recycling Coalition Inc. http://www.nrcrecycles.org Nonprofit organization representing interests committed to maximizing recycling as a means to conserve resources and energy, reduce solid waste, protect the environment, and promote social and economic development.
National Waste & Recycling Association http://wasterecycling.org Serves the solid waste industry.
Solid Waste Association of North America (SWANA) http://www.swana.org Serves the solid waste industry.
RESEARCH FIRMS
BTI Consulting Group Inc. http://www.bticonsulting.com Market research and management consulting for the air, water, and environmental cleanup industries.

44 ENVIRONMENTAL & WASTE MANAGEMENT / OCTOBER 2014 INDUSTRY SURVEYS
BioEnergy Consult http://www.bioenergyconsult.com Provides energy and waste management consulting.
Environmental Business International Inc. http://www.ebiresearch.com Research, publishing, and consulting company serving the environmental industry and government agencies worldwide.
The Envirobiz Group http://www.envirobiz.com Provides consulting and research services on the options, challenges, and opportunities for resource conservation and environmental protection in North America.
GrassRoots Recycling Network http://www.grrn.org Community-based recycling activists advocating zero waste.
The Waste Policy Center http://www.winporter.com Environmental consulting and communications.
GOVERNMENT AGENCIES
US Environmental Protection Agency (EPA) http://www.epa.gov Federal agency that oversees the nation’s environmental safety; enacts and enforces environmental laws. Many states also maintain environmental agencies.

INDUSTRY SURVEYS ENVIRONMENTAL & WASTE MANAGEMENT / OCTOBER 2014 45
COMPARATIVE COMPANY ANALYSIS
Operating Revenues
Million $ CAGR (%) Index Basis (2003 = 100)
Ticker Company Yr. End 2013 2012 2011 2010 2009 2008 2003 10-Yr. 5-Yr. 1-Yr. 2013 2012 2011 2010 2009
ENVIRONMENTAL & FACILITIES SERVICES‡ABM § ABM INDUSTRIES INC OCT 4,809.3 4,300.3 4,246.8 A 3,495.7 3,481.8 3,623.6 A,C 2,262.5 A,C 7.8 5.8 11.8 213 190 188 155 154CLH † CLEAN HARBORS INC DEC 3,519.8 2,187.9 A 1,984.1 A 1,731.2 A 1,074.2 A,C 1,030.7 611.0 19.1 27.8 60.9 576 358 325 283 176RSG [] REPUBLIC SERVICES INC DEC 8,417.2 8,118.3 A 8,192.9 A 8,106.6 A 8,199.1 3,685.1 A 2,517.8 A 12.8 18.0 3.7 334 322 325 322 326ROL † ROLLINS INC DEC 1,337.4 1,270.9 1,205.1 1,136.9 1,074.0 1,020.6 A 677.0 7.0 5.6 5.2 198 188 178 168 159SRCL [] STERICYCLE INC DEC 2,142.8 A 1,913.1 A 1,676.0 A 1,439.4 A 1,177.7 A 1,083.7 A 453.2 16.8 14.6 12.0 473 422 370 318 260
TTEK § TETRA TECH INC SEP 2,613.8 2,711.1 2,573.1 2,201.2 2,287.5 2,145.3 A 1,132.1 A 8.7 4.0 (3.6) 231 239 227 194 202ECOL US ECOLOGY INC DEC 201.1 169.1 A 154.9 104.8 A 132.5 175.8 57.0 D 13.4 2.7 18.9 353 296 272 184 232WCN † WASTE CONNECTIONS INC DEC 1,928.8 1,661.6 A 1,505.4 1,319.8 1,191.4 1,049.6 563.5 A 13.1 12.9 16.1 342 295 267 234 211WM [] WASTE MANAGEMENT INC DEC 13,983.0 A 13,649.0 A 13,378.0 12,515.0 A 11,791.0 A,C 13,388.0 A 11,574.0 A,C 1.9 0.9 2.4 121 118 116 108 102
WATER UTILITIES‡AWR § AMERICAN STATES WATER CO DEC 472.1 466.9 419.3 398.9 D 361.0 318.7 212.7 8.3 8.2 1.1 222 220 197 188 170WTR † AQUA AMERICA INC DEC 768.6 757.8 D 712.0 D 726.1 670.5 627.0 367.2 A 7.7 4.2 1.4 209 206 194 198 183
OTHER COMPANIES WITH SIGNIFICANT WASTE MANAGEMENT OPERATIONSCWST CASELLA WASTE SYS INC -CL A # APR 497.6 A,C 455.3 A,C 480.8 A 466.1 A,C 522.3 D 554.2 A 439.7 A 1.2 (2.1) 9.3 113 104 109 106 119
OTHER COMPANIES WITH SIGNIFICANT ENVIRONMENTAL SERVICES OPERATIONSCCC § CALGON CARBON CORP DEC 547.9 562.3 541.5 482.3 A,C 411.9 400.3 278.3 7.0 6.5 (2.5) 197 202 195 173 148TTI § TETRA TECHNOLOGIES INC/DE DEC 909.4 880.8 A 845.3 872.7 878.9 1,009.1 318.7 D 11.1 (2.1) 3.2 285 276 265 274 276VE VEOLIA ENVIRONNEMENT -ADR DEC 30,747.6 D,F 38,817.6 D,F 38,461.4 A,C 46,158.3 D,F 49,518.5 D,F 50,394.4 D,F 36,124.0 F (1.6) (9.4) (20.8) 85 107 106 128 137
OTHER COMPANIES WITH SIGNIFICANT WATER UTILITY OPERATIONSAWK AMERICAN WATER WORKS CO INC DEC 2,901.9 F 2,876.9 A,F 2,666.2 D,F 2,710.7 F 2,440.7 F 2,336.9 F NA NA 4.4 0.9 ** ** ** ** NACWT CALIFORNIA WATER SERVICE GP DEC 584.1 560.0 501.8 460.4 449.4 410.3 277.1 A 7.7 7.3 4.3 211 202 181 166 162
Note: Data as originally reported. CAGR-Compound annual grow th rate. ‡S&P 1500 index group. []Company included in the S&P 500. †Company included in the S&P MidCap 400. §Company included in the S&P SmallCap 600. #Of the follow ing calendar year. **Not calculated; data for base year or end year not available. A - This year's data reflect an acquisition or merger. B - This year's data reflect a major merger resulting in the formation of a new company. C - This year's data reflect an accounting change.D - Data exclude discontinued operations. E - Includes excise taxes. F - Includes other (nonoperating) income. G - Includes sale of leased depts. H - Some or all data are not available, due to a f iscal year change.

46 ENVIRONMENTAL & WASTE MANAGEMENT / OCTOBER 2014 INDUSTRY SURVEYS
Net Income
Million $ CAGR (%) Index Basis (2003 = 100)
Ticker Company Yr. End 2013 2012 2011 2010 2009 2008 2003 10-Yr. 5-Yr. 1-Yr. 2013 2012 2011 2010 2009
ENVIRONMENTAL & FACILITIES SERVICES‡ABM § ABM INDUSTRIES INC OCT 72.9 62.7 68.7 63.9 55.5 52.7 36.4 7.2 6.7 16.2 200 172 189 175 152CLH † CLEAN HARBORS INC DEC 95.6 129.7 127.3 127.7 35.2 57.5 (17.3) NM 10.7 (26.3) NM NM NM NM NM RSG [] REPUBLIC SERVICES INC DEC 588.9 571.8 589.2 506.5 495.0 73.8 215.4 10.6 51.5 3.0 273 265 274 235 230ROL † ROLLINS INC DEC 123.3 111.3 100.7 90.0 84.0 68.9 35.8 13.2 12.3 10.8 345 311 282 252 235SRCL [] STERICYCLE INC DEC 311.4 268.0 234.8 207.9 175.7 148.7 65.8 16.8 15.9 16.2 473 407 357 316 267
TTEK § TETRA TECH INC SEP (2.1) 104.4 90.0 76.8 87.0 60.9 50.1 NM NM NM (4) 208 180 153 174ECOL US ECOLOGY INC DEC 32.2 25.7 18.4 12.6 14.0 21.5 (11.1) NM 8.4 25.3 NM NM NM NM NM WCN † WASTE CONNECTIONS INC DEC 195.7 159.1 165.2 135.1 109.8 105.6 65.3 11.6 13.1 23.0 300 244 253 207 168WM [] WASTE MANAGEMENT INC DEC 98.0 817.0 961.0 953.0 994.0 1,087.0 719.0 (18.1) (38.2) (88.0) 14 114 134 133 138
WATER UTILITIES‡AWR § AMERICAN STATES WATER CO DEC 62.7 54.1 42.0 31.1 29.5 22.0 11.9 18.1 23.3 15.8 527 455 353 261 248WTR † AQUA AMERICA INC DEC 205.0 184.1 144.8 124.0 104.4 97.9 70.8 11.2 15.9 11.4 290 260 204 175 147
OTHER COMPANIES WITH SIGNIFICANT WASTE MANAGEMENT OPERATIONSCWST CASELLA WASTE SYS INC -CL A # APR (23.0) (49.7) (78.3) (3.7) (15.3) (68.0) 5.4 NM NM NM (427) (923) (1,455) (69) (283)
OTHER COMPANIES WITH SIGNIFICANT ENVIRONMENTAL SERVICES OPERATIONSCCC § CALGON CARBON CORP DEC 45.7 23.3 39.2 34.8 39.2 35.6 4.5 26.1 5.1 96.4 1,019 519 875 777 873TTI § TETRA TECHNOLOGIES INC/DE DEC 0.2 16.0 4.2 (43.3) 68.8 (9.7) 19.4 (38.3) NM (99.0) 1 82 22 (223) 355VE VEOLIA ENVIRONNEMENT -ADR DEC (224.0) 10.2 (632.3) 802.4 898.5 307.5 (2,595.0) NM NM NM NM NM NM NM NM
OTHER COMPANIES WITH SIGNIFICANT WATER UTILITY OPERATIONSAWK AMERICAN WATER WORKS CO INC DEC 369.3 374.4 305.2 268.1 (232.9) (562.2) NA NM NM (1.4) ** ** ** ** NACWT CALIFORNIA WATER SERVICE GP DEC 47.3 48.8 37.7 37.7 40.6 39.8 19.4 9.3 3.5 (3.2) 243 251 194 194 209
Note: Data as originally reported. CAGR-Compound annual grow th rate. ‡S&P 1500 index group. []Company included in the S&P 500. †Company included in the S&P MidCap 400. §Company included in the S&P SmallCap 600. #Of the follow ing calendar year. **Not calculated; data for base year or end year not available.

INDUSTRY SURVEYS ENVIRONMENTAL & WASTE MANAGEMENT / OCTOBER 2014 47
Return on Revenues (%) Return on Assets (%) Return on Equity (%)
Ticker Company Yr. End 2013 2012 2011 2010 2009 2013 2012 2011 2010 2009 2013 2012 2011 2010 2009
ENVIRONMENTAL & FACILITIES SERVICES‡ABM § ABM INDUSTRIES INC OCT 1.5 1.5 1.6 1.8 1.6 3.7 3.3 4.0 4.2 3.6 8.2 7.6 9.0 9.0 8.3CLH † CLEAN HARBORS INC DEC 2.7 5.9 6.4 7.4 3.3 2.5 4.4 6.9 8.5 3.1 6.6 11.1 15.1 18.3 6.8RSG [] REPUBLIC SERVICES INC DEC 7.0 7.0 7.2 6.2 6.0 3.0 2.9 3.0 2.6 2.5 7.5 7.4 7.6 6.6 6.7ROL † ROLLINS INC DEC 9.2 8.8 8.4 7.9 7.8 17.2 16.6 15.9 15.2 14.7 31.1 32.8 32.4 32.0 34.1SRCL [] STERICYCLE INC DEC 14.5 14.0 14.0 14.4 14.9 8.4 8.0 8.1 8.6 8.9 18.9 19.6 20.9 21.9 23.2
TTEK § TETRA TECH INC SEP NM 3.9 3.5 3.5 3.8 NM 6.4 6.1 6.2 8.1 NM 11.1 11.2 11.0 15.0ECOL US ECOLOGY INC DEC 16.0 15.2 11.9 12.0 10.5 12.4 12.2 8.7 7.4 11.1 18.7 24.2 18.9 13.4 15.1WCN † WASTE CONNECTIONS INC DEC 10.1 9.6 11.0 10.2 9.2 3.9 3.8 5.3 4.7 4.1 10.0 9.7 12.0 9.9 8.4WM [] WASTE MANAGEMENT INC DEC 0.7 6.0 7.2 7.6 8.4 0.4 3.6 4.4 4.5 4.8 1.6 13.2 15.6 15.2 16.3
WATER UTILITIES‡AWR § AMERICAN STATES WATER CO DEC 13.3 11.6 10.0 7.8 8.2 4.8 4.3 3.5 2.7 2.7 13.2 12.5 10.7 8.4 8.8WTR † AQUA AMERICA INC DEC 26.7 24.3 20.3 17.1 15.6 4.1 4.0 3.4 3.2 2.9 14.0 14.0 11.9 10.9 9.6
OTHER COMPANIES WITH SIGNIFICANT WASTE MANAGEMENT OPERATIONSCWST CASELLA WASTE SYS INC -CL A # APR NM NM NM NM NM NM NM NM NM NM NM NM NM NM NM
OTHER COMPANIES WITH SIGNIFICANT ENVIRONMENTAL SERVICES OPERATIONSCCC § CALGON CARBON CORP DEC 8.3 4.1 7.2 7.2 9.5 7.8 4.1 7.4 7.5 9.6 11.9 6.4 10.9 10.7 14.0TTI § TETRA TECHNOLOGIES INC/DE DEC 0.0 1.8 0.5 NM 7.8 0.0 1.3 0.3 NM 5.0 0.0 3.0 0.8 NM 12.6VE VEOLIA ENVIRONNEMENT -ADR DEC NM 0.0 NM 1.7 1.8 NM 0.0 NM 1.1 1.3 NM 0.1 NM 7.5 8.8
OTHER COMPANIES WITH SIGNIFICANT WATER UTILITY OPERATIONSAWK AMERICAN WATER WORKS CO INC DEC 12.7 13.0 11.4 9.9 NM 2.7 2.7 2.3 2.1 NM 8.1 8.6 7.3 6.6 NMCWT CALIFORNIA WATER SERVICE GP DEC 8.1 8.7 7.5 8.2 9.0 2.4 2.5 2.1 2.3 2.8 8.8 10.6 8.5 8.8 9.8
Note: Data as originally reported. ‡S&P 1500 index group. []Company included in the S&P 500. †Company included in the S&P MidCap 400. §Company included in the S&P SmallCap 600. #Of the follow ing calendar year.

48 ENVIRONMENTAL & WASTE MANAGEMENT / OCTOBER 2014 INDUSTRY SURVEYS
Debt as a % ofCurrent Ratio Debt / Capital Ratio (%) Net Working Capital
Ticker Company Yr. End 2013 2012 2011 2010 2009 2013 2012 2011 2010 2009 2013 2012 2011 2010 2009
ENVIRONMENTAL & FACILITIES SERVICES‡ABM § ABM INDUSTRIES INC OCT 1.7 1.6 1.7 1.8 1.8 25.3 20.2 27.4 16.0 20.1 88.4 73.2 103.2 51.1 62.0CLH † CLEAN HARBORS INC DEC 1.8 1.9 2.3 2.5 2.7 48.7 49.5 37.1 25.8 32.8 263.6 271.0 104.0 60.7 77.4RSG [] REPUBLIC SERVICES INC DEC 0.8 0.7 0.7 0.5 0.5 47.0 47.8 47.3 42.8 45.9 NM NM NM NM NMROL † ROLLINS INC DEC 1.2 0.9 0.8 0.6 0.5 0.0 0.0 0.0 0.0 0.0 0.0 NM NM NM NMSRCL [] STERICYCLE INC DEC 1.3 1.3 1.2 1.2 1.1 37.4 40.0 45.9 44.4 47.6 NM NM NM NM NM
TTEK § TETRA TECH INC SEP 1.8 1.7 1.6 1.8 1.5 16.5 7.2 14.1 13.9 1.0 52.4 22.8 47.1 33.0 2.9ECOL US ECOLOGY INC DEC 3.3 1.5 1.3 1.8 4.2 0.0 25.7 25.5 35.6 0.0 0.0 345.6 461.7 337.0 0.0WCN † WASTE CONNECTIONS INC DEC 1.0 0.9 0.9 0.9 0.8 44.8 48.5 39.6 34.9 34.3 NM NM NM NM NMWM [] WASTE MANAGEMENT INC DEC 0.8 0.8 0.8 1.0 1.0 55.7 52.5 53.4 52.3 51.0 NM NM NM NM NM
WATER UTILITIES‡AWR § AMERICAN STATES WATER CO DEC 1.9 2.0 1.6 1.1 1.0 33.3 35.7 38.7 38.4 40.1 359.5 368.0 555.9 NM NMWTR † AQUA AMERICA INC DEC 0.6 1.0 0.8 0.7 0.6 37.9 42.3 43.0 48.1 47.7 NM NM NM NM NM
OTHER COMPANIES WITH SIGNIFICANT WASTE MANAGEMENT OPERATIONSCWST CASELLA WASTE SYS INC -CL A # APR 0.8 0.7 0.8 0.9 0.9 100.3 97.1 95.6 82.3 90.9 NM NM NM NM NM
OTHER COMPANIES WITH SIGNIFICANT ENVIRONMENTAL SERVICES OPERATIONSCCC § CALGON CARBON CORP DEC 3.4 2.4 2.4 2.6 3.6 6.7 10.9 0.3 1.1 0.0 16.1 28.2 0.7 2.2 0.0TTI § TETRA TECHNOLOGIES INC/DE DEC 2.2 1.7 2.3 1.9 1.6 40.3 35.8 34.6 35.1 32.9 193.0 185.8 103.0 154.0 209.1VE VEOLIA ENVIRONNEMENT -ADR DEC 1.2 1.2 1.1 1.1 1.1 53.6 64.7 70.3 69.2 70.3 349.2 389.9 736.5 775.9 688.1
OTHER COMPANIES WITH SIGNIFICANT WATER UTILITY OPERATIONSAWK AMERICAN WATER WORKS CO INC DEC 0.4 0.5 0.9 0.7 0.8 44.3 46.7 49.1 50.8 52.1 NM NM NM NM NMCWT CALIFORNIA WATER SERVICE GP DEC 0.8 0.6 0.7 1.2 0.8 35.2 40.6 45.9 46.8 42.1 NM NM NM NM NM
Note: Data as originally reported. ‡S&P 1500 index group. []Company included in the S&P 500. †Company included in the S&P MidCap 400. §Company included in the S&P SmallCap 600. #Of the follow ing calendar year.

INDUSTRY SURVEYS ENVIRONMENTAL & WASTE MANAGEMENT / OCTOBER 2014 49
Price / Earnings Ratio (High-Low) Dividend Payout Ratio (%) Dividend Yield (High-Low, %)
Ticker Company Yr. End 2013 2012 2011 2010 2009 2013 2012 2011 2010 2009
ENVIRONMENTAL & FACILITIES SERVICES‡ABM § ABM INDUSTRIES INC OCT 22 - 15 21 - 15 21 - 13 22 - 15 22 - 11 45 50 43 44 48 3.0 - 2.1 3.2 - 2.4 3.2 - 2.1 2.9 - 2.0 4.5 - 2.2CLH † CLEAN HARBORS INC DEC 41 - 31 30 - 19 27 - 17 18 - 11 46 - 29 0 0 0 0 0 0.0 - 0.0 0.0 - 0.0 0.0 - 0.0 0.0 - 0.0 0.0 - 0.0RSG [] REPUBLIC SERVICES INC DEC 22 - 18 20 - 16 21 - 16 25 - 19 23 - 12 61 58 54 59 58 3.4 - 2.8 3.6 - 2.9 3.4 - 2.5 3.1 - 2.4 5.0 - 2.5ROL † ROLLINS INC DEC 36 - 27 32 - 25 34 - 24 33 - 20 24 - 17 54 58 41 39 33 2.0 - 1.5 2.3 - 1.8 1.7 - 1.2 2.0 - 1.2 2.0 - 1.4SRCL [] STERICYCLE INC DEC 34 - 26 31 - 24 35 - 27 34 - 21 28 - 21 0 0 0 0 0 0.0 - 0.0 0.0 - 0.0 0.0 - 0.0 0.0 - 0.0 0.0 - 0.0
TTEK § TETRA TECH INC SEP NM- NM 17 - 13 18 - 12 23 - 14 22 - 14 NM 0 0 0 0 0.0 - 0.0 0.0 - 0.0 0.0 - 0.0 0.0 - 0.0 0.0 - 0.0ECOL US ECOLOGY INC DEC 23 - 13 18 - 12 19 - 15 26 - 19 28 - 18 31 64 71 104 94 2.4 - 1.4 5.4 - 3.6 4.9 - 3.8 5.5 - 4.1 5.3 - 3.4WCN † WASTE CONNECTIONS INC DEC 29 - 21 26 - 22 24 - 18 24 - 17 25 - 15 26 28 21 4 0 1.2 - 0.9 1.3 - 1.1 1.2 - 0.9 0.2 - 0.2 0.0 - 0.0WM [] WASTE MANAGEMENT INC DEC NM- NM 21 - 18 19 - 14 19 - 16 17 - 11 695 81 66 64 57 4.3 - 3.1 4.6 - 3.9 4.9 - 3.4 4.1 - 3.4 5.2 - 3.4
WATER UTILITIES‡AWR § AMERICAN STATES WATER CO DEC 21 - 15 17 - 12 16 - 14 24 - 19 24 - 18 47 45 49 62 62 3.2 - 2.3 3.7 - 2.6 3.6 - 3.0 3.3 - 2.6 3.4 - 2.6WTR † AQUA AMERICA INC DEC 24 - 18 20 - 16 23 - 18 25 - 18 28 - 20 50 51 60 65 71 2.8 - 2.1 3.2 - 2.5 3.3 - 2.6 3.6 - 2.6 3.6 - 2.6
OTHER COMPANIES WITH SIGNIFICANT WASTE MANAGEMENT OPERATIONSCWST CASELLA WASTE SYS INC -CL A # APR NM- NM NM- NM NM- NM NM- NM NM- NM NM NM NM NM NM 0.0 - 0.0 0.0 - 0.0 0.0 - 0.0 0.0 - 0.0 0.0 - 0.0
OTHER COMPANIES WITH SIGNIFICANT ENVIRONMENTAL SERVICES OPERATIONSCCC § CALGON CARBON CORP DEC 25 - 17 42 - 28 26 - 19 30 - 19 27 - 15 0 0 0 0 0 0.0 - 0.0 0.0 - 0.0 0.0 - 0.0 0.0 - 0.0 0.0 - 0.0TTI § TETRA TECHNOLOGIES INC/DE DEC NM- NM 51 - 25 NM- NM NM- NM 13 - 2 NM 0 0 NM 0 0.0 - 0.0 0.0 - 0.0 0.0 - 0.0 0.0 - 0.0 0.0 - 0.0VE VEOLIA ENVIRONNEMENT -ADR DEC NM- NM NM- NM NM- NM 22 - 14 21 - 10 NM NM NM 87 88 8.5 - 5.0 9.5 - 5.2 17.1 - 5.1 6.3 - 3.9 8.8 - 4.2
OTHER COMPANIES WITH SIGNIFICANT WATER UTILITY OPERATIONSAWK AMERICAN WATER WORKS CO INC DEC 22 - 18 19 - 15 19 - 14 17 - 13 NM- NM 40 57 64 56 NM 2.3 - 1.9 3.9 - 3.1 4.4 - 3.4 4.4 - 3.3 5.1 - 3.6CWT CALIFORNIA WATER SERVICE GP DEC 23 - 18 16 - 14 22 - 19 22 - 19 25 - 17 63 54 68 66 61 3.5 - 2.7 3.7 - 3.3 3.7 - 3.2 3.5 - 3.0 3.5 - 2.4
Note: Data as originally reported. ‡S&P 1500 index group. []Company included in the S&P 500. †Company included in the S&P MidCap 400. §Company included in the S&P SmallCap 600. #Of the follow ing calendar year.
20092013 2012 2011 2010

50 ENVIRONMENTAL & WASTE MANAGEMENT / OCTOBER 2014 INDUSTRY SURVEYS
Earnings per Share ($) Tangible Book Value per Share ($) Share Price (High-Low, $)
Ticker Company Yr. End 2013 2012 2011 2010 2009 2013 2012 2011 2010 2009 2013 2012 2011 2010 2009
ENVIRONMENTAL & FACILITIES SERVICES‡ABM § ABM INDUSTRIES INC OCT 1.33 1.16 1.29 1.23 1.08 (1.79) (0.19) (1.57) 1.51 1.54 29.20 - 20.04 24.61 - 17.85 27.14 - 17.29 26.95 - 18.56 23.32 - 11.64CLH † CLEAN HARBORS INC DEC 1.58 2.41 2.40 2.42 0.71 5.52 4.40 12.01 11.49 8.45 64.12 - 48.22 71.63 - 46.94 64.68 - 40.28 43.13 - 26.00 32.59 - 20.45RSG [] REPUBLIC SERVICES INC DEC 1.63 1.56 1.57 1.32 1.30 (8.70) (9.26) (9.12) (8.50) (9.46) 35.61 - 29.34 31.32 - 25.15 33.10 - 24.72 32.95 - 25.15 29.82 - 15.05ROL † ROLLINS INC DEC 0.84 0.76 0.69 0.61 0.56 0.67 0.00 (0.17) (0.41) (0.48) 30.63 - 22.34 24.41 - 19.30 23.74 - 16.51 20.18 - 12.23 13.23 - 9.33SRCL [] STERICYCLE INC DEC 3.62 3.14 2.75 2.44 2.07 (14.05) (13.85) (14.90) (10.82) (9.65) 121.61 - 93.19 96.00 - 75.75 95.71 - 73.05 82.16 - 50.62 58.34 - 44.36
TTEK § TETRA TECH INC SEP (0.03) 1.65 1.45 1.25 1.45 2.93 4.84 3.27 4.98 4.78 31.49 - 22.21 28.00 - 21.42 25.50 - 17.31 28.18 - 18.00 32.00 - 19.83ECOL US ECOLOGY INC DEC 1.73 1.41 1.01 0.69 0.77 8.04 2.63 2.18 1.71 5.15 39.77 - 22.50 25.05 - 16.52 19.00 - 14.82 17.67 - 12.98 21.21 - 13.56WCN † WASTE CONNECTIONS INC DEC 1.58 1.31 1.47 1.17 0.92 (1.29) (2.44) (1.55) 0.50 0.79 46.49 - 33.26 33.94 - 28.70 35.95 - 26.99 27.79 - 20.46 22.67 - 13.68WM [] WASTE MANAGEMENT INC DEC 0.21 1.76 2.05 1.98 2.02 (1.92) (0.72) (1.31) 0.50 0.85 46.38 - 33.70 36.35 - 30.82 39.69 - 27.75 37.25 - 31.11 34.18 - 22.10
WATER UTILITIES‡AWR § AMERICAN STATES WATER CO DEC 1.61 1.41 1.12 0.83 0.81 12.34 11.40 10.40 9.56 8.98 33.08 - 24.00 24.07 - 17.03 18.23 - 15.27 19.81 - 15.60 19.40 - 14.88WTR † AQUA AMERICA INC DEC 1.16 1.06 0.84 0.73 0.62 8.52 7.75 7.06 6.58 6.25 28.12 - 20.59 21.54 - 16.85 19.03 - 15.42 18.38 - 13.16 17.20 - 12.31
OTHER COMPANIES WITH SIGNIFICANT WASTE MANAGEMENT OPERATIONSCWST CASELLA WASTE SYS INC -CL A # APR (0.58) (1.46) (2.93) (0.14) (0.59) (3.52) (2.93) (3.27) (0.36) (3.03) 6.20 - 3.81 7.15 - 3.76 8.29 - 4.50 7.25 - 3.20 4.75 - 0.53
OTHER COMPANIES WITH SIGNIFICANT ENVIRONMENTAL SERVICES OPERATIONSCCC § CALGON CARBON CORP DEC 0.85 0.41 0.70 0.62 0.72 7.54 6.33 6.09 5.50 4.96 21.00 - 14.20 17.25 - 11.54 18.20 - 13.00 18.35 - 11.75 19.31 - 10.93TTI § TETRA TECHNOLOGIES INC/DE DEC 0.00 0.21 0.05 (0.57) 0.92 4.25 4.16 5.37 5.30 6.15 13.41 - 7.72 10.66 - 5.35 16.00 - 6.77 14.64 - 8.00 11.62 - 1.94VE VEOLIA ENVIRONNEMENT -ADR DEC (0.44) 0.03 (1.26) 1.67 1.91 4.90 (8.58) (11.90) (12.44) (12.65) 18.80 - 10.98 17.17 - 9.37 33.86 - 10.15 37.15 - 23.13 40.00 - 19.14
OTHER COMPANIES WITH SIGNIFICANT WATER UTILITY OPERATIONSAWK AMERICAN WATER WORKS CO INC DEC 2.08 2.12 1.74 1.53 (1.39) 19.73 18.28 17.31 16.44 15.75 45.09 - 36.96 39.38 - 31.25 32.78 - 25.17 25.82 - 19.41 23.03 - 16.22CWT CALIFORNIA WATER SERVICE GP DEC 1.02 1.17 0.90 0.90 0.98 12.23 10.91 10.39 10.08 9.72 23.42 - 18.42 19.25 - 16.84 19.37 - 16.65 19.85 - 16.91 24.14 - 16.75
Note: Data as originally reported. ‡S&P 1500 index group. []Company included in the S&P 500. †Company included in the S&P MidCap 400. §Company included in the S&P SmallCap 600. #Of the follow ing calendar year. J-This amount includes intangibles that cannot be identif ied.
The analysis and opinion set forth in this publication are provided by S&P Capital IQ Equity Research and are prepared separately from any other analytic activity of Standard & Poor’s.
In this regard, S&P Capital IQ Equity Research has no access to nonpublic information received by other units of Standard & Poor’s.
The accuracy and completeness of information obtained from third-party sources, and the opinions based on such information, are not guaranteed.

INDUSTRY SURVEYS ENVIRONMENTAL & WASTE MANAGEMENT / OCTOBER 2014 51
General Disclaimers S&P Capital IQ’s Industry Surveys Reports (the “Industry Surveys”) have been prepared and issued by S&P Capital IQ and/or one of its affiliates. In the United States and United Kingdom, the Industry Surveys are prepared and issued by Standard & Poor’s Financial Services LLC; in Hong Kong, by Standard & Poor’s Investment Advisory Services (HK) Limited, which is regulated by the Hong Kong Securities Futures Commission; in Singapore, by McGraw Hill Financial Singapore Pte. Limited, which is regulated by the Monetary Authority of Singapore; in Malaysia, by Standard & Poor’s Malaysia Sdn Bhd, which is regulated by the Securities Commission of Malaysia; in Australia, by Standard & Poor’s Information Services (Australia) Pty Ltd, which is regulated by the Australian Securities & Investments Commission; and in Japan, by McGraw Hill Financial Japan KK, which is registered by Kanto Financial Bureau. No content (including ratings, credit-related analyses and data, valuations, model, software or other application or output therefrom) or any part thereof (Content) may be modified, reverse engineered, reproduced or distributed in any form by any means, or stored in a database or retrieval system, without the prior written permission of Standard & Poor’s Financial Services LLC or its affiliates (collectively, S&P). The Content shall not be used for any unlawful or unauthorized purposes. S&P and any third-party providers, as well as their directors, officers, shareholders, employees or agents (collectively S&P Parties) do not guarantee the accuracy, completeness, timeliness or availability of the Content. S&P Parties are not responsible for any errors or omissions (negligent or otherwise), regardless of the cause, for the results obtained from the use of the Content, or for the security or maintenance of any data input by the user. The Content is provided on an “as is” basis. S&P PARTIES DISCLAIM ANY AND ALL EXPRESS OR IMPLIED WARRANTIES, INCLUDING, BUT NOT LIMITED TO, ANY WARRANTIES OF MERCHANTABILITY OR FITNESS FOR A PARTICULAR PURPOSE OR USE, FREEDOM FROM BUGS, SOFTWARE ERRORS OR DEFECTS, THAT THE CONTENT’S FUNCTIONING WILL BE UNINTERRUPTED OR THAT THE CONTENT WILL OPERATE WITH ANY SOFTWARE OR HARDWARE CONFIGURATION. In no event shall S&P Parties be liable to any party for any direct, indirect, incidental, exemplary, compensatory, punitive, special or consequential damages, costs, expenses, legal fees, or losses (including, without limitation, lost income or lost profits and opportunity costs or losses caused by negligence) in connection with any use of the Content even if advised of the possibility of such damages. Credit-related and other analyses, including ratings, and statements in the Content are statements of opinion as of the date they are expressed and not statements of fact. S&P’s opinions, analyses and rating acknowledgment decisions (described below) are not recommendations to purchase, hold, or sell any securities or to make any investment decisions, and do not address the suitability of any security. S&P assumes no obligation to update the Content following publication in any form or format. The Content should not be relied on and is not a substitute for the skill, judgment and experience of the user, its management, employees, advisers and/or clients when making investment and other business decisions. S&P does not act as a fiduciary or an investment adviser except where registered as such. While S&P has obtained information from sources it believes to be reliable, S&P does not perform an audit and undertakes no duty of due diligence or independent verification of any information it receives. S&P keeps certain activities of its business units separate from each other in order to preserve the independence and objectivity of their respective activities. As a result, certain business units of S&P may have information that is not available to other S&P business units. S&P has established policies and procedures to maintain the confidentiality of certain non-public information received in connection with each analytical process. S&P provides a wide range of services to, or relating to, many organizations, including issuers or underwriters of securities or obligors, investment advisers, broker-dealers, investment banks, other financial institutions and financial intermediaries. As a result, S&P may receive fees or other economic benefits from organizations whose securities or services it may recommend, analyze, rate, include in model portfolios, evaluate, price or otherwise address. The Industry Surveys are not intended to be investment advice and do not constitute any form of invitation or inducement by S&P Capital IQ to engage in investment activity. This material is not intended as an offer or solicitation for the purchase or sale of any security or other financial instrument. Any opinions expressed herein are given in good faith, are subject to change without notice, and are only current as of the stated date of their issue. Past performance is not necessarily indicative of future results. For details on the S&P Capital IQ conflict-of-interest policies, please visit: www.spcapitaliq.com/Policies
Notice to all Non U.S. Residents: S&P Capital IQ’s Industry Surveys may be distributed in certain localities, countries and/or jurisdictions (“Territories”) by independent third parties or independent intermediaries and/or distributors (the “Intermediaries” or “Distributors”). Intermediaries are not acting as agents or representatives of S&P Capital IQ. In Territories where an Intermediary distributes S&P Capital IQ’s Industry Surveys, the Intermediary, and not S&P Capital IQ, is solely responsible for complying with all applicable regulations, laws, rules, circulars, codes and guidelines established by local and/or regional regulatory authorities, including laws in connection with the distribution of third-party investment research, licensing requirements, supervisory and record keeping obligations that the Intermediary may have under the applicable laws and regulations of the territories where it distributes the Industry Surveys. Industry Surveys are not directed to, or intended for distribution to or use by, any person or entity who is a citizen or resident of or located in any locality, state, country or other jurisdiction where such distribution, publication, availability or use would be contrary to law or regulation or which would subject S&P Capital IQ or its affiliates to any registration or licensing requirements in such jurisdiction. Industry Surveys are not directed to, or intended for distribution to or use by, any person or entity who is not in a class qualified to receive Industry Surveys (e.g., a qualified person and/or investor), as defined by the local laws or regulations in the country or jurisdiction where the person is domiciled, a citizen or resident of, or the entity is legally registered or domiciled. S&P Capital IQ’s Industry Surveys are not intended for distribution in or directed to entities, residents or investors in: Albania, Belarus, Bosnia, Burma, Cote d’Ivoire, Croatia, Cuba, Democratic Republic of the Congo, Former Yugoslav Republic of Macedonia, Herzegovina, Iran, Iraq, Kosovo, Lebanon, Libya, Montenegro and Serbia, North Korea, Somali, Sudan, Syria, Taiwan, Yemen and Zimbabwe. For residents of Australia: Industry Surveys are issued and/or distributed in Australia by SPIS. Any express or implied opinion contained in an Industry Survey is limited to “General Advice” and based solely on consideration of the investment merits of the financial product(s) alone. The information in an Industry Survey has not been prepared for use by retail investors and has been prepared without taking account of any particular investor’s financial or investment objectives, financial situation or needs. Before acting on any advice, any investor using the advice should consider its appropriateness having regard to their own or their clients’ objectives, financial situation and needs. Investors should obtain a Product Disclosure Statement relating to the product and consider the statement before making any decision or recommendation about whether to acquire the product. Each opinion must be weighed solely as one factor in any investment decision made by or on behalf of any adviser and any such adviser must accordingly make their own assessment taking into account an individual’s particular circumstances. SPIS holds an Australian Financial Services License Number 258896. Please refer to the SPIS Financial Services Guide for more information at: www.spcapitaliq.com/FinancialServicesGuide For residents of China: Industry Surveys are not distributed in or directed to residents in The People’s Republic of China. Neither S&P Capital IQ nor its affiliates target investors in China. For residents of Kuwait: The Distributor, and not S&P Capital IQ, is responsible for complying with all relevant licensing requirements as set forth by the Kuwait Capital Markets Law (“CML”) and Kuwait Capital Markets Authority (“CMA”) and with all relevant rules and regulations set out in the CML and CMA rule books. For residents of Malaysia: All queries in relation to Industry Surveys should be referred to Ahmad Halim at [email protected]. For residents of Mexico: S&P Capital IQ is not regulated or supervised by the Mexican National Banking and Securities Commission (“CNBV”). S&P Capital IQ has a licensed rating agency affiliate in Mexico (Standard & Poor’s, S.A. De C.V.), of which S&P maintains firewalls and seeks to avoid conflicts of interest, pursuant to approved policies. For residents of Qatar: The Distributor, and not S&P Capital IQ, is responsible for complying with all relevant licensing requirements as set forth by the Qatar Financial Markets Authority or the Qatar Central Bank, and with all relevant rules and regulations set out in the Qatar Financial Markets Authority’s rule book, including third party branded investment research distribution of securities that are admitted for trading on a Qatari securities exchange (Admitted Securities). Copyright © 2014 Standard & Poor’s Financial Services LLC. All rights reserved. STANDARD & POOR’S, S&P, S&P 500, S&P EUROPE 350 and STARS are registered trademarks of Standard & Poor’s Financial Services LLC. S&P CAPITAL IQ is a trademark of Standard & Poor’s Financial Services LLC.