ex post evaluation of ec merger decisions: two … · ex post evaluation of ec merger decisions:...
TRANSCRIPT
COLLEGE OF EUROPE
BRUGES CAMPUS
ECONOMICS DEPARTMENT
Ex post evaluation of EC merger decisions:
two empirical analysis of prices and patents
Supervisor
Mike Walker
Thesis presented by
Luca DEPLANO
for the
Degree of Master of Arts in European Economic Studies
Option: European Law and Economic Analysis
Academic Year: 2016 – 2017

Statutory Declaration
“I hereby declare that the thesis has been written by myself without
any external unauthorised help, that it has been neither presented to
any institution for evaluation nor previously published in its entirety or
in parts. Any parts, words or ideas, of the thesis, however limited, and
including tables, graphs, maps etc. which are quoted from or based on
other sources have been acknowledged as such without exception.
Moreover, I have also taken note and accepted the College rules with
regard to plagiarism (Section 4.2 of the College study regulations).”
Abstract
The objective of this thesis is to analyse the impact on prices and
patents of two mergers that were cleared by the European
Commission in the energy and in the pharmaceuticals sectors. The
literature review finds that ex post evaluation of mergers is a popular
tool for competition authorities, used all over the world in order to
obtain useful information to ensure proper competition policy
enforcement. Innovation has been taken into account more and more
often in the Commission assessment of mergers, but there is still a lot
of potential for research. This empirical analysis is developed two-fold
and is conducted based on two databases: the first dataset of
variables is related to the energy sector prices from 1999 to 2015;
whereas the second dataset of variables is based on the
pharmaceuticals sector patents from 1995 to 2013. The empirical
results obtained by the estimation of Difference-in-Differences models
suggest that the Commission decisions were correct and that the
impact on the markets and innovation was positive. In the
DONG/ELSAM/Energi E2 case, prices decrease both in the consumer
and industrial end users scenario. In the Sanofi-Synthélabo/Aventis
case the number of patents applications increases both in the long and
short time frame, and are confirmed by the placebo tests performed.
Word Count:
12.934

Keywords:
Ex-post evaluation, M&A, Prices, Innovation, Energy and Pharma

Table of Contents
1. Introduction ......................................................................................................... 1
2. Review of the existing literature .......................................................................... 4
2.1. Ex-post evaluation of mergers...................................................................... 4
2.2. Merger control in the energy sector .............................................................. 8
2.3. Innovation, Antitrust and merger control .................................................... 10
2.4. Merger control and innovation, a focus on previous decision and on the
pharmaceuticals sector ..................................................................................... 14
3. Descriptive statistics and case study summary of the merger DONG/Elsam/E2
............................................................................................................................. 17
3.1. Review of the case ..................................................................................... 17
3.2. Data and descriptive analysis .................................................................... 19
3.2.1. Dependent Variable ............................................................................. 20
3.2.2. Control Variables ................................................................................. 21
4. Model, methodology and results for the merger DONG/Elsam/E2 ................... 23
4.1 Model Choice .............................................................................................. 23
4.2 Control group choice ................................................................................... 24
4.3 Treatment period choice ............................................................................. 25
4.4 Estimation of the Model ............................................................................... 25
4.4.1 Consumers Model estimation ............................................................... 25
4.4.2 Industrial end users Model Estimation .................................................. 27
4.4.3 Results .................................................................................................. 28
5. Descriptive statistics and case study summary of the merger SANOFI-
SYNTHELABO/ AVENTIS .................................................................................... 29
5.1. Review of the case ..................................................................................... 29
5.2. Data and Descriptive Analysis.................................................................... 31

5.2.1. Dependent Variable ............................................................................. 32
5.2.2. Independent Variables ......................................................................... 34
6. Model, methodology and results of the merger SANOFI-SYNTHELABO/
AVENTIS .............................................................................................................. 37
6.1. Choice of the model ................................................................................... 37
6.2. Control group choice .................................................................................. 38
6.3. Treatment period choice ............................................................................ 39
6.4. Estimation of the model .............................................................................. 40
6.4.1. Model ................................................................................................... 41
6.5. Results ....................................................................................................... 42
7. Conclusions ...................................................................................................... 44
Bibliography .......................................................................................................... 46
Annexes ............................................................................................................... 51
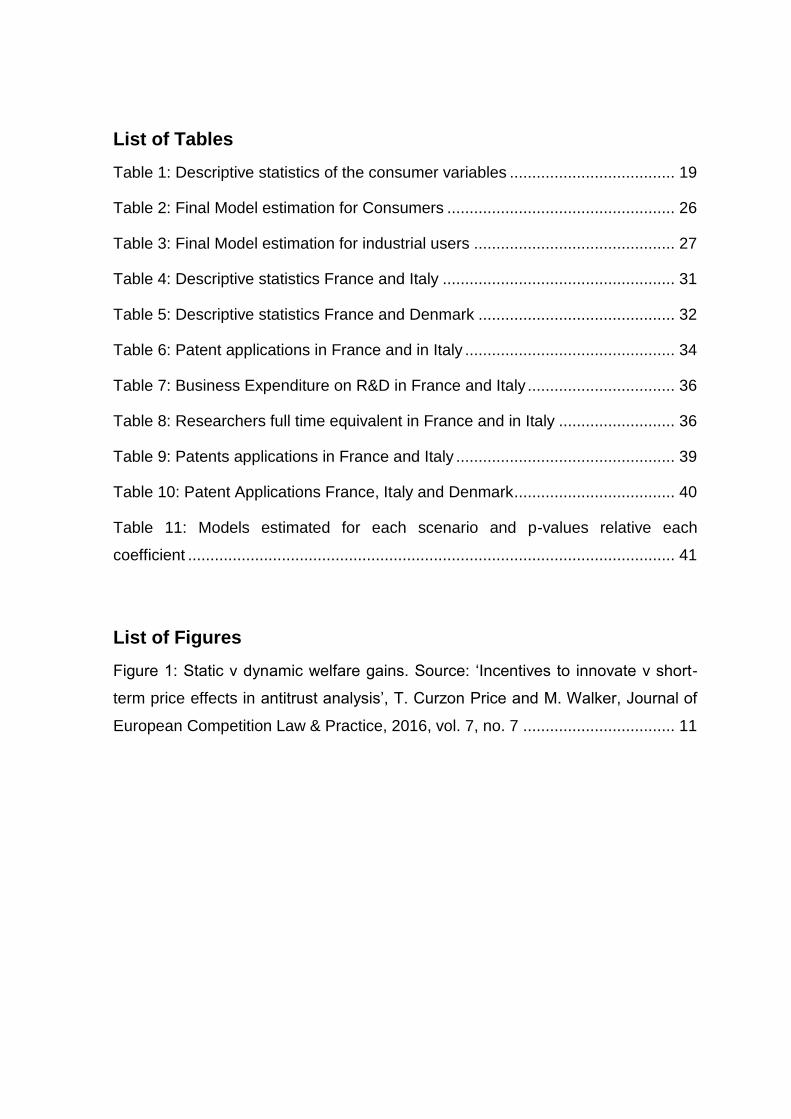
List of Tables
Table 1: Descriptive statistics of the consumer variables ..................................... 19
Table 2: Final Model estimation for Consumers ................................................... 26
Table 3: Final Model estimation for industrial users ............................................. 27
Table 4: Descriptive statistics France and Italy .................................................... 31
Table 5: Descriptive statistics France and Denmark ............................................ 32
Table 6: Patent applications in France and in Italy ............................................... 34
Table 7: Business Expenditure on R&D in France and Italy ................................. 36
Table 8: Researchers full time equivalent in France and in Italy .......................... 36
Table 9: Patents applications in France and Italy ................................................. 39
Table 10: Patent Applications France, Italy and Denmark .................................... 40
Table 11: Models estimated for each scenario and p-values relative each
coefficient ............................................................................................................. 41
List of Figures
Figure 1: Static v dynamic welfare gains. Source: ‘Incentives to innovate v short-
term price effects in antitrust analysis’, T. Curzon Price and M. Walker, Journal of
European Competition Law & Practice, 2016, vol. 7, no. 7 .................................. 11

1
1. Introduction
The aim of competition authorities all over the world is that of making sure that
undertakings compete in a fair way. In order to prevent competition to be
hampered, those authorities often make use of counterfactual analysis so that
future possible outcomes can be forecast. Nevertheless, it is less popular among
those competition authorities to perform an ex-post analysis of what really
happened to the competitive environment after the decision (Pires, 2015). The
latter activity is a crucial part in the understanding of whether competition policy
rules and those methodologies applied by competition authorities are in fact
successful. This kind of analysis can give an input to correct those. It would be
therefore possible to understand whether the guidelines and rules applied are
excessively strong or weak (Hosken, 2011; Kwoka, 2013).
The ex post analysis of past decisions can give a much clearer idea of to what
extent a judgement was correct since the use of parametric assumptions of
structural models would not be required at this stage (Nevo, 2000). Many more
effects generated by the merger would finally be noticed thanks to these analyses
ex post that were not expressed by the counterfactual analysis ex ante. Thanks to
the abundance of data it is possible to study the effects of mergers in an empirical
way rather than by simple sector interviews, getting a glimpse of the effect
especially over prices (Farrell et al., 2009). Retrospective merger analysis should
therefore be used to evaluate the capability to assess a merger and to estimate if
a concentration would drive up prices and have an effect on other factors such as
innovation.
This thesis work is developed two-fold. The first part of this paper concerns the ex-
post evaluation of prices after a merger in the energy sector, the most common
variable of analysis across all competition authorities. A healthy and competitive
energy sector is crucial for the welfare of society. Energy is crucial for the life of
consumers and undertakings of all sorts. Therefore great attention should be paid
to it in order to achieve a more competitive EU across all industries. Nevertheless
certain industries such as electricity and gas have structural network
characteristics that may allow the key players to abuse of a dominant position in

2
the market, hampering competition and increasing prices. This would constitute
damage to consumer welfare and to all industries.
Over the past two decades we have been able to notice that three major structural
reforms have shaped the energy market all over Europe. This regulatory driver
was not sufficient to tackle competitive concerns in all the industry. Some parts of
the markets are by their nature better off under a monopolistic ownership and
coexist with other sectors that have been opened to competition. Several
indicators show that the market may not have been completely freed from
competition constraints since prices growth, few cases of new players entering the
market, great market shares and a low confidence by the consumers (Wilkinson,
Duso et aliud, 2015). Apart from regulatory intervention, the European Union has
also focused its efforts to tackle issues in the market through competition policy
and merger control.
Concerning concentration in energy markets in the European Union, Merger
control put in place by the Commission has been a central actor in fostering a
more competitive environment in this market. These are for example the cases of
GDF/Suez (2008), which created concerns in the Belgian wholesale market, and
Electricité de France S.A. (EdF)/British Energy (2008), which would have
potentially reduced liquidity and demand foreclosure in the British market. The
Commission (2015) performed an ex post analysis of GDF/SUEZ concentration
finding that the decision affected the European Energy Exchange reducing
electricity prices in Germany. Several mergers were cleared with the use of
remedies such as in the case of DONG/Elsam/E2 which will be further analysed in
this study and was approved after a phase two investigation. Nevertheless the
Commission has also prohibited some concentrations which would have
hampered competition and for whom the remedies provided by the parties
involved didn’t seem to be enough to stem a clearing. This is for example the case
of EDP/ENI/GDP.
The second part of this study is related to the analysis of innovation through the ex
post evaluation of patenting activity in France in the pharmaceutical sector after a
merger cleared by the Commission with remedies. Ex post evaluation of dynamic
aspects of the market and of patents is crucial to foster the competitiveness of our

3
economy, which is more and more based on the added value provided by
technological innovations. It is therefore essential to focus economists’ attention
on innovation, which has become an important variable in the assessment of
mergers by the European Commission and a main driver in the creation of growth,
jobs and investments (Competition policy brief, 2016).
It seems that the Commission has started to take more into account the
importance of innovation and of dynamic efficiencies during its assessment. The
legal framework in place is able to capture those aspects of the analysis related to
innovation. The later has been demonstrated by a growing number of cases in
which the Commission has mentioned and tried to deal with innovation. This is the
case for example of Medtronic/Covidien, Novartis/GlaxoSmithKline's,
Pfizer/Hospira, General Electric/Alstom, Deutsche Börse AG v European
Commission, Intel/McAfee, ARM/Giesecke & Devrient/ Gemalto Joint Venture,
Intel/Altera. Among the cases in which innovation efficiencies were claimed by the
parties TomTom/TeleAtlas was one of those in which the efficiencies were partly
recognized. It would nevertheless seem from the opinions of several authors that
there is still space for improvement and that economics could provide better
guidance to policymakers in this area (Curzon Price and Walker, 2016).
This thesis is organized as follows. Section 2 presents the theoretical and
methodological basis of the research. Section 3 provides and introduction to the
DONG/ELSAM/E2 case as well as the description of the data used for the purpose
of this study. Section 4 summarizes the empirical results and model estimated in
relation to gas prices for consumers and industrial end users. Section 5 focuses on
the SANOFI-SYNTHÈLABO/AVENTIS merger and provides both an analysis of it
and an explanation of the dataset used for the purpose of its analysis. Section 6
summarizes the empirical results and model estimated on patents. Finally section
7 presents the conclusions to this thesis work.
4
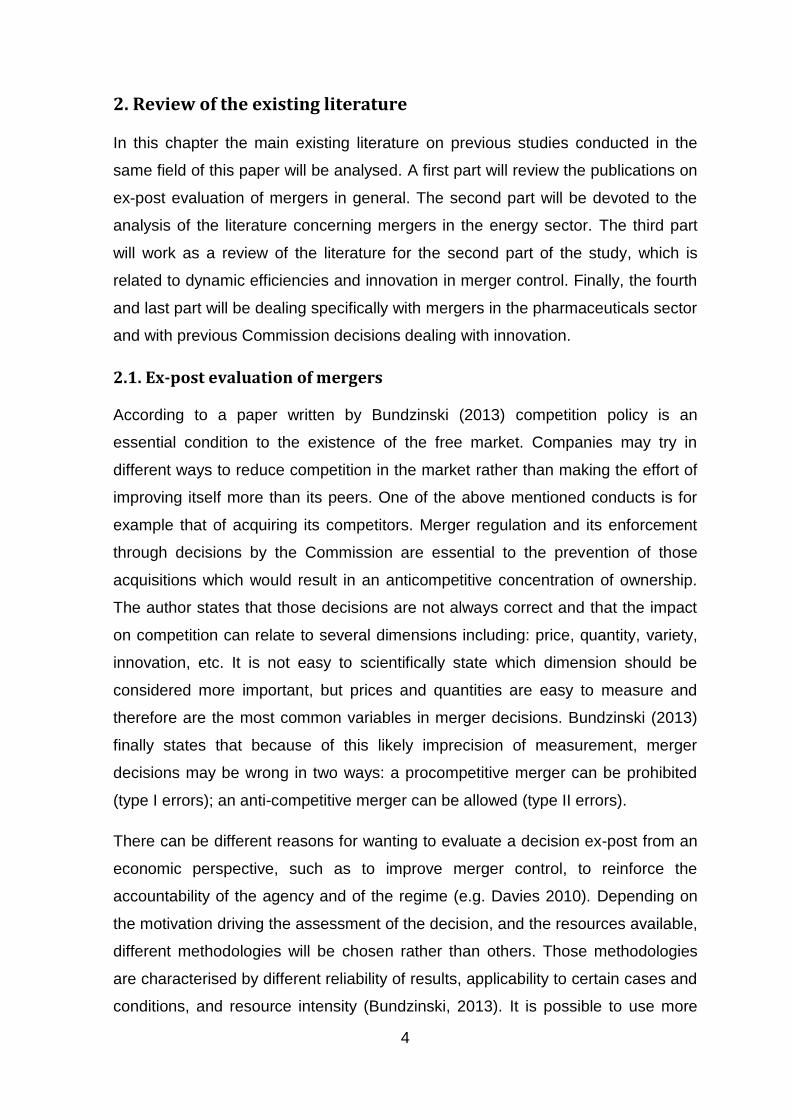
2. Review of the existing literature
In this chapter the main existing literature on previous studies conducted in the
same field of this paper will be analysed. A first part will review the publications on
ex-post evaluation of mergers in general. The second part will be devoted to the
analysis of the literature concerning mergers in the energy sector. The third part
will work as a review of the literature for the second part of the study, which is
related to dynamic efficiencies and innovation in merger control. Finally, the fourth
and last part will be dealing specifically with mergers in the pharmaceuticals sector
and with previous Commission decisions dealing with innovation.
2.1. Ex-post evaluation of mergers
According to a paper written by Bundzinski (2013) competition policy is an
essential condition to the existence of the free market. Companies may try in
different ways to reduce competition in the market rather than making the effort of
improving itself more than its peers. One of the above mentioned conducts is for
example that of acquiring its competitors. Merger regulation and its enforcement
through decisions by the Commission are essential to the prevention of those
acquisitions which would result in an anticompetitive concentration of ownership.
The author states that those decisions are not always correct and that the impact
on competition can relate to several dimensions including: price, quantity, variety,
innovation, etc. It is not easy to scientifically state which dimension should be
considered more important, but prices and quantities are easy to measure and
therefore are the most common variables in merger decisions. Bundzinski (2013)
finally states that because of this likely imprecision of measurement, merger
decisions may be wrong in two ways: a procompetitive merger can be prohibited
(type I errors); an anti-competitive merger can be allowed (type II errors).
There can be different reasons for wanting to evaluate a decision ex-post from an
economic perspective, such as to improve merger control, to reinforce the
accountability of the agency and of the regime (e.g. Davies 2010). Depending on
the motivation driving the assessment of the decision, and the resources available,
different methodologies will be chosen rather than others. Those methodologies
are characterised by different reliability of results, applicability to certain cases and
conditions, and resource intensity (Bundzinski, 2013). It is possible to use more

5
than one evaluation technique in order to improve the reliability of the results
(Buccirossi et alia, 2008). Therefore, the most popular methods that can be used
are: structural models and simulations, difference-in-differences (DiD) approaches,
event studies, surveys, and case studies.
Concerning Merger Simulation Models, according to (Bundzinski, 2010), an ex-
post analysis is key to understanding whether the ex-ante tool was indeed correct.
Nevertheless few ex post studies of this kind have been produced and the results
were mixed. During a policy roundtable of the OECD (2011) in which 19 countries1
deposited a written report, the conclusions were that structural models were the
most developed tool available but that some limitations needed to be taken into
account. For example those models are based on different oligopoly models (e.g.
Cournot and Bertrand) and are bound to those; so only cases which respect the
assumptions can be represented correctly by the simulation. Moreover, even if
they can’t reproduce the market perfectly, they require a great amount of data and
econometrics knowledge.
Always according to the outcomes of the OECD roundtable (2011), the difference-
in-difference methodology requires an appropriate identification of the right
counterfactual market/scenario. The market should be similar to the treated one
but at the same not affected by the treatment (Bergman, 2008). Less data and
econometric skills is required for the Difference in Difference tool since the model
is less based on economic theories (Bundzinski, 2013). The most difficult part is
usually the identification of the right control market, which is not always reliable
and applicable to all the cases (Davies, 2010). Finally, in the case of those
mergers that were not prohibited in the past, this methodology is not suitable for
an ex post evaluation (Bundzinski, 2013). This model is the one which is chosen
for the purpose of the empirical analysis that will follow in this study.
Concerning event studies, those are less limited by data constraints since the
methodology uses information on stock prices variations which is easier to obtain
(Ellert, 1976). Nevertheless firms should be listed companies and be present
mainly in one market that can be identified as the affected market. In addition to
1 Namely Brazil, Belgium, Canada, Chile, Estonia, EU, Greece, Hungary, Indonesia, Japan, Korea,
Netherlands, Norway, Poland, Romania, South Africa, Switzerland, UK, US.
6
those concerns, the methodology is based on the hypothesis that financial markets
are efficient, which is not an assumption met perfectly in practice (Bundzinski,
2013). Previous papers try to show how the effects of mergers are not processed
correctly by the markets and how the event study fails to provide a good prediction
(McAfee and Williams, 1988). Therefore it is not sure that those models provide
reliable results, but competition authorities still consider it a methodology that can
contribute with a useful insight (OECD, 2011).
Among more qualitative methods are surveys, which can also add useful
information for the assessment of mergers ex post (OECD, 2011). Since surveys
are based on interviews and questionnaires, it is a tool that doesn’t require a lot of
data but at the same time the results can be biased by non-precise questions and
by the assumptions this methodology is based on. Precise information should be
possessed by the interviewees and they should be able to disclose it (Bundzinski,
2013).
According to Davies and Ormosi (2010), expert case studies are, in contrast to
surveys, the review of one single expert and not the opinion of several insiders.
These studies comprise a mix of the previously described tools, being therefore
subject to the related limitations. Experts may give a biased opinion of the cases,
influenced by reasons and purposes that may not be those of producing an
objective and critical review (Bundzinski, 2013).
From the OECD roundtable meeting (2011), it was possible to notice that the DiD
approach was the most popular quantitative methodology among the 19
participating entities, followed by structural models and event studies. Surveys
were the most preferred methodologies, which constituted almost half of the
analysed sample.
This shows that ex post evaluation of merger decisions can be considered a good
way of creating information on how the rules of competition policy work and on
how to ameliorate the existing regime ex ante techniques rather than checking
previous decisions correctness. Economics could therefore play an important role
in shaping competition policy thanks to the information provided by ex post
evaluation of mergers (Baker and Shapiro, 2008).

7
The next steps that could be taken in the ex post evaluation of merger decisions
are related to a more uniform methodology with different stages of implementation
(Gavil, 2011). Ex post merger evaluation is now a practice recognized to be useful
for several reasons, the next step would be that of identifying, at an international
level, the best methodologies which constitute the ‘state of the art’, creating a
Handbook on ex post evaluation of mergers which would then serve as a
harmonization driver. Gavil (2011) states that most of the agencies wouldn’t be
able to implement the entire ex post evaluation tools set which constitutes the
‘state of the art’, requiring therefore an implementation through different stages.
These stages depend on the level of skills, experience and resources available in
each agency. The guide on the best practices would be an important document for
newly created agencies and for a homogeneous ex post evaluation of mergers
which would likely improve their future performance.
Gavil (2011) creates a list of four options which can be implemented in order to
allow for a staged implementation of ex post review. Simplified and more basic
Difference in Differences models could produce significant and useful results that
wouldn’t need extensive data and resources by less developed agencies. Event
studies could be implemented through more rudimentary models and could give
an initial idea of the effect of a merger decision, especially in the case of
companies that sell one product and are at the same time listed in the stock
market. Agencies could be able to monitor the outcome of a merger thanks to the
data collected for the purpose of a new merger ex ante evaluation in the same
sector. Other options such as using newly obtained data from new mergers in
order to assess previous ones would, on the one hand remove data and resources
constraints, but on the other force new parties to provide excessive amounts of
data. Finally, the fourth option identified consists in getting the agencies to
‘planting seeds’ for future data collection and analysis during the study of a merger
case, especially when cleared with remedies and conditions. This last possibility
would imply future reporting requirements and might not be always available.
Thanks to this staged implementation of ex post review it would be possible to
include all the agencies in the world in the process, allowing them to grow in
expertise and improve their techniques towards the so called ‘state of the art’ of ex
post evaluation of mergers. This would make sure that ex post evaluation, an

8
extremely important activity for competition policy, is implemented on a global
scale.
2.2. Merger control in the energy sector
Within the area of merger control in the energy sector, there are few authors that
provide their point of view and analysis. For example Pozzi (2004) identifies the
reasons and the impact of competition policy in the Energy sector in the United
States with the use of empirical methodologies. Thanks to the research performed
by Pozzi, some evidence is found that the profitability of the electricity sector
decreases, whereas there is no influence on the gas and oil sector. Nevertheless
there is a decrease in the margins of the downstream sector.
In a paper written by Federico (2011) the effect of mergers on the competitiveness
of energy markets was analysed. It considers the ten greatest deals that took
place in the European Union and in Spain from 2004 to 2011. The research finds
that the major concern of the competition authorities in the energy market has
been directed towards possible horizontal unilateral effects. The author also points
out that those concerns rose for firms holding a small share of the market. For
what regards the non-horizontal possible effects raised by concentrations in the
energy market, among several theories of harm the major concerns relate to the
consequence of an increased use of gas for the generation of electricity and
reduced unbundling of network infrastructure. Remedies usually involve
divestment in key assets in order to eliminate possible constraints to competition.
Among the most effective and required divestitures, it is possible to notice that the
Commission tends to prefer assets such as price-generating plants, network
structures, ownership in competitors’ capital.
A part of the literature (Hunger, 2003; Verde, 2008) focuses on the convergence
mergers. Those are related to merging entities coming from wholesale gas sector
and from the electricity sector. The reason for this is that many customers prefer to
be offered both gas and electricity by the same customer and that the mergers are
vertically connected since gas is being used more and more often in the
generation of electricity. Researchers have analysed the incentive that newly
merged entities could have to foreclose those rivals that do not include both gas
and electricity (e.g. Rey and Tirole 2004).

9
Some authors claim that the increased prices are due to several reasons among
which the loss of oil producers from having higher costs in the extraction than
revenues from the market, the need for firms that generate electricity by using oil
to add all costs and margin in the price, among which the oil cost (Rupérez-Micola
et al., 2008). Other potential competitive constraints can be related to the
customer and input foreclosure issues related to the energy industry, since firms
may want to increase prices for the downstream client or may try to foreclose
customers dissuading new entrants and hampering the position of already existing
firms (Federico, 2011).
Concerning vertical integration, Newbery (2007) finds that the latter can create
efficiencies by internalizing risks complementary for generators and suppliers.
Nevertheless it may also create a shortage of liquidity and therefore cause a threat
to competition by dissuading new potential entrants (Ofgem, 2015). Fiorio and
Florio (2009) have provided evidence that vertical integration leads to higher final
consumer prices in the electricity market.
According to Chao et al. (2005) relationships in the form of long term contracts has
the same effect as the vertical integration but lacks the investment and the control
centralization. So both the positive effects, namely fuel mix, risk sharing, etc. and
the negative effects for competition stay almost the same as in vertical integration.
Concerning ownership unbundling Meyer (2011) finds that in the electricity market
this practice causes a loss in synergies that ranges from 17 percent to 2 percent
depending on the product market taken into account. Nevertheless the literature is
controversial for what concerns improved efficiency in the whole sector given
different results obtained by different authors (Steiner, 2001; Hattori and Tsutsui,
2004). Moreover it is not clear whether unbundling stimulates investment and
passes the surplus obtained by the efficiencies to the consumer (Wilkinson, Duso
et aliud, 2016).
Concerning remedies, the Commission has cleared very important concentrations
thanks to divestitures and behavioural remedies which have been quite
demanding for the firms compared to the market share involved in the
concentration (Federico 2011). It is for example the case of Dong/Elsam/E2, which
will be the basis of the first part of the empirical analysis of this thesis. According

10
to Verde (2008) remedies can have negative overall effects if the party to which
the plant is divested is not expert or capable to run the business effectively,
promoting competition and offsetting loss of efficiencies deriving from the total
concentration.
2.3. Innovation, Antitrust and merger control
The competitiveness of our economy is more and more based on the added value
provided by technological innovations. It is therefore essential to focus economists’
attention on innovation, which has become an important variable in the
assessment of mergers by the European Commission and a main driver in the
creation of growth, jobs and investments (Competition policy brief, 2016). The EU
legal framework doesn’t provide a definition of what is innovation, but the
Commission proposes several distinctions of innovation, derived from economic
and business literature:
Product vs. Process innovation: the former refers to the implementation of a
new product with ameliorated features, whereas the latter is related to
creation and delivery amelioration;
Incremental vs. Breakthrough innovation: the two refer to the magnitude of
the technological progress, which is smaller in the first case and greater in
the second (Bower et aliud, 1995);
Sustaining vs. Disruptive innovation: the first term refers to an innovation
which takes place within an established ‘value network’, whereas the
second term embraces the concept of creating a new ‘value network’.
(Competition policy brief, 2016).
However, even if the commission seems to be moving towards a more innovation
focused approach, T.Curzon Price and M.Walker (2016) mention that there is still
a lot of room left for potential improvement, especially stating that: “dynamic
efficiency is often the neglected child of competition policy, even though it is a
recognised driver of long-term increased living standards”.
It is possible to distinguish between static and dynamic efficiencies in a
competitive market. The former can be either allocative or technical. Allocative
efficiency is obtained when price and marginal cost coincide, whereas technical
11
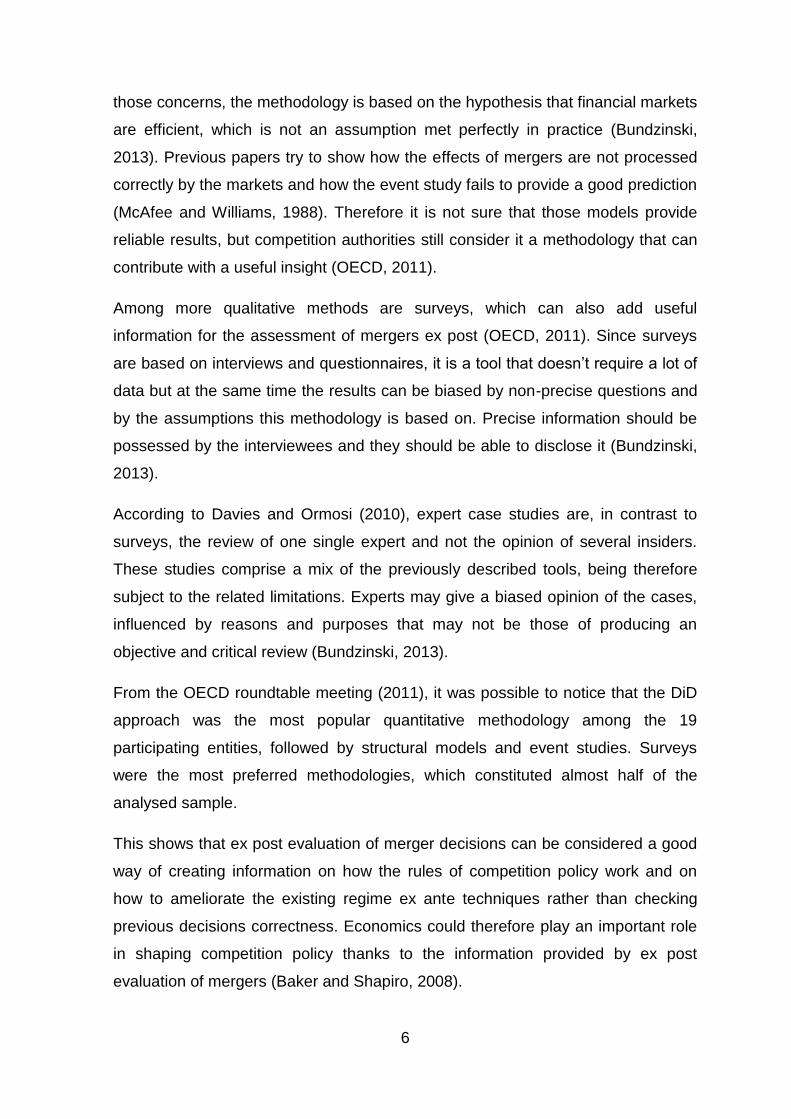
efficiency requires costs to be at the lowest possible level for given knowledge and
input. Dynamic efficiency involves the creation of new products or the increase in
the quality of the existing ones, as well as the design of new processes (Curzon
Price and Walker, 2016).
Figure 1: Static v dynamic welfare gains. Source: ‘Incentives to innovate v short-term price effects in antitrust analysis’, T. Curzon Price and M. Walker, Journal of European Competition Law & Practice, 2016, vol. 7, no. 7
As it can be seen in figure 1 above, dynamic efficiencies could be preferred over
static efficiencies since the former would lead to the creation of a completely new
demand curve for a new product, which increases consumer welfare by the area
C, rather than just a small increase of A + B in the latter one (Curzon Price and
Walker, 2016).
Several authors have tried to identify the relationship between competition and
innovation. For example Joseph Schumpeter (1942) developed a theory of
continuous innovation and creative destruction, stating that a less competitive
environment would stem innovation, especially dynamic. This is due to the fact
that less competition is linked to higher rewards for the producer, which would then
reinvest those rewards into R&D, which would in turn produce more innovation. In
this scenario firms compete for the market leader position rather than over price
(Schumpeter, 1942).
Nevertheless Kenneth Arrow (1962) finds that more competition triggers a need to
escape competition to earn higher profits, which can be achieved through more
innovation. This low concentration implies stronger incentives to differentiate and

12
to innovate, whereas firms with a greater interest in the leading position have a
smaller incentive to innovate than firms without such an interest (Arrow, 1962).
Moreover strong evidence was found that there exists an inverted-U relationship
between competition and innovation, according to which laggard firms would
produce less innovation and neck-and-neck companies would be incentivized to
innovate more (Aghion et alia, 2005).
According to Carl Shapiro (2012) both Arrow and Schumpeter identified some
important patterns of the relationship between innovation and competition. Arrow’s
view that company’s vested interest in the status quo implies a lower
encouragement towards innovation, which can be reconciled with Schumpeter’s
conclusions that, in order to foster innovation, a reward for innovation should be
granted (Shapiro, 2012). Both authors find that profitable future sales competition
is the key market characteristic that fosters innovation. Arrow would put more
weight on the ex ante conditions, whereas Schumpeter would identify ex post.
Therefore mergers and unilateral conduct can really have an impact on the
incentives to compete and innovate (Shapiro, 2012).
Previous studies have demonstrated that M&As can improve the innovation
performance. Authors have demonstrated that the greater the absolute size of the
knowledge base is, the greater the innovation productivity will be (Ahuja and
Katila, 2001). But not all M&As produce the same effects on innovation and an
analysis of similarity and complementarity is crucial. Firms which belonged to a
similar technological field undergo a period of rationalization and reduction of
productivity (Cassiman et al., 2005), and further studies found that the relationship
between innovativeness and similarity is an inverted U-shape (Kapoor and Lim,
2007). Moreover knowledge overlap generates a negative effect on the cumulative
abnormal returns(Sears, 2014). But Firms complementary in technology and
science have a good level of quality and novelty in inventions after the acquisition
(Makri, Hitt, and Lane, 2010).
There are other factors that influence innovation activity after an acquisition.
There is no negative effect on innovation activity because of layoffs in the R&D
department, especially for what concerns the top management for which the
reorganization improves R&D efficiency and productivity (Colombo and Rabbiosi,

13
2012). Improvement in innovation is more likely when routines overlap more, skills
less and relative size of the target company is higher than the buyer’s (Kapoor and
Lim, 2007). Diversity in downstream resources has a positive effect on breadth
and depth of innovation activity (Valentini and Di Guardo, 2012). There is some
discrepancy between anticipated and realized synergies. Several factors influence
innovation, and similarity is sometimes preferred as it can make integration easier
(Rao et al., 2015). A buyer would usually acquire a firm with complementary
products to its own, but with similar R&D pipeline to its products (Yu Yu, Nita
Umashankar and Vithala R. Rao, 2015).
Even though it seems from previous studies that mergers have an impact on R&D
and innovation, according to Curzon Price and Walker (2016) we haven’t
developed the right tools to evaluate dynamic efficiencies, often underestimating
those. The creation of the economic models and theories that we rely on now were
originated by past needs that derived from the circumstances of that generation.
Therefore the current circumstances will be the driver for the creation of new
studies that will improve our knowledge on topics such as innovation (Perez,
2003). It is therefore important that the best environment for innovation is created
and maintained, which can be done also with the help of competition policy
(Curzon Price and Walker, 2016). Among the features that should constitute this
innovative environment should be: expectation of appropriable rents for
innovators; disincentivization of non-innovating rent-protecting activities; optimal
trade-off between static inefficiency and dynamic incentives; avoiding too high
returns for innovation. Curzon Price and Walker (2016) suggest three topics where
research should focus in the future: microeconomics models that explain what
incentives have the greatest impact on innovation, creation of economic theories
based on innovation case studies, undertaking ex post evaluation of decisions.
The second part of this thesis will focus on that last area of research identified,
providing an ex post evaluation of the patenting activity in France, compared to
different scenarios.
14
2.4. Merger control and innovation, a focus on previous decision and on
the pharmaceuticals sector
From what previously said it seems clear that the Commission has nowadays
more at heart trying to foster innovation. It needs to be ascertained whether this is
feasible through competition policy enforcement. The current EU Merger
Regulation (2004) and relative guidelines take into account the effect that an
uncompetitive behavior can have on innovation as well as the effect of higher
prices, lower output and decrease in quality (Competition policy brief, 2016).
According to the European Commission’s Horizontal Merger Guidelines (2004) the
impact that a merger has on innovation is also taken into account among all the
factors analyzed at the moment of a decision. The Non Horizontal Merger
Guidelines (2008) also state that innovation is one of the key aspects that are
scrutinized when the merger is controlled. In order to make the scope of the
intervention of the Commission wider, small but innovative firms are considered
even if they are just likely to expand in the near future. Efficiencies related to
innovation can be accepted by the Commission given their impact on consumers’
price, quantity, quality and welfare.
A paper written five years ago claimed the lack of dynamic efficiencies analysis by
the commission in his merger decisions (Veugelers, Reinhilde, 2012). More in
particular the article analyzed previous phase two merger decisions and arrived to
the conclusion that out of 42 cases, dynamic efficiency claims were put forward in
only 11 of those and had been accepted in only one case, but were not considered
decisive even in that case.
Nevertheless, in the last years the Commission has found several behaviors, in
cases such as horizontal and non-horizontal mergers, to have anticompetitive
effects on innovation. This is the case for example of Medtronic/Covidien,
Novartis/GlaxoSmithKline's, Pfizer/Hospira, General Electric/Alstom, Deutsche
Börse AG v European Commission, Intel/McAfee, ARM/Giesecke & Devrient/
Gemalto Joint Venture, Intel/Altera. Among the cases in which innovation
efficiencies were claimed by the parties TomTom/TeleAtlas was one of those in
which the efficiencies were partly recognized.
15
The second part of this research will involve the ex post assessment of a
pharmaceutical sector merger, namely Sanofi-Synthélabo/Aventis merger. It is
therefore important to explain those that were the most important features of the
latest cases in which the Commission considered innovation in its decisions.
The merger between GSK and Novartis of 2014 involved two companies whose
main economic activities consisted in the development, distribution and marketing
of pharmaceutical products. The merger was cleared but was conditional on the
divestiture of several drugs. The Commission feared that the deal would have
hampered competition and innovation in those areas to be divested. More in
particular the Commission feared that the new duopoly market structure would
have been less competitive especially in relation to the creation and sales of B-Raf
and a MEK inhibitors for skin cancer. Moreover, some of the trial programs would
have likely been completely stopped, reducing innovation further. The
concentration would have reduced competition in skin cancer treatments but
Novartis proposed to return its rights over MEK162 to Array BioPharma Inc. and to
divest LGX818 to Array.
Another example of horizontal acquisition in the pharmaceutical sector in which
innovation played a key role was given by the Pfizer/Hospira case. The
Commission ultimately found that the proposed merger could have hampered
competition and reduced innovation because it would have led the new entity to
stop developing the new infliximab biosimilar drug or would have reduced current
price competition. Biosimilar drugs are product substitutes of biological drugs for
consumer, without infringing patents as it would be the case of generics. Moreover
competition concerns were identified also in the case of the sterile injections
market. The remedies were accepted by the Commission, which found that a
divestment of infliximab biosimilar and a divestment of marketing authorizations for
sterile injectable would have avoided all the competition concerns initially
identified.
Remedies in horizontal and non-horizontal mergers have usually been related to
the divestment of those projects and patents that are still in the development
phase and pipeline. In the case of non-horizontal mergers remedies may also be
of the behavioral type (Competition policy brief, 2016).
16
For example in the case of Intel/Mc Afee merger, the competitors of McAfee would
have likely been foreclosed the access to those markets in which Intel was a
dominant provider of central processing units and chipsets. Innovation was likely
to suffer from this foreclosure since Mc Afee’s current and potential competitors
wouldn’t have been able to participate in the just mentioned markets. Therefore
behavioral remedies were accepted by the Commission. Those involved, among
other commitments, the guaranteed access by Intel for Mc Afee’s competitors and
a more secure arbitration system to settle disputes related to the matter of
interoperability.
Finally an interesting case which is worth mentioning is that of TomTom/TeleAtlas,
in which the Commission acknowledged the innovation synergies and efficiencies
that would have been generated by the merger. The deal was cleared by the
Commission and not subjected to commitments. The main efficiencies that were
found were related to the elimination of double margins as a direct result of profit
maximization and it took into account the elimination of double margins. Moreover
there would have been small average price decreases. The innovation efficiency
was related to better and faster maps. Nevertheless the parties failed to quantify
rigorously the effect on innovation and the merger was cleared because of other
argumentations.
It seems that the Commission has started to take more into account the
importance of innovation and of dynamic efficiencies during its assessment. The
legal framework in place is able to capture those aspects of the analysis related to
innovation. The later has been demonstrated by a growing number of cases in
which the Commission has mentioned and tried to deal with innovation. It would
nevertheless seem from the opinions of several authors that there is still space for
improvement and that economics could provide better guidance to policymakers in
this area (Curzon Price and Walker, 2016).
17
3. Descriptive statistics and case study summary of the merger
DONG/Elsam/E2
In the following chapter, a summary of the key elements of the DONG/Elsam/E2
decision will be provided in order to create the basis for an understanding of the
empirical analysis. Further on a descriptive analysis of the data will be conducted.
The case M.3868 DONG / ELSAM / ENERGI E2 was submitted to the
Commission on 13th September 2005 and was cleared with remedies on 14th
March 2006. The case was downloaded from the Merger Research Tool of the DG
Competition website. The NACE codes used for the purpose of the research are
D.35.1, which stands for electric power generation, transmission and distribution
and D.35.2 which stands for Manufacture of gas; distribution of gaseous fuels
through mains. This case was identified by Federico (2011) as one of the most
relevant mergers in the energy sector.
3.1. Review of the case
In the initial concentration that was notified to the Commission in 2005, DONG
wanted to acquire the control of Elsam, E2, KE and FE. DONG, a Danish state-
owned company, operated in the gas sector in the fields of generation, distribution
and retail of oil and natural gas, storing and distributing natural gas, as well as in
smaller businesses in the production, and offer of electricity. Elsam and Energi E2
(E2) operated respectively in the western and eastern parts of Denmark in the
generation and wholesale of electricity. Nevertheless E2 had also an important
activity in the retail to customers. KE and FE were the suppliers of electricity of
Copenhagen region.
The relevant product markets for natural gas were defined by the Commission
following an analysis of the markets for gas storage/flexibility, wholesale and
supply. The definition of the relevant market for the storage/flexibility business was
left open, a conclusion stemmed by the market investigation provided by the
Commission which showed five different possible groups of flexibility tools not to
be considered as viable. Concerning the wholesale market, the final decision
identified a market independently of the legal instrument used for the transaction.
With regard to the Market for supply of natural gas to central CHP plants, the

18
Commission claimed that it was a separate market given its different consumption
patterns. Concerning markets for supply of gas to decentral CHPs and to large
industrial customers, the Commission found that this could have been considered
both as a single and a separate market. Finally, the Commission found the market
for supplies of gas to households and small businesses to be considerable as both
the same market and two separated markets. The Commission identified Denmark
(or possibly Sweden in few cases) as the only main relevant geographic market for
all the relevant product markets.
The relevant product markets that the Commission identified in the electricity
sector were: wholesales within the Nord Pool, ancillary services and bilateral
wholesales outside of the Nord Pool. The above mentioned electricity product
markets had a geographic market national and not greater than Denmark (or
possibly Sweden). Another product market that is defined in the Commission
analysis is the one of financial derivatives of electricity, which instead of
exchanging electricity was in charge of allocating risks and should have been
located in the whole Nordic relevant geographic market. Eventually the contracts
for difference could be considered as a separate product market with the same
geographic scope. Finally, the Commission identified a product market for
electricity retail to metered and non-metered customers because of different
products and pricing conditions. The latter are comprised within a geographic
market respectively national and national/regional.
The Commission found that the Merger would have reduced the competitive
constraints on DONG in the Danish market for gas storage and gas flexibility.
Prices for storage would have become higher for other players in the industry
since the merging entities would have gained access to flexible facilities, which
would have replaced storage. Moreover the Commission claimed that the
concentration would have reduced the competitive constraints on DONG in the
Danish wholesale market because E2 and ELSAM are considered as potential
competitors. This would have also leaded to a possible customer foreclosure,
creating an obstacle for potential entrants. The Commission also stated that the
merger would have improved the dominant position of DONG in the Danish
markets for supplies to industrial customers and decentralised CHPs because it
would have created barriers to entry related to gas storage and eliminated
19
potential competitors such as E2 and ELSAM. The notified concentration would
have reduced competitive constraints in the markets for the supply of gas to
households and small business customers. DONG would have jointly held a
dominant position in a very transparent market, increasing entry barriers due to
storage limitations, reducing potential competition from KE and NESA which had
easy access to gas.
Concerning the electricity market, no concerns were found in the defined markets
for electricity wholesale, ancillary services, financial derivatives, retail supply to
business customers and small customers.
Following the possible impediment to effective competition encountered in the
analysis of the Commission, Dong committed to divest facilities in the storage
market and pledged to attain a gas release programme with the aim of boosting
liquidity and flexibility, providing availability of gas to third parties in the wholesale
market. The commitments were considered sufficient to remove harm to
competition created by the merger in the storage/flexibility market, wholesale
market for natural gas and on natural gas retail markets. The remedies had the
role of avoiding the creation of entry barriers and the elimination of potential
competition.
3.2. Data and descriptive analysis
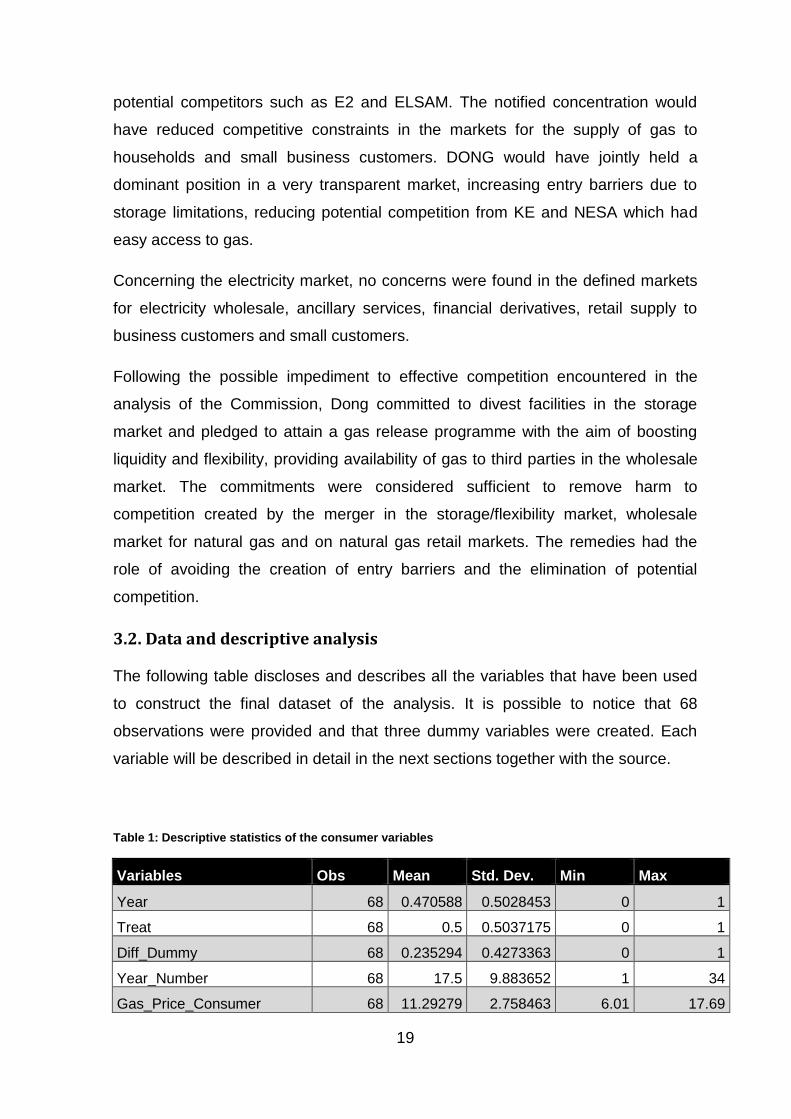
The following table discloses and describes all the variables that have been used
to construct the final dataset of the analysis. It is possible to notice that 68
observations were provided and that three dummy variables were created. Each
variable will be described in detail in the next sections together with the source.
Table 1: Descriptive statistics of the consumer variables
Variables Obs Mean Std. Dev. Min Max
Year 68 0.470588 0.5028453 0 1
Treat 68 0.5 0.5037175 0 1
Diff_Dummy 68 0.235294 0.4273363 0 1
Year_Number 68 17.5 9.883652 1 34
Gas_Price_Consumer 68 11.29279 2.758463 6.01 17.69
20
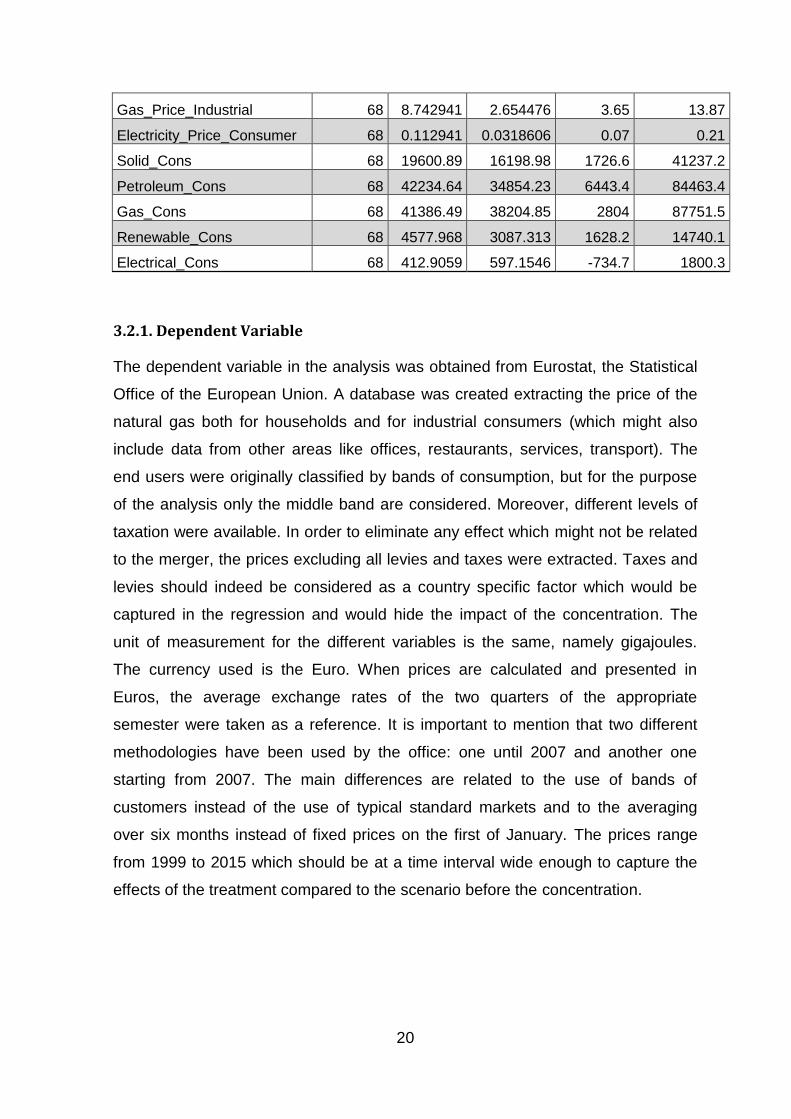
Gas_Price_Industrial 68 8.742941 2.654476 3.65 13.87
Electricity_Price_Consumer 68 0.112941 0.0318606 0.07 0.21
Solid_Cons 68 19600.89 16198.98 1726.6 41237.2
Petroleum_Cons 68 42234.64 34854.23 6443.4 84463.4
Gas_Cons 68 41386.49 38204.85 2804 87751.5
Renewable_Cons 68 4577.968 3087.313 1628.2 14740.1
Electrical_Cons 68 412.9059 597.1546 -734.7 1800.3
3.2.1. Dependent Variable
The dependent variable in the analysis was obtained from Eurostat, the Statistical
Office of the European Union. A database was created extracting the price of the
natural gas both for households and for industrial consumers (which might also
include data from other areas like offices, restaurants, services, transport). The
end users were originally classified by bands of consumption, but for the purpose
of the analysis only the middle band are considered. Moreover, different levels of
taxation were available. In order to eliminate any effect which might not be related
to the merger, the prices excluding all levies and taxes were extracted. Taxes and
levies should indeed be considered as a country specific factor which would be
captured in the regression and would hide the impact of the concentration. The
unit of measurement for the different variables is the same, namely gigajoules.
The currency used is the Euro. When prices are calculated and presented in
Euros, the average exchange rates of the two quarters of the appropriate
semester were taken as a reference. It is important to mention that two different
methodologies have been used by the office: one until 2007 and another one
starting from 2007. The main differences are related to the use of bands of
customers instead of the use of typical standard markets and to the averaging
over six months instead of fixed prices on the first of January. The prices range
from 1999 to 2015 which should be at a time interval wide enough to capture the
effects of the treatment compared to the scenario before the concentration.

21
Figure 3 Prices of gas in Denmark from 1999 to 2015 per each semester.
The graph above shows how gas prices for the consumers and industrial end
users evolved from 1999 to 2015. Each observation is a semester of the year.
There has been a peak that coincided with the financial crisis of 2006 – 2007
(observation number 17) and the debt crisis of 2011 (observation number 25) in
Europe.
3.2.2. Control Variables
The control variables are obtained from Eurostat, the Statistical Office of the
European Union. The first variable that was extracted is the price of electricity for
consumers, which has been used extensively in the literature as a control variable
in order to complete the DiD model (Wilkinson, Duso et aliud, 2016). The
consumption band is DC, which indicates a range of 2 500 kWh < Consumption <
5 000 kWh. The unit of measure is Kilowatt-hour. Taxes and levies are excluded
as in the previous section. The Euro is the currency used for the purpose of this
analysis. It is important to notice that as in the previous case, when prices are
calculated and presented in Euros, the average exchange rates of the two
quarters of the appropriate semester are taken as a reference.
0.00
2.00
4.00
6.00
8.00
10.00
12.00
14.00
16.00
18.00
1 3 5 7 9 11 13 15 17 19 21 23 25 27 29 31 33
Gas Prices Denmark
Gas_Price_Consumer
Gas_Price_Industrial

22
Figure 4 Electricity Prices in Denmark from 1999 to 2015 per each semester
From the graph above it would seem that the price of electricity follows a similar
path to the price of gas. This may be caused by the fact that those are highly
correlated and that gas is used as an input in order to calculate the price of
electricity.
Moreover other variables have been taken into account from the demand and
supply side in order to improve the model. A similar approach has been taken by
the Commission (Wilkinson, Duso et aliud, 2016). The gross domestic
consumption of other sources of energy has been extracted from 1999 to 2015.
The gross inland consumption of solid fuels, petroleum products, natural gas,
renewable energies and electrical energy was obtained. The unit of measure is the
same for all the control variables and it is thousands of tonnes of oil equivalent.
0.00
0.02
0.04
0.06
0.08
0.10
0.12
0.14
1 3 5 7 9 11 13 15 17 19 21 23 25 27 29 31 33
Electricity_Price_Consumer
Electricity_Price_Consumer
23
4. Model, methodology and results for the merger DONG/Elsam/E2
In this chapter the choice of model and the methodology used for the purpose of
this analysis will be discussed. The results of the model will be also disclosed in
the last part of the chapter.
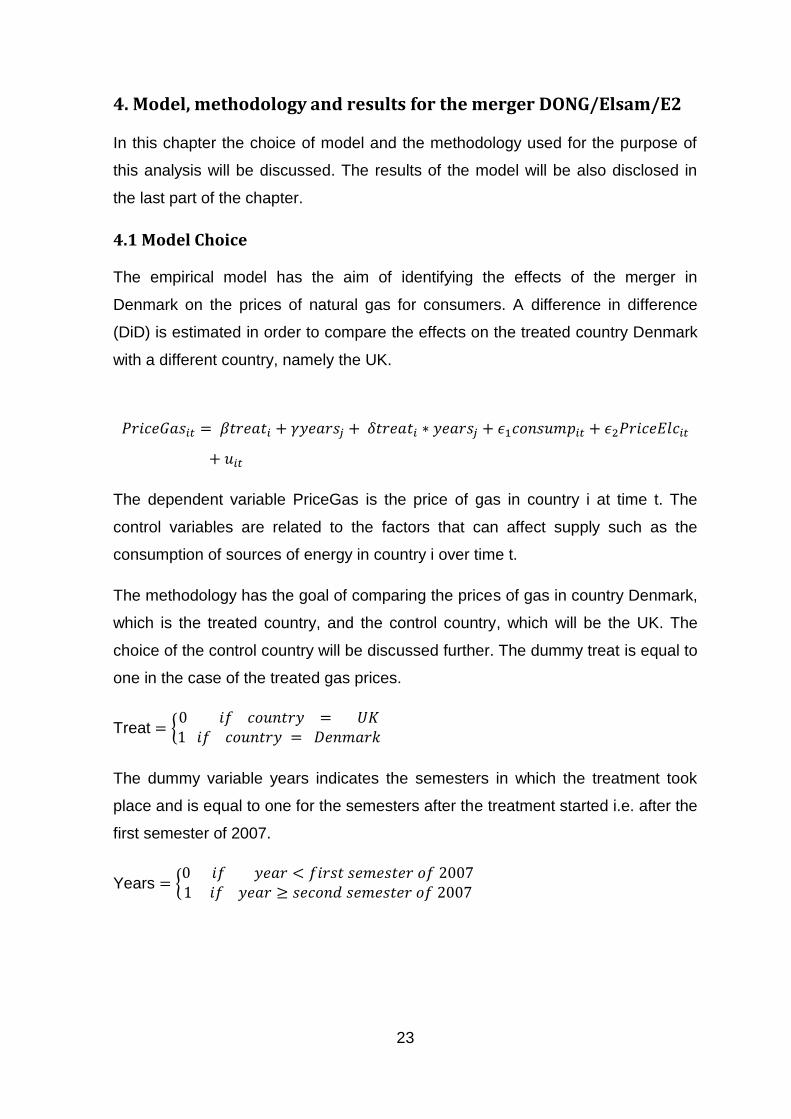
4.1 Model Choice
The empirical model has the aim of identifying the effects of the merger in
Denmark on the prices of natural gas for consumers. A difference in difference
(DiD) is estimated in order to compare the effects on the treated country Denmark
with a different country, namely the UK.
𝑃𝑟𝑖𝑐𝑒𝐺𝑎𝑠𝑖𝑡 = 𝛽𝑡𝑟𝑒𝑎𝑡𝑖 + 𝛾𝑦𝑒𝑎𝑟𝑠𝑗 + 𝛿𝑡𝑟𝑒𝑎𝑡𝑖 ∗ 𝑦𝑒𝑎𝑟𝑠𝑗 + 𝜖1𝑐𝑜𝑛𝑠𝑢𝑚𝑝𝑖𝑡 + 𝜖2𝑃𝑟𝑖𝑐𝑒𝐸𝑙𝑐𝑖𝑡
+ 𝑢𝑖𝑡
The dependent variable PriceGas is the price of gas in country i at time t. The
control variables are related to the factors that can affect supply such as the
consumption of sources of energy in country i over time t.
The methodology has the goal of comparing the prices of gas in country Denmark,
which is the treated country, and the control country, which will be the UK. The
choice of the control country will be discussed further. The dummy treat is equal to
one in the case of the treated gas prices.
Treat = {0 𝑖𝑓 𝑐𝑜𝑢𝑛𝑡𝑟𝑦 = 𝑈𝐾1 𝑖𝑓 𝑐𝑜𝑢𝑛𝑡𝑟𝑦 = 𝐷𝑒𝑛𝑚𝑎𝑟𝑘
The dummy variable years indicates the semesters in which the treatment took
place and is equal to one for the semesters after the treatment started i.e. after the
first semester of 2007.
Years = {0 𝑖𝑓 𝑦𝑒𝑎𝑟 < 𝑓𝑖𝑟𝑠𝑡 𝑠𝑒𝑚𝑒𝑠𝑡𝑒𝑟 𝑜𝑓 20071 𝑖𝑓 𝑦𝑒𝑎𝑟 ≥ 𝑠𝑒𝑐𝑜𝑛𝑑 𝑠𝑒𝑚𝑒𝑠𝑡𝑒𝑟 𝑜𝑓 2007

24
4.2 Control group choice
The control group chosen for the identification is extremely important for the
purpose of the analysis. The control group should explain what would have
happened to the treated country if the treatment hadn’t taken place.
The choice of the control group is difficult because of several reasons. There is a
lack of available data for some countries that don’t have a time interval wide
enough to perform an empirical analysis. Secondly, countries have specific
characteristics such as a different policy and regulation in place for the energy
sector and prices can be regulated. Third, mergers in the energy sector have been
cleared by the Commission in almost every country in Europe, with more than 300
cases in the last 12 years (Commission Report, 2015). All European countries are
more and more interconnected and the price change in one country can affect the
others, especially if it is a close country.
Given all these issues in the choice of the control group, the UK appeared to be
the most appropriate since it is less connected to Denmark than other Nordic
countries but at the same time it has a developed technology compared to the
other possible control groups, which makes it similar to Denmark. Finally and most
importantly the UK where not found to be part of the geographic market that the
Commission considered to be affected in the first place.
Figure 5 Time series of gas prices in Denmark and the UK from 1999 to 2005 per each semester
0.00
2.00
4.00
6.00
8.00
10.00
12.00
14.00
16.00
18.00
20.00
1 3 5 7 9 11 13 15 17 19 21 23 25 27 29 31 33
Gas Prices: UK vs Denmark
Gas_Price_Consumer
Gas_Price_Consumer_UK
25
The prices before the merger seem to have on average a similar value for the UK
and for Denmark, which would make the UK a good control group. After the
merger takes place, there is a clear change in the trend of the two countries. The
price in the UK increases drastically compared to the Danish scenario.
4.3 Treatment period choice
In order to study the effects of the merger it is essential to analyse the key
moments of the decision. Since the merger has been approved with remedies, the
analysis should consider the moment in which the remedies were finalized as the
starting moment of the treatment for the Danish market. The most important
milestones in the decision are therefore:
- The decision on the concentration: 14 March 2006
- The divestiture of gas storage facility in Lille Torup in Jutland: 1 May 2007
- The gas release program: from the year 2006 to 2011
Even though the markets may be sensible to the announcement of the decision of
the Commission, especially in the wholesale market, it is unlikely that this small
effect could be passed on to the downstream market. Moreover, the frequency of
the data is not high enough to show that effect. Therefore it is not considered in
the analysis.
The first semester of 2007 is chosen as the start of the treatment period because it
is the final moment in which all remedies took place and the merger can be
considered concluded according to the Commission decision. The gas release
program starts before the divestiture.
4.4 Estimation of the Model
We proceed first with the estimation of the model that predicts the prices of gas for
consumer and then with the estimation of the model that predicts the prices of gas
for industrial end users.
4.4.1 Consumers Model estimation
The first estimation of the model had several statistically insignificant values (see
26
Annex 1: Consumer model estimation with all the control variables (Stata output)).
Therefore the non-significant values were dropped in order to arrive to the second
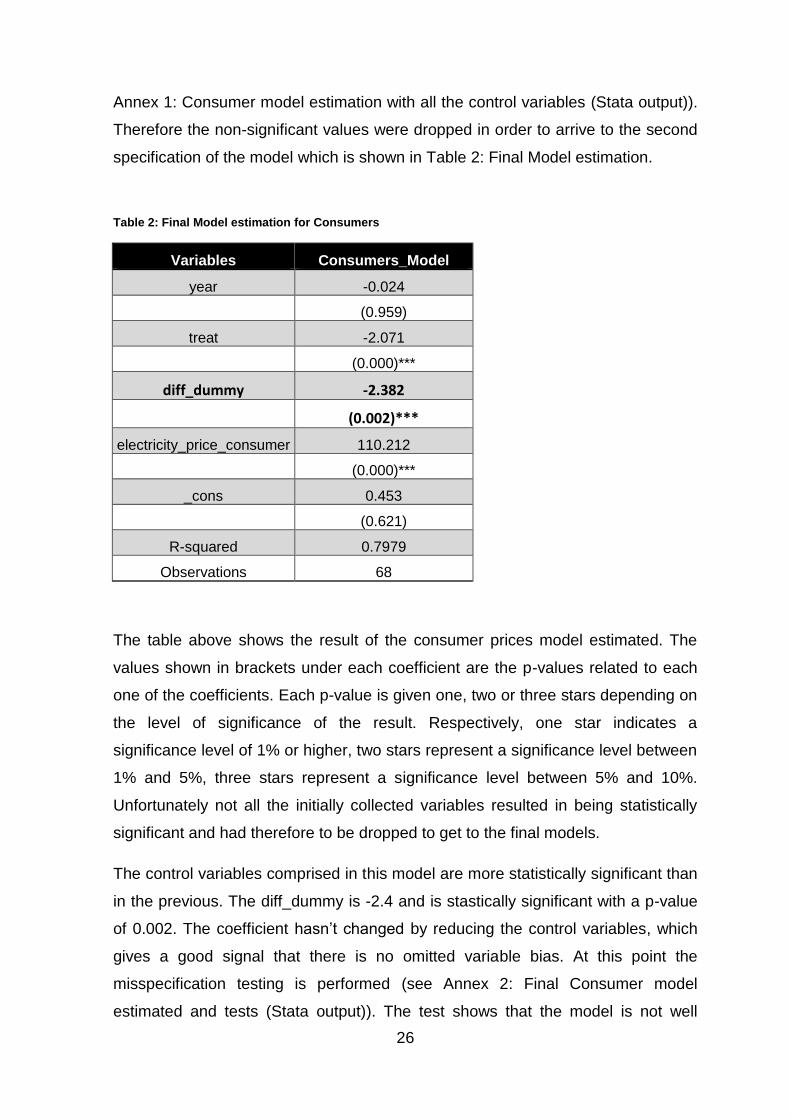
specification of the model which is shown in Table 2: Final Model estimation.
Table 2: Final Model estimation for Consumers
Variables Consumers_Model
year -0.024
(0.959)
treat -2.071
(0.000)***
diff_dummy -2.382
(0.002)***
electricity_price_consumer 110.212
(0.000)***
_cons 0.453
(0.621)
R-squared 0.7979
Observations 68
The table above shows the result of the consumer prices model estimated. The
values shown in brackets under each coefficient are the p-values related to each
one of the coefficients. Each p-value is given one, two or three stars depending on
the level of significance of the result. Respectively, one star indicates a
significance level of 1% or higher, two stars represent a significance level between
1% and 5%, three stars represent a significance level between 5% and 10%.
Unfortunately not all the initially collected variables resulted in being statistically
significant and had therefore to be dropped to get to the final models.
The control variables comprised in this model are more statistically significant than
in the previous. The diff_dummy is -2.4 and is stastically significant with a p-value
of 0.002. The coefficient hasn’t changed by reducing the control variables, which
gives a good signal that there is no omitted variable bias. At this point the
misspecification testing is performed (see Annex 2: Final Consumer model
estimated and tests (Stata output)). The test shows that the model is not well
27
specified. It is nevertheless unsuccessful to model the other non linearities given
the control variables. The model is the best linear approximation. Applying the
normality test to the residuals from the regression, it is possible to notice that the
Jarque-Bera test yields a t-statistic of 0.2166 with a p-value of 0.8974. The
Doornik-Hansen version, which is more suitable for small samples, yields a
statistic of 1.3301 with a p-value of 0.5142. We see that normality is not rejected.
Furthermore the R-squared is almost 0.8, which is high and indicates that the
model is well fitted.
4.4.2 Industrial end users Model Estimation
Again, the first estimation of the industrial end users model has several statistically
insignificant values (see Annex 3: Industrial end users Model Estimation with all
the control variables and relative tests (Stata Output)). Therefore we drop the non-
significant values and arrive to the second specification of the model, performing
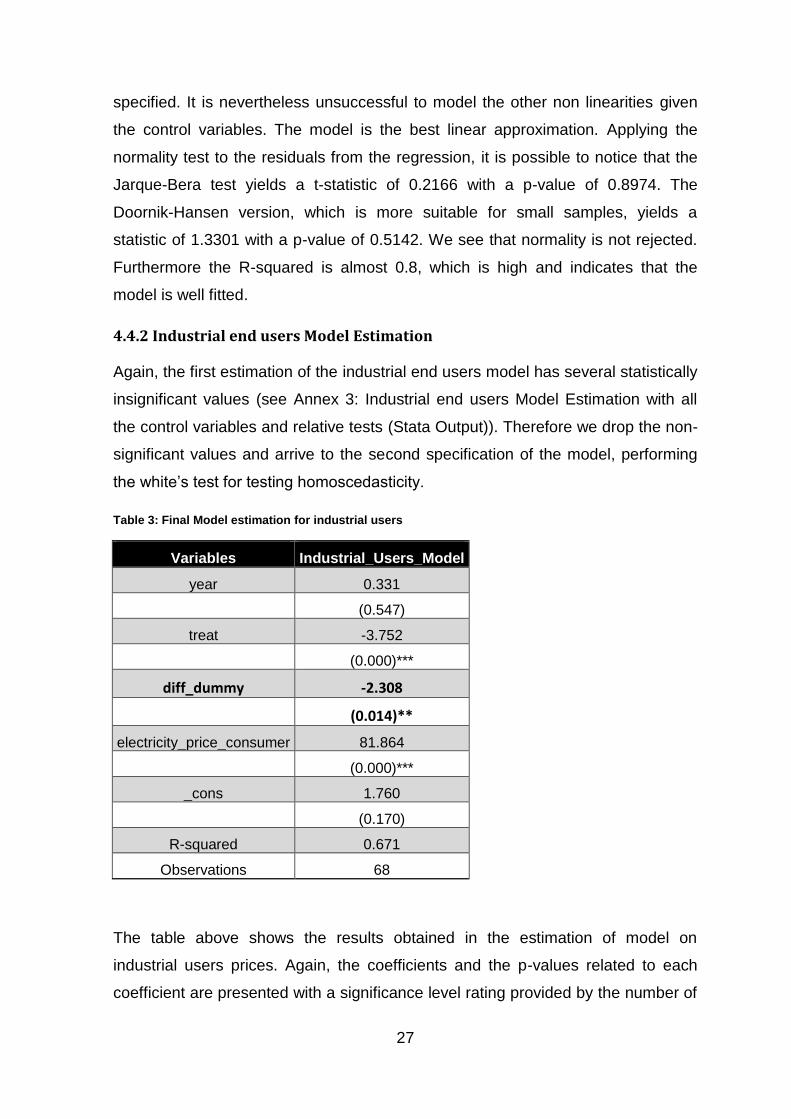
the white’s test for testing homoscedasticity.
Table 3: Final Model estimation for industrial users
Variables Industrial_Users_Model
year 0.331
(0.547)
treat -3.752
(0.000)***
diff_dummy -2.308
(0.014)**
electricity_price_consumer 81.864
(0.000)***
_cons 1.760
(0.170)
R-squared 0.671
Observations 68
The table above shows the results obtained in the estimation of model on
industrial users prices. Again, the coefficients and the p-values related to each
coefficient are presented with a significance level rating provided by the number of
28
stars. The model is regressed with the robust option since the White-s test showed
signs of heteroscedasticity given that the null hypothesis of homoscedasticity is
rejected (see Annex 3: Final model estimated for industrial users and relative tests
(stata output)). The control variables comprised in this model are more statistically
significant than in the other. The diff_dummy coefficient is -2.3 and is statistically
significant with a p-value of 0,014. The R-squared is very high in this case as well.
At this point the misspecification testing is performed. The test shows that the
model is well specified. Applying the normality test to the residuals from the
regression, we see that the residuals of the model follow a normal distribution.
4.4.3 Results
Presented above are the results of the two models estimated for the first part of
this study. The most important coefficient is the one related to diff_dummy. It
represents the coefficient linked to year*treat variable. In both models the
coefficient is significant. In the case of the consumer price it is significant even at
the 1% significance level. In the case of the industrial end users it is significant at
the 5% significance level. Nevertheless the second model performs better than the
first one in terms of misspecification testing for what concerns all the tests
performed.
In both models the coefficient related to the diff_dummy is negative and provides
evidence that the effect of the merger was a decrease in prices in Denmark
compared to the UK, the control country. The negative coefficient linked to the
treat variable indicates that the gas prices in Denmark were lower on average than
in the UK. This result is also statistically significant and valid for both models. The
coefficient related to year shows evidence that the prices in both models were not
significantly different on average after the merger with respect to before the
merger. The coefficient linked to the control variable price of electricity for
consumers shows evidence of a positive impact of electricity price on gas prices.
29
5. Descriptive statistics and case study summary of the merger
SANOFI-SYNTHELABO/ AVENTIS
The second part of this study will focus on the analysis of a merger case from the
pharmaceuticals sector, which happened in the past and for which an ex post
evaluation can be performed.
The analysed merger, namely M.3354 SANOFI-SYNTHELABO / AVENTIS, was
obtained from Directorate General for Competition by using the merger research
tool. It is classified under the NACE code C.21.20 which stands for manufacture of
pharmaceutical preparations. The decision was published the 26th of April 2004
with conditions and obligations.
5.1. Review of the case
At the beginning of the year 2004, Aventis agreed to be acquired by Sanofi-
Synthelabo through a hostile takeover. This concentration generated the world
third largest medicine producer at that time after Pfizer and GlaxoSmithKline.
According to an article published by the BBC News (2004), the merger was
thought to have a remarkable impact on the French market, therefore the French
Prime Minister at that time commented on the case saying that it would have
maintained jobs and decision centers in France.
The main reason why this merger was chosen is that it is one of the biggest deals,
in terms of bid, which took place in the pharmaceuticals sector in Europe during a
period between the years 2000 and 2010 (Statista Statistics Portal, 2017), a time
range for which data was available. Moreover, the deal took place between two
French inventors, which is essential for the purpose of the creation of the model.
Finally the pharmaceuticals sector is a high technology business for which
patenting activity is essential and can be a good proxy of innovation (Dernis,
Guellec, 2001).
According to the Commission decision M.3354 SANOFI-SYNTHELABO /
AVENTIS, the parties involved in the decision were Sanofi-Synthélabo and
Aventis. The two companies were both based in France: the first one in Paris and
the second one in Strasbourg. Both were listed in the stock market. Sanofi was
active in the research, development, production and commercialization of

30
pharmaceutical products in sectors such as vaccines, animal health care,
therapeutic proteins and chemistry, fabrication of active pharmaceutical principles.
The same being true at the time for Aventis, which was present in the sectors of
animal healthcare, human vaccines and chemistry.
For the purpose of this analysis it is important to state that the major competition
concerns identified by the Commission were related to areas of thrombosis,
colorectal cancer and insomnia. But the two parties were able to divest and offer
behavioral remedies which allowed the Commission to clear the merger. In some
activities the two companies overlapped and could therefore cause the creation of
a dominant position which would have been detrimental for competition and final
customers and patients.
The Commission identified relevant markets and accepted related remedies which
were submitted by the parties. The Delagrange product belonging to the vitamin
B12 (A11F) relevant market in France was divested. Positive inotropic agents
(C1F) relevant market also raised an issue in the United Kingdom and Belgium but
the drug Perfan was pledged to be sold or licensed. Cerebral and peripheral
vasotherapeutics (C4A) relevant market in Ireland was also divested or licensed
for what concerned Hexopal drugs. The drug Lioton 1000 was divested in order to
overcome competition concerns in the topical varicose therapy (C5B) relevant
market in Italy. The French relevant markets macrolides and similar types (J1F)
and glycopeptide antibiotics (J1X1) were protected from competition concerns
through the divestiture or licensing of respectively Naxy and Vancomycine Dakota.
Sanofi offered to licence or grant Plaquinol, Adalgur N and Coltramyl drugs in
order to settle issues related to the specific anti-rheumatics (M1C) and muscle
relaxants (M3B) relevant product markets in Portugal. Imovane was sold or
licensed to settle issues concerning Hypnotics and sedatives (N5B) relevant
markets in Greece, Ireland, Luxembourg and Sweden. Moreover the parties
pledged to divest Fraxiparin and Arixtra in the heparins and heparinoids market in
Germany, Austria, Belgium, Spain, Finland, France, Italy, Luxembourg, the
Netherlands, Portugal and the United Kingdom, as well as divesting an entire
related French plant to GlaxoSmithKline. Finally the treatment of colorectal cancer
was not considered to raise concerns for competition in France, Germany, Italy,
31
the Netherlands, Spain, Sweden and the United Kingdom, as long as the newly
merged entity would have sold or licensed all the activities related to Campto drug.
The Commission didn’t perform an analysis which took into account dynamic
efficiencies and the effect of the merger on innovation. Nevertheless this decision
was one of the most adequate for the purpose of this study because of its likely
impact on the R&D pipeline. According to an article published by the ‘Nature
Reviews Drug Discovery’ (Frantz, 2004) the merger between Aventis and Sanofi-
Synthélabo would have been a good R&D merger. The article reviews several
opinions of analysts that analyzed the pipelines of the company and came to the
conclusion that the two entities would have produced a complementary new
company (Frantz, 2004). Pipelines had few overlaps and the late stage projects of
Sanofi would be included perfectly in Aventis late stage poorer pipeline. Moreover
the main drugs that created overlaps were dealt by the remedies offered to the
Commission by the parties. According to analysts’ opinions gathered in the article,
future R&D and innovation would have depended also upon the ability of the two
companies to merge the professional talents and different working cultures. For
example Sanofi was characterized by smaller research teams focused on
particular areas, whereas Aventis had a broad network thanks to which all experts
were able and even encouraged to contribute to projects other than their owns
(Frantz, 2004).
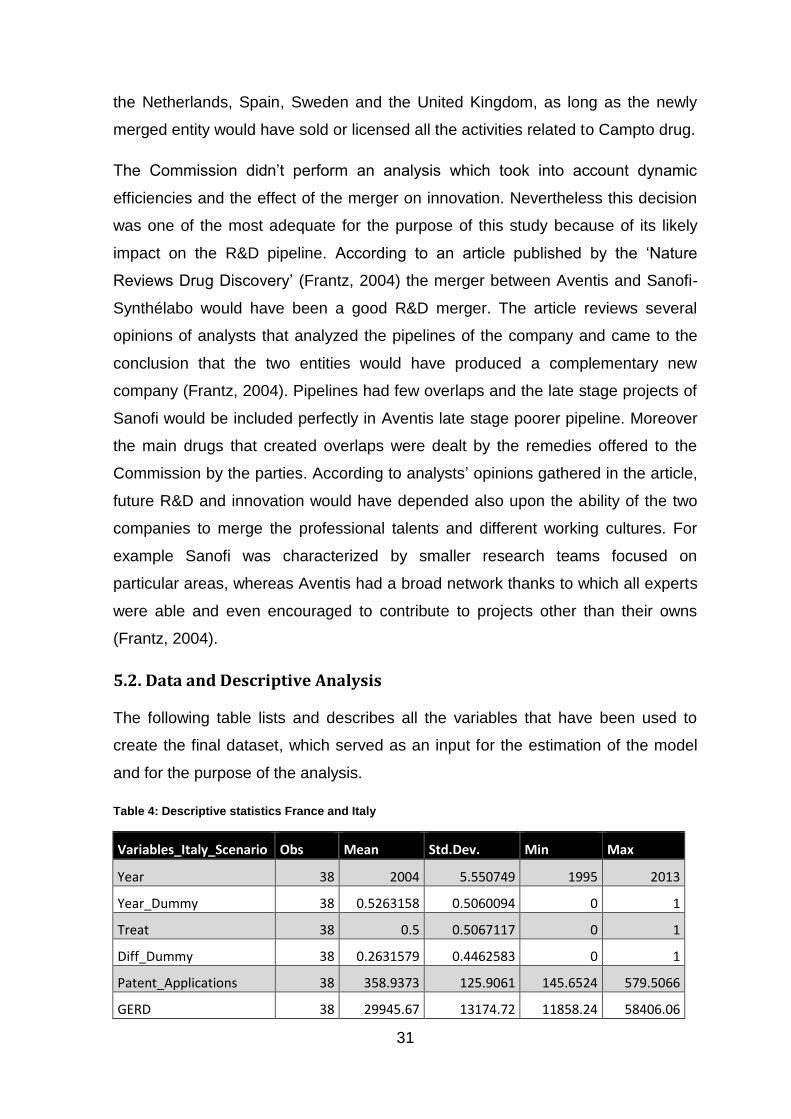
5.2. Data and Descriptive Analysis
The following table lists and describes all the variables that have been used to
create the final dataset, which served as an input for the estimation of the model
and for the purpose of the analysis.
Table 4: Descriptive statistics France and Italy
Variables_Italy_Scenario Obs Mean Std.Dev. Min Max
Year 38 2004 5.550749 1995 2013
Year_Dummy 38 0.5263158 0.5060094 0 1
Treat 38 0.5 0.5067117 0 1
Diff_Dummy 38 0.2631579 0.4462583 0 1
Patent_Applications 38 358.9373 125.9061 145.6524 579.5066
GERD 38 29945.67 13174.72 11858.24 58406.06

32
Researchers 38 142510.2 66289.55 65098 266222
R&D_Personnel 38 269272.4 95025.78 141789 418141
BERD_Tot 38 15354.41 8305.586 4479.02 30708.07
Table 5: Descriptive statistics France and Denmark
Variables_Denmark_Scenario Obs Mean Std. Dev. Min Max
Year 38 2004 5.550749 1995 2013
Year_Dummy 38 0.526316 0.5060094 0 1
Treat 38 0.5 0.5067117 0 1
Diff_Dummy 38 0.263158 0.4462583 0 1
Patent_Applications 38 298.4176 179.2265 70.7628 579.5066
GERD 38 22575.58 19390.87 2120.288 58406.06
Researchers 38 114256.5 92249.29 15954 266222
R&D_Personnel 38 200258.8 159704.3 30212 418141
BERD_Tot 38 13106.58 10331.04 1452.102 30708.07
The dataset is composed of 38 observations which range on period that goes from
1995 to 2013. All the variables were collected from an electronic publication of the
Economic Analysis and Statistics Division of the OECD Secretariat. The data of
the publication is selected from the OECD Scientific Technology Indicators
database. The OECD collects data on the 35 Member countries and has started
collecting data also on some of the non-member economies. The data is based on
retrospective surveys and national forecasts when those are available. Even if this
study is not based on variables which measure the output of Innovating activity of
a country, some of them could be a good proxy indicator of the how the country
performs in terms of scientific research and innovation according to the Economic
Analysis and Statistics Division of the OECD Secretariat.
5.2.1. Dependent Variable
As just mentioned above, the dependent variable of the analysis was obtained
from the OECD database. The database was created by extracting the number of

33
patent applications filed to EPO’s Worldwide Statistical Patent Database
(PATSTAT, Autumn 2016) from 1995 to 2013. According to the Frascati Manual
(OECD, 2015) patents are counted as the number of applications which were filed
to European Patent Office, which is an important information for the purpose of
assessing whether a certain country has performed well from an innovative point
of view. More in particular the choice of the country of residence of the inventor is
fundamental. The priority date is taken as the reference date as it is the best way
to estimate the invention date. Indeed the priority date is the closest date to the
invention, the first filing worldwide, and it doesn’t produce a bias between
residents and foreigners (OECD, 2015). Inventors first submit their application in
the country of residence office and, after usually at least one year, file the
application in foreign offices to seek protection. For what concerns the country
selection, inventors’ country selection is the best variable for tracking the
innovative performance of researchers and laboratories of a certain country
(OECD, 2015). Patents were extracted only for the pharmaceuticals sector which
is the one that is impacted by the merger. This sector is selected according to the
International Patent Classification code that is provided in each patent and the
industry is based on the International Standard Industrial Classification, Revision 4
(ISIC Rev.4), in which the two companies are operating. The OECD Manual
(2015) reminds that patents are a good proxy of innovation production in relation
to the geographical area and the technology. Patents can give a good indication of
the outcomes of R&D, as has been seen in several studies. Patents can therefore
be seen as an output of the inventions and R&D. Patents have positive aspects
from a statistical perspective: they are strongly related to invention, it is a good
source of data, information on applicant, technology and geographic area are
easily obtained, etc. Nevertheless there are also some negative statistical
implications that need to be recalled at the moment of the analysis of patents
applications: many patents have no industrial application and don’t account for
innovation but just for inventions, some inventions may not be patented because
of industrial secrecy reasons for example, different countries and industries apply
different norms on patenting. All this aspects need to be considered when
conducting the research and at the moment of interpreting the results.

34
Table 6: Patent applications in France and in Italy
From the Patent Applications graph it is possible to notice that compared to the
Italian market, there has been a slight increase in the patents applications in
France in the year in which the merger between Sanofi-Synthélabo and Aventis
was performed. Moreover, both countries seem to suffer from the 2007 financial
crisis, because of a reduction in the total number of patent applications in both
countries. Overall, it is clear that there has been an increase in the production of
patents in both countries from 1995 to 2013.
5.2.2. Independent Variables
The independent variables that are used for the purpose of this study were also
extracted from the OECD database, as mentioned above. The main indicators
available for the selected time frame and countries of reference were the Gross
Domestic Expenditure on R&D, R&D personnel, R&D expenditure in the business
and enterprises sector and the full time researchers.
The Gross domestic expenditure on Research and Development is the total
domestic expenditure in R&D that was performed in a certain country within a
given timeframe, which is one year in this case. The R&D expenditure in the
Business Enterprise Sector encompasses both private and public owned entities
which are classified according to their main activity. Nevertheless it was not
0
100
200
300
400
500
600
700
19
95
19
96
19
97
19
98
19
99
20
00
20
01
20
02
20
03
20
04
20
05
20
06
20
07
20
08
20
09
20
10
20
11
20
12
20
13
Patent Applications
Patent applications in France Patents applications in Italy
35
possible to obtain the expenditure related exclusively to the pharmaceuticals field.
For this reason the total R&D costs have been extracted and used for the purpose
of this analysis. The unit of measure for the number of R&D personnel is the full-
time equivalent on Research and Development. Again only the total of the
researchers and not only the number related to the pharmaceuticals sector was
available. So the same approach was used in the case of full time researchers.
The time period taken into account starts in 1995 and ends in 2013. The currency
of reference for the Gross Domestic Expenditure on R&D is the United States
Dollar, which has been converted using purchasing power parity series taken from
the OECD National Accounts Division. The purchasing power parity compared the
United States prices with those of the other countries. It is also fundamental to
mention that the R&D statistics refer to those activities which are carried out
domestically for activities related to R&D. This means that for example, performers
abroad are not taken into account. For what concerns the Business Enterprise
Expenditure on R&D the currency of reference is the Euro. The unit of
measurement is millions of Euros.
On the comparability of observations over time it is worth mentioning that new
methodologies have been implemented throughout the years. In the year 2000
there was a break in the series, given a change in public sector quality of data,
which could have brought to a slightly higher level than expected. There has been
a revision in 1997 of the methodology to assess R&D expenditure and personnel.
Finally, the Business Enterprises sector has undergone several adjustments in the
methodology from 2001 to 2007 for reasons related to the definition of the
population, the quality of the source and the new methodologies implementations.
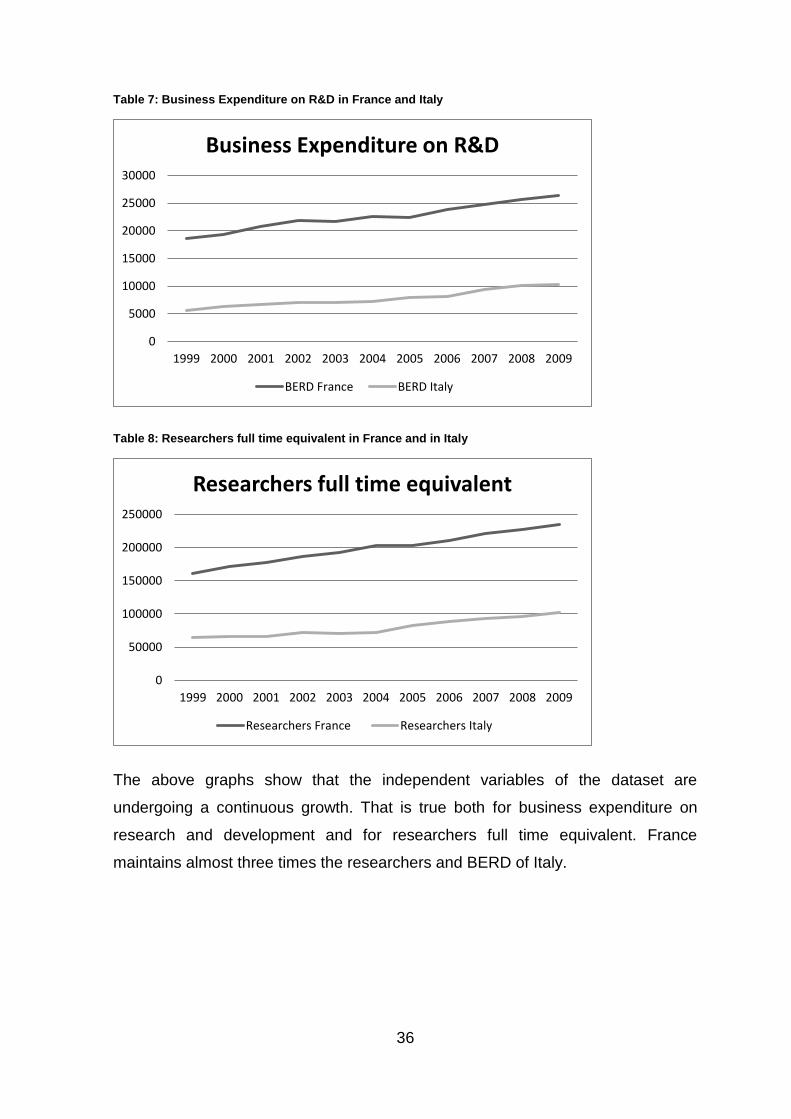
36
Table 7: Business Expenditure on R&D in France and Italy
Table 8: Researchers full time equivalent in France and in Italy
The above graphs show that the independent variables of the dataset are
undergoing a continuous growth. That is true both for business expenditure on
research and development and for researchers full time equivalent. France
maintains almost three times the researchers and BERD of Italy.
0
5000
10000
15000
20000
25000
30000
1999 2000 2001 2002 2003 2004 2005 2006 2007 2008 2009
Business Expenditure on R&D
BERD France BERD Italy
0
50000
100000
150000
200000
250000
1999 2000 2001 2002 2003 2004 2005 2006 2007 2008 2009
Researchers full time equivalent
Researchers France Researchers Italy
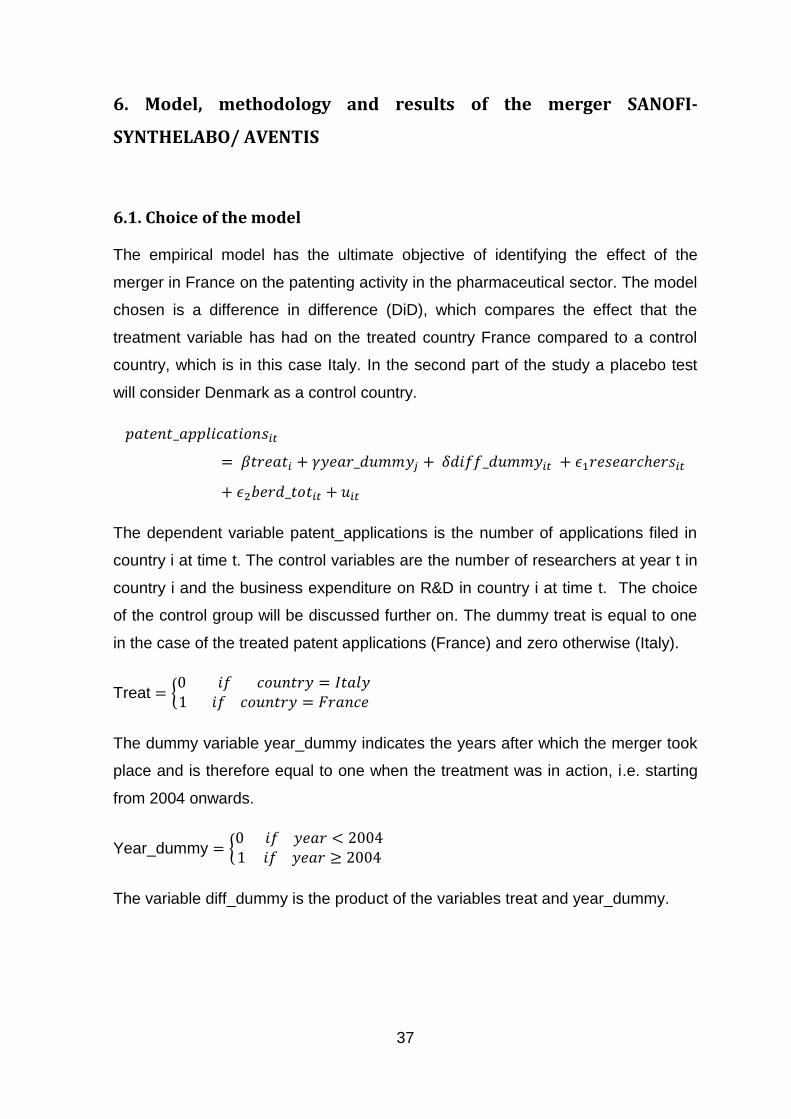
37
6. Model, methodology and results of the merger SANOFI-
SYNTHELABO/ AVENTIS
6.1. Choice of the model
The empirical model has the ultimate objective of identifying the effect of the
merger in France on the patenting activity in the pharmaceutical sector. The model
chosen is a difference in difference (DiD), which compares the effect that the
treatment variable has had on the treated country France compared to a control
country, which is in this case Italy. In the second part of the study a placebo test
will consider Denmark as a control country.
𝑝𝑎𝑡𝑒𝑛𝑡_𝑎𝑝𝑝𝑙𝑖𝑐𝑎𝑡𝑖𝑜𝑛𝑠𝑖𝑡
= 𝛽𝑡𝑟𝑒𝑎𝑡𝑖 + 𝛾𝑦𝑒𝑎𝑟_𝑑𝑢𝑚𝑚𝑦𝑗 + 𝛿𝑑𝑖𝑓𝑓_𝑑𝑢𝑚𝑚𝑦𝑖𝑡 + 𝜖1𝑟𝑒𝑠𝑒𝑎𝑟𝑐ℎ𝑒𝑟𝑠𝑖𝑡
+ 𝜖2𝑏𝑒𝑟𝑑_𝑡𝑜𝑡𝑖𝑡 + 𝑢𝑖𝑡
The dependent variable patent_applications is the number of applications filed in
country i at time t. The control variables are the number of researchers at year t in
country i and the business expenditure on R&D in country i at time t. The choice
of the control group will be discussed further on. The dummy treat is equal to one
in the case of the treated patent applications (France) and zero otherwise (Italy).
Treat = {0 𝑖𝑓 𝑐𝑜𝑢𝑛𝑡𝑟𝑦 = 𝐼𝑡𝑎𝑙𝑦1 𝑖𝑓 𝑐𝑜𝑢𝑛𝑡𝑟𝑦 = 𝐹𝑟𝑎𝑛𝑐𝑒
The dummy variable year_dummy indicates the years after which the merger took
place and is therefore equal to one when the treatment was in action, i.e. starting
from 2004 onwards.
Year_dummy = {0 𝑖𝑓 𝑦𝑒𝑎𝑟 < 20041 𝑖𝑓 𝑦𝑒𝑎𝑟 ≥ 2004
The variable diff_dummy is the product of the variables treat and year_dummy.
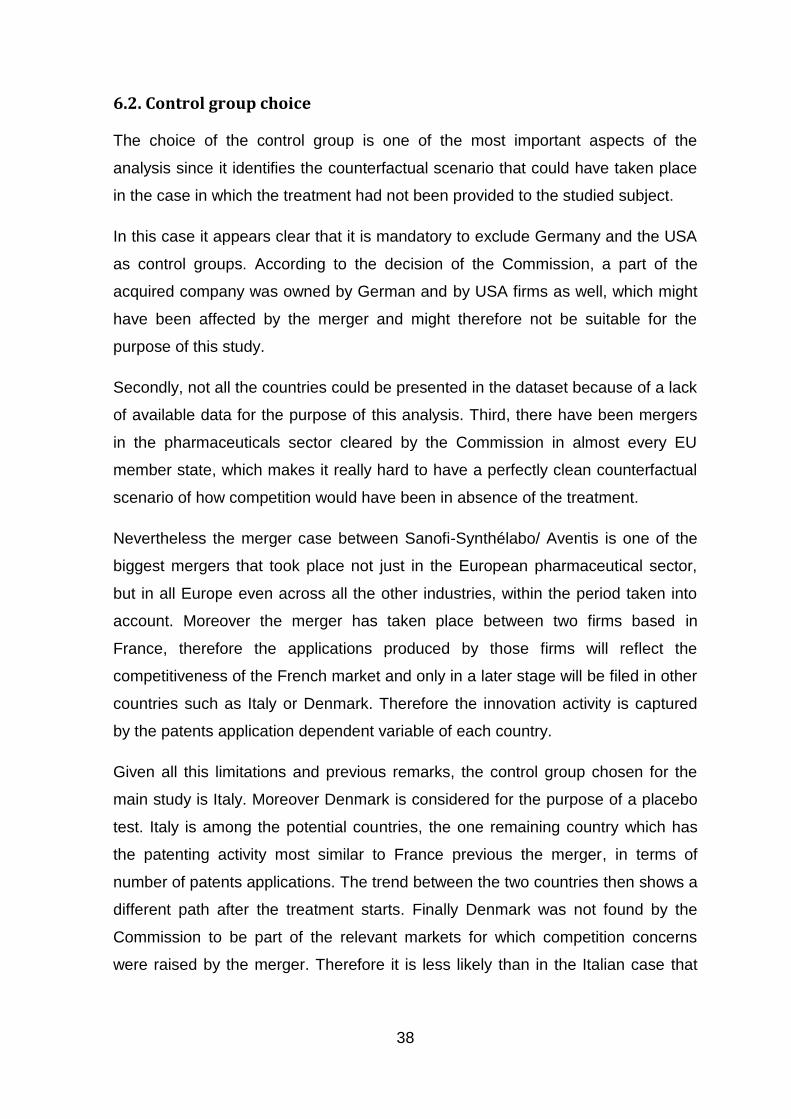
38
6.2. Control group choice
The choice of the control group is one of the most important aspects of the
analysis since it identifies the counterfactual scenario that could have taken place
in the case in which the treatment had not been provided to the studied subject.
In this case it appears clear that it is mandatory to exclude Germany and the USA
as control groups. According to the decision of the Commission, a part of the
acquired company was owned by German and by USA firms as well, which might
have been affected by the merger and might therefore not be suitable for the
purpose of this study.
Secondly, not all the countries could be presented in the dataset because of a lack
of available data for the purpose of this analysis. Third, there have been mergers
in the pharmaceuticals sector cleared by the Commission in almost every EU
member state, which makes it really hard to have a perfectly clean counterfactual
scenario of how competition would have been in absence of the treatment.
Nevertheless the merger case between Sanofi-Synthélabo/ Aventis is one of the
biggest mergers that took place not just in the European pharmaceutical sector,
but in all Europe even across all the other industries, within the period taken into
account. Moreover the merger has taken place between two firms based in
France, therefore the applications produced by those firms will reflect the
competitiveness of the French market and only in a later stage will be filed in other
countries such as Italy or Denmark. Therefore the innovation activity is captured
by the patents application dependent variable of each country.
Given all this limitations and previous remarks, the control group chosen for the
main study is Italy. Moreover Denmark is considered for the purpose of a placebo
test. Italy is among the potential countries, the one remaining country which has
the patenting activity most similar to France previous the merger, in terms of
number of patents applications. The trend between the two countries then shows a
different path after the treatment starts. Finally Denmark was not found by the
Commission to be part of the relevant markets for which competition concerns
were raised by the merger. Therefore it is less likely than in the Italian case that

39
the merger would have impacted the innovative activity of those firms present in
Denmark, even indirectly through the marketing and sales of pharmaceuticals.
Table 9: Patents applications in France and Italy
As it can be shown by the graph, Denmark as well has a similar trend before the
merger, which would make of it a suitable counterfactual scenario.
6.3. Treatment period choice
In order to assess the impact of the merger on innovation it is important to take
into account when the merger was performed. The decision was released in April
2004, therefore the assumption is made that the merger had the time to be
finalized in that very same year. Moreover, for the purpose of the analysis two
different time frames were taken:
Long Time Frame (i.e. 18 years): from 1995 to 2013
Short Time Frame (i.e. 10 years): from 1999 to 2009
From the graph below it is possible to notice that the change in the patenting
activity of France compared to other scenarios is even more remarkable in the
shorter time frame. There appears to be an increase compared both to Italy and
Denmark, the latter being more volatile.
0
100
200
300
400
500
600
700
19
95
19
96
19
97
19
98
19
99
20
00
20
01
20
02
20
03
20
04
20
05
20
06
20
07
20
08
20
09
20
10
20
11
20
12
20
13
Patents Applications
Patent applications in France Patents applications in Denmark
40
Table 10: Patent Applications France, Italy and Denmark
The distinction between the two time frames was performed in order to obtain
more information on the effects of the merger on innovation. Each study can be
interpreted separately and a confirmation from both time periods cannot harm the
research. It is important to include both a Short and a Long Time Frame: the
impact on R&D can be stronger in the long term, given that the entire knowledge
acquired by the buyer may need time to be completely assimilated. Therefore
synergies may be noticed both in the short term but also in the medium and long
term.
Finally, the numerous remedies that were accepted by the commission were not
clearly defined in terms of the time frame and therefore were not taken into
account for the choice of the treatment period.
6.4. Estimation of the model
The main model estimated will be between Italy and France for the long time
frame. It would be the most representative given the several limitations, remarks
and assumptions previously mentioned. Nevertheless, one placebo test will be
0
100
200
300
400
500
600
700
1999 2000 2001 2002 2003 2004 2005 2006 2007 2008 2009
Patent Applications Short Time Frame
Patent applications in France Patents applications in Italy
Patents application in Denmark

41
produced for Denmark in order to confirm the results obtained in the previous
scenario. Each model will be estimated both for the short and for the long time
frame, in order to provide more information in the assessment.
6.4.1. Model
Table 11: Models estimated for each scenario and p-values relative each coefficient
Countervailing Scenarios
Variables Italy_Long Italy_Short Denmark_Long Denmark_Short
year_dummy 29.675 -4.297 -1.730 -0.085
(0.288) (0.854) (0.945) (0.997)
treat 181.504 283.752 466.319 300.594
(0.055)* (0.055)* (0.005)*** (0.010)***
diff_dummy 102.102 41.647 149.736 34.177
(0.033)** (0.047)** (0.056)* (0.311)
researchers -0.006 -0.004 -0.009 -0.001
(0.000)*** (0.003)*** (0.027)** (0.513)
berd_tot 0.048 0.027 0.069 0.015
(0.000)*** (0.065)* (0.025)** (0.510)
year
9.107
(0.285)
_cons 392.633 -17,844.9 143.862 153.009
(0.000)*** (0.293) (0.000)*** (0.000)***
R-squared 0.808 0.975 0.895 0.973
Observations 38 22 38 22
The above table summarizes all the results that were obtained for the different
countervailing scenarios. The values shown in brackets under each coefficient are
the p-values related to each one of the coefficients. Each p-value is given one, two
or three stars depending on the level of significance of the result. Respectively,
one star indicates a significance level of 1% or higher, two stars represent a
42
significance level between 1% and 5%, three stars represent a significance level
between 5% and 10%. Unfortunately not all the initially collected variables resulted
in being statistically significant and had therefore to be dropped to get to the final
models.
It is clear that the results obtained all confirm that the merger has had a positive
impact on the production of patents applications in France compared to the other
controlling scenarios.
6.5. Results
In the first scenario, namely Italy_Long (see: Annex 5: Final Model Italy long time
frame and relative tests (stata output)), the coefficient related to the diff_dummy is
102.102 with a significance level within the 5% level with a p-value of 0.033.
Therefore it can be concluded that the merger has had a positive effect on the
French market, causing an increase of 102.102 number of patents on average
compared to the control group, Italy. The time frame is from the year 1995 to the
year 2013. The R-squared is also quite high, namely 0.808, meaning that the
sample observations are close to the estimation line. Concerning the
characteristics of the model, the tests performed and provided in the appendix
show that the model had heteroscedasticity, which was corrected by running the
model with robust standard errors. Finally, the misspecification tests were all
passed.
In the second scenario, namely Italy_Short (see Annex 6: Final Model Italy Shorter
Time frame and relative tests (stata output)), the time frame is reduced to 1999 to
2009. The coefficient related to the diff_dummy is lower than in the previous case,
with a value of 41.647 and the same significance level within the 5% level but a p-
value slightly larger. This regression confirms the results obtained in the main
model and the merger still has a positive effect on the French market, causing an
increase of 41.647 on average compared to the control group, Italy. The R-
squared is also even greater than the previous case, namely 0.975, meaning that
the sample observations are very close to the estimation line. The model was run
with robust standard errors. Finally, the misspecification tests were all passed in
this case as well.
43
The third scenario, Denmark_Long (see Annex 7: Final model estimated for the
placebo Denmark counterfactual scenario in the long time frame and relative tests
(stata output)), is a placebo test that is run for the long time frame from 1995 to
2013. Diff_dummy, coefficient of interest for this research, is positive and as high
as 149.736, with a significance level within the 10% level and a p-value of 0.056.
This regression again confirms the results obtained in the previous models. The
0.895 R-squared is still high. Misspecification tests were run and
heteroscedasticity was found. After running the model with robust standard errors,
the other misspecification tests, which are provided in the appendix, didn’t show
any particular issue.
The fourth and last scenario is Denmark_Short (see Annex 8: Final model
estimated for the placebo Denmark counterfactual scenario in the short time frame
(stata output)). Unfortunately the coefficient obtained from the diff_dummy variable
is not statistically significant given its p-value of 0.311. Nevertheless the positive
coefficient obtained shows a positive effect of the merger, which can be
interpreted as a confirmation, even if not entirely reliable, of all the previous
results.

44
7. Conclusions
This study provides significant empirical results on the ex post evaluation of two
merger cases that were cleared by the European Commission with remedies.
According to the results of the first part of this study the decision of the
Commission on the case DONG/ELSAM/E2 has had a negative impact on gas
prices both for consumers and industrial end users in Denmark compared to the
UK, starting from the first semester of year 2007.
This study may therefore provide evidence that the remedies imposed on the
concentration by the Commission played an important role in increasing
competition and passing a surplus to consumers through the reduction of prices in
the gas sector. The remedies would have therefore obtained an effect in the
downstream market, protecting consumers.
Nevertheless the evidence provided in this study needs to be seen through its
limitations which are: i) difficult selection of the control country; ii) lack of data at
the wholesale level which was the market that the Commission deemed to be
affected mostly by the merger iii) non-accountability of regulation changes and
other merger decisions that may have an impact on the study from country to
country.
Concerning the second part of the study it is possible to notice that the decision of
the Commission on the case Sanofi-Synthèlabo/Aventis has had a positive impact
on the production of patent applications in France compared to Italy, both for a
long and short time frame, and to Denmark.
This analysis can therefore provide evidence that the merger that the merger
cleared by the Commission and all the relative obligations to divest have had a
positive impact on innovation in the pharmaceutical sector.
Nevertheless the results of the second part of the study need to be understood
without forgetting some of the limitations of this study, namely: i) the drawbacks
related to the use of patent applications as a proxy for innovation output; ii) the
limited number of control variables that were available for the construction of the
45
model; iii) the negative aspects linked to the choice of counterfactual scenarios
which may not be perfectly comparable with the treated market.
This thesis contributes to the ex post evaluation of mergers literature by providing
significant results on two merger cases that were cleared by the Commission with
remedies. It confirms that in those two cases the Commission took the right
decision to the benefit of competition, prices and innovation.

46
Bibliography
Ahuja, G. and Katila, R. (2001) ‘Technological Acquisitions and the Innovation Performance of Acquiring Firms: A Longitudinal Study’, Strategic Management Journal 22: 197–220.
B. Buehler and G. Federico, ‘Recent developments in the assessment of efficiencies of mergers in the EU’, 2016m, Competition Law & Policy Debate, 2:1, pp. 64-75
BBC NEWS article 26 April, 2004. “Aventis and Sanofi set for merger”. Link to the website: http://news.bbc.co.uk/2/hi/business/3658639.stm
Bergman, “Quis Custodiet Ipsos Custodes or Measuring and Evaluating the Effectiveness of Competition Enforcement” (2008) 156 De Economist 389
C Perez, Technological Revolutions and Financial Capital (Edward Elgar, Cheltenham, UK and Northampton, MA, USA 2003).
C. Shapiro, ‘Competition and innovation: did Arrow hit the bull’s eye? The rate and direction of incentive activity revisited’, 2013, MIT Press
C., Genakos, T. Valettiand F. Verboven, ‘Evaluating market consolidation in mobile communications’, 15/09/2015, CERRE
Case COMP/ M.5984 – Intel/McAfee, Commission decision of 26 January 2011.
Case COMP/ M.6564 – ARM/GIESECKE & DEVRIENT/GEMALTO JV, Commission decision of 6 November 2012.
Case COMP/M.3868, DONG/Elsam/Energi E2, Commission Decision of 14 March 2006 notified under document number C(2006) 793.
Case No COMP/ M.6166 – Deutsche Börse/NYSE Euronext, Commission decision of 1 February 2012.
Case No COMP/ M.7278, General Electric/Alstom (Thermal Power- Renewable Power & Grid Business), Commission decision of 8 September 2015.
Case No COMP/ M.7326, Medtronic/Covidien, Commission decision of 28 November 2014.
Case No COMP/ M.7559, Pfizer/Hospira, Commission Decision of 4 August 2015.
Case No COMP/M.4854, TomTom/TeleAtlas, Commission decision of 14 May 2008.
Case No COMP/M.7275, Novartis/GlaxoSmithKline's oncology business, Commission decision of 28 January 2015
Cassiman, B., Colombo, M. G., Garrone, P., & Veugelers, R. (2005). The impact of M&A on the R&D process: An empirical analysis of the role of technological-and market-relatedness. Research Policy, 34(2), 195-220.

47
Chao, H., Oren, S., and Wilson, R. (2005). Restructured Electricity Markets: Reevaluation of Vertical Integration and Unbundling. Technical paper, EPRI
Colombo, M. G., & Rabbiosi, L. (2014). Technological similarity, post-acquisition R&D reorganization, and innovation performance in horizontal acquisitions. Research Policy, 43(6), 1039-1054.
Council Regulation (EC) No 139/2004 of 20 January 2004 on the control of concentrations between undertakings (the EC Merger Regulation), Official Journal L 24, 29.01.2004, p. 1-22.
DG Competition, ICF Consultancy Services in association with DIW Berlin (2015): “The economic impact of enforcement of competition policies on the functioning of EU energy markets: Non-technical Summary and Technical report”. Luxembourg: Publications Office of the European Union, 2016.
EU Competition policy brief, ‘EU merger control and innovation’, April 2016
FARRELL, Joseph, Paul A. PAUTLER, and Michael G. VITA. "Economics at the FTC: retrospective merger analysis with a focus on hospitals." Review of Industrial Organization 35, no. 4 (2009): 369-385.
Federico, G. 2011. ‘The competition effects of energy mergers: Analysis of Europe and Spain’. IESE Business School Occasional Paper Series.
Fiorio, C.V. and Fliorio, M. 2009. ‘The reform of network industries, privatization and consumers’ welfare; evidence from the EU15’. Working Paper n 2009-41. Available at: http://wp.demm.unimi.it/tl_files/wp/2009/DEMM-2009_041wp.pdf
Frantz, Simon. "Aventis-Sanofi: a good R&D merger?." Nature Reviews Drug Discovery 3.3 (2004): 193-194.
Gavil, Andrew I. "The Next Step in the Development of Ex Post Evaluation of Merger Review Procedures: Defining the State of the Art with Staged Options for Implementation." Browser Download This Paper (2011).
Guidelines on the assessment of horizontal mergers under the Council Regulation on the control of concentrations between undertakings, Official Journal C 31, 5.2.2004.
Guidelines on the assessment of non-horizontal mergers under the Council Regulation on the control of concentrations between undertakings, Official Journal C 265, 18.10.2008.
Hattori, T. and Tsutsui, M. 2004. ‘Economic impact of regulatory reforms in the electricity supply industry: a panel data analysis for OECD countries’. Energy Policy. 32(6): 823-832.
Hélène Dernis, Dominique Guellec, 2001. ‘Using Patent Counts For Cross-Country Comparisons Of Technology Output ‘; OECD 2001.
HOSKEN, D. (2011): "Ex post merger review: what is it and why do we need it?", Agenda March 2011, Oxera.
48
Hunger, D. 2003. ‘Analyzing gas and electric convergence mergers: A supply curve is worth a thousand words’. Journal of Regulatory Economics. 24(2): 161-173.
J. Schumpeter, ‘Capitalism, socialism and democracy’, third edition, 1942, Harper Perennial.
JB Baker and C Shapiro, “Reinvigorating Horizontal Merger Enforcement” in R Pitofsky (ed), How the Chicago School Overshot the Mark (Oxford University Press, 2008), 235
JC Ellert, “Mergers, Antitrust Law Enforcement and Stockholders Return” (1976) 31 The Journal of Finance 715
Joseph L. Bower and Clayton M. Christensen "Disruptive Technologies: Catching the Wave", 44. Harvard Business Review, 1995.
K. J. Arrow, ‘Economic welfare and the allocation of resources for invention’, in R. Nelson (ed.), ‘The rate and direction of economic activities: economic and social factors’, 1962
Kapoor R, Lim K. 2007. The impact of acquisitions on the productivity of inventors at semiconductor firms: a synthesis of knowledge-based and incentive-based perspectives. Academy of Management Journal 50(5): 1133–1155.
Kwoka, John. "Does Merger Control Work? A Retrospective on U.S. Enforcement Actions and Merger Outcomes." Antitrust Law Journal 78, no. 3(2013): 619-650.
M. Motta and E. Tarantino, ‘the effect of a merger on investments’, 2016, CEPR discussion paper series, DP11550
Makri M, Hitt MA, Lane PJ. 2010. Complementary technologies, knowledge relatedness, and invention outcomes in high technology mergers and acquisitions. Strategic Management Journal 31(6): 602–628.
Meyer, R. 2012. ‘Vertical economies and the cost of separating electricity supply – a review of theoretical and empirical literature’. Energy Journal. 33(4): 155-172.
Nevo, Aviv. "Mergers with differentiated products: The case of the ready-to-eat cereal industry." The RAND Journal of Economics (2000): 395-421.
Newbery, D. 2007. ‘What are the Issues in M&A arising from Electricity Market Restructuring?’.
O Budzinski and I Ruhmer, “Merger Simulation in Competition Policy: A Survey” (2010) 6 Journal of Competition Law & Economics 277
OECD (2015), “Glossary of terms”, in Frascati Manual 2015: Guidelines for Collecting and Reporting Data on Research and Experimental Development, OECD Publishing, Paris.
OECD, ‘Policy roundtables: dynamic efficiencies in merger analysis’, May 2008
49
OECD, ‘Policy roundtables: Impact Evaluation of Merger Decisions, Paris, June 2011.
Ornaghi, Carmine. "Mergers and innovation in big pharma." International Journal of Industrial Organization 27.1 (2009): 70-79.
Oliver Budzinski (2013) Impact Evaluation of Merger Control Decisions, European Competition Journal, 9:1, 199-224
P Buccirossi, L Ciari, T Duso, S-O Fridolfsson, G Spagnolo and C Vitale, “A Short Overview of a Methodology for the Ex-Post Review of Merger Control Decisions” (2008) 156 De Economist 453, 464–65.
P. Aghion, N. Bloom, N. Blundell, R. Griffith and P. Howitt, ‘Competition and innovation: an inverted-U relationship’, the Quarterly Journal of Economics, 2005, 120:2, pp. 701-28.
Pozzi, A. 2004. ‘Recent development and relevant issues in evolutionary economic and industrial dynamics’. Economia e Politica Industriale. 2004(123).
Rao, V. R., Yu, Y., & Umashankar, N. (2015). Anticipated Versus Actual Synergy in Merger Partner Selection and Post-Merger Innovation. Marketing Science.
Rey, P. and Tirole, J. 2004. ‘A primer on foreclosure. In: Armstrong, M., Porter, R. (Eds.), In: Handbook of Industrial Organization, vol. 3. North Holland, New York’. pp2145–2220.
RP McAfee and MA Williams, “Can Event Studies Detect Anticompetitive Mergers?” (1988) 28 Economics Letters 199
Rupérez-Micola, A., Banal- Estañol, A. and Bunn, D.W. 2008. ‘Incentives and coordination in vertically related energy markets’. Journal of Economic Behavior & Organization. 67(2): 381-393.
S Davies and P Ormosi, “Assessing Competition Policy: Methodologies, Gaps and Agenda for Future Research”, CCP Working Paper 10-19 (2010), 4–6.
Sears, J., & Hoetker, G. (2014). Technological overlap, technological capabilities, and resource recombination in technological acquisitions. Strategic Management Journal, 35(1), 48-67.
Statista, Statistics Portal 2017. “Main merger and acquisition (M&A) deals in Europe between 1999 and 2015 as of 2017, by deal value (in billion euros)”. Link to the website: https://www.statista.com/statistics/410871/largest-manda-transactions-europe/
Steiner, F. 2001. ‘Regulation, industry structure and performance in the electricity supply industry’. OECD Economic Sutides. 32: 143-182.
T. Curzon Price and M. Walker, ‘Incentives to innovate v short-term price effects in antitrust analysis’, Journal of European Competition Law & Practice, 2016, vol. 7, no. 7
50
Tiago Pires, Andre Trindadey (2015) Ex-post Evaluation of Mergers in the Supermarket Industry.
Valentini, G. (2012)‘Measuring the Effect of M&A on Patenting Quantity and Quality’, Strategic Management Journal 33: 336–46.
Valentini, G., & Di Guardo, M. C. (2012). M&A and the profile of inventive activity. Strategic Organization, 10(4), 384-405.
Verde, S. 2008. ‘Everybody merges with somebody – The wave of M&A’s in the energy industry and the EU merger policy’. Energy Policy. 36.3(2008): 1125-1133.
Veugelers, Reinhilde (2012) : Innovation in EU merger control: Walking the talk, Bruegel Policy Contribution, No. 2012/04
Wilkinson, C., Duso, T., Seldeslachts, J., Argentesi, E., Szücs, F. W., Banal-Estanol, A., ... & Andrews, M. (2016). The economic impact of the enforcement of competition policies on the functioning of EU energy markets. Commission Report.
Yu, Y., Umashankar, N., & Rao, V. R. (2015). Choosing the right target: Relative preferences for resource similarity and complementarity in acquisition choice. Strategic Management Journal.

51
Annexes
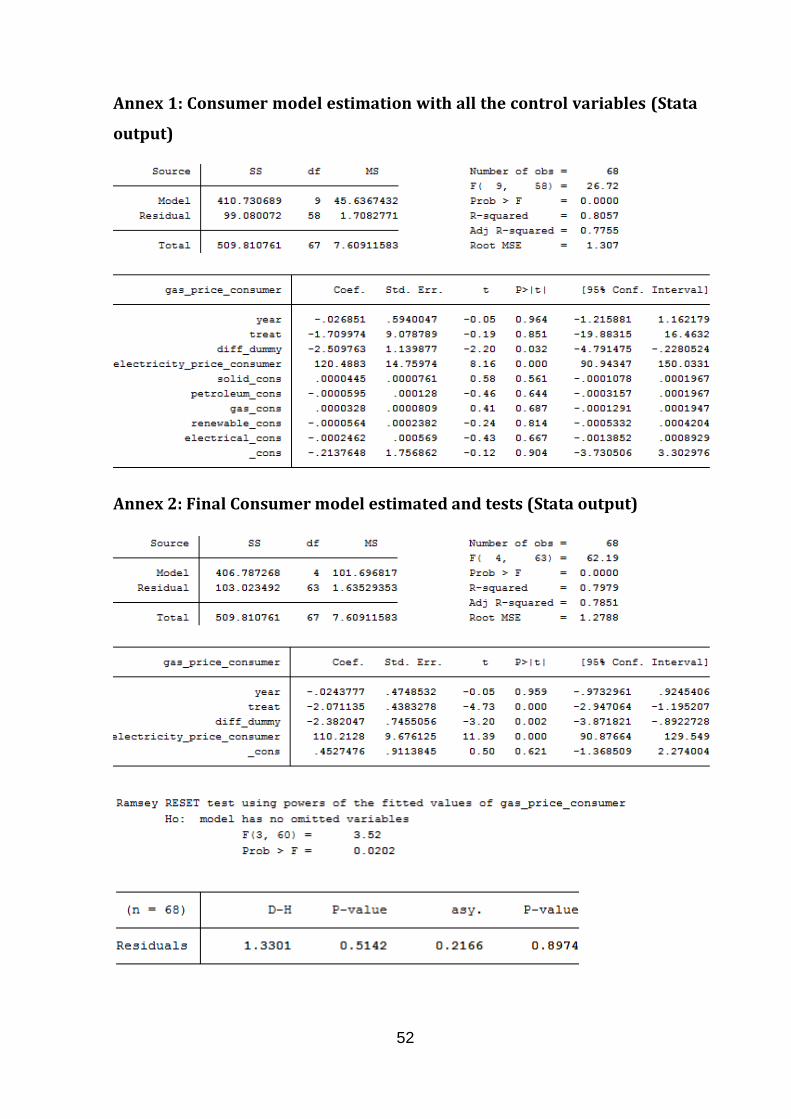
52
Annex 1: Consumer model estimation with all the control variables (Stata
output)
Annex 2: Final Consumer model estimated and tests (Stata output)

53
Annex 3: Industrial end users Model Estimation with all the control
variables and relative tests (Stata Output)
Annex 3: Final model estimated for industrial users and relative tests
(stata output)
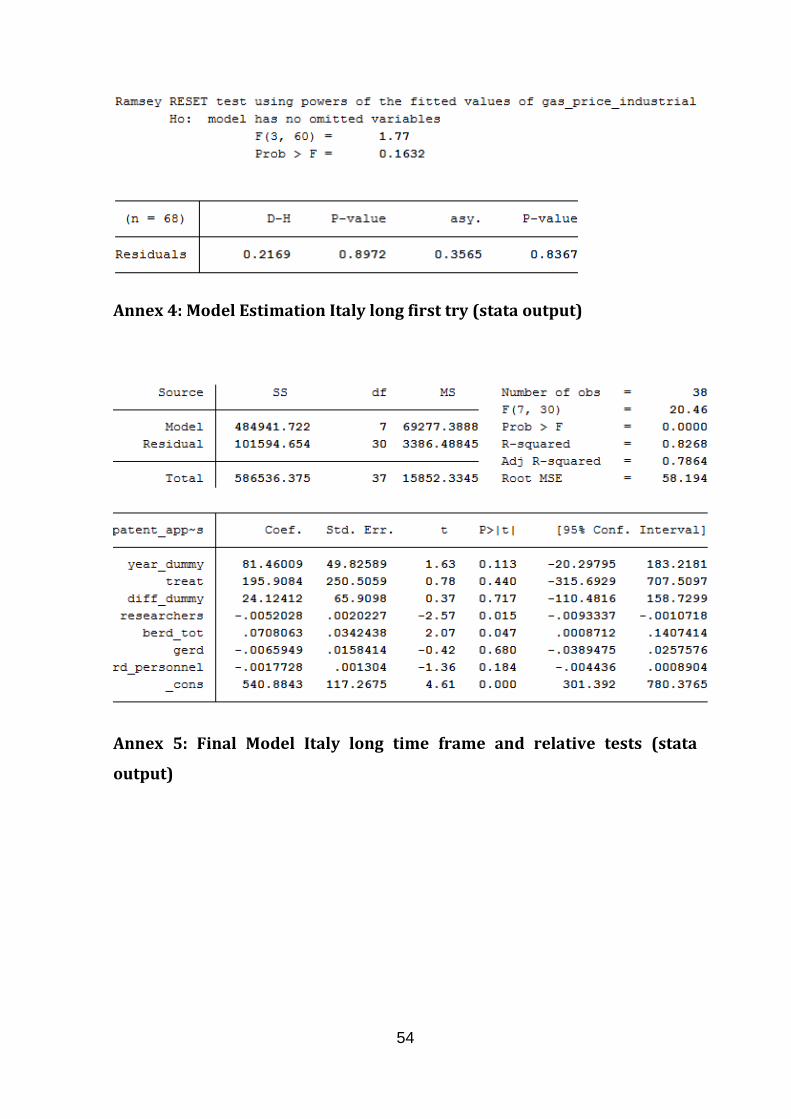
54
Annex 4: Model Estimation Italy long first try (stata output)
Annex 5: Final Model Italy long time frame and relative tests (stata
output)
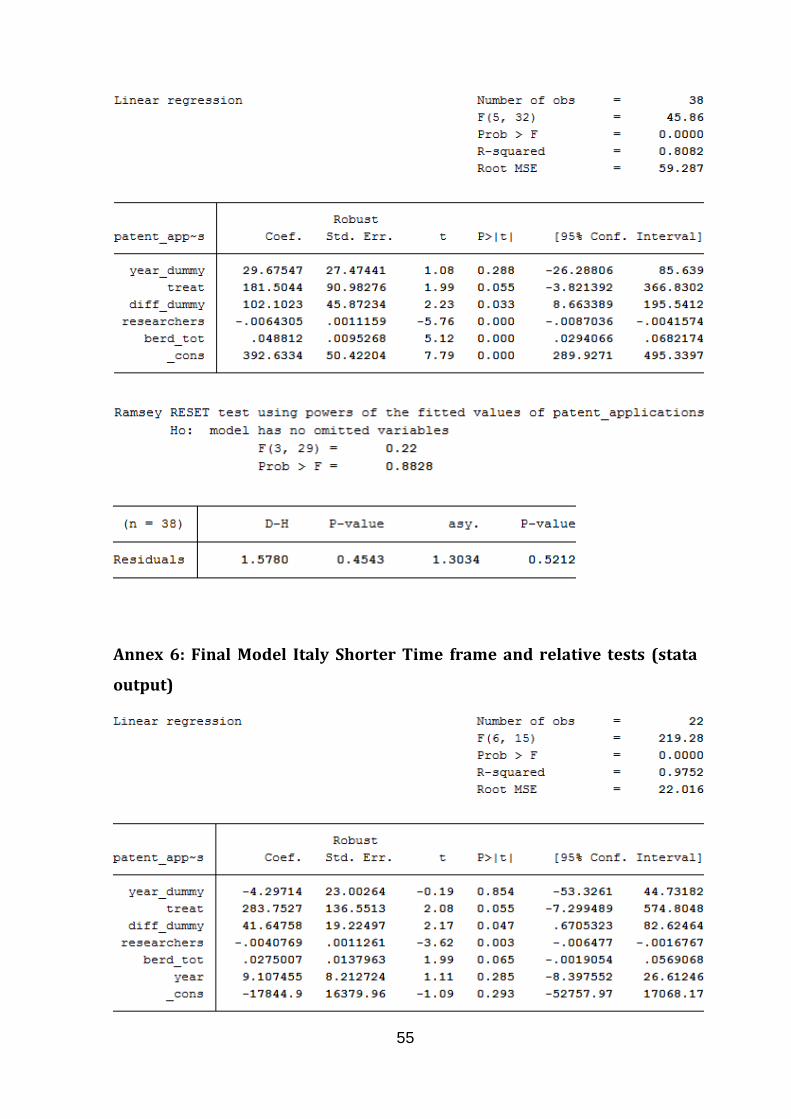
55
Annex 6: Final Model Italy Shorter Time frame and relative tests (stata
output)

56
Annex 7: Final model estimated for the placebo Denmark counterfactual
scenario in the long time frame and relative tests (stata output)
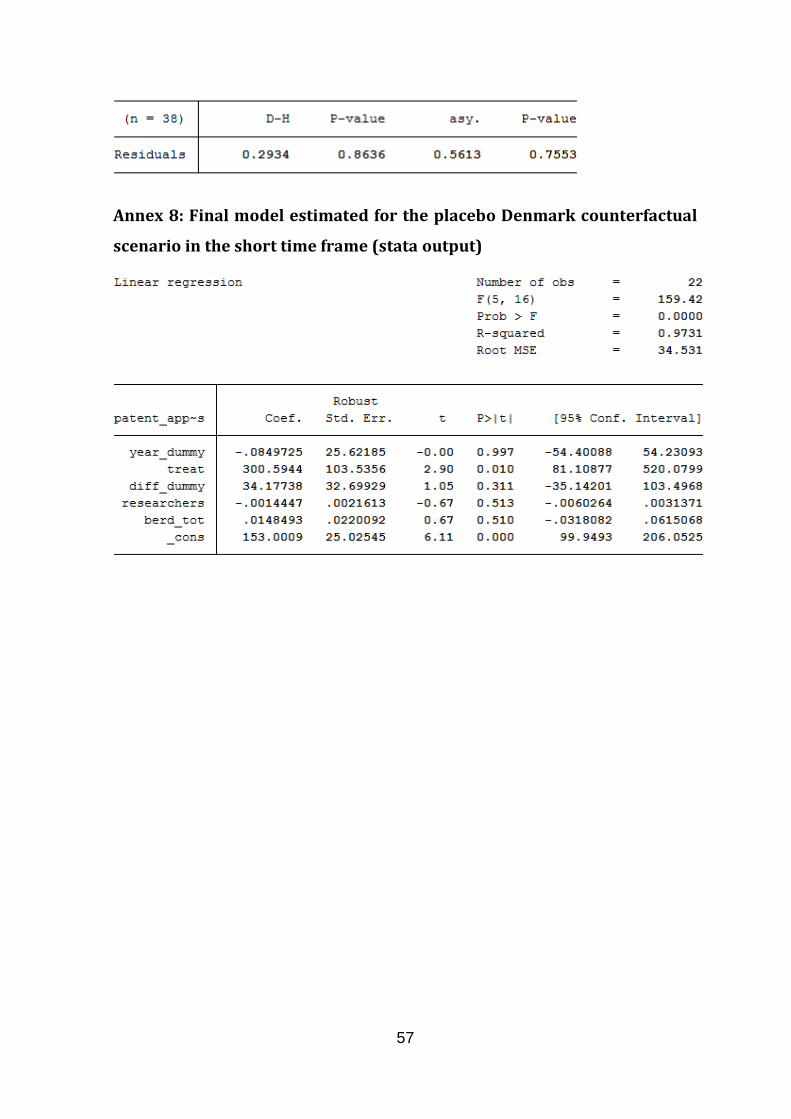
57
Annex 8: Final model estimated for the placebo Denmark counterfactual
scenario in the short time frame (stata output)