ex-vivo aml-culture initiating cells reflect patients...
TRANSCRIPT

GRIESSINGER et al. L-LTC-IC dynamics stratify AML risk group Page 1 of 11
Priority Reports
Frequency and dynamics of ex-vivo AML-culture initiating cells reflect patients’ outcome.
Emmanuel Griessinger1,2,*, Fernando Anjos-Afonso3,4, Jacques Vargaftig2, David C. Taussig5, François Lassailly2, Thomas Prebet6, Véronique Imbert1, Marielle Nebout1, Norbert Vey6, Christian Chabannon6, Andrew Filby7, Frederic Bollet-Quivogne8, John Gribben5, Jean-François Peyron1 and
Dominique Bonnet2,3*. AUTHORS AFFILIATION:
1Present address INSERM U1065, C3M, Team 4, Inflammation, Cancer, Cancer Stem Cells, Nice, France; 2 Cancer Research UK, London Research Institute, 3Francis Crick Institute, Haematopoeitic Stem Cell Laboratory, London, UK; 4Present address: Haematopoietic Signalling Group, European Cancer Stem Cell Research Institute, Cardiff University 5Centre of Haemato-Oncology, Cancer Research UK Clinical Centre, Barts Cancer Institute, St Bartholomew’s Hospital, Queen Mary University of London, London, UK; 6Haemato-Oncology Division, Paoli-Calmette Institute, Marseille, France; 7The Francis Crick Institute, FACS services; 8Neurophysiology Laboratory, Faculty of Medicine, Brussels University, Belgium. RUNNING TITLE:
L-LTC-IC dynamics stratify AML risk group
* CORRESPONDING AUTHORS:
Dr Emmanuel GRIESSINGER, INFLAMMATION, CANCER & CANCER STEM CELLS, INSERM U1065, C3M, Bâtiment Universitaire Archimed, 151 Route de Ginestière, BP 2 3194, 06204 NICE Cedex 3, France; Phone: +33(0) 4 8906 4318; Fax: +33(0)4 8906 4221 - e-mail: [email protected] - Website: http://www.unice.fr/c3m/EN/Equipe4.html Dr Dominique Bonnet, The Francis Crick Institute, Haematopoietic Stem Cell Laboratory, 44 Lincoln’s Inn Fields, London, UK; Phone: +44 (0) 20 7269 3282 – email: [email protected] - Website: http://www.crick.ac.uk/dominique-bonnet
Key terms: AML, LICs, L-LTC-ICs, co-culture, proliferation, CFSE, xenograft, prognosis.
Financial Supports: E. Griessinger was supported by Cancer Research UK internal fellowship and
by a grant from the Fondation de France. T. Prebet, N. Vey and C. Chabannon were supported by
grant INCa-DGOS-Inserm 6038 to the SIRIC PACA-Ouest. D Bonnet was funded by Cancer
Research UK, and by European grant (contract No:037632), J.F Peyron was supported by INSERM
and by a grant from the Cancéropôle PACA.
The authors have no conflict of interest to report.
Research. on February 15, 2020. © 2016 American Association for Cancercancerres.aacrjournals.org Downloaded from
Author manuscripts have been peer reviewed and accepted for publication but have not yet been edited. Author Manuscript Published OnlineFirst on March 9, 2016; DOI: 10.1158/0008-5472.CAN-15-2063

GRIESSINGER et al. L-LTC-IC dynamics stratify AML risk group Page 2 of 11
Abstract: (188 out of 250)
Acute Myeloid Leukemia (AML) is sustained by a sub-population of rare Leukemia initiating cells
(LICs) detected in the xenograft assay by their capacity to self-renew and to generate non-LICs in
vivo. The xenotransplantation model captures functional properties of LICs that have clinical
prognostic value. However, the long duration of this in vivo assay has hampered its use as a
prognostic tool. Here, we show using an ex vivo co-culture system, that intermediate and poor risk
AML patient samples at diagnosis have a 5 to 7 times higher frequency of Leukemic-Long Term
Culture-Initiating cells (L-LTC-ICs) compared to the good risk group. We defined a Fluorescence
Dilution Factor (FDF) parameter that monitors sample proliferation over 1 week and established a
strong correlation of this parameter with the L-LTC-IC frequency. A higher FDF was found for poor
prognostic AMLs or for samples capable of engrafting NSG mice compared to good risk AMLs or
non-engrafters. Importantly, FDF could classify normal karyotype-intermediate risk patients into 2
groups with a significant difference in their overall survival, thus making this non-genetic and non-
in vivo approach a new clinically relevant tool for a better diagnosis of AML patients.
Word count: 1981 /2500 words.
INTRODUCTION
Leukemia initiating cells (LICs) are functionally defined as SCID Leukemia-initiating cells
(SL-ICs) (1) in the xenograft assay by their capacity to initiate, propagate and maintain bulk
leukemia in vivo (2). SL-ICs functional studies showed a correlation between the xenograft capacity
of a sample as well as “stem cell gene signature” with poorer overall survival of the respective
patient (3, 4).
Additionally, an AML mathematical modelling of LICs proliferation was also separately shown to
correlate with the clinical outcome of the patients (5). Thus, LICs quantification and their monitoring
could have strong clinical applications especially for intermediate risk-normal karyotype AMLs that
account for approximately 60% of all AML patients. However, the recently described heterogeneous
Research. on February 15, 2020. © 2016 American Association for Cancercancerres.aacrjournals.org Downloaded from
Author manuscripts have been peer reviewed and accepted for publication but have not yet been edited. Author Manuscript Published OnlineFirst on March 9, 2016; DOI: 10.1158/0008-5472.CAN-15-2063

GRIESSINGER et al. L-LTC-IC dynamics stratify AML risk group Page 3 of 11
SL-IC phenotypes (4, 6-8) combined with the long-duration of the in vivo assay have prevented the
use of the xenograft assay as a prognostic tool. We have recently optimized a niche-like co-culture
system capable of maintaining SL-IC ex vivo and demonstrated that the frequency of leukemic
long-term culture initiating cells (L-LTC-ICs) is a reliable functional read-out for monitoring the
activity of LICs (9). Here we combine this assay with a cell proliferation analysis to demonstrate that
the expansion rate of L-LTC-ICs in this culture system strongly correlates with patient clinical
outcome.
MATERIALS AND METHODS
Cells
AML cells were obtained at St Bartholomew’s Hospital (UK) and from the Institutional Tumor Bank
at Institut Paoli-Calmettes (Comprehensive Cancer Centre in Marseille, France). For both sources,
ethical approvals have been granted (via the East London Ethical community or under authorization
#AC-2013-1905 granted by the French Ministry of Research respectively). Details of patient
samples are listed in Table S1. Co-culture experiments were performed as previously described (9)
on confluent MS-5 monolayers. The stromal cell line MS-5 was purchased from German Collection
of Microorganisms and Cell Cultures (DSMZ, http://www.dsmz.de; Braunschweig, Germany) in
2012 and were maintained in IMDM 10% FCS + 2 mM L-glutamine and used between passage 3 to
5.
Fluorescence Dilution Factor (FDF)
AML cells were stained with 0.8µM carboxyfluorescein diacetate, succinimidyl ester (CFSE)
(Invitrogen, UK). Cells were washed and incubated on pre-established confluent MS-5. CFSE
median fluorescence (MFI) was measured by FACS at 18h and day 7 on viable (Annexin V and
DAPI negative) human hematopoietic cells (CD45 positive and Sca-1 negative). FDF was defined
Research. on February 15, 2020. © 2016 American Association for Cancercancerres.aacrjournals.org Downloaded from
Author manuscripts have been peer reviewed and accepted for publication but have not yet been edited. Author Manuscript Published OnlineFirst on March 9, 2016; DOI: 10.1158/0008-5472.CAN-15-2063

GRIESSINGER et al. L-LTC-IC dynamics stratify AML risk group Page 4 of 11
as the ratio of the 18h CFSE MFI divided by the 1-week CFSE MFI (See supplemental information
for more details).
Statistics
Data were analyzed for statistical significance using the Mann-Whitney unpaired two tail test or the
one-way Anova test. Linear or non-linear regression trend lines were performed with GraphPad
Prism software. A non-parametric spearman test was applied for correlation. Spearman's rank
correlation coefficient ( ) is shown. Observed differences were regarded as statistically significant if
the calculated two-sided P value was below 0.05.
Supplementary information are included in supplemental Methods, found on the CR website.
RESULTS AND DISCUSSION
We analyzed 92 de novo AML patients classified as favorable (n=22), intermediate (n=54),
and poor (n=16) prognostic groups according to the British MRC and French BGMT classifications
(Supplemental Table S1). We performed ex vivo limiting dilution analyses to determine the initial
frequencies of leukemic long-term culture-initiating cells (L-LTC-IC 1° frequency)(see schematic
Figure 1A). We observed a high variability ranging from 1 L-LTC-IC in 10 to 105 bulk AML plated
cells and noticed that the intermediate and poor risk AMLs had a 5 to 7 times higher frequency as
compared to the favorable group (Figure 1B, left panel). Cell counts at 5-weeks were found to be
different depending on AML risk groups (Figure 1B, right panel). Importantly, for all samples we
also correlated the L-LTC-IC 1° frequency (Figure 1C) and the 5-week fold expansion (Figure 1D)
with the patients’ overall survival (OS). By plotting the L-LTC-IC 1° frequencies against the 5-week
fold expansion, we further confirmed that the very modest ex vivo proliferation of AMLs depends on
the L-LTC-IC compartment size of the sample (Figure 2A). This correlation was not seen after a 1-
week culture period (Figure 2B). This suggests either that L-LTC-ICs did not sustain the leukemic
Research. on February 15, 2020. © 2016 American Association for Cancercancerres.aacrjournals.org Downloaded from
Author manuscripts have been peer reviewed and accepted for publication but have not yet been edited. Author Manuscript Published OnlineFirst on March 9, 2016; DOI: 10.1158/0008-5472.CAN-15-2063

GRIESSINGER et al. L-LTC-IC dynamics stratify AML risk group Page 5 of 11
expansion during the first week or more likely that cell death exceeded the L-LTC-IC-driven
leukemic expansion. To address this question we quantified secondary L-LTC-ICs (LTC-IC 2°) after
replating cells that have been cultured for one week (see schematic Figure 1A). We observed that
the median proportion of L-LTC-ICs increased on average 7.8 times (Figure 2C, left panel; n=42,
P<0.001). In parallel, we quantified the loss of cellularity during the first week to be 60% suggesting
that the 7.8 times increase in L-LTC-ICs proportion seen was due to the ongoing proliferation of
some LICs. This was confirmed by calculating the L-LTC-IC absolute count, which increases by a
factor 4.25 (n=16, P<0.05) (Figure 2C right panel). Consistently, the intermediate and poor risk
samples maintained their higher proportion of L-LTC-ICs as compared to the favorable risk group
after replating (Figure 2D). Thus L-LTC-IC self-renewal capacity is an intrinsic biological feature of
samples that can be monitored over a one-week culture period.
We next wondered whether a shorter and simpler test, using CFSE staining to track cell
division, could be implemented to stratify sample risk groups. However, a high-resolution of division
peaks could not be achieved for the majority of samples due to intra-sample morphological
heterogeneity, as the incorporation of CFSE depends on cell size (For more details see
Supplementary Material and Method and Supplemental Figure 1A to C). Moreover, we could
not use cell sorting to reduce biological heterogeneity without the possibility of biasing the cell
population studied (10). Since AML samples usually have a poor viability at thawing and at later
points (See details of influence of cell viability in Supplementary Fig. 2A- 4C) we measured the
median dye dilution of the non-apoptotic leukemic cell population (non-DAPI, Non Annexin positive
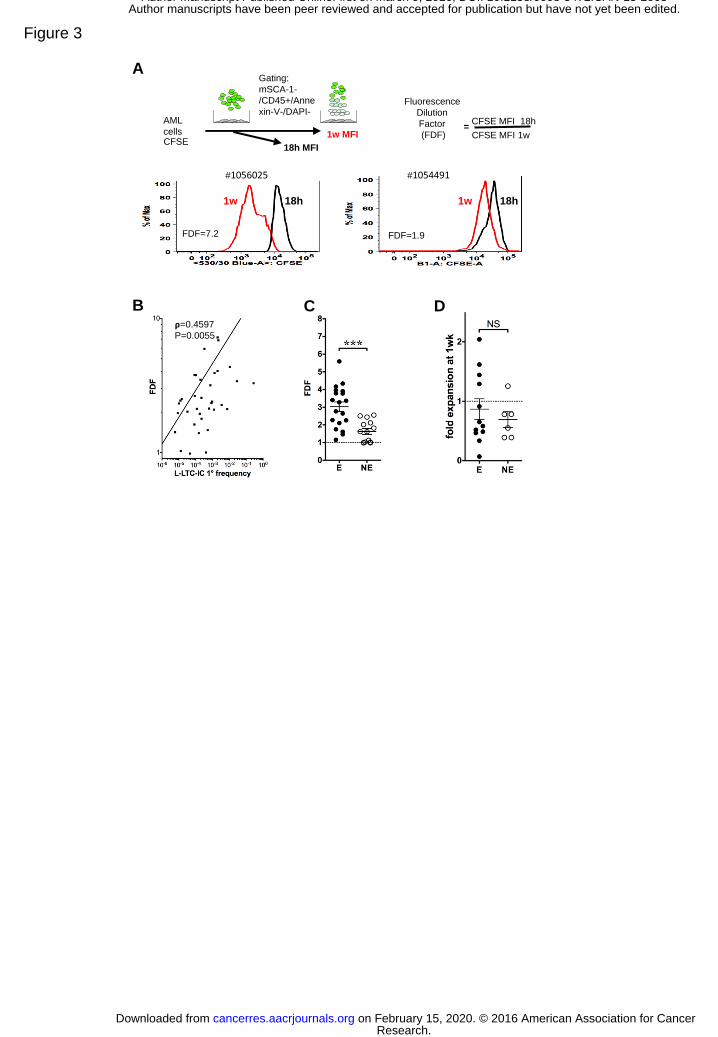
fraction, See Supplemental Fig 2B and C). We then defined the Fluorescence Dilution Factor
(FDF) parameter as the ratio of the median fluorescence intensity (MFI) at the start of the analysis
by the MFI measured after a 1-week of co-culture (Figure 3A and Supplemental Figure 3).
Heterogeneous FDF values ranging from 1 to 10.2 with a mean of 3.0 were determined for 80 AML
samples. We observed a strong correlation between FDF and the L-LTC-IC frequency (Figure 3B)
or the proliferation index (Supplemental Figure 4A), strongly supporting the notion that the FDF
Research. on February 15, 2020. © 2016 American Association for Cancercancerres.aacrjournals.org Downloaded from
Author manuscripts have been peer reviewed and accepted for publication but have not yet been edited. Author Manuscript Published OnlineFirst on March 9, 2016; DOI: 10.1158/0008-5472.CAN-15-2063
GRIESSINGER et al. L-LTC-IC dynamics stratify AML risk group Page 6 of 11
reports leukemic stem/progenitors dynamics ex vivo. The FDF did not correlate with bulk leukemic
expansion or bulk sample viability (Supplemental Figure 4B and C). Thus, the FDF parameter is
informative of sub-population dynamics even when cell death over exceeds proliferation. Of note,
the FDF parameter cannot distinguish between a high-proportion of slowly dividing cells versus a
small fraction of highly dividing ones.
Most good risk AML samples are devoid of xenograft potential (4). Among our cohort, 32
samples were tested for their ability to propagate AML in a xenograft assay in NSG mice. We
compared the FDF values of NSG mice Engrafter (E) and Non-Engrafter (NE) AML samples. A
higher FDF was found for 18 E compared to 14 NE samples (Figure 3C), which further suggests
that the FDF index reports on the actual LICs dynamics ex vivo. On the other hand, no significant
differences were seen between the E/NE groups simply using fold cell expansion as parameter
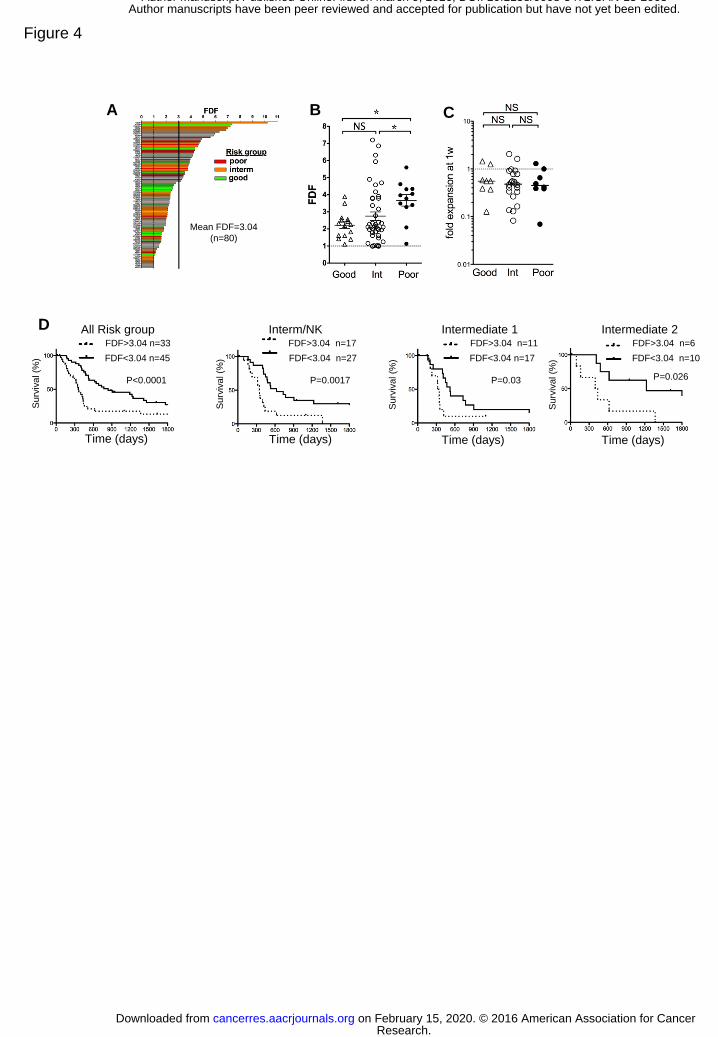
(Figure 3D). 14 of the 19 good risk samples had a FDF below the mean value of 3.0 of this cohort
while 11 of the 15 poor risk AMLs tested were above the mean (Figure 4A). Intermediate risk-
normal karyotype AML samples were stratified across the whole range. Poor prognostic AMLs had
a significantly higher FDF values compared to good risk and intermediate risk group AMLs whereas
no statistical differences were seen between good risk and intermediate risk groups (Figure 4B).
Again, using cell expansion as parameter we were unable to detect any differences between the 3
groups (Figure 4C). Importantly, patients OS was significantly reduced in AML with high FDF (>3.0)
when compared with AML cases with low FDF (<3.0, Figure 4D, left panel). Since the
intermediate-risk group contains patients with variable outcomes we evaluated the usefulness of
the FDF index to correlate with their outcome. Using the same cut-off value we could divide the
patient cohort and show for 17 AML with high FDF a statistically significantly lower survival
compared to 27 AML with low FDF (Figure 4D, second panel from the left). Recently, the
combined mutational status of FLT3 and NPM1 has been found to stratify intermediate risk/normal
karyotype group in low molecular risk (NPM1mut FLT3wt) intermediate 1 and high molecular risk
(FLT3-ITD or NPM1wt FLT3wt) intermediate 2 groups (11). High FDF negatively correlated with a
Research. on February 15, 2020. © 2016 American Association for Cancercancerres.aacrjournals.org Downloaded from
Author manuscripts have been peer reviewed and accepted for publication but have not yet been edited. Author Manuscript Published OnlineFirst on March 9, 2016; DOI: 10.1158/0008-5472.CAN-15-2063

GRIESSINGER et al. L-LTC-IC dynamics stratify AML risk group Page 7 of 11
lower overall survival in these two sub-groups (Figure 4D, first and second panel from the right).
FDF measurements could also refine good and poor risk groups, although the survival curve
between low and high FDF was not significant based on the small outlier number of patients in
these two groups (Supplemental Figure 5).
The advance of next generation sequencing for screening mutations in AML patients has
improved patients’ stratification, nevertheless this screening is not yet a bedside standardized
procedure. On the other hand, the quantification of LICs as well as the presence of a “stem cell
signature” have been shown to provide information on the clinical outcome of patients but are hard
to use in a routine setting. Here, our data demonstrate that the ex vivo frequency of L-LTC-IC and
its expansion dynamics reflect the intrinsic biology of the LICs. We further show that
monitoring AML-culture initiating cells expansion after 1 week could help predict the prognosis of
AML patients without the need of in vivo experiments. Here, our data demonstrate that the ex vivo
frequency of L-LTC-IC and its expansion dynamics reflects the intrinsic biology of LICs. We further
show that monitoring AML-culture initiating cell expansion after 1 week could help predict the
prognosis of AML patients without the need of in vivo experiments.
AKNOWLEDGEMENTS
Authors are indebted to patients who granted permission to use their samples for research. We
thank Finlay McDougall for providing diagnostic information, and all personnel at the Institut Paoli-
Calmettes Tumour Bank for the access of anonymized samples and clinical data. We are grateful to
Stuart Horswell for statistical analysis and Dr Katie Foster for proofreading the manuscript. This
work is dedicated in memory of Dr François Lassailly.
REFERENCES
Research. on February 15, 2020. © 2016 American Association for Cancercancerres.aacrjournals.org Downloaded from
Author manuscripts have been peer reviewed and accepted for publication but have not yet been edited. Author Manuscript Published OnlineFirst on March 9, 2016; DOI: 10.1158/0008-5472.CAN-15-2063

GRIESSINGER et al. L-LTC-IC dynamics stratify AML risk group Page 8 of 11
1. Bonnet, D. & Dick, J.E. Human acute myeloid leukemia is organized as a hierarchy that
originates from a primitive hematopoietic cell. Nat Med. 1997: 3, 730-737.
2. Dick, J.E. Stem cell concepts renew cancer research. Blood 2008: 112, 4793-4807.
3. Pearce, D.J., Taussig D, Zibara K, Smith L.L, Ridler C.M, Preudhomme C et al. AML
engraftment in the NOD/SCID assay reflects the outcome of AML: implications for our
understanding of the heterogeneity of AML. Blood 107, 1166-1173 (2006).
4. Eppert, K., Takenaka K, Lechman ER, Waldron L, Nilsson B, van Galen P, et al. Stem cell
gene expression programs influence clinical outcome in human leukemia. Nat Med 17, 1086-1093
(2011).
5. Stiehl, T., Baran, N., Ho, A.D. & Marciniak-Czochra, A. Cell Division Patterns in Acute
Myeloid Leukemia Stem-like Cells Determine Clinical Course: A Model to Predict Patient Survival.
Cancer Res 75, 940-949 (2015).
6. Taussig DC, Miraki-Moud F, Anjos-Afonso F, Pearce DJ, Allen K, Ridler C, et al. Anti-CD38
antibody-mediated clearance of human repopulating cells masks the heterogeneity of leukemia-
initiating cells. Blood. 2008;112:568-75.
7. Taussig, D.C., Vargaftig J, Miraki-Moud F, Griessinger E, Sharrock K, Luke T et al.
Leukemia-initiating cells from some acute myeloid leukemia patients with mutated nucleophosmin
reside in the CD34(-) fraction. Blood 2010: 115, 1976-1984.
8. Sarry, J.E., Murphy K, Perry R, Sanchez PV, Secreto A, Keefer C, et al. Human acute
myelogenous leukemia stem cells are rare and heterogeneous when assayed in
NOD/SCID/IL2Rgammac-deficient mice. J Clin Invest 121, 384-395 (2011).
Research. on February 15, 2020. © 2016 American Association for Cancercancerres.aacrjournals.org Downloaded from
Author manuscripts have been peer reviewed and accepted for publication but have not yet been edited. Author Manuscript Published OnlineFirst on March 9, 2016; DOI: 10.1158/0008-5472.CAN-15-2063
GRIESSINGER et al. L-LTC-IC dynamics stratify AML risk group Page 9 of 11
9. Griessinger E, Anjos-Afonso F, Pizzitola I, Rouault-Pierre K, Vargaftig J, Taussig D, et al. A
Niche-Like Culture System Allowing the Maintenance of Primary Human Acute Myeloid Leukemia-
Initiating Cells: A New Tool to Decipher Their Chemoresistance and Self-Renewal Mechanisms.
Stem cells translational medicine. 2014; 3: 520-9.
10. Begum J, Day W, Henderson C, Purewal S, Cerveira J, Summers H, et al. A method for
evaluating the use of fluorescent dyes to track proliferation in cell lines by dye dilution. Cytometry
Part A : the journal of the International Society for Analytical Cytology. 2013;83:1085-95.
11. Dohner, H., Estey EH, Amadori S, Appelbaum FR, Büchner T, Burnett AK, et al. Diagnosis
and management of acute myeloid leukemia in adults: recommendations from an international
expert panel, on behalf of the European LeukemiaNet. Blood 115, 453-474 (2010).
FIGURE LEGENDS
Figure 1: AML long-term culture potential correlates with patient prognostic risk and clinical
outcome. A: Flow chart illustrating the experimental design for B–D. B (left panel): Frequency of
L-LTC-IC in primary plating (L-LTC-IC 1°) for good, intermediate/normal karyotype and poor risk
AML patients. B (right panel): Fold expansion of AML population after 5 weeks of co-culture with
MS-5 for good, intermediate/normal karyotype and poor risk AML patients. C, D: L-LTC-IC 1°
frequency (C) or 5-weeks AML fold expansion (D) as compared to patient’s Overall Survival (n=45).
Black line shows experimentally derived non-linear regression trend line. Mann-Whitney unpaired
two-tail test or the one-way Anova test was applied. * p< 0.05, **p<0.01, NS p>0.05.
Figure 2: L-LTC-IC self-renew during the first week of culture with amplitude related to
patient prognosis.
Research. on February 15, 2020. © 2016 American Association for Cancercancerres.aacrjournals.org Downloaded from
Author manuscripts have been peer reviewed and accepted for publication but have not yet been edited. Author Manuscript Published OnlineFirst on March 9, 2016; DOI: 10.1158/0008-5472.CAN-15-2063

GRIESSINGER et al. L-LTC-IC dynamics stratify AML risk group Page 10 of 11
For schematic see Flow chart Fig 1A. A- B: 5-weeks or 1-week AML fold expansion plotting
against L-LTC-IC 1° frequency (n= 43 and 22 respectively). A.Thin black line shows experimental
derived non-linear regression trend line with 95% confidence band (dashed lines). For A, B a non-
parametric Spearman correlation test was applied. C: Frequency (left panel) (n=73) and absolute
count (right panel) (n=16) of L-LTC-IC in primary and secondary plating. D: Frequency of L-LTC-IC
in secondary plating (L-LTC-IC 2°) for good, intermediate/normal karyotype and poor risk AML
samples. Mann-Whitney unpaired or paired two-tail test (C) or the one-way Anova test (D) was
applied. * p< 0.05, **p<0.01, NS p>0.05.
Figure 3: One week Fluorescence Dilution Factor (FDF) correlates with L-LTC-IC and
predicts Engrafter versus Non-Engrafter in NSG mice.
A: Flow chart illustrates the experimental procedure to define the FDF values (top Panel) (See
supplemental Fig. 2 for FACS gating and cytometer calibration strategies) and (Bottom panel)
Representation of 18h and 1-week overlay CFSE Fluorescence profiles of one patient with high
FDF (left panel) and one patient with low FDF value (right panel). B: FDF plot against the L-LTC-IC
frequency (n=36). Thin black line shows experimental derived non-linear regression trend line. Non-
parametric Spearman correlation test was applied. C: FDF value between NSG mice engrafter (E)
and non-engrafter (NE) AML samples (E, n=18; NE, n=14). D: Fold expansion at 1-week for E and
NE samples.
Figure 4: Fluorescence Dilution Factor (FDF) predicts clinical outcome.
A: FDF for 80 AML samples. Poor risk (red bars) n=15; intermediate/normal karyotype (orange
bars) n=46; good risk (green bars) n=19. Black line shows the mean FDF value (=3.04). Dashed
line represents FDF=1, no dilution from the input fluorescence. B: FDF value comparison for
different risk group AML. C: 1-week fold expansion at 1-week for different risk group. D: Patients
Research. on February 15, 2020. © 2016 American Association for Cancercancerres.aacrjournals.org Downloaded from
Author manuscripts have been peer reviewed and accepted for publication but have not yet been edited. Author Manuscript Published OnlineFirst on March 9, 2016; DOI: 10.1158/0008-5472.CAN-15-2063

GRIESSINGER et al. L-LTC-IC dynamics stratify AML risk group Page 11 of 11
with low FDF have better overall survival than high FDF patients. Kaplan-Meier 5 years survival
curves based on the mean FDF cut-off value determined in (E). Patients who underwent an
allograft were excluded from analysis. (Left Panel): All risk group; (Second Panel from the left):
Intermediate risk normal karyotype group. (Second Panel from the Right): Intermediate 1 group,
NPM1mut/FLT3wt cytogenetically normal AML; (First Panel from the Right) Intermediate 2,
NPM1wt or FLT3ITD cytogenetically normal AML. Mantel-Cox log rank test was applied for panel
D. One-way Anova test was applied for (B,C). *P<0.05, NS P>0.05.
Research. on February 15, 2020. © 2016 American Association for Cancercancerres.aacrjournals.org Downloaded from
Author manuscripts have been peer reviewed and accepted for publication but have not yet been edited. Author Manuscript Published OnlineFirst on March 9, 2016; DOI: 10.1158/0008-5472.CAN-15-2063

AML
cells
L-LTC-IC 2° Freq
sorting
1st
plating 2nd
plating
2° LDA
1w
Fold expansion
L-LTC-IC 1° Freq
B A
Figure 1
5w
1° Limiting
Dilution
Assay
(1° LDA)
5w
Fold expansion
. . .
.
𝞀=-0.3664
P< 0.05 D 𝞀=-0.3776
P< 0.05 C
Research. on February 15, 2020. © 2016 American Association for Cancercancerres.aacrjournals.org Downloaded from
Author manuscripts have been peer reviewed and accepted for publication but have not yet been edited. Author Manuscript Published OnlineFirst on March 9, 2016; DOI: 10.1158/0008-5472.CAN-15-2063

Figure 2
B A 𝞀=0,7073
P< 0.0001 𝞀=0,26
P=0.24
C D
Research. on February 15, 2020. © 2016 American Association for Cancercancerres.aacrjournals.org Downloaded from
Author manuscripts have been peer reviewed and accepted for publication but have not yet been edited. Author Manuscript Published OnlineFirst on March 9, 2016; DOI: 10.1158/0008-5472.CAN-15-2063
AML
cells
CFSE
18h MFI
1w MFI CFSE MFI 1w
CFSE MFI 18h
Fluorescence
Dilution
Factor
(FDF) =
Gating:
mSCA-1-
/CD45+/Anne
xin-V-/DAPI-
Figure 3
𝞀=0.4597
P=0.0055
C B
A
D
1wk
FDF=7.2
#1056025
FDF=1.9
#1054491
18h
1w
18h
1w
Research. on February 15, 2020. © 2016 American Association for Cancercancerres.aacrjournals.org Downloaded from
Author manuscripts have been peer reviewed and accepted for publication but have not yet been edited. Author Manuscript Published OnlineFirst on March 9, 2016; DOI: 10.1158/0008-5472.CAN-15-2063
Time (days)
Su
rviv
al (%
)
FDF>3.04 n=17
FDF<3.04 n=27
P<0.0001 P=0.0017
FDF>3.04 n=33
FDF<3.04 n=45
All Risk group Interm/NK Intermediate 1 D
Time (days)
Su
rviv
al (%
)
Time (days)
Su
rviv
al (%
)
Time (days)
Su
rviv
al (%
)
Intermediate 2
P=0.03
FDF>3.04 n=11
FDF<3.04 n=17
P=0.026
FDF>3.04 n=6
FDF<3.04 n=10
Mean FDF=3.04
(n=80)
B A C
Figure 4
Research. on February 15, 2020. © 2016 American Association for Cancercancerres.aacrjournals.org Downloaded from
Author manuscripts have been peer reviewed and accepted for publication but have not yet been edited. Author Manuscript Published OnlineFirst on March 9, 2016; DOI: 10.1158/0008-5472.CAN-15-2063
Published OnlineFirst March 9, 2016.Cancer Res Emmanuel Griessinger, Fernando Anjos-Afonso, Jacques Vargaftig, et al. leukemia patientsshort-term ex vivo culture informs outcomes in acute myeloid Frequency and dynamics of leukemia-initiating cells during
Updated version
10.1158/0008-5472.CAN-15-2063doi:
Access the most recent version of this article at:
Material
Supplementary
http://cancerres.aacrjournals.org/content/suppl/2016/03/09/0008-5472.CAN-15-2063.DC1
Access the most recent supplemental material at:
Manuscript
Authoredited. Author manuscripts have been peer reviewed and accepted for publication but have not yet been
E-mail alerts related to this article or journal.Sign up to receive free email-alerts
Subscriptions
Reprints and
To order reprints of this article or to subscribe to the journal, contact the AACR Publications
Permissions
Rightslink site. Click on "Request Permissions" which will take you to the Copyright Clearance Center's (CCC)
.http://cancerres.aacrjournals.org/content/early/2016/03/09/0008-5472.CAN-15-2063To request permission to re-use all or part of this article, use this link
Research. on February 15, 2020. © 2016 American Association for Cancercancerres.aacrjournals.org Downloaded from
Author manuscripts have been peer reviewed and accepted for publication but have not yet been edited. Author Manuscript Published OnlineFirst on March 9, 2016; DOI: 10.1158/0008-5472.CAN-15-2063