examination of orthodontic expenditures and trends in the
TRANSCRIPT

Hung et al. BMC Oral Health (2021) 21:268 https://doi.org/10.1186/s12903-021-01629-6
RESEARCH
Examination of orthodontic expenditures and trends in the United States from 1996 to 2016: disparities across demographics and insurance payersMan Hung1,2*, Sharon Su1, Eric S. Hon3, Edgar Tilley1, Alex Macdonald1, Evelyn Lauren4, Glen Roberson1 and Martin S. Lipsky1,5
Abstract
Background: Orthodontics prevent and treat facial, dental, and occlusal anomalies. Untreated orthodontic problems can lead to significant dental public health issues, making it important to understand expenditures for orthodontic treatment. This study examined orthodontic expenditures and trends in the United States over 2 decades.
Methods: This study used data collected by the Medical Expenditure Panel Survey to examine orthodontic expendi-tures in the United States from 1996 to 2016. Descriptive statistics for orthodontic expenditures were computed and graphed across various groups. Trends in orthodontic expenditures were adjusted to the 2016 United States dollar to account for inflation and deflation over time. Sampling weights were applied in estimating per capita and total expenditures to account for non-responses in population groups.
Results: Total orthodontic expenditures in the United States almost doubled from $11.5 billion in 1996 to $19.9 bil-lion in 2016 with the average orthodontic expenditure per person increasing from $42.69 in 1996 to $61.52 in 2016. Black individuals had the lowest per capita orthodontic visit expenditure at $30.35. Out-of-pocket expenses repre-sented the highest total expenditure and although the amount of out-of-pocket expenses increased over the years, they decreased as a percentage of total expenditures. Public insurance increased the most over the study period but still accounted for the smallest percentage of expenditures. Over the course of the study, several annual decreases were interspersed with years of increased spending
Conclusion: While government insurance expenditure increased over the study period, out of pocket expenditures remained the largest contributor. Annual decreases in expenditure associated with economic downturns and result from the reliance on out-of-pocket payments for orthodontic care. Differences in spending among groups suggest disparities in orthodontic care among the US population.
Keywords: Orthodontic expenditure, MEPS, Insurance coverage, Dental, Oral health, Orthodontics
© The Author(s) 2021. Open Access This article is licensed under a Creative Commons Attribution 4.0 International License, which permits use, sharing, adaptation, distribution and reproduction in any medium or format, as long as you give appropriate credit to the original author(s) and the source, provide a link to the Creative Commons licence, and indicate if changes were made. The images or other third party material in this article are included in the article’s Creative Commons licence, unless indicated otherwise in a credit line to the material. If material is not included in the article’s Creative Commons licence and your intended use is not permitted by statutory regulation or exceeds the permitted use, you will need to obtain permission directly from the copyright holder. To view a copy of this licence, visit http:// creat iveco mmons. org/ licen ses/ by/4. 0/. The Creative Commons Public Domain Dedication waiver (http:// creat iveco mmons. org/ publi cdoma in/ zero/1. 0/) applies to the data made available in this article, unless otherwise stated in a credit line to the data.
BackgroundOrthodontics is the field in dentistry that diagnoses, pre-vents, and treats facial, dental, and occlusal anomalies. If orthodontic conditions are left untreated, these anoma-lies can lead to significant dental problems such as tooth decay and periodontal disease, thus highlighting the
Open Access
*Correspondence: [email protected] Roseman University of Health Sciences College of Dental Medicine, 10894 S. River Front Parkway, South Jordan, UT 84095, USAFull list of author information is available at the end of the article

Page 2 of 10Hung et al. BMC Oral Health (2021) 21:268
importance of treatment. Many studies demonstrate that occlusal anomalies can predispose individuals to local-ized periodontal problems in cases of traumatic over-bites, crossbites, overjets that increase risk for trauma, and tooth positioning that can comprise periodontal sup-port [1]. Periodontal disease is a major cause of tooth loss and is independently associated with several systemic chronic inflammatory diseases [2]. Orthodontic interven-tion corrects these occlusal anomalies and may optimize periodontal therapy outcomes by correctly positioning teeth to increase the thickness of surrounding bone and tissues and improving gingival recession [3, 4]. Addition-ally, malocclusion negatively affects an individual’s abil-ity to masticate and break down food [5]. Malocclusions can worsen over time and warrant timely orthodontic intervention [5, 6]. In addition, orthodontic treatment improves esthetics, and as such the popularity of ortho-dontic cosmetic care is increasing [7]. Each year over 9 million individuals in the United States receive orthodon-tic treatment [8], making it the third largest treatment category in dentistry [9].
The field of orthodontics has seen a number of changes over recent years. Although 75% of orthodontic patients are under 18 years of age, the demographic composi-tion of orthodontic patients is changing and the num-ber of adults under treatment is increasing. In 2018, an estimated 1.61 million adults received treatment in the United States, up from 1.55 million in 2016 [8]. Another change in orthodontic practice is how patients enter care. In the past, the biggest referral source for orthodontic care was from general dentists [10]. However, self-refer-ral and word of mouth are becoming more common and an increasing number of patients also try home care first and then self-refer [11].
Fees, payments, and insurance coverage for orthodon-tic care vary widely. Typically, expenditures are grouped into different categories based on payment source. Public insurance payments include government funded cover-ages such as Medicaid, Medicare, worker’s compensation and Veterans Affairs (VA) related insurance. Private insurances include employer plans, Tricare, and individu-ally purchased coverages.
Insurance plans vary in their covered services for orthodontic treatment. Medicaid covers only a handi-capping malocclusion due to birth defects, accidents, disease or abnormal growth patterns, or conditions that that affect nutrition. Children’s Health Insurance Pro-gram (CHIP) provides dental coverage which includes procedures deemed medically necessary to prevent dis-ease and promote oral health, to restore oral structures to health and function, and to treat emergency conditions [12]. Both CHIP and Medicaid leave the interpretation of “medically necessity” for orthodontic treatment up to the
provider and each state [13]. Medicare typically does not cover orthodontic services with limited exceptions such as to treat conditions resulting from disease or injury. The VA offers dental coverage based on a veteran’s bene-fit level, but only covers dental services that are necessary for medical and oral health and usually does not cover orthodontic procedures [14].
Private insurance coverage for orthodontic procedures also varies and generally more extensive dental coverage incurs greater cost. For example, Delta Dental, a private dental insurance company, features three different plans. The most costly or premium benefit plan, lists ortho-dontic services at 50% coverage. The basic plan does not cover orthodontic procedures while the individual/fam-ily plan features a co-pay of about $2600 to $2800 for orthodontic services [15]. Privately insured individuals may purchase additional dental coverage and these indi-viduals are more likely to visit the dentist and have higher expenditures [16].
Older reports indicate that most patients seeking orthodontic care were primarily uninsured and/or from a higher income population [17]. A 2010–2012 study found that 56% of the care for children was paid out of pocket [18], while children with public insurance only repre-sented 9.4% of orthodontist visits [9]. While some dental insurance plans offer full or partial orthodontic coverage for care deemed “medically necessary,” the lack of stand-ardization for determining qualified cases creates dis-parities among case approvals. The Affordable Care Act (ACA) mandated medically necessary orthodontia but then failed to define “medically necessary,” instead leav-ing the definition up to individual states [13]. Data also suggest disparities in care related to insurance status and the ability to pay [14]. For example, children with pub-lic assistance and minority children received the fewest orthodontic procedures [9], and many children needing orthodontic care are either underinsured or uninsured [19]. As much as 15% of the US population have ortho-dontic problems severe enough to affect function sug-gesting a gap between need and delivered care [20]. Among children, 17.2% demonstrated a definite need for orthodontic treatment and about one-third would likely benefit from care [21].
In terms of orthodontist supply, between 1995 and 2006, the number of orthodontists increased by 1315 with a 13.3% increase in orthodontic private practices [22]. Reflecting this increase in supply of orthodontists, the orthodontist to child (ages 5–17) ratio increased nationally from 16.9 to 17.7 per 100,000 children. Despite the national increase, this ratio varied across states rang-ing from 9.2 in Mississippi to 36.0 in the District of Columbia. Ten states experience decreased ratios, high-lighting major differences in orthodontist distribution

Page 3 of 10Hung et al. BMC Oral Health (2021) 21:268
across the country despite national increases in practic-ing orthodontists, suggesting unmet need.
The combination of unmet need and cost as a potential barrier to care makes it important to understand ortho-dontic expenditures. Though previous studies examined orthodontic expenditures, there has been recent changes to orthodontic practice related to self-care. More adults are now seeking care, as well as having new approaches to fees and payments, and new guidelines have made it important to update earlier research and to explore cost trends over time. In addition, earlier studies were lim-ited because their research design focused on limited samples, settings, or narrow time frames. Using national samples that were representative of the United States population, the purpose of this descriptive study was to examine orthodontic expenditures, insurance cover-ages, and to explore trends in expenditures in the United States over the past 2 decades. This study augments the existing literature by updating expenditures, by assessing the impact of changes affecting orthodontic practice on expenditures, and identifying if disparities exist in ortho-dontic utilization based on race/ethnicity, poverty level, and insurance status.
Materials and methodsThis descriptive study examined orthodontic care expen-ditures from 1996 to 2016 using the Medical Expendi-ture Panel Survey (MEPS) Household Component as the source to obtain longitudinal data. MEPS represents the United States civilian, non-institutionalized popula-tion and utilizes annual questionnaires to collect data on individual household members and families in regards to demographics, health status, socioeconomic aspects, and access to care. MEPS is sponsored by the Agency for Healthcare Research and Quality and represents a com-plete data source on the health and dental expenditures by individuals and families in the nation. These annual questionnaires are designed to help provide more trans-parency about the nation’s fluctuating health care system. The detailed information gathered from these question-naires was self-reported. Study participants take part in several rounds of interviewing where they report on changes in their health status, income, employment, use of services, payment, and eligibility for public and pri-vate insurance coverages. Since households may have difficulty reporting third-party payments, the MEPS sup-plements household reports of such payments with data obtained through a follow-back survey of providers [23]. More detailed information about MEPS and its validity and reliability can be found at https:// www. meps. ahrq. gov/. Since the data were de-identified and available to the public, this study does not require review from the
Institutional Review Board according to US federal regu-lations (45 CFR 46, category 4).
Data processing began with merging all MEPS data from the 1996 to 2016. Demographic characteristics were examined for all respondents from 1996 to 2016. Statis-tics for orthodontic expenditures were calculated and graphed across various groups such as age, marital sta-tus, race, gender, income and insurance coverage, along with orthodontic expenditures covered expenses by dif-ferent insurance payers. For the purposes of this study, private insurance was defined as employer plans, and Tri-care is the health care program for US uniformed service members, retirees, and their families around the world. Public health insurance plans in the US consists of feder-ally funded government insurance plans for low-income individuals or families such as Medicaid, Medicare (for the elderly), and other individuals that qualify for spe-cial subsidies. Uninsured individuals were those without public or private insurances and who paid for fees out of pocket.
Both per capita and total expenditures were calcu-lated. Total expenditure was computed by adding up all of the expenditures from 1996 to 2016. Total expenditure divided by the population sample size is the per capita expenditure. Dollar amounts were adjusted to the year 2016 to account for inflation and deflation over the study period and to allow for comparability across all years. The adjustment used the inflation and deflation values pub-lished by the United States Bureau of Labor Statistics. In order for the data sample to be representative of the United States’ population, sampling weights were applied when estimating the expenditures. Using this approach was necessary in order to account for the non-responses in certain population groups. All statistics were com-puted using the R software version 4.0.2.
ResultsStudy sampleTable 1 summarizes the demographic characteristics of the study population. Of 690,298 participants from 1996 to 2016, the mean age was 34.5 years old (stand-ard deviation = 22.4) with 25.6% of the study population aged under 18 years. Among the study sample population 52.2% were female and 37.3% married. The mean income was $26,070 (standard deviation = $30,556). When excluding individuals who reported no expenditures, 56.2% of the orthodontic patients were under 18 years old.
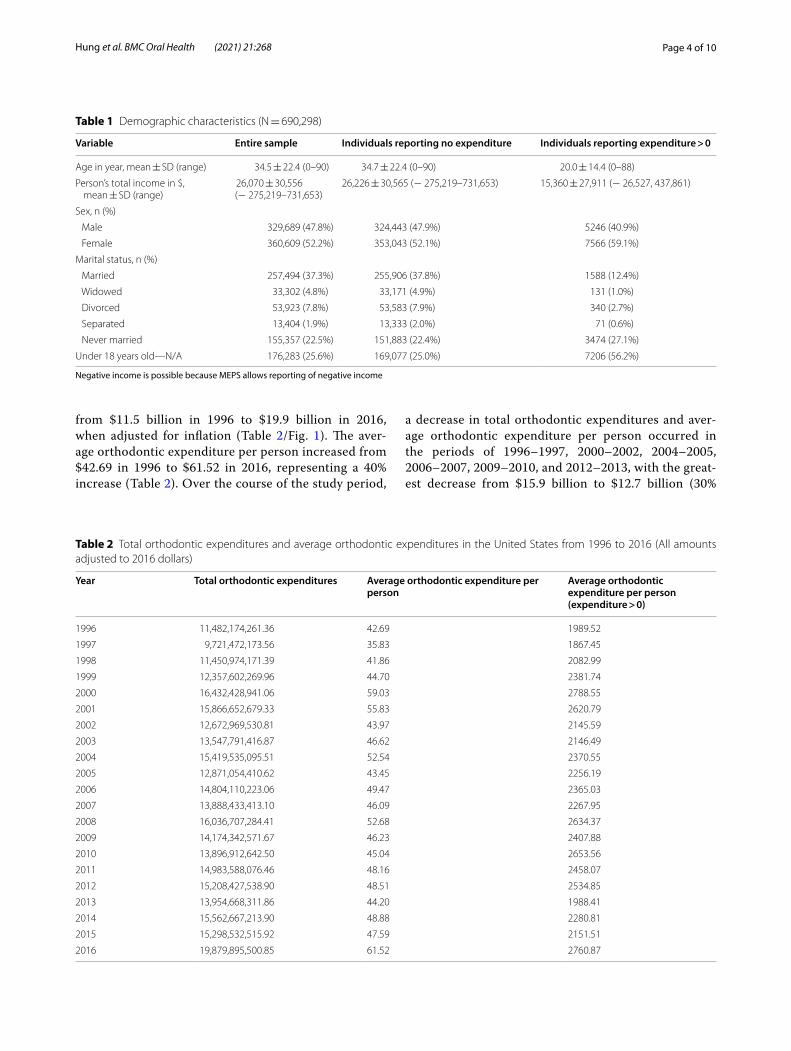
Trends in orthodontic expendituresBetween 1996 and 2016, there was an overall increase in total orthodontic expenditures in the United States, with expenditures almost doubling (73% increase)
Page 4 of 10Hung et al. BMC Oral Health (2021) 21:268
from $11.5 billion in 1996 to $19.9 billion in 2016, when adjusted for inflation (Table 2/Fig. 1). The aver-age orthodontic expenditure per person increased from $42.69 in 1996 to $61.52 in 2016, representing a 40% increase (Table 2). Over the course of the study period,
a decrease in total orthodontic expenditures and aver-age orthodontic expenditure per person occurred in the periods of 1996–1997, 2000–2002, 2004–2005, 2006–2007, 2009–2010, and 2012–2013, with the great-est decrease from $15.9 billion to $12.7 billion (30%
Table 1 Demographic characteristics (N = 690,298)
Negative income is possible because MEPS allows reporting of negative income
Variable Entire sample Individuals reporting no expenditure Individuals reporting expenditure > 0
Age in year, mean ± SD (range) 34.5 ± 22.4 (0–90) 34.7 ± 22.4 (0–90) 20.0 ± 14.4 (0–88)
Person’s total income in $, mean ± SD (range)
26,070 ± 30,556 (− 275,219–731,653)
26,226 ± 30,565 (− 275,219–731,653) 15,360 ± 27,911 (− 26,527, 437,861)
Sex, n (%)
Male 329,689 (47.8%) 324,443 (47.9%) 5246 (40.9%)
Female 360,609 (52.2%) 353,043 (52.1%) 7566 (59.1%)
Marital status, n (%)
Married 257,494 (37.3%) 255,906 (37.8%) 1588 (12.4%)
Widowed 33,302 (4.8%) 33,171 (4.9%) 131 (1.0%)
Divorced 53,923 (7.8%) 53,583 (7.9%) 340 (2.7%)
Separated 13,404 (1.9%) 13,333 (2.0%) 71 (0.6%)
Never married 155,357 (22.5%) 151,883 (22.4%) 3474 (27.1%)
Under 18 years old—N/A 176,283 (25.6%) 169,077 (25.0%) 7206 (56.2%)
Table 2 Total orthodontic expenditures and average orthodontic expenditures in the United States from 1996 to 2016 (All amounts adjusted to 2016 dollars)
Year Total orthodontic expenditures Average orthodontic expenditure per person
Average orthodontic expenditure per person (expenditure > 0)
1996 11,482,174,261.36 42.69 1989.52
1997 9,721,472,173.56 35.83 1867.45
1998 11,450,974,171.39 41.86 2082.99
1999 12,357,602,269.96 44.70 2381.74
2000 16,432,428,941.06 59.03 2788.55
2001 15,866,652,679.33 55.83 2620.79
2002 12,672,969,530.81 43.97 2145.59
2003 13,547,791,416.87 46.62 2146.49
2004 15,419,535,095.51 52.54 2370.55
2005 12,871,054,410.62 43.45 2256.19
2006 14,804,110,223.06 49.47 2365.03
2007 13,888,433,413.10 46.09 2267.95
2008 16,036,707,284.41 52.68 2634.37
2009 14,174,342,571.67 46.23 2407.88
2010 13,896,912,642.50 45.04 2653.56
2011 14,983,588,076.46 48.16 2458.07
2012 15,208,427,538.90 48.51 2534.85
2013 13,954,668,311.86 44.20 1988.41
2014 15,562,667,213.90 48.88 2280.81
2015 15,298,532,515.92 47.59 2151.51
2016 19,879,895,500.85 61.52 2760.87

Page 5 of 10Hung et al. BMC Oral Health (2021) 21:268
decrease) occurring from 2001 to 2002 (Table 2). All other years exhibited an increase in total orthodontic expenditures, with the greatest increases seen from 1999 to 2000 (32% increase) and from 2015 to 2016 (30% increase) (see Table 2). Despite fluctuations, over longer intervals total orthodontic expenditures showed a gradual progressive increase during the study period (Fig. 1).
Expenditures by insurance typeFigure 2 depicts per capita of different insurance cover-ages used for orthodontic expenditures. Over the past 2 decades, per capita Medicaid expenditure increased substantially from $0.65 in 1996 to $5.98 in 2016, out-of-pocket per capital expenditure went from $25.15 to $31.16, while per capita Medicare expenditure went from $0.003 to $0.05. Out-of-pocket expenditures were the most common type of orthodontic payment throughout and although total out-of-pocket expenditures increased by $3.3 billion, they decreased as a percentage of total expenditures by 8% from 59% in 1996 to 51% in 2016. Private insurance expenditure fluctuated throughout the years. Prior to 2010, the average annual Medicare expenditure was $912,861 and average annual Medicaid expenditure was $436,806,257 in orthodontics. From 2010 to 2016, the average annual Medicare orthodontic expenditure was $20,201,930 and average annual ortho-dontic Medicaid expenditure was $1,178,598,306.
Expenditures by demographic groupsFigure 3 is a representation of the per capita of ortho-dontic expenditures across different subgroups from the year 1996 to 2016. Those under age 18 years displayed the highest per capita orthodontic visit expenditures, while adults over age 65 years exhibited the lowest spending. For marital status, the subgroup “never married” spent more per capita during most of the study period than the subgroups of “separated”, “widowed”, “married”, and “divorced”. However, in the year 2016, there was a spike in per capita orthodontic visit expenditures by “separated” individuals. This particular spike was approximately 10 times the amount of the previous year. Asian, Caucasian and Black all exhibited variation from year to year. Over the study period, the average orthodontic expenditure per person increased from $42.69 in 1996 to $61.52 in 2016 with Black individuals having the lowest per capita orthodontic visit expenditure at $30.35. The same pattern remained true that the Black individuals had the lowest average orthodontic expenditure whether our analyses included cases with expenditure > 0 or all cases (Figs. 4, 5).
DiscussionUsing a nationally representative database this study found that there was an overall increase of 8.4 billion dollars in orthodontic expenditures over the last 2 dec-ades. Total orthodontic expenditures in the United States
Fig. 1 US total orthodontic expenditures from 1996 to 2016

Page 6 of 10Hung et al. BMC Oral Health (2021) 21:268
almost doubled from $11.5 billion in 1996 to $19.9 bil-lion in 2016. In contrast, over the same period dental care expenditures increased by 27% and per capita healthcare expenditures increased by 60% [24]. One explanation for this increase may be related to an increase in the num-ber of orthodontists. However, in contrast to the 8.4%
increase in expenditure, the number of orthodontists per 100,000 population over the study period only increased by 0.45%. This study also found that orthodontic expen-ditures in public spending accounts such as Medicare and Medicaid substantially increased after the enactment of Affordable Care Act in 2010. Documenting existing
Fig. 2 US per capita orthodontic expenditures by insurance coverage

Page 7 of 10Hung et al. BMC Oral Health (2021) 21:268
expenditure, trends and out-of-pocket expenses pro-vides useful information to policy makers and insurers about the cost of expanding coverage. Costs have impor-tant health implications since more than 20% of children would benefit from orthodontic treatment [25]. Treat-ment contributes to the public health by identifying and managing malocclusions that can compromise nutrition, lead to gum disease and bone erosion and contribute to breathing disorders such as sleep apnea and improving quality of life [26].
Another key finding was the variation seen in expen-ditures over the study period with several year-to-year decreases interspersed with years of increased spend-ing. Although both total dental and medical expenditures show some fluctuations over this same time period, they vary to a lesser degree [24]. This implies that, because of its dependence on out-of-pocket payments, orthodontic care is more of a luxury, and more sensitive to social and economic conditions such as the housing crisis, the tech bubble burst, the global recession, and events like the
9/11 terrorist attacks which correlated with a 30% drop in orthodontic visits. It is possible that cosmetic care is more sensitive to economic changes, but regardless the fluctuations highlight the importance of safety net fund-ing and expanding public funding for orthodontic care especially during times of crisis to avoid financially vul-nerable patients with medical necessity going untreated. It also suggests that a standard definition of medical necessity will help focus resources to provide care to those with most in need of treatment during an unfavora-ble economic climate.
Total expenditures from all payment sources increased throughout the 20-year time frame. While out-of-pocket payments represented the largest expenditure, they decreased as percent of total expenditure. Public insur-ance expenditures, which predominantly cover children, increased at a steeper rate than other forms of pay-ment, suggesting that policy makers and legislators are beginning to recognize the importance of orthodontic care. However, the persistent disparity between federal
Fig. 3 US per capita orthodontic expenditures by demographic groups

Page 8 of 10Hung et al. BMC Oral Health (2021) 21:268
coverage and out-of-pocket expenditures raises questions on whether insurance policies appropriately match com-munity need for treatment. Since higher income individ-uals and those with private insurance were more likely to receive care, augmenting federal insurance coverage for orthodontic care appears to be one solution to narrowing the gap between care and need.
Study results found that individuals under 18 years old exhibited the greatest orthodontic expenditures per capita, a finding similar to other studies. This is consist-ent with the American Association of Orthodontics rec-ommendation to have an orthodontic evaluation by age 7 to detect problems and to begin treatment between ages 9 and 16 in order to optimize treatment and prevent later complications [27]. Expenditures were greater for females than males throughout the entire study period, a finding also consistent with previous reports. One pos-sible explanation is that females are more likely to seek cosmetic care than their male counterparts [28]. A sur-prising finding was that Blacks exhibited the greatest year-to-year fluctuation in expenditure and there was a sharp peak for Asians orthodontic expenditure in 2016. This suggests that Blacks and Asians might be the most vulnerable population to economic downturns, with the
greatest need for interventions and supportive programs during crisis periods. Further study is needed to con-firm these findings and to explore possible reasons and solutions.
Like all studies, this study has several limitations. MEPS samples the civilian, noninstitutionalized population, so it does not include the 5% of those individuals institution-alized in the US. Nonetheless, MEPS remains the most complete medical expenditure database in the United States and our results should be generalizable to 95% of the US population. Another issue is that since MEPS uses a computer interface for interviews, household reporting may not be recorded accurately due to a lack of techni-cal knowledge in using computers from some households [29]. An additional limitation is that MEPS reports on expenditure data but does not include indirect costs such as time off or travel costs related to doctor appointments [30]. MEPS data also do not distinguish between ortho-dontic care that is medically necessary versus cosmetic care and do not identify to what extent newer direct-to-patient aligner treatments and aligner treatments offered by dentists contribute to expenses. Finally, self-reported responses may reflect personal bias; however, the follow-back survey of providers helps to reduce potential bias.
0
50
100
150
200
250Av
erag
e O
rtho
don�
c Ex
pend
iture
($)
Year
Under 18 years old 18-64 years old 65+ years old
White Asian Black
Fig. 4 Average per capita orthodontic expenditures by age and racial groups (all cases)

Page 9 of 10Hung et al. BMC Oral Health (2021) 21:268
ConclusionsFrom 1996 to 2016, total orthodontic expenditures in the United States almost doubled. Expenditures fluctu-ated with several year-to-year decreases interspersed with years of increased spending, suggesting that orthodontic expenditures are sensitive to the economic environment and may be related to the high propor-tion of self-pay patients. Differences in spending among groups suggest disparities in orthodontic care among the US population.
AcknowledgementsThe authors would like to thank the Clinical Outcomes Research and Educa-tion (codmresearch.com) at Roseman University of Health Sciences College of Dental Medicine for the strong support of this study.
Authors’ contributionsMH conceptualization, methodology, software, validation, formal analysis, investigation, resources, data curation, writing-original draft reparation, writing- review and editing, visualization, supervision, project administra-tion, funding acquisition. EH conceptualization, methodology, software, investigation, writing- review and editing, visualization. ML conceptualization, methodology, investigation, writing-original draft preparation, writing-review and editing. EL software, formal analysis, investigation, writing-review and editing, visualization. SS investigation, writing-original draft preparation, writing-review and editing. ET investigation, writing-original draft preparation, writing-review and editing. AM investigation, writing-original draft prepara-tion, writing-review and editing. GR investigation, writing-review and editing. All authors read and approved the final manuscript.
FundingThis study was funded by the Undergraduate Research Opportunities Program at the University of Utah, awarded to Evelyn Lauren (mentee) and Dr. Man Hung (mentor).
Availability of data and materialsThe datasets generated and/or analyzed during the current study are avail-able in the Medical Expenditure Panel Survey (MEPS) Household Component repository, https:// www. meps. ahrq. gov/.
Declarations
Ethics approval and consent to participateNot applicable.
Consent for publicationNot applicable.
Competing interestsThe authors declare that they have no competing interests.
Author details1 Roseman University of Health Sciences College of Dental Medicine, 10894 S. River Front Parkway, South Jordan, UT 84095, USA. 2 University of Utah School of Medicine, Salt Lake City, UT, USA. 3 University of Chicago The College, Chi-cago, IL, USA. 4 University of Utah Department of Mathematics, Salt Lake City, UT, USA. 5 Portland State University Institute on Aging, Portland, OR, USA.
Received: 10 November 2020 Accepted: 10 May 2021
0
500
1000
1500
2000
2500
3000
3500
4000Av
erag
e O
rtho
don�
c Ex
pend
iture
($)
Year
Under 18 years old 18-64 years old 65+ years old
White Asian Black
Fig. 5 Average per capita orthodontic expenditures by age and racial groups (cases with expenditure > 0)

Page 10 of 10Hung et al. BMC Oral Health (2021) 21:268
• fast, convenient online submission
•
thorough peer review by experienced researchers in your field
• rapid publication on acceptance
• support for research data, including large and complex data types
•
gold Open Access which fosters wider collaboration and increased citations
maximum visibility for your research: over 100M website views per year •
At BMC, research is always in progress.
Learn more biomedcentral.com/submissions
Ready to submit your researchReady to submit your research ? Choose BMC and benefit from: ? Choose BMC and benefit from:
References 1. Littlewood SJ, Mitchell L. An introduction to orthodontics. Oxford Univer-
sity Press; 2019. 2. Chapple IL, Van der Weijden F, Doerfer C, Herrera D, Shapira L, Polak D,
Madianos P, Louropoulou A, Machtei E, Donos N. Primary prevention of periodontitis: managing gingivitis. J Clin Periodontol. 2015;42:S71–6.
3. Ramfjord SP, Ash MM. Significance of occlusion in the etiology and treat-ment of early, moderate and advanced periodontitis. 1981.
4. Jati AS, Furquim LZ, Consolaro A. Gingival recession: its causes and types, and the importance of orthodontic treatment. Dental Press J Orthod. 2016;21(3):18–29.
5. English JD, Buschang P, Throckmorton G. Does malocclusion affect masti-catory performance? Angle Orthod. 2002;72(1):21–7.
6. Baccetti T, Franchi L, McNamara Jr JA. Growth in the untreated Class III subject. In: Seminars in orthodontics: 2007: Elsevier; 2007. p. 130–42.
7. Christou T, Betlej A, Aswad N, Ogdon D, Kau CH. Clinical effectiveness of orthodontic treatment on smile esthetics: a systematic review. Clin Cosmet Investig Dent. 2019;11:89.
8. Guay AH, Brown LJ, Wall T. Orthodontic dental patients and expendi-tures—2004. Am J Orthod Dentofac Orthop. 2008;134(3):337–43.
9. Laniado N, Oliva S, Matthews GJ. Children’s orthodontic utilization in the United States: socioeconomic and surveillance considerations. Am J Orthod Dentofac Orthop. 2017;152(5):672–8.
10. Nelson S, Armogan V, Abei Y, Broadbent BH, Hans M. Disparity in ortho-dontic utilization and treatment need among high school students. J Public Health Dent. 2004;64(1):26–30.
11. Orthodontists report uptick in number of patients attempting DIY teeth straightening. https:// www. aaoin fo. org/1/ press- room/ ortho donti sts- report- uptick- in- number- of- patie nts- attem pting- diy- teeth- strai ghten ing
12. Benefits. www. medic aid. gov/ chip/ benefi ts/ index. html. 13. AAO Leads Effort to Establish Consistency on Medically Necessary Ortho-
dontic Care. https:// www1. aaoin fo. org/ aao- leads- effort- estab lish- consi stency- medic ally- neces sary- ortho dontic- care/
14. Dental Benefits for Veterans. https:// www. va. gov/ healt hbene fits/ resou rces/ publi catio ns/ IB10- 442_ dental_ benefi ts_ for_ veter ans. pdf.
15. Plan Options. www. delta denta lins. com/ 16. Manski RJ, Macek MD, Moeller JF. Private dental coverage: who has it and
how does it influence dental visits and expenditures? J Am Dent Assoc. 2002;133(11):1551–9.
17. Whitesides J, Pajewski NM, Bradley TG, Iacopino AM, Okunseri C. Socio-demographics of adult orthodontic visits in the United States. Am J Orthod Dentofacial Orthop. 2008;133(4):489 e489-414.
18. Berdahl T, Hudson J, Simpson L, McCormick MC. Annual Report on Chil-dren’s Health Care: dental and orthodontic utilization and expenditures for children, 2010–2012. Acad Pediatr. 2016;16(4):314–26.
19. Manski RJ, Vargas CM, Brown E, Carper KV, Macek MD, Cohen LA. Dental procedures among children age birth to 20, United States, 1999 and 2009. J Public Health Dent. 2015;75(1):10–6.
20. Proffit WR, Fields HW Jr, Moray LJ. Prevalence of malocclusion and ortho-dontic treatment need in the United States: estimates from the NHANES III survey. Int J Adult Orthod Orthognath Surg. 1998;13(2):97–106.
21. Christopherson EA, Briskie D, Inglehart MR. Objective, subjective, and self-assessment of preadolescent orthodontic treatment need–a func-tion of age, gender, and ethnic/racial background? J Public Health Dent. 2009;69(1):9–17.
22. Waldman HB, Perlman SP, Schindel R. Update on the imbalanced distribution of orthodontists, 1995–2006. Am J Orthod Dentofac Orthop. 2009;135(6):704–8.
23. Bernard D, Cowan C, Selden T, Cai L, Catlin A, Heffler S. Reconciling medi-cal expenditure estimates from the MEPS and NHEA, 2007. Med Medicaid Res Rev. 2012;2(4).
24. Hung M, Lipsky MS, Moffat R, Lauren E, Hon ES, Park J, Gill G, Xu J, Peralta L, Cheever J, et al. Health and dental care expenditures in the United States from 1996 to 2016. PLoS ONE. 2020;15(6):e0234459.
25. Martonffy AI. Oral health: orthodontic treatment. FP Essent. 2015;428:22–6.
26. Ciuffolo F. Contemporary contribution of orthodontics to the public health: a brief commentary paper. 2016.
27. Importance of Orthodontics. https:// www. aaoin fo. org/ blog/ parent- s- guide- post/ impor tance- of- ortho donti cs/
28. Lagorsse A, Gebeile-Chauty S. Does gender make a difference in ortho-dontics? A literature review. Orthod Fr. 2018;89(2):157–68.
29. Cohen JW, Cohen SB, Banthin JS. The medical expenditure panel survey: a national information resource to support healthcare cost research and inform policy and practice. Med Care. 2009;47(7 Suppl 1):S44-50.
30. Jarmolowicz DP, Bickel WK, Sofis MJ, Hatz LE, Mueller ET. Sunk costs, psychological symptomology, and help seeking. Springerplus. 2016;5(1):1699.
Publisher’s NoteSpringer Nature remains neutral with regard to jurisdictional claims in pub-lished maps and institutional affiliations.