examining sea level rise scenarios through mock marsh ...adapted to changing sea levels. there is a...
TRANSCRIPT

Compiled in 2014 by education staff at the Chesapeake Bay National Estuarine Research Reserve in Virginia for use in the B-
WET Climate Education for a Changing Bay program.
Examining Sea Level Rise Scenarios Through Mock
Marsh Transects
Materials:
24 steel rods
14 - 5’ PVC poles
10 - 7’ PVC poles
6 pairs of gloves
3 steel sledge hammers
3 metric transect lines
3 metric tape measures
3 sets of printed plants
3 clipboards
3 blue duct tape rolls
1 white duct tape roll
1 red duct tape rolls
1 green duct tape roll
3 Blue ropes
1 White rope
1 Green rope
2 Red ropes
3 sets of printed plants
Printed instructions and questions
PVC bases (optional, for indoor use)
Grade Level: 9th
-12th
Subject Area: Earth Science, Environmental Science, Oceanography
Virginia Standards of Learning: ES. 1, ES. 2, ES. 11
Objectives:
Students will:
Comprehend the difference between tidal elevation, storm surge, and sea level rise due
to climate change
Understand the impact of sea level rise on marsh communities
Construct a marsh transect following a set of instructions
Make inferences about climate change from the constructed lesson and displayed data
Summary: Students will work in groups to survey a mock, locally relevant, marsh habitat that includes
dominant plant community types. Students will use elevation data to construct and interpret a
profile of the mock landscape. Students will understand local vegetative species found in each
marsh zone, and how sea level rise may impact the marsh habitat. Students will be able to
interpret elevation and elevation changes in a real world, hands-on example.
Vocabulary: elevation, inundation, sea level rise, climate change, transect, mars

Compiled in 2014 by education staff at the Chesapeake Bay National Estuarine Research Reserve in Virginia for use in the B-
WET Climate Education for a Changing Bay program.
Procedure:
**Please read the background information and follow the set-up instructions in Appendix1, prior
to doing the activity with your students. PVC poles will need to be cut and painted
accordingly.**
Introduction
1. Prior to going outside, give a brief introduction of a salt marsh. Discuss with students how salt
marshes are zoned, identifying a few dominant plants in each zone.
2. Students should discuss the importance of salt marshes and create a list as a class.
3. Explain how marshes may respond to sea level rise, both current sea level rise scenarios, as
well as projected sea level rise with climate change. Make sure everyone understands the basic
mechanisms behind climate change and what could be affected as a result of climate change.
4. Show the SET video to further explain and enhance your class discussion (Appendix 2).
Outside set up
1. Divide students into three groups: 1) Tides 2) Storm 3) Sea level rise, and explain that they
will be surveying a mock marsh habitat, to make predictions about how the marsh will respond
to sea level rise.
2. Show the students what supplies each group will have (these should already be separated as
follows) and explain safety precautions (wear gloves while holding rods and hammer). **A base
made of PVC pipes and connectors may be used in substitute of steel rods, in this case groups
will not need hammers or gloves**
Tides – Group 1
8 steel rods
7 - 5ft. PVC poles
1 - 7ft. PVC pole
Blue duct tape roll
White/clear duct tape roll
Blue rope
White rope
2 - Pairs of gloves
Sledge hammer
Metric transect line
Metric tape measure
Set of printed plants
Tide group instructions
and questions
Clipboard
Storm – Group 2
8 steel rods
8 - 7ft. PVC poles
Blue duct tape roll
Green duct tape roll
Blue rope
Green rope
2 - Pairs of gloves
Sledge hammer
Metric transect line
Metric tape measure
Set of printed plants
Storm group instructions
and questions
Clipboard
Sea level rise – Group 3
8 steel rods
7 - 5ft. PVC poles
1 - 7ft. PVC pole
Blue duct tape roll
Red duct tape roll
Blue rope
2 – Red ropes
2 - Pairs of gloves
Sledge Hammer
Metric transect line
Metric tape measure
Set of printed plants
Sea Level Rise group
instructions and questions
Clipboard

Compiled in 2014 by education staff at the Chesapeake Bay National Estuarine Research Reserve in Virginia for use in the B-
WET Climate Education for a Changing Bay program.
Activity
1. Hand out instructions and corresponding questions to each group (See Appendix 3).
2. Explain to the groups that they are creating a marsh transect, and they need to imagine that
they are starting at the water’s edge and working away from the water towards a high elevation.
3. All groups should work parallel to each other with their transect line running in the same
direction. Your school may have a benchmark installed on the grounds, if so, work away from
the benchmark. A benchmark is a fixed point which is used as an elevation reference.
4. Briefly review the outlined instructions so that everyone is clear on what to do.
a) Students will run the transect line out 12m along the length of the school yard.
b) Every 1.5m along the transect line hammer a stake into the ground roughly 1 inch deep.
(Use caution, group members involved in this step must wear gloves, the hammer is to be
used ONLY on the stakes). Be sure that the stake is secure and standing up straight.
c) Place the PVC pipes on top of the stakes, the mud painted on the pipes should increase in
elevation as you get closer to the woods, and should be placed so that the mud is touching
the ground
d) Students will use tape and colored rope to represent the water level on their PVC poles at
a specific elevation noted on their worksheet.
e) Once water levels are placed, students will add plants at the appropriate elevation along
their transect (Appendix 4).
f) Students will take a step back from their transect line and make observations about what
they saw and answer questions on their worksheet.
5. Once the students begin, periodically check in with each group to be sure they understand the
provided instructions, activity, and questions.
6. Check to make sure students work corresponds to the correct line on the graph. A graph has
been completed to show the whole transect activity in Appendix 5.

Compiled in 2014 by education staff at the Chesapeake Bay National Estuarine Research Reserve in Virginia for use in the B-
WET Climate Education for a Changing Bay program.
Wrap Up
1. Once all of the groups have created their mock transect and have answered the attached
questions, bring everyone together on one side of the activity to review. Have students explain
their observations.
2. Point out the different sea levels and changes in elevation throughout the poles. Have students
tell you the water level represented by the different color ropes.
3. Ask your students the following questions:
a) What is a spring tide? What happens during a spring tide?
b) How did you decide to place your plants where they were?
c) What influences marsh zonation?
d) What is the highest water level represented? What are some impacts that were
faced during this storm?
e) Why are there two different water level showing projected sea level by the year
2050? How do scientists get these numbers?
f) What are some impacts we could face in 2050 due to a higher mean water level?
g) What will the marsh do as sea level rises?
h) How can we reduce our impact on climate change?
4. Students should clean everything up and leave the area as it was when they arrived for the next
class.
**Extension: Create a long vertical ruler and have students place known elevations on the ruler,
i.e. Water levels from the above activity, and known areas within the community such as school
elevation, main street elevations. A good place to look for basic elevation information is Google
Earth. This will allow students to see how all of the elevations relate to each other within vertical
space.

Compiled in 2014 by education staff at the Chesapeake Bay National Estuarine Research Reserve in Virginia for use in the B-
WET Climate Education for a Changing Bay program.
Background Information
The impacts of climate change on coastal areas will be seen across a diverse suite of
physical and chemical variables including changes in air, water and soil temperatures; water
chemistry (e.g. pH, dissolved oxygen, and inundation of saltwater); the quantity, timing and
intensity of precipitation; the intensity of storm events; and changes in sea level. Understanding
changes in sea level and inundation, and the associated responses of critical habitats and coastal
communities are key to the Chesapeake Bay region. Relative sea level rise rates and associated
impacts within the southern Chesapeake Bay region represent some of the highest rates and
threats reported along the U.S. Atlantic coast.
Coastal wetlands are highly valuable and productive ecosystems, which have long
adapted to changing sea levels. There is a heightened level of concern about the impacts of sea
level rise. However, concern is justified given that current and projected rates of sea level rise
reflect a greater increase over what we experienced during the last century. Salt marshes are a
key habitat to the coastal area, and one that is facing immediate impacts due to sea level rise.
Salt marshes provide many ecosystem services. They provide feeding, spawning and
nursery habitats for fish, shellfish, and birds. Furthermore, salt marshes and upland forests
associated with estuaries act as filters to remove excess nutrients and contaminants from storm
water runoff. Marshes also help with flood and erosion control, acting as sponges and stabilizing
the sediment. Many people also benefit from the marsh whether recreationally through fishing,
crabbing, and boating, or economically through a related career such as environmental
consulting, environmental education, or the seafood industry.
Organisms living in the salt marsh face many environmental parameters on a daily basis,
such as tides, waterlogged soils, temperature and salinity. While some animals and plants have

Compiled in 2014 by education staff at the Chesapeake Bay National Estuarine Research Reserve in Virginia for use in the B-
WET Climate Education for a Changing Bay program.
unique adaptations allowing them to thrive in this environment, ultimately elevation determines
the zonation of the marsh paired with competition for space. Marshes have different zones based
mainly on elevation, different plants and animals characterize each of the zones. Over time,
sediment builds up, and the marsh begins to grow vertically which leads to the development of
zones. The low marsh is closest to the water’s edge and has the lowest elevation. This zone is
flooded daily by tides, which bring in nutrients making this zone fairly productive. Life here
deals with rapid changes in temperature, salinity, and dissolved oxygen levels, so there is limited
resident and species diversity. There is however a very high bio-mass which is predominately
made up of Spartina alterniflora, Smooth Cordgrass. This plant is adapted to being regularly
inundated with water, it has salt glands and therefore is salt tolerant (a halophyte.) Inundation is
the covering over of water. This plant has smooth, leathery, flat and narrow leaves and grows in
monocultures, meaning large uniform patches.
As elevation increases in the marsh, the dominant plant in each zone changes. The high
marsh is noted for having sandier soils and is only flooded with the highest tides. The high marsh
has a greater plant and animal diversity than the low marsh. One of the dominant plants in this
zone is Spartina patens, Saltmeadow Hay. Spartina patens is a short, wiry grass that forms dense
carpet like patches with weak stems. Iva frutescens, Marsh Elder, is a shrub that grows on high
spots in the march and marks the transition zone from high marsh to upland, also known as the
shrub zone. This zone is rarely inundated with water. Marsh Elder has fleshy leaves which are
arranged in pairs opposite each other along the stem.
Marshes are exposed to varying water levels on a daily basis. The low marsh is inundated
twice daily by the high tides. During a spring tide, the time when high tides are the highest and
low tides are the lowest, sea level can reach well into the high marsh zone, during the highest

Compiled in 2014 by education staff at the Chesapeake Bay National Estuarine Research Reserve in Virginia for use in the B-
WET Climate Education for a Changing Bay program.
tide. Not only do marshes experience sea level changes daily, but they are also exposed to rising
water level depending on current weather situations, whether that is a high wind day, a
nor’easter, or hurricane. With climate change, one of the local impacts that we will face is a rise
in sea level.
While marshes can grow vertically through sediment build up, there is concern whether
the deposition of sediment is keeping up with the rate of sea level rise. Marsh plants are expected
to respond to sea level rise by migrating toward high elevations. This process is being monitored
at Sentinel Sites and by the National Estuarine Research Reserves (NERRS). Surface elevation
is a critical structural component of low-lying coastal areas. NERRS scientists are using Surface
Elevation Tables (SETs), portable measuring instruments deployed atop wetland vertical
benchmarks, to measure millimeter-level changes in surface elevations over time. Housing,
infrastructure, and other human modifications are expected to limit the space of this potential
marsh plant migration. Coastal counties continue to grow, putting more stress on their
surrounding ecosystems. Not only does development impact marsh regression, development can
also cause a significant amount of sediment to run-off increasing the turbidity. As people become
more aware of climate changes and its associated impacts, hopefully we can reduce our impact
on the environment.
Compiled in 2014 by education staff at the Chesapeake Bay National Estuarine Research Reserve in Virginia for use in the B-
WET Climate Education for a Changing Bay program.
Appendix 1- PVC Set-Up
1) Cut ¾” PVC poles into 14, 5’ poles and 10, 7’ poles. (PVC can be purchased in
10’ or 5’ sizes)
2) Divide the poles up into the following three groups:
Group 1) 7 - 5ft. poles and 1 - 7 ft. pole
Group 2) 8 - 7ft. poles
Group 3) 7 - 5ft. poles and 1 - 7ft. pole
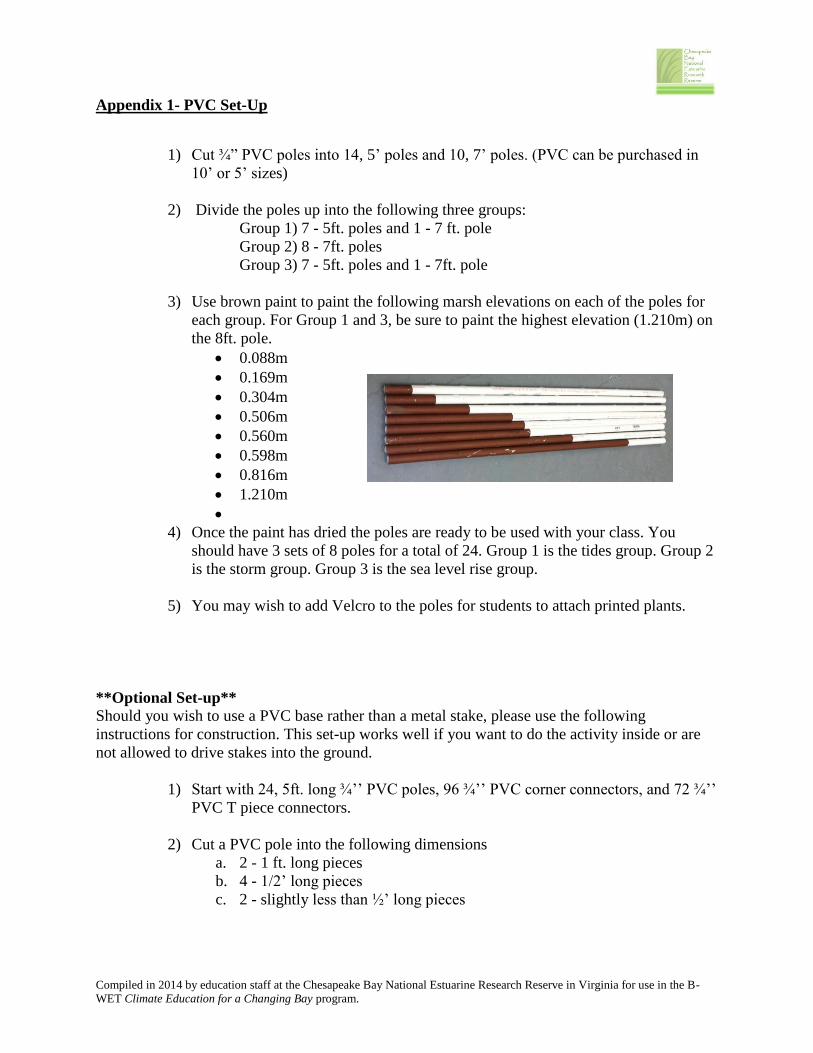
3) Use brown paint to paint the following marsh elevations on each of the poles for
each group. For Group 1 and 3, be sure to paint the highest elevation (1.210m) on
the 8ft. pole.
0.088m
0.169m
0.304m
0.506m
0.560m
0.598m
0.816m
1.210m
4) Once the paint has dried the poles are ready to be used with your class. You
should have 3 sets of 8 poles for a total of 24. Group 1 is the tides group. Group 2
is the storm group. Group 3 is the sea level rise group.
5) You may wish to add Velcro to the poles for students to attach printed plants.
**Optional Set-up**
Should you wish to use a PVC base rather than a metal stake, please use the following
instructions for construction. This set-up works well if you want to do the activity inside or are
not allowed to drive stakes into the ground.
1) Start with 24, 5ft. long ¾’’ PVC poles, 96 ¾’’ PVC corner connectors, and 72 ¾’’
PVC T piece connectors.
2) Cut a PVC pole into the following dimensions
a. 2 - 1 ft. long pieces
b. 4 - 1/2’ long pieces
c. 2 - slightly less than ½’ long pieces

Compiled in 2014 by education staff at the Chesapeake Bay National Estuarine Research Reserve in Virginia for use in the B-
WET Climate Education for a Changing Bay program.
p
a
b
b
b
b
c c
3) Use the corner connectors to create a square with the cut PVC. Two sides
opposite of each other should have a T piece in the middle to connect their side.
Use the smallest pieces to create a line through the middle of the square using the
final t connector to complete the line. See the diagram below:
4) Complete steps 2 and 3 for all of the remaining poles.
5) The center T connector is to be pointed upwards and used as the connection for
the painted transect PVC poles.

Compiled in 2014 by education staff at the Chesapeake Bay National Estuarine Research Reserve in Virginia for use in the B-
WET Climate Education for a Changing Bay program.
Appendix 2- SET Video and Resources
Surface Elevation Table Video and Explanation
https://www.youtube.com/watch?v=KRRKWnmOHwo
Surface Elevation Table Description
http://www.pwrc.usgs.gov/set/theory.html
Sentinel Site Information
http://www.vims.edu/cbnerr/CBSSC/index.php

Compiled in 2014 by education staff at the Chesapeake Bay National Estuarine Research Reserve in Virginia for use in the B-WET Climate Education for a Changing
Bay program.
Appendix 3- Field Data Sheets and Instructions
Group 1 – Tides Group
Members:________________________________________________
Your group will be completing a mock transect of a marsh habitat.
You may use this graph as a reference when completing your transect.
The numbers that you will use are listed below. For this activity, 0
represents current mean sea level.
High Tide Elevation: 0.33m Spring Tide Elevation: 0.46m
1) Run the transect line out 12m along the length of the school yard, walking towards the woods, away from the benchmark.
2) Every 1.5m along your transect line, hammer a stake into the ground roughly 1 inch deep (Use caution, group members involved in this
step must wear gloves, the hammer is to be used ONLY on the stakes). Be sure that the stake is secure and standing up straight.
3) Place the PVC pipes on top of the stakes. The mud painted on the pipes should increase in elevation as you get closer to the woods. See
the graph above for an example, the brown line represents the elevation of the mud. Check to make sure you are correct before moving
on!
4) Current mean high tide is 0.33m above mean sea level. Measure from the ground up to 0.33m and place a piece of blue duct tape on the
PVC pole at that location. Do this on all of the poles until that elevation is no longer above the mud. Don’t press tape down all the way!
5) Take your blue rope and connect it along the poles at the location with the duct tape. If there is no tape at the pole, then drop the rope
there. The blue rope represents high tide.
6) Now Velcro the three plants on to the pole or zone that they are most likely to thrive in. Remember Smooth Cordgrass can be regularly
inundated, Saltmeadow Hay is irregularly inundated, and Marsh Elder is rarely inundated.
7) During a spring tide, water level is 0.46m above mean sea level. Measure from the ground up to 0.46m and place a piece of white duct
tape on the PVC pole at that location. Do this on all of the poles until that elevation is no longer above the mud. Don’t press tape down
all the way!
8) Take your white rope and connect it along the poles at the location with the duct tape. If there is no tape at the pole, then drop the rope
at the last pole with tape. The white rope represents spring tide.
9) Change the location of your plants should you need to.
10) Everyone take a step back from your transect and make some observations about what you see on attached sheet.
11) Please answer the following questions based on your transect alone.

Compiled in 2014 by education staff at the Chesapeake Bay National Estuarine Research Reserve in Virginia for use in the B-WET Climate Education for a Changing Bay program.
Group 2 – Storm Group Members: ____________________________________________
Your group will be completing a mock transect of a marsh
habitat. You may use this graph as a reference when
completing your transect. The numbers that you will use are
listed below. For this activity, 0 represents current mean sea
level.
High Tide Elevation: 0.33m Isabel Elevation: 1.9m
1) Run the transect line out 12m along the length of the school yard, walking towards the woods, away from the benchmark.
2) Every 1.5m along your transect line, hammer a stake into the ground roughly 1 inch deep (Use caution, group members involved in this
step must wear gloves, the hammer is to be used ONLY on the stakes). Be sure that the stake is secure and standing up straight.
3) Place the PVC pipes on top of the stakes, the mud painted on the pipes should increase in elevation as you get closer to the woods. See
the graph above for an example, the brown line represents the elevation of the mud. Check to make sure you are correct before moving
on!
4) Current mean high tide is 0.33m above mean sea level. Measure from the ground up to 0.33m and place a piece of blue duct tape on the
PVC pole at that location. Do this on all of the poles until that elevation is no longer above the mud. Don’t press tape down all the way!
5) Take your blue rope and connect it along the poles at the location with the duct tape. If there is no tape at the pole, then drop the rope
there. The blue rope represents high tide.
6) Now Velcro the three plants on to the pole or zone that they are most likely to thrive in. Remember Smooth Cordgrass can be regularly
inundated, Saltmeadow Hay is irregularly inundated, and Marsh Elder is rarely inundated.
7) During Hurricane Isabel water level reached 1.9m above mean sea level. Measure from the ground up to 1.9m and place a piece of
green duct tape on the PVC pole at that location. Do this on all of the poles until that elevation is no longer above the mud. Don’t press
tape down all the way!
8) Take your green rope and connect it along the poles at the location with the duct tape. If there is no tape at the pole, then drop the rope
at the last pole with tape. The green rope represents the water level during Hurricane Isabel.
9) Change the location of your plants should you need to. Remember that this storm was a singular event.
10) Everyone take a step back from your transect and make some observations about what you see on attached sheet.
11) Please answer the following questions based on your transect alone.

Compiled in 2014 by education staff at the Chesapeake Bay National Estuarine Research Reserve in Virginia for use in the B-WET Climate Education for a Changing Bay program.
Group 3 – Sea Level Rise Members:
___________________________________________________
Your group will be completing a mock transect of a marsh habitat. You
may use this graph as a reference when completing your transect. The
numbers that you will use are listed below. For this activity, 0 represents
current mean sea level.
High Tide Elevation: 0.33m Projected Sea Level by 2050: 0.5m
Accelerated rate Sea Level by 2050: 0.86m.
1) Run the transect line out 12m along the length of the school yard, walking towards the woods, away from the benchmark.
2) Every 1.5m along your transect line, hammer a stake into the ground roughly 1 inch deep (Use caution, group members involved in this step must
wear gloves, the hammer is to be used ONLY on the stakes). Be sure that the stake is secure and standing up straight.
3) Place the PVC pipes on top of the stakes, the mud painted on the pipes should increase in elevation as you get closer to the woods. See the graph
above for an example, the brown line represents the elevation of the mud. Check to make sure you are correct before moving on!
4) Current mean high tide is 0.33m above mean sea level. Measure from the ground up to 0.33m and place a piece of blue duct tape on the PVC pole at
that location. Do this on all of the poles until that elevation is no longer above the mud. Don’t press tape down all the way!
5) Take your blue rope and connect it along the poles at the location with the duct tape. If there is no tape at the pole, then drop the rope there. The blue
rope represents high tide.
6) Now Velcro the three plants on to the pole or zone that they are most likely to thrive in. Remember Smooth Cordgrass can be regularly inundated,
Saltmeadow Hay is irregularly inundated, and Marsh Elder is rarely inundated.
7) By the year 2050, sea level is projected to be 0.5m above current mean sea level. Measure from the ground up to 0.5m and place a piece of red duct
tape on the PVC pole at that location; do this on all of the poles until that elevation is no longer above the mud.
8) Take your red rope and connect it along the poles at the location with the duct tape. If there is no tape at the pole, then drop the rope at the last pole
with tape. The red rope represents 2050 sea level.
9) With an accelerated rate, by the year 2050, sea level is projected to be 0.86m above current mean sea level. Measure from the ground up to 0.86m
and place a piece of red duct tape on the PVC pole at that location. Do this on all of the poles until that elevation is no longer above the mud.
10) Take your other red rope and connect it along the poles at the location with the duct tape. If there is no tape at the pole, then drop the rope at the last
pole with tape. This red line represents the accelerated projection of sea level in 2050.
11) Change the location of your plants should you need to based on the water levels from sea level rise.
12) Everyone take a step back from your transect and make some observations about what you see on attached sheet.
13) Please answer the following questions based on your transect alone.

Compiled in 2014 by education staff at the Chesapeake Bay National Estuarine Research Reserve in Virginia for use in the B-WET
Climate Education for a Changing Bay program.
Group 1 -TIDES
OBSERVATIONS…
1.
2.
3.
4.
QUESTIONS
1. What plant did you place nearest the water’s edge? How did you decide where to place your plants in
your mock marsh habitat?
2. What is the difference in elevation between the mean high tide line and the spring tide line?
3. What do you know are some of the local impacts that we see when we have very high tides or spring
tides?
4. If mean high tide is to be at the spring tide level in the future, what would this mean for the marsh
plants? Would you expect their placement to move?

Compiled in 2014 by education staff at the Chesapeake Bay National Estuarine Research Reserve in Virginia for use in the B-WET
Climate Education for a Changing Bay program.
Group 2 - STORM
OBSERVATIONS…
1.
2.
3.
4.
QUESTIONS
1. What plant did you place nearest the water’s edge? How did you decide where to place your plants in
your mock marsh habitat?
2. How much higher was the water level during Hurricane Isabel than the high tide line?
3. What were some of the local impacts from Hurricane Isabel that you know about or may have heard
your families discuss?
4. What role do marshes play during storms?

Compiled in 2014 by education staff at the Chesapeake Bay National Estuarine Research Reserve in Virginia for use in the B-WET
Climate Education for a Changing Bay program.
Group 3 - SEA LEVEL RISE
OBSERVATIONS…
1.
2.
3.
4.
QUESTIONS
1. When you first placed your plants, what plant did you place nearest the water’s edge? How did you
decide where to place your plants in your mock marsh habitat?
2. What is the difference in elevation between the mean high tide line and sea level projection for 2050,
and for the accelerated rate by 2050?
3. When you moved your marsh plants where did you decide to place them and why?
4. What happened to the marsh as a result of sea level rise?

Compiled in 2014 by education staff at the Chesapeake Bay National Estuarine Research Reserve in Virginia for use in the B-WET
Climate Education for a Changing Bay program.
Appendix 4 – Marsh Plants
1) Spartina alterniflora, Smooth Cordgrass
2) Spartina patens, Saltmeadow Hay

Compiled in 2014 by education staff at the Chesapeake Bay National Estuarine Research Reserve in Virginia for use in the B-WET
Climate Education for a Changing Bay program.
3) Iva frutescens, Marsh Elder

Compiled in 2014 by education staff at the Chesapeake Bay National Estuarine Research Reserve in Virginia for use in the B-WET Climate Education for a Changing Bay program.
Appendix 5 – Completed Transect Graph