examining the day-of-the-week-effect and the-month-of-the
TRANSCRIPT

| 361 |
Keywords: Cryptocurrency; Bitcoin;Day-of-the-week-effect; Litecoin;Month-of-the-year-effect
Corresponding Author:Robiyanto Robiyanto: Tel.+62 298 311 881E-mail: [email protected]
Jurnal Keuangan dan Perbankan, 23(3): 361 – 375, 2019http://jurnal.unmer.ac.id/index.php/jkdp
Article history:Received: 2019-04-23Revised: 2019-06-03Accepted: 2019-07-04
ISSN: 2443-2687 (Online)ISSN: 1410-8089 (Print)
This is an open accessarticle under the CC–BY-SA license
JEL Classification: G14, G19
Kata Kunci:Cryptocurrency; Bitcoin;Day-of-the-week-effect; Litecoin;Month-of-the-year-effect
Examining the day-of-the-week-effectand the-month-of-the-year-effect incryptocurrency market
Robiyanto Robiyanto1, Yosua Arif Susanto1, Rihfenti Ernayani2
1Faculty of Economics and Business, Satya Wacana Christian UniversityJl. Diponegoro No. 52-60, Salatiga, 50711, Indonesia.2Faculty of Economics, University of BalikpapanJl. Pupuk Raya, Gunung Bahagia, Balikpapan, 76114, Indonesia
Abstract
Cryptocurrency market is an attractive field for researchers in finance nowadays.One topic that can be studied is related to the existence of anomalies in thecryptocurrency market. This research was conducted to examine whether thecryptocurrency market, especially on Bitcoin and Litecoin, has day-of-the-week andmonth-of-the-year effects. The Bitcoin and Litecoin were used as objects because theywere a cryptocurrency with a large market capitalization. The data used were monthlycryptocurrency returns for examining the month-of-the-year-effect and daily returnsfor examining the day-of-the-week-effect from 2014-2018. GARCH (1,1) analysis wasdone to see these effects on the cryptocurrency market. The results indicate that thephenomena of day-of-the-week and month-of-the-year effect existed in thecryptocurrency market. Therefore, the cryptocurrency market was not an efficientmarket. The pattern in the Bitcoin and Litecoin could later be utilized by investors.The investors should buy Bitcoin at the end of January and they should sell them atthe end of February. While, for the investors who traded daily, can trade Bitcoin inMonday, Wednesday and Thursday because in these days, the Bitcoin have the po-tential to generate daily profits.
Abstrak
Cryptocurrency market menjadi bidang yang menarik bagi peneliti di bidang keuangan.Salah satu topik yang dapat dikaji adalah terkait adanya anomali dalam cryptocurrency mar-ket. Penelitian ini dilakukan untuk menguji apakah pada cryptocurrency market khususnyapada Bitcoin dan Litecoin terdapat day-of-the-week-effect dan month-of-the-year-ef-fect. Objek dalam penelitian ini adalah Bitcoin dan Litecoin yang merupakan cryptocurrencyyang memiliki kapitalisasi pasar yang besar. Data pada penelitian ini menggunakan returncryptocurrency secara bulanan untuk pengujian month-of-the-year-effect dan returnharian untuk pengujian day-of-the-week-effect dari tahun 2014-2018. Penelitian inimenggunakan analisis GARCH (1,1) untuk melihat adanya day-of-the-week-effect danmonth-of-the-year-effect dari cryptocurrency market. Hasil dari penelitian inimenunjukkan bahwa pasar cryptocurrency tidak bergerak secara acak, melainkan terdapatday-of-the-week-effect dan month-of-the-year-effect. Sehingga pasar cryptocurrencybukanlah pasar yang efisien. Pola yang terjadi pada Bitcoin dan Litecoin dapat dimanfaatkanoleh investor. Investor dapat membeli Bitcoin pada akhir Januari karena return cenderungnegatif dan dapat menjualnya pada akhir Februari. Sementara bagi investor yang melakukanperdagangan harian, hari Senin, Rabu dan Kamis merupakan hari potensial dimana Bitcoindapat menghasilkan keuntungan.
How to Cite: Robiyanto R., Susanto, Y. A., & Ernayani, R. (2019). Examining the day-of-the-week-effect and the-month-of-the-year-effect in cryptocurrency market.Jurnal Keuangan dan Perbankan, 23(3), 361-375.https://doi.org/10.26905/jkdp.v23i3.3005

Jurnal Keuangan dan PerbankanVolume 23, Issue 3, July 2019: 361–375
| 362 |
1. Introduction
The development of technology has alsoreached the financial sector. One of these develop-ments includes the emergence of virtual currenciesthat use cryptographic technology or often referredto as cryptocurrency. In cryptocurrency, each datatransaction will be encoded using certain crypto-graphic algorithms (Nakamoto, 2008; Conway,2014). One of the examples of cryptocurrency isBitcoin. Bitcoin was first developed in 2010 as a fi-nancial instrument called virtual currency which wasoriginally used for peer-to-peer payments amongonline video gamers (ICBA, 2015) and online gam-blers through Satoshi Dice (Badev & Chen, 2014).This instrument was originally created by a program-mer (Turpin, 2014) and was named Bitcoin by SatoshiNakamoto, its inventor (Nakamoto, 2008; Richter,Kraus, & Bouncken, 2015; Seetharaman, Saravanan,Patwa, & Mehta, 2017). In 2010, Bitcoin was onlyvalued at USD 0.04, and once reached the highestrecord of USD 19.345,49 in December 2017. TheBitcoin market even threatened other major curren-cies in the world. Bitcoin has been considered as alegal payment instrument in several countries suchas the United States, Canada, Australia, and the Eu-ropean Union. However, there are still many coun-tries rejecting the legality of Bitcoin payment instru-ments such as Iceland, Indonesia, etc. Nevertheless,with an online trading system, Bitcoin trading canbe easily carried out, both on the real Bitcoin mar-ket and the Bitcoin futures market in any country(Robiyanto & Pangestuti, 2018).
Bitcoin is one type of cryptocurrency that isfrequently used by people in several developedcountries. Even in Indonesia, it has become an in-vestment tool although it cannot be used as a meansof payment because the virtual currency has notbeen recognized as a legal payment instrument inIndonesia. Although the cryptocurrency has not yetbecome a legal payment instrument in Indonesia,research discussing the cryptocurrency is consideredinteresting to do because there are limited studies
that discuss the cryptocurrency in particular whichexamines seasonal patterns in the cryptocurrencymarket.
Bitcoin is one form of investment widely usedin the world. There are also many types ofcryptocurrency besides Bitcoin that can be used asone type of investment. For example, Ethereum,Ripple, Bitcoin Cash, and Stellar are five of the topten cryptocurrencies that has the largest market capi-talization according to Yahoo Finance. This can beseen in Table 1.
Table 1. Top ten cryptocurrency market capitalization 2018Cryptocurrency
Name Market Capitalization (Billion
USD) Bitcoin 118.870 Ethereum 28.836 Ripple 13.431 Bitcoin Cash 9.393 Stellar 4.224 Lite Coin 3.498 EOS 3.488 Tether 2.809 Cardano 2.625 Tronix 2.518
Source: https://finance.yahoo.com/cryptocurrencies (2019), accessedon April 30, 2019, 14:35.
There is also a cryptocurrency named Litecoinwhich is the result of the development of Bitcoin,especially in terms of increasing speed of volume andtransactions. Litecoin is a developed version ofBitcoin launched in 2011. It is now included in thetop ten cryptocurrencies that have the largest mar-ket capitalization. The concept of Litecoin is basi-cally the same as Bitcoin which is a virtual currencyon a peer-to-peer basis that allows instant paymentsto anyone in the world whose sources are open andhas a global payment network that is fully decen-tralized without any third parties (http://zioncoins.co.uk, 2015).
Based on the data in Table 1, it appears thatthe amount of cryptocurrency market capitalizationis so large that this cryptocurrency has been highlydeveloped in the world. However, studies on

Examining the day-of-the-week-effect and the-month-of-the-year-effect in cryptocurrency marketRobiyanto Robiyanto, Yosua Arif Susanto, Rihfenti Ernayani
| 363 |
the cryptocurrency market are still relatively lim-ited, especially whether it has random walk featureor there is a certain pattern (for example seasonalpatterns). Seasonal studies of the stock and com-modity markets have been widely applied. A pre-vious study by Robiyanto (2015) examined themonth-of-the-year effect on stock and commoditymarkets in Southeast Asia. He concluded that therewas a month-of-the-year effect on the capital mar-kets in Indonesia, Malaysia, Thailand, and the Phil-ippines and the gold, silver, platinum and palladiumproducts also had seasonal patterns. While a studyby Olowe (2010) which examined the commoditymarket found that there was a month-of-the-yeareffect on the Brent North Sea crude oil product in acertain period. Swami (2012) examined the day-to-the-week effect in five countries in South Asia (In-dia, Sri Lanka, Pakistan, Bangladesh, and Nepal) andfound that there was a day-to-the-week effect in SriLanka and Bangladesh. Meanwhile, Abdalla (2012)conducted research on a day-to-the-week effect inthe Indian capital market and concluded that therewas no day-to-the-week effect. Another research onthe commodity market, named the Crude PalmOil (CPO) market, was conducted by Pulungan,Wahyudi, & Suharnomo (2018).
Previous researches on the month-of-the-yearand day-to-the-week effect on the capital and com-modity markets have widely done and they ob-tained different results. While researches onthe cryptocurrency market are still limited. More-over, researches on the cryptocurrency market whichruns for seven days a week are certainly interestingto do. The results of this study are expected to beuseful for the participants of the cryptocurrencymarket in designing their short-term tradingstrategies. In relation to the hypotheses develop-ment of this study, a market will be considered run-ning well if the market runs randomly or has a fea-ture of random walk and the return movement doesnot have a certain seasonal pattern (Robiyanto, 2017;Suganda, Sumargo, & Robiyanto, 2018). In previousstudies (Rita, 2009; Marrett & Worthington, 2011;
Caporale & Zakirova, 2017; Caporale & Plastun,2018), studies of seasonal patterns usually had sea-sonal patterns on a monthly and daily basis.
The month-of-the-year effect occurs if thereturn in a certain period is significantly differentfrom other months, both higher and lower. The usualpattern includes the after-new-year effect (in thefirst month) where the return is usually higher thanthe following month because investors rearrangetheir portfolio positions and purchase shares at thebeginning of the year (Olowe, 2010; Swami, 2012;Robiyanto, 2017). Based on previous researches ex-amining the month-of-the-year-effect on the com-modity market and the stock market, the first hy-pothesis that can be proposed is:H1: there is a month-of-the-year-effect on the
cryptocurrency market
The day-of-the-week-effect is a seasonal pat-tern that occurs on a daily basis, where thereturns obtained differ greatly compared to otherdays (Marrett & Worthington, 2011; Þilicã & Oprea,2014; Zhang, Lai, & Lin, 2017; Caporale & Plastun,2018). Based on previous researches examining sea-sonal patterns on a daily basis or day-to-the-weekeffect that might also occur in the cryptocurrencymarket, the second hypothesis that can be proposedis:H2: there is a day-of-the-week effect on the
cryptocurrency market
2. Method, Data, and Analysis
The type of data used to see the returnof cryptocurrency was obtained through a website(investing.com) which meant that this research usedsecondary data. The cryptocurrency market dataused as the return was daily closing data for exam-ining the day-of-the-week-effect (the number ofobservations was 1826 days) and monthly closingdata for examining the month-of-the-year-effect (thenumber of observations was 60 months) startingfrom 2014 to 2018.

Jurnal Keuangan dan PerbankanVolume 23, Issue 3, July 2019: 361–375
| 364 |
This study used two variables as the samplesincluding Bitcoin and Litecoin. From variouscryptocurrency markets in the world, the research-ers chose these two variables using the purposivesampling method where they should meet the fol-lowing criteria: were considered in the topten cryptocurrencies with the largest market capitali-zation in the world, and published and circulatedglobally in early 2014. Based on the first criteria, thedata obtained can be seen in the following Table 2.
Table 2. Cryptocurrency market capitalization in 2018 andpublication year
Heteroscedasticity (GARCH), especially GARCH(1,1). The GARCH model developed by Bollerslev(1986) was a refinement of the ARCH model. ThisGARCH model was created to avoid a too high levelon the ARCH model based on the parsimony prin-ciple or to choose a simple model so that it wouldguarantee a positive variance.
Equations used for month-of-the-year-effecttesting
Cryptocurrency Name
Market Capitalization (Billion USD)
Publication Year
Bitcoin 118.870 2009 Ethereum 28.836 2015 Ripple 13.431 2012 Bitcoin Cash 9.393 2017 Stellar 4.224 2014 Litecoin 3.498 2011 EOS 3.488 2018 Tether 2.809 2014 Cardano 2.625 2017 Tronix 2.518 2017
Furthermore, based on the second criteria
where it should be published at the beginning of2014 and had been circulating globally, the samplesthat met the criteria were Bitcoin and Litecoin.
This study used the price of the return of thecryptocurrency market as a dependent variable. Thereturns used were daily and monthly returns cal-culated by using the following equation:
푅퐶푡 = 푃푡−푃푡−1
푃푡
푅퐶푡
(1)
Where: RCt = Return cryptocurrency in period t; Pt =Cryptocurrency price in period t; Pt-1 = Cryptocurrency pricein period t-1
In this study, the data were analysed byusing Generalized Autoregressive Conditional
푅퐶푡 = 훽1퐽퐴푁 + 훽2퐹퐸퐵 + 훽3푀퐴푅 + 훽4퐴푃푅 + 훽5푀퐴푌 +
훽6퐽푈푁 + 훽7퐽푈퐿 + 훽8퐴푈퐺 + 훽9푆퐸푃 + 훽10푂퐶푇 +
훽11푁푂푉 + 훽12퐷퐸퐶 + 휀푡 (2)
With:With: 휀푡 = Φ푡휀푡−1 +⋯+ Φ푡휀푡 + η푡 η푡 = 휎푡휀푡 휎푡2 = 훼0 + 훼1η푡−1
2 + ⋯+ 훼푝η푡−푝2 + 훽1σ푡−12 + 훽푞σ푡−푞2
휀푡
η 푅퐶
(3)(4)(5)
Where: t is independent and identically distributedN (0.1) and independent of the past state of t-p; RCt = Returncryptocurrency in period month t; Jan, Feb, Mar, Apr, May,Jun, Jul, Aug, Sept, Oct, Nov, Dec = dummy variable of thetrading month, and 1 if it refers to the month and 0 if it doesnot.
Equations used for day-of-the-week-effecttesting
The cryptocurrency market lasts 7 days a weekand 24 hours per day, so the day variable used in-cluded those seven days: Monday, Tuesday, Wednes-day, Thursday, Friday, Saturday and Sunday.
푅퐶푡 = 훽1푀푂푁 + 훽2푇푈퐸 + 훽3푊퐸퐷 + 훽4푇퐻푈 + 훽5퐹푅퐼 +
훽6푆퐴푇 + 훽7푆푈푁 + 휀푡 (6)
With:
휀푡 = Φ푡휀푡−1 + ⋯+ Φ푡휀푡 + η푡 η푡 = 휎푡휀푡 휎2 = 훼 + 훼 η2 + ⋯+ 훼 η2 + 훽 σ2 + 훽 σ2
(7)

Examining the day-of-the-week-effect and the-month-of-the-year-effect in cryptocurrency marketRobiyanto Robiyanto, Yosua Arif Susanto, Rihfenti Ernayani
| 365 |
Where: t is independent and identically distributed N(0.1) and independent of the past state of t-p; RCt = ReturnCryptocurrency in period day t; Mon, Tue, Wed, Thu, Fri, Sat,Sn = dummy variable of the trading day, and 1 if it refers tothe day and 0 if it does not.
Before the GARCH analysis was performed,a data stationarity test was performed usingthe Augmented Dickey-Fuller (ADF) test to seewhether the data was flat or did not havea trend component (Greene, 2003).
3. Results
This study aims to determine the seasonalpatterns in the cryptocurrency market, especially inthe Bitcoin and Litecoin markets using the GARCHtest. Before conducting the GARCH test, the datastationarity test was performed by usingthe Augmented Dickey-Fuller (ADF) to see whetherthe data was stationary or not. Then, a correlogramtest was performed to see whether the cryptocurrencymarket was efficient or not. After performingthe correlogram test, it was followed with theGARCH test which used returns from Bitcoin and
Litecoin, both daily and monthly, for the last 5 yearsfrom 2014-2018. Descriptive statistics
The following Table 3 presents detail descrip-tive statistics of each trading day of Bitcoin andLitecoin.
During the study period, the average dailyreturn value of Bitcoin (0.00321) is higher thanLitecoin (0.00248), but the risk measured from thestandard deviation value of Bitcoin (0.09541) is alsohigher than Litecoin (0.07261). Based on the trad-ing days, the highest average of Bitcoin daily re-turn is found on Wednesday with a value of 0.01504,while the lowest is found on Tuesday (-0.00330). Thegreatest risk measured from the standard deviationof Bitcoin is found on Saturday (0.08714), and thelowest was on Friday (0.03632). Different things arealso found in Litecoin. The highest average ofLitecoin daily return is found on Tuesday with avalue of 0.00494, while the lowest is on Thursday (-0.00026). The greatest risk measured from theLitecoin standard deviation is found on Tuesday(0.07465), and the lowest is on Sunday (0.01827). TheBitcoin daily returns can be seen in Figure 1, whilethe Litecoin daily returns can be seen in Figure 2.
휀푡 = Φ푡휀푡−1 + ⋯+ Φ푡휀푡 + η푡η푡 = 휎푡휀푡 휎푡2 = 훼0 + 훼1η푡−1
2 + ⋯+ 훼푝η푡−푝2 + 훽1σ푡−12 + 훽푞σ푡−푞2
휀푡η 푅퐶
(8)(9)
Daily Return All-Day Monday Tuesday Wednesday Thursday Friday Saturday Sunday
Bitcoin Mean 0.00321 0.00213 -0.00330 0.01504 -0.00108 0.00156 0.00448 0.00363 Maximum 3.36839 0.21599 0.13901 3.36839 0.27201 0.13351 1.29105 0.21355 Minimum -0.57205 -0.43901 -0.21965 -0.25473 -0.57205 -0.16072 -0.13236 -0.19207 Std. Dev. 0.09541 0.04858 0.04102 0.21414 0.05743 0.03632 0.08714 0.03988
Litecoin
Mean 0.00248 0.00494 0.00116 -0.00007 -0.00026 0.000538 0.000295 0.000111 Maximum 1.436 0.45116 1.43600 0.73611 0.244898 0.342321 0.300699 0.236842 Minimum -0.60722 -0.60723 -0.20712 -0.27273 -0.43947 -0.1482 -0.18045 -0.13827 Std. Dev. 0.07261 0.07465 0.04280 0.02935 0.024032 0.019624 0.022125 0.01827
Table 3. Descriptive statistics of Bitcoin and Litecoin daily return

Jurnal Keuangan dan PerbankanVolume 23, Issue 3, July 2019: 361–375
| 366 |
Figure 1. Bitcoin daily return in 2014-2018
Figure 2. Litecoin daily return in 2014-2018
Meanwhile, the descriptive statistics of theBitcoin and Litecoin monthly returns based on thetrading month can be seen in Table 4. From Table 4,it can be seen that the monthly average value ofLitecoin (0.06224) is higher than the Bitcoin’s(0.055419). The risks measured on the standard de-
viation of Litecoin (0.41588) is greater than theBitcoin’s (0.23686). Based on the trading month, thehighest average of Bitcoin monthly return is foundin May (0.21561), while the lowest is in March (-0.14642). The same is also found in the risk level,the highest standard of monthly return deviation is

Examining the day-of-the-week-effect and the-month-of-the-year-effect in cryptocurrency marketRobiyanto Robiyanto, Yosua Arif Susanto, Rihfenti Ernayani
| 367 |
found in May (0.35305), and the lowest is in March(0.12601). Meanwhile, the highest Litecoin monthlyreturn is found in June (0.02433), while the lowestis in January -0.01430). The highest Litecoin risk isfound in December with a standard deviation of
0.21463, while the lowest risk is in July with a stan-dard deviation of 0.02880. The Bitcoin monthly re-turn can be seen in Figure 3, while the Litecoinmonthly return can be seen in Figure 4.
Figure 4. Litecoin monthly return in 2014-2018
Figure 3. Bitcoin monthly return in 2014-2018
Figure 4. Litecoin monthly return in 2014-2018

Jurnal Keuangan dan PerbankanVolume 23, Issue 3, July 2019: 361–375
| 368 |
Unit Root Test
In this study, the data stationarity test wasperformed by using Augmented Dickey-Fuller (ADF) with a significance level of 5 percentand the results can be seen in the following Table 4.
In Table 4, it can be seen that at a significancelevel of 5 percent, Prob. ADF Bitcoin and Litecoin,both daily and monthly, is smaller than alpha of0.05. As the probability of ADF is smaller than thealpha, the data is then considered stationary. Afterthe Bitcoin and Litecoin return data are stationary,a correlogram test is then performed to see whetherthere is an autocorrelation on the return. Afterthe correlogram test is done, a GARCH test is per-formed to see the seasonal patterns in the returnof Bitcoin and Litecoin.
Correlogram Test
In addition to using the ADF to see the datastationarity, this study also used a correlogramtest to see whether there is autocorrelation. Thedata returns used were the daily and monthlyreturns from Bitcoin and Litecoin. Determination oflag was done by using the natural logarithm of thenumber of observations. ln(1836) = 7.509 8 wasused for daily return, while ln(60) = 4.09 5 wasused for monthly return.
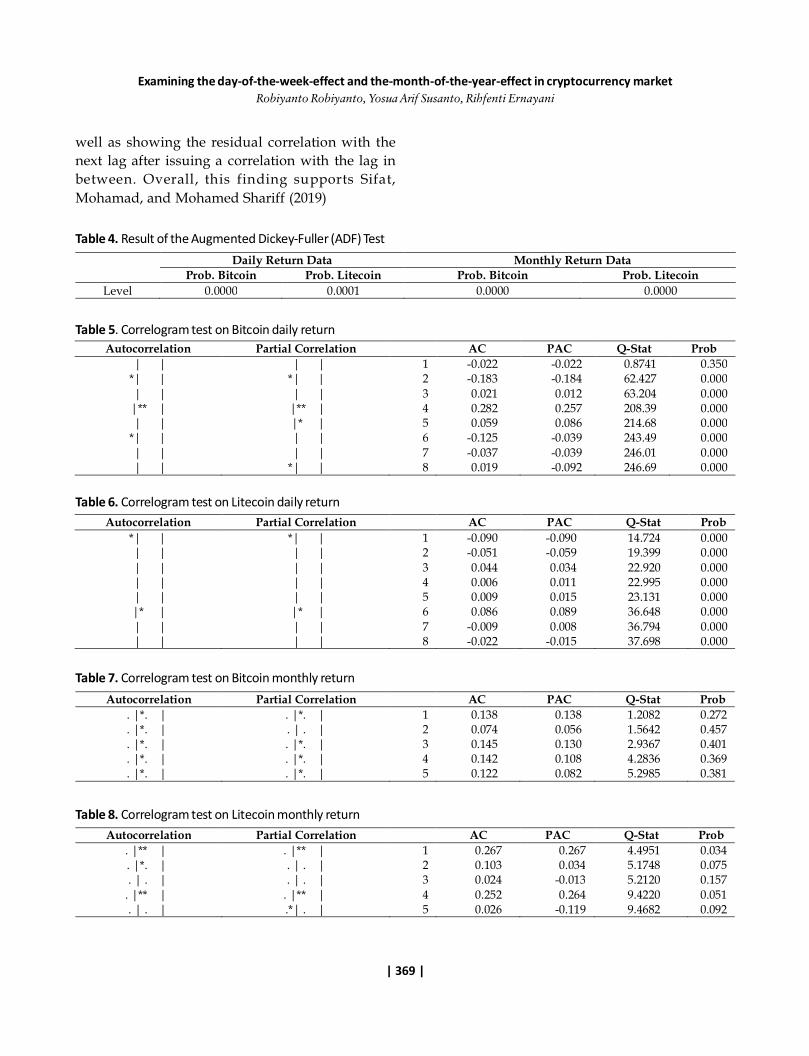
Table 5 presents the result of the correlogramtest of the Bitcoin daily return. It shows thatthe second to eighth Q-statistic lag probability hasa probability value smaller than 0.05. This indicatesthe existence of autocorrelation in the Bitcoin dailyreturn data. This result is also reinforced by thepresence of stand out autocorrelation (AC) and par-tial autocorrelation (PAC) (the second, fourth, andsixth lag for AC and the second, fourth, fifth andeighth lag for PAC). The AC shows the correlationvalue of an observation with the value at certainlag, whereas the PAC shows the correlation valueof an observation with the value at a certain lagwhich calculates the value of the interval in it, asTa
ble
3. D
escr
iptiv
e st
atist
ic o
f Bitc
oin
and
Litec
oin
mon
thly
retu
rn
Examining the day-of-the-week-effect and the-month-of-the-year-effect in cryptocurrency marketRobiyanto Robiyanto, Yosua Arif Susanto, Rihfenti Ernayani
| 369 |
Daily Return Data Monthly Return Data Prob. Bitcoin Prob. Litecoin Prob. Bitcoin Prob. Litecoin
Level 0.0000 0.0001 0.0000 0.0000
Autocorrelation Partial Correlation AC PAC Q-Stat Prob | | | | 1 -0.022 -0.022 0.8741 0.350 *| | *| | 2 -0.183 -0.184 62.427 0.000 | | | | 3 0.021 0.012 63.204 0.000
|** | |** | 4 0.282 0.257 208.39 0.000 | | |* | 5 0.059 0.086 214.68 0.000 *| | | | 6 -0.125 -0.039 243.49 0.000 | | | | 7 -0.037 -0.039 246.01 0.000 | | *| | 8 0.019 -0.092 246.69 0.000
Autocorrelation Partial Correlation AC PAC Q-Stat Prob *| | *| | 1 -0.090 -0.090 14.724 0.000 | | | | 2 -0.051 -0.059 19.399 0.000 | | | | 3 0.044 0.034 22.920 0.000 | | | | 4 0.006 0.011 22.995 0.000 | | | | 5 0.009 0.015 23.131 0.000 |* | |* | 6 0.086 0.089 36.648 0.000 | | | | 7 -0.009 0.008 36.794 0.000 | | | | 8 -0.022 -0.015 37.698 0.000
Autocorrelation Partial Correlation AC PAC Q-Stat Prob . |*. | . |*. | 1 0.138 0.138 1.2082 0.272 . |*. | . | . | 2 0.074 0.056 1.5642 0.457 . |*. | . |*. | 3 0.145 0.130 2.9367 0.401 . |*. | . |*. | 4 0.142 0.108 4.2836 0.369 . |*. | . |*. | 5 0.122 0.082 5.2985 0.381
Autocorrelation Partial Correlation AC PAC Q-Stat Prob . |** | . |** | 1 0.267 0.267 4.4951 0.034 . |*. | . | . | 2 0.103 0.034 5.1748 0.075 . | . | . | . | 3 0.024 -0.013 5.2120 0.157
. |** | . |** | 4 0.252 0.264 9.4220 0.051 . | . | .*| . | 5 0.026 -0.119 9.4682 0.092
Table 4. Result of the Augmented Dickey-Fuller (ADF) Test
Table 5. Correlogram test on Bitcoin daily return
well as showing the residual correlation with thenext lag after issuing a correlation with the lag inbetween. Overall, this finding supports Sifat,Mohamad, and Mohamed Shariff (2019)
Table 6. Correlogram test on Litecoin daily return
Table 7. Correlogram test on Bitcoin monthly return
Table 8. Correlogram test on Litecoin monthly return

Jurnal Keuangan dan PerbankanVolume 23, Issue 3, July 2019: 361–375
| 370 |
Meanwhile, Table 6 presents the results ofthe correlogram test for daily Litecoin daily return.It shows that the probability of the first toeighth lag has a Q-statistical probability value of lessthan 0.05. This indicates the existence of autocorrelationin the Litecoin daily return data. Similar to theBitcoin, the Litecoin’s significant Q-statistic valuealso reinforces this finding. The first and sixth ACand PAC lags on Litecoin stand out more than anyother lag.
Table 7presents the result of correlogram forBitcoin monthly return. It shows that the Q-statistichas a probability value greater than 0.05. This indi-cates the absence of autocorrelation in the Bitcoinmonthly return data, although all AC and PAC val-ues are relatively prominent. Meanwhile, Table 8presents the result of the correlogram test forLitecoin monthly return. It shows that the Q-statis-tic has a probability value smaller than 0.05 for thefirst lag only, reinforced by the AC and PAC values
that stand out in the first lag, and the AC and PACvalues for the next lag start to decline.
In general, the results of correlogram analy-sis on the Bitcoin and Litecoin markets indicate thatthere is an autocorrelation which means that theBitcoin and Litecoin markets tend to be inefficient.
Result of GARCH Analysis
After performing the stationarity andcorrelogram tests on Bitcoin and Litecoin returns,the GARCH test was performed. The type ofGARCH test used in this study was GARCH (1,1)which would be performed on Bitcoin andLitecoin return, both daily and monthly.
Based on Table 9, the average Bitcoin returnon Monday is positive. The average return on otherdays is not significantly different from Monday ex-cept on Wednesday and Thursday whose averagereturn is different from Monday (marginally sig-nificant at 10 percent).
Variable Coefficient Std. Error z-Statistic Prob. Monday 0.003830 0.001504 2.546492 0.0109 Tuesday -0.002883 0.001781 -1.619324 0.1054 Wednesday 0.002311 0.001342 1.722107 0.0851 Thursday 0.003277 0.001678 1.953428 0.0508 Friday 0.001644 0.001630 1.008272 0.3133 Saturday -0.000128 0.001611 -0.079156 0.9369 Sunday 0.001411 0.001556 0.906660 0.3646
Variance Equation C 4.79E-05 3.58E-06 13.38509 0.0000 RESID(-1)^2 0.226515 0.009449 23.97117 0.0000 GARCH(-1) 0.789415 0.006512 121.2241 0.0000 R-squared -0.000062 Mean dependent var 0.003213 Adjusted R-squared -0.003360 S.D. dependent var 0.095416 S.E. of regression 0.095576 Akaike info criterion -3.763447 Sum squared resid 16.61614 Schwarz criterion -3.733272 Log-likelihood 3446.027 Hannan-Quinn criteria. -3.752316 Durbin-Watson stat 2.041630
Table 9. GARCH (1,1) test for examining the day-of-the-week-effect on Bitcoin

Examining the day-of-the-week-effect and the-month-of-the-year-effect in cryptocurrency marketRobiyanto Robiyanto, Yosua Arif Susanto, Rihfenti Ernayani
| 371 |
Variable Coefficient Std. Error z-Statistic Prob. Monday 0.003442 0.001509 2.280539 0.0226 Tuesday -0.000427 0.001630 -0.261690 0.7936 Wednesday -0.002537 0.001147 -2.211971 0.0270 Thursday 0.001586 0.001033 1.535525 0.1247 Friday 0.003840 0.000914 4.201091 0.0000 Saturday 0.000252 0.001529 0.164544 0.8693 Sunday -0.000278 0.001254 -0.221545 0.8247
Variance Equation C 7.30E-05 7.86E-06 9.291123 0.0000 RESID(-1)^2 0.892241 0.023546 37.89374 0.0000 GARCH(-1) 0.558620 0.008783 63.60022 0.0000 R-squared -0.000695 Mean dependent var 0.002481 Adjusted R-squared -0.003996 S.D. dependent var 0.072613 S.E. of regression 0.072758 Akaike info criterion -3.030756 Sum squared resid 9.629191 Schwarz criterion -3.000581 Log-likelihood 2777.080 Hannan-Quinn criteria. -3.019625 Durbin-Watson stat 2.177162
Variable Coefficient Std. Error z-Statistic Prob. January -0.139807 0.027361 -5.109676 0.0000 February 0.179456 0.006415 27.97639 0.0000 March -0.047114 4.49E-06 -10497.33 0.0000 April 0.079092 1.20E-06 66131.13 0.0000 May 0.179178 1.73E-05 10343.07 0.0000 June 0.266545 0.000135 1969.134 0.0000 July -0.070792 0.000445 -158.9553 0.0000 August -0.082765 0.001620 -51.09788 0.0000 September 0.028592 0.005766 4.959002 0.0000 October 0.319141 0.003972 80.35163 0.0000 November 0.214404 0.003062 70.01466 0.0000 December 0.137524 0.105559 1.302816 0.1926
Variance Equation C 6.17E-12 3.28E-11 0.187842 0.8510 RESID(-1)^2 4.795348 0.263413 18.20468 0.0000 GARCH(-1) 0.004486 0.001440 3.115678 0.0018 R-squared -0.022600 Mean dependent var 0.051488 Adjusted R-squared -0.256946 S.D. dependent var 0.236858 S.E. of regression 0.265550 Akaike info criterion -1.166619 Sum squared resid 3.384818 Schwarz criterion -0.643033 Log-likelihood 49.99856 Hannan-Quinn criteria. -0.961815 Durbin-Watson stat 1.622535
Table 10. GARCH (1,1) test for examining the day-of-the-week-effect on Litecoin
Table 11. GARCH (1,1) test for examining the month-of-the-year-effect on Bitcoin

Jurnal Keuangan dan PerbankanVolume 23, Issue 3, July 2019: 361–375
| 372 |
Based on Table 10, the average Litecoin re-turn on Monday is positive. The average return onother days is not significantly different from Mon-day except on Wednesday and Friday whose aver-age return is different from Monday.
Based on Table 11, the average monthly re-turn of Bitcoin in January, March July and August isnegative, and the other months are positive. Theaverage return for each month is significantly dif-ferent except for December whose average returnis relatively no different from January.
Based on Table 12, the average monthly re-turn of Litecoin in February is positive. The aver-age return for each month is not significantly dif-ferent except for May. It was found that there areseveral months that have a significant effecton cryptocurrency returns. Therefore, H1 whichstates that there is a month-of-the-year effect onthe cryptocurrency market is empirically supported.
Furthermore, this study also found that there aredays that have a significant effect on cryptocurrencyreturns. Therefore, H2 stating that there is a day-of-the-week effect on the cryptocurrency market isempirically supported. The results of this study alsoshow that in the cryptocurrency market, there arealso exists anomalies. This finding supports Caporaleand Plastun (2018), also consistent with other finan-cial markets as documented by Olowe (2010),Abdalla (2012), Robiyanto (2015), and Swami (2012).
The coefficient of determination (R2) on allmodels used in this study has a negative sign. Thiswas a common condition because R2 was not neces-sarily the number of squares of a figure (Alexander,Tropsha, & Winkler, 2015). This finding indicatedthat the model used did not follow the trends inthe data, making the results of the model calcula-tion to not follow a horizontal line (Motulsky &Christopoulos, 2003). This condition was possible
Variable Coefficient Std. Error z-Statistic Prob. January -0.161896 0.322404 -0.502152 0.6156 February 0.241065 0.104290 2.311486 0.0208 March -0.100034 0.152193 -0.657283 0.5110 April -0.009007 0.162172 -0.055542 0.9557 May -0.257506 0.087999 -2.926225 0.0034 June -0.013149 0.155417 -0.084603 0.9326 July -0.212614 0.144792 -1.468416 0.1420 August -0.152806 0.176572 -0.865404 0.3868 September -0.065143 0.336270 -0.193723 0.8464 October -0.054923 0.174246 -0.315201 0.7526 November -0.057052 0.126134 -0.452313 0.6510 December 0.014744 0.180117 0.081861 0.9348
Variance Equation C 0.061808 0.032851 1.881470 0.0599 RESID(-1)^2 0.903487 0.463227 1.950419 0.0511 GARCH(-1) -0.030762 0.063473 -0.484646 0.6279 R-squared -0.148615 Mean dependent var 0.062243 Adjusted R-squared -0.411839 S.D. dependent var 0.415883 S.E. of regression 0.494156 Akaike info criterion 1.079296 Sum squared resid 11.72111 Schwarz criterion 1.602882 Log-likelihood -17.37889 Hannan-Quinn criteria. 1.284099 Durbin-Watson stat 1.237733
Table 12. GARCH (1,1) test for examining the month-of-the-year-effect on Litecoin

Examining the day-of-the-week-effect and the-month-of-the-year-effect in cryptocurrency marketRobiyanto Robiyanto, Yosua Arif Susanto, Rihfenti Ernayani
| 373 |
because the independent variables used were thereturn cryptocurrency which can also be seen in Fig-ure 1., 2., 3., and 4.
The study also found that only Decemberwhich has no significant effect on the Bitcoin return.This showed that towards the end of the year, thecryptocurrency market participants tend to reducetheir trading activities to enjoy the end of year holi-days. The cryptocurrency market is always knownas a market that is always active and never stopsso. Therefore, the market participants must be wisein responding to the time of the non-stop trading. Arelatively similar thing was also found in the stockand commodity markets (Lucey & Zhao, 2008; Lean& Tan, 2010; Lean, 2011).
4. Conclusion, Limitations, and SuggestionsConclusion
This study aims to understand whether thereare patterns on the cryptocurrency market, espe-cially on Bitcoin and Litecoin, or whether the mar-ket moves randomly. The results of GARCH (1,1)and correlogram test show that the cryptocurrencymarket does not move randomly, but there are phe-nomena of day-of-the-week and month-of-the-yeareffect. Therefore, the cryptocurrency market wasnot an efficient market because it had a certain pat-tern in the movement of the returns which made itfollowed a certain pattern and was not moving ran-domly because of the many requests and offers thatoccurred in the market. The pattern in the Bitcoin
and Litecoin pattern could later be utilized by in-vestors by buying the cryptocurrency before therewas an increase in the return and selling themwhen the returns increased. For example, the inves-tors should buy Bitcoin at the end of January be-cause the return tended to be significantly negativeand they should sell them at the end of Februarybecause the return tended to be significantly posi-tive. Meanwhile, to conduct Litecoin trading, theinvestors could make a purchase before the end ofJanuary and then sell them at the end of Februarybecause it was found that there is a significant posi-tive return in February which shows the potentialfor generating profits for investors. Meanwhile, forthe investors who traded daily, Monday, Wednes-day and Thursday were found to be the days wherethe Bitcoin have the potential to generate daily prof-its. While on the Litecoin, Friday was found to havethe potential to generate daily profits.
Limitations and suggestions
This study has several shortcomings and limi-tations. It is expected that future studies may exam-ine another potential cryptocurrency. Furthermore,due to limited researches discussing the cryptocurrencymarket, it is expected that there will be more futurestudies discussing in-depth cryptocurrency markets.For example, there can be studies examining the fea-sibility of cryptocurrency as an investment tool. Fur-ther, other research may examine the Rogalskieffect to see the anomaly of the level of cryptocurrencyreturns on certain days with a certain month.
References
Abdalla, S. Z. S. (2012). Day-of-the-week effect on returns and conditional volatility/ : Empirical Evidence fromSudanese Stock Market. Middle Eastern Finance Economics, (16), 167-180.
Alexander, D. L. J., Tropsha, A., & Winkler, D. A. (2015). Beware of R2: simple, unambiguous assessment of theprediction accuracy of QSAR and QSPR models. Journal of Chemical Inference Model, 55(7), 1316-1322.https://dx.doi.org/10.1021%2Facs.jcim.5b00206
Anonimous. (2015). Lite coin white paper. Retrieved from http://zioncoins.co.uk/wp-content/uploads/2015/06/Lite-Coin-Whitepaper.pdf

Jurnal Keuangan dan PerbankanVolume 23, Issue 3, July 2019: 361–375
| 374 |
Badev, A., & Chen, M. (2014). Bitcoin: technical background and data analysis. Finance and Economics DiscussionSeries. Retrieved from https://www.federalreserve.gov/econresdata/feds/2014/files/2014104pap.pdf
Bollerslev, T. (1986). Generalized autoregressive conditional heteroscedasticity. Journal of Econometrics, 31, 307-327.https://doi.org/10.1016/0304-4076(86)90063-1
Caporale, G. M., & Plastun, A. (2018). The day of the week effect in the cryptocurrency market. Finance ResearchLetters. https://doi.org/10.1016/j.frl.2018.11.012
Caporale, G. M., & Zakirova, V. (2017). Calendar anomalies in the Russian stock market. Russian Journal of Economics,3(1), 101-108. https://doi.org/10.1016/j.ruje.2017.02.007
Conway, J. (2014). Beginners Guide to Cryptocurrencies. Retrieved from https://www.joeyconway.com/blog/wp-content/uploads/2014/10/Beginners-Guide-to-Cryptocurrencies-final.pdf
Greene, W. H. (2003). Econometric Analysis 5th Edition. New Jersey: Prentice-Hall.
ICBA. (2015). Virtual Currency: Risks and Regulation. Washington, DC: Independent Community Bankers of AmericaRetrieved from https://www.icba.org
Lean, H. H. (2011). The halloween puzzle in selected Asian Stock Markets. International Journal of Economics andManagement, 5(1), 216-225.
Lean, H. H., & Tan, V. K. M. (2010). Existence of the day of the week effect in FTSE Bursa Malaysia. Jurnal Pengurusan,31, 3-11. https://doi.org/10.17576/pengurusan-2010-31-01
Lucey, B. M., & Zhao, S. (2008). Halloween or January? Yet another puzzle. International Review of Financial Analysis,17, 1055-1069. https://doi.org/10.2139/ssrn.887861
Marrett, G., & Worthington, A. (2011). The month-of-the-year effect in the Australian Stock Market: A Shorttechnical note on the market, industry and firm size impacts. Australasian Accounting Business and Finance, 5(1),117-123. https://doi.org/10.2139/ssrn.1290886
Motulsky, H. J., & Christopoulos, A. (2003). Fitting Models to Biological Data using Linear and Nonlinear Regression. SanDiego, CA.: GraphPad Software Inc.
Nakamoto, S. (2008). Bitcoin: A peer-to-peer electronic cash system.
Olowe, R. A. (2010). Oil price volatility, global financial crisis and the month-of-the-year effect. International Journal ofBusiness and Management, 5(11), 156-170. https://doi.org/10.5539/ijbm.v5n11p156
Pulungan, D. P., Wahyudi, S., & Suharnomo, S. (2018). Does the crude palm oil market walk randomly. JurnalKeuangan dan Perbankan, 22(2), 211–218 https://doi.org/10.26905/jkdp.v22i2.2023
Richter, C., Kraus, S., & Bouncken, R. B. (2015). Virtual currencies like Bitcoin as a paradigm shift in the field oftransactions. International Business & Economics Research Journal, 14(4), 575-586.https://doi.org/10.19030/iber.v14i4.9350
Rita, M. R. (2009). Pengaruh hari perdagangan terhadap return saham: Pengujian day of the week effect, week-foureffect dan Rogalski Effect di BEI. Jurnal Ekonomi dan Bisnis, 15(2), 121-134.
Robiyanto, R. (2015). Month of the year effect pada beberapa pasar modal di Asia Tenggara dan pasar komoditas. JurnalEkonomi dan Bisnis, 18(2), 53-64. https://doi.org/10.24914/jeb.v18i2.260
Robiyanto, R. (2017). Month of the year effect pada pasar obligasi di Indonesia. Jurnal Ekonomi dan Bisnis, 20(2), 291-302. https://doi.org/10.24914/jeb.v20i2.1093
Robiyanto, R., & Pangestuti, I. R. D. (2018). Weak form market efficiency in the cryptocurrency market. Paper presentedat the 2nd International Conference on Management & Entrepreneurship (2nd i-CoME), Yogyakarta, Indo-nesia.

Examining the day-of-the-week-effect and the-month-of-the-year-effect in cryptocurrency marketRobiyanto Robiyanto, Yosua Arif Susanto, Rihfenti Ernayani
| 375 |
Seetharaman, A., Saravanan, A. S., Patwa, N., & Mehta, J. (2017). Impact of Bitcoin as a world currency. Accountingand Finance Research, 6(2), 230. https://doi.org/10.5430/afr.v6n2p230
Sifat, I. M., Mohamad, A., & Mohamed Shariff, M. S. B. (2019). Lead-lag relationship between Bitcoin and Ethereum:Evidence from hourly and daily data. Research in International Business and Finance, 50, 306-321.https://doi.org/10.1016/j.ribaf.2019.06.012
Suganda, T. R., Sumargo, I. K., & Robiyanto, R. (2018). Superstitious behavior and stock return: The case of Javanesetraditional calendar. Kasetsart Journal of Social Sciences. https://doi.org/10.1016/j.kjss.2018.08.008
Swami, R. (2012). Calendar anomalies in the Bourses of South Asia. Market Convergence, 2(2), 64-74.
Þilicã, E. V., & Oprea, D. (2014). Seasonality in the Romanian Stock Market: The-day-of-the-week effect. ProcediaEconomics and Finance, 15, 704-710. https://doi.org/10.1016/s2212-5671(14)00543-7
Zhang, J., Lai, Y., & Lin, J. (2017). The day-of-the-week effects of stock markets in different countries. Finance ResearchLetters, 20, 47-62. https://doi.org/10.1016/j.frl.2016.09.006