examining the effect of maternal high-fat diet consumption
TRANSCRIPT

Portland State University Portland State University
PDXScholar PDXScholar
Dissertations and Theses Dissertations and Theses
1-1-2012
Examining the Effect of Maternal High-Fat Diet Examining the Effect of Maternal High-Fat Diet
Consumption on the Physiology and Pancreas Consumption on the Physiology and Pancreas
Development of Fetal and Juvenile Nonhuman Development of Fetal and Juvenile Nonhuman
Primate Offspring Primate Offspring
Sarah Michelle Comstock Portland State University
Follow this and additional works at: https://pdxscholar.library.pdx.edu/open_access_etds
Let us know how access to this document benefits you.
Recommended Citation Recommended Citation Comstock, Sarah Michelle, "Examining the Effect of Maternal High-Fat Diet Consumption on the Physiology and Pancreas Development of Fetal and Juvenile Nonhuman Primate Offspring" (2012). Dissertations and Theses. Paper 551. https://doi.org/10.15760/etd.551
This Dissertation is brought to you for free and open access. It has been accepted for inclusion in Dissertations and Theses by an authorized administrator of PDXScholar. Please contact us if we can make this document more accessible: [email protected].

Examining the Effect of Maternal High-Fat Diet Consumption on the Physiology and
Pancreas Development of Fetal and Juvenile Nonhuman Primate Offspring
by
Sarah Michelle Comstock
A dissertation submitted in partial fulfillment of the
requirements for the degree of
Doctor of Philosophy
in
Biology
Dissertation Committee:
Keith Garlid, Chair
Brad Buckley
Kevin Grove
Jason Podrabsky
Charles Roberts
David Peyton
Portland State University
©2012

Comstock, i
Abstract
The purpose of these studies was to investigate the impact of high-fat diet (HFD)
exposure during pregnancy and the early post-natal period on fetal and post-natal
development of the endocrine pancreas of the Japanese macaque. Specifically I
hypothesized that the HFD would alter islet morphology and lead to disturbances in
glucose homeostasis in these animals.
Adult female Japanese macaques were placed on either a control (CTR) or HFD
diet for 4 years. Fetuses were collected at gestational day 130 (G130), while other
offspring from the CTR and HFD mothers were carried to term. After birth, infant
animals were maintained with their mothers on the same diet then weaned onto either the
CTR or HFD diet for five months. Animals were studied up to 13 months of age, yielding
4 postnatal groups: CTR/CTR, CTR/HFD, HFD/CTR and HFD/HFD. Pancreata were
collected from these offspring for gene expression and immunohistochemical analysis.
Physiological measurements, including body weight, body fat percentage, fasting
glucose, insulin, glucagon and response to intravenous glucose tolerance tests (IVGTTs)
and an intravenous insulin tolerance test (IVITT) were collected from the post-natal
offspring.
Total fetal islet mass and β cell mass were not changed, but α cell mass was
significantly decreased in HFD fetuses, leading to a significant increase in the β cell to α
cell ratio in HFD fetal offspring. The HFD offspring displayed a significant change from
CTR offspring in expression of genes involved in glucose homeostasis and islet
neogenesis, including PDX1, NeuroD, Glucokinase and Glut2. Postnatal HFD animals
were significantly heavier than CTR offspring and had increased adiposity by 6-7 months

Comstock, ii
of age. There was no significant effect on fasting or stimulated insulin secretion at this
time point, but HFD offspring were significantly insulin resistant just prior to weaning.
At 13 months of age, basal and glucose-stimulated insulin secretion were elevated
in HFD/HFD animals and the CTR/HFD group displayed moderate insulin resistance.
There was also a significant sex effect, with males from the HFD/CTR and HFD/HFD
group having increased body weight and elevated fasting glucose. Although pancreata
from both the HFD/HFD and CTR/HFD animals displayed significant changes in
expression of genes involved in glucose homeostasis, the pattern was distinct for the two
groups. Islet mass was also elevated in both of these groups; yet, HFD/HFD only
displayed an increase in β cell area, while CTR/HFD had a concomitant increase in α cell
area, which served to normalize the β cell to α cell ratio to control levels. In contrast, the
HFD/HFD group exhibited a 40% increase in the β cell to α cell ratio.
These studies demonstrate that in-utero exposure to a HFD leads to decreased α
cell plasticity in response to chronic post-natal HFD consumption. Animals exposed to
the HFD during pregnancy and the early post-natal period become insulin resistant, but
remain normoglycemic. HFD consumption during the post-weaning period causes similar
complications in glucose homeostasis and islet mass in both the CTR/HFD and
HFD/HFD animals. However, there are distinct differences in the molecular and cellular
adaptive response between these two groups.

Comstock, iii
Dedication
To my husband, Ben Comstock
You are my rock and encouragement.
Thank you for your love and support.
To my son, Droiy Comstock
You are my inspiration and my joy.
Thank you for your love and enthusiasm.

Comstock, iv
Acknowledgments
I would like to acknowledge and thank all those who have helped make this
research possible. First I am grateful to the members of my committee. Thank you, Dr.
Kevin Grove for mentoring me and allowing me to complete my research in your lab.
Thank you, Dr. Keith Garlid for your willingness to support me in the accomplishment
of this research. Thank you to the other members of my committee, Dr. Bradley
Buckley, Dr. Jason Podrabsky, Dr. David Peyton and Dr. Charles Roberts, for being
supportive and flexible.
I am grateful to the members of my lab. Thank you, Anne Evans for introducing
me to laboratory research and for being a supportive friend through both the fortunate and
difficult chapters of the past 10 years. Thank you, Diana Takahashi for taking over the
NHP projects and being a gracious manager and friend. I am grateful to the members of
the Gestational Diabetes Mellitus Team and the Obese Resource Team from the
Grove Laboratory who are dedicated to the care of our animals.
I also want to acknowledge and thank the technical assistance of many at the
Oregon National Primate Research Center, including the Division of Animal Resources,
the Veterinary Staff, the RIA Core, and the Imaging Core.
I am also grateful to the members of my family for their support and
encouragement throughout the completion of my PhD research. Thank you, Gary and
Julie Williams, Tim and Sandra Joachim, Alex Williams and Jeff, Maureen and
Jenny Comstock for your love and support.

Comstock, v
Table of Contents
Abstract ................................................................................................................................ i
Dedication .......................................................................................................................... iii
Acknowledgments.............................................................................................................. iv
List of Tables ................................................................................................................... viii
List of Figures .................................................................................................................... ix
List of Abbreviations ......................................................................................................... xi
Chapter 1: Background and Introduction ..................................................................... 1
Introduction ................................................................................................................. 2
Obesity ......................................................................................................................... 5
Homeostasis ................................................................................................................. 7
Pancreas Morphology, Function and Development .................................................... 9
Type 2 Diabetes Mellitus and the Glucolipotoxicity Hypothesis .............................. 14
Animal Models of Maternal Overnutrition ................................................................ 17
Animal Models of Intrauterine Growth Restriction .................................................. 20
Chapter 1 Figures....................................................................................................... 23
Chapter 1 Table ......................................................................................................... 28
Chapter 2: Model and Study Design ............................................................................. 30
A Nonhuman Primate Model of Maternal HFD Consumption ................................. 31
Metabolic Syndrome and Type 2 Diabetes Mellitus in the Macaque ........................ 35

Comstock, vi
Effect of Maternal HFD Consumption on NHP Offspring........................................ 36
Specific Aims ............................................................................................................ 39
Chapter 2 Figures....................................................................................................... 41
Chapter 2 Table ......................................................................................................... 44
Chapter 3: Maternal High-fat Diet Consumption During Pregnancy Leads to
Reduced α Cell Mass in Fetal Offspring ....................................................................... 46
Introduction ............................................................................................................... 47
Materials and Methods .............................................................................................. 49
Results ....................................................................................................................... 53
Discussion .................................................................................................................. 57
Chapter 3 Figures....................................................................................................... 62
Chapter 3 Tables ........................................................................................................ 69
Chapter 4: High-Fat Diet During Perinatal Development Leads to Early Insulin
Resistance in the Nonhuman Primate Infant ............................................................... 73
Introduction ............................................................................................................... 74
Materials and Methods .............................................................................................. 75
Results ....................................................................................................................... 77
Discussion .................................................................................................................. 79
Chapter 4 Figures....................................................................................................... 81
Chapter 4 Tables ........................................................................................................ 85
Comstock, vii
Chapter 5: Chronic High-Fat Diet Consumption During Pregnancy and the Early
Postnatal Period Leads to Decreased α Cell Plasticity in the Juvenile Nonhuman
Primate ............................................................................................................................. 89
Introduction ............................................................................................................... 90
Materials and Methods .............................................................................................. 92
Results ....................................................................................................................... 96
Discussion ................................................................................................................ 100
Chapter 5 Figures..................................................................................................... 106
Chapter 5 Tables ...................................................................................................... 116
Chapter 6: Limitations and Future Studies................................................................ 122
Limitations of the HFD Fed Macaque Model ......................................................... 123
Future Study Recommendations .............................................................................. 125
Chapter 7: Summary and Discussion .......................................................................... 130
Fetal Effects of the Maternal HFD .......................................................................... 132
Post-natal Effects of the HFD .................................................................................. 135
Chapter 7 Figures..................................................................................................... 138
Works Cited ................................................................................................................... 143
Comstock, viii
List of Tables
Table 1.1: Embryonic/Fetal Development of the Pancreas in Macaques and Humans .... 29
Table 2.1: Post-natal offspring groups .............................................................................. 45
Table 3.1: Comparison of CTR and HFD Fetuses ............................................................ 70
Table 3.2: Real-time RT-PCR Gene Expression in Fetal Pancreas .................................. 71
Table 3.3: Comparison of CTR and HFD Dams............................................................... 72
Table 4.1: Physiology of P30 and P90 Offspring ............................................................. 86
Table 4.2: Physiology of P180 and P210 Offspring ......................................................... 87
Table 4.3: Physiology of Dams of Infant Offspring ......................................................... 88
Table 5.1: Juvenile Physiology ....................................................................................... 117
Table 5.2: Juvenile Female Physiology .......................................................................... 118
Table 5.3: Juvenile Male Physiology .............................................................................. 119
Table 5.4: Real-time PCR Values of Juvenile Pancreas ................................................. 120
Table 5.5: α cell and β cell Measurements...................................................................... 121

Comstock, ix
List of Figures
Figure 1.1: Metabolic Syndrome ...................................................................................... 24
Figure 1.2: Diagram of Glucose Homeostasis .................................................................. 25
Figure 1.3: Diagram of Fully Formed Pancreas................................................................ 26
Figure 1.4: Glucose-stimulated Insulin Secretion in the β cell ......................................... 27
Figure 2.1: Characterization of CTR and HFD Dams ...................................................... 42
Figure 2.2: Characterization of Metabolic Syndrome and Diabetes in Females .............. 43
Figure 3.1: Diagram of Pancreas Sections ........................................................................ 63
Figure 3.2: Immunohistochemical Analysis of Fetal Islet Mass....................................... 64
Figure 3.3: Islet Characterization in Fetal Offspring ........................................................ 65
Figure 3.4: β cell Correlation Analysis ............................................................................. 66
Figure 3.5: Transcription Factor Expression in Fetal Pancreas ........................................ 67
Figure 3.6: Expression of Genes Involved in Glucose-stimulated Insulin Secretion in
Fetal Pancreas ................................................................................................................... 68
Figure 4.1: P30 Physiology ............................................................................................... 82
Figure 4.2: P90 Physiology and Maternal IVGTT IAUC ................................................. 83
Figure 4.3: P180 and P210 Physiology ............................................................................. 84
Figure 5.1: Juvenile Physiology ...................................................................................... 107
Figure 5.2: Sex Differences in Body Weight and Fasting Glucose ................................ 108
Figure 5.3: Juvenile Islet Mass and Contributing Factors .............................................. 109
Figure 5.4: Relative Mass, Diameter and Density of Islets ............................................ 110
Figure 5.5: α cell and β cell Mass ................................................................................... 111
Figure 5.6: β cell and α cell Quantification ................................................................... 112
Comstock, x
Figure 5.7: Gene Expression in Juvenile Pancreas ......................................................... 113
Figure 5.8: Normalized Gene expression in Juvenile Pancreas ...................................... 114
Figure 5.9: Glut2 versus Glut1 Expression ..................................................................... 115
Figure 7.1: Islet Development in the CTR versus HFD Offspring ................................. 139
Figure 7.2: Islet Paracrine Function – Glucagon Regulation of Insulin Secretion ......... 140
Figure 7.3: Islet Paracrine Function – Insulin Regulation of Glucagon Secretion ......... 141
Figure 7.4: Pathological Progression to T2DM .............................................................. 142

Comstock, xi
List of Abbreviations
Cldu – 5-chlorodeoxyuridine
CNS – central nervous system
CTR – control
CTR/CTR – postnatal offspring born to a mother on a CTR diet and maintained on this
diet until necropsy at 13 months of age.
CTR/HFD – postnatal offspring born to a mother on a CTR diet and switched to the HFD
after weaning at approximately 8 months of age.
CVD – cardiovascular disease
DHA - docosahexaenoic acid
FFA – free fatty acid
G130 –fetus collected by c-section at 130 days gestation
GIP – gastric inhibitory peptide
GK - glucokinase
GLP-1 – glucagon like peptide-1
GLUT1 – facilitated glucose transporter 1

Comstock, xii
GLUT2 – faciltiated glucose transporter 2
GLUT5 – facilitated glucose transporter 5
GR – glucagon receptor
GSIS – glucose-stimulated insulin secretion
HFD – high-fat diet
HFD/CTR – postnatal offspring born to a mother on a HFD and switched to the CTR diet
after weaning at approximately 8 months of age
HFD/HFD – postnatal offspring born to a mother on a HFD and maintained on this diet
until necropsy at 13 months of age.
HGP – hepatic glucose production
HNF4α – hepatocyte nuclear factor 4 alpha is a transcription factor that facilitates
KCNJ11 transcription
IAPP – islet amyloid polypeptide
Idu – 5-iododeoxyuridine
INGAP – islet neogenesis-associated protein
IR – insulin receptor

Comstock, xiii
IUGR – intra-uterine growth restriction
IVGTT – intravenous glucose tolerance test
IVITT – intravenous insulin tolerance test
KATP – potassium sensitive ATP channel
KCNJ11 – gene encoding for Kir6.2
Kir6.2 - inward rectifier K+ channel subunit of the KATP channel in islet cells
MafA – musculoaponeurotic fibrosarcoma oncogene homolog A
MetS – metabolic syndrome
NAFLD – non-alcoholic fatty liver disease
NHP – nonhuman primate
NKX6.1 – NK6 homeobox 1 is a transcription factor expressed in β cells
NeuroD – also called BETA2 is a transcription factor expressed in islet cells
P30 – postnatal day 30 in NHP offspring
P90 – postnatal day 90 in NHP offspring
P180 – postnatal day 180 in NHP offspring
Comstock, xiv
P210 – postnatal day 210 in NHP offspring
PCR – polymerase chain reaction
PCK1 - phosphoenolpyruvate carboxykinase 1 is a transcription factor involved in
hepatic gluconeogenesis
PDX1 – pancreatic duodenal homeobox 1 is a transcription factor expressed in the
pancreas
PGC1A - peroxisome proliferator-activated receptor gamma coactivator-1 alpha is a
transcription factor involved in hepatic gluconeogenesis
PUFA – polyunsaturated fatty acid
qRT-PCR – quantitative reverse-transcription PCR
SUR1 – sulfonylurea receptor 1subcomponent of the KATP channel in islet cells
T2DM – Type 2 Diabetes Mellitus
TG – triglyceride
TUNEL - terminal deoxynucleotidyl transferase dUTP nick end labeling

Comstock, 1
Chapter 1: Background and Introduction

Comstock, 2
Introduction
The framework of my research is based on the theory that environmental stimuli
during fetal development lead to adaptations in the fetus to prepare it for post-natal life
conditions. This concept was first presented by Dr. David Barker, a physician and
professor of clinical epidemiology at the University of Southampton and a professor in
the Department of Cardiovascular Medicine at Oregon Health and Science University.
Based on his research in epidemiology, Dr. Barker presented the now widely accepted
theory that disturbed intrauterine growth has a negative influence on fetal development
which leads to an increased risk for multiple diseases later in life, such as Type 2
Diabetes Mellitus (T2DM) and cardiovascular disease (CVD) (Barker, Winter, Osmond,
Margetts, & Simmonds, 1989; Hales & Barker, 1992). During fetal development, the in-
utero environment is significantly affected by maternal health and nutrition. The
conditions at this stage provide a signal to the fetus of what to expect after birth. The
fetus often adapts to early life stress, such as malnourishment, by trading off the
development of less critical organs, such as the pancreas, in favor of maintaining the
development of essential organs such as the brain. These adaptations allow the fetus to
survive until birth while maintaining critical organs that are essential for post-natal
survival. However, poor development of less essential organs usually leads to significant
health complications during later life.
Many studies on humans and animals support this hypothesis. However, a unique
human population, composed of adult children born to mothers who were pregnant
during the Dutch famine, provides distinctive insight into the link between fetal
Comstock, 3
undernutrition and adverse post-natal health effects (Smith, 1947a). This famine lasted
from November 1944 to May 1945 due to an exhaustion of food supplies during World
War II in the western portion of the Netherlands. At the height of the famine, official
rations fell to between 400 and 800 calories per day. While pregnant and lactating
women were entitled to additional food, supplies were insufficient to accommodate this
need. However, when the Netherlands was liberated in May 1945, food rations rose
nearly immediately to over 2000 calories per day (T. Roseboom, de Rooij, & Painter,
2006). Studies performed on survivors of this famine demonstrated that babies born
during the famine were growth restricted, weighing about 200 grams lighter at birth than
those born to the same mothers not during the famine (Smith, 1947b). Offspring during
their adult life were also found to have an increased risk for developing T2DM and CVD
(Ravelli et al., 1998; T. J. Roseboom et al., 2000). The health complications observed in
the Dutch famine adult offspring demonstrate a significant effect of fetal malnourishment
on adult health outcomes. Based on this and many other studies of fetal intra-uterine
growth restriction (IUGR), Dr. Barker hypothesized that fetuses that undergo IUGR
develop a “thrifty phenotype,” which makes them more likely to conserve energy and
become obese later in life. The early life undernutrition permanently changes glucose-
insulin metabolism which leads to insulin resistance and reduced insulin secretion
(Phillips, 1996). This ultimately leads to an increased incidence of obesity and T2DM
within this population (Hales & Barker, 1992).
Although fetal malnoushiment may be an expected concern in developing
countries, where many young women of child-bearing years are chronically under-

Comstock, 4
nourished, it is also a concern in Western countries, such as those in North America and
the Europen Union. It is important to understand that both maternal undernutrition and
overnutrition can result in fetal malnourishment, when inappropriate nutrients are
delivered to the fetus. For example, in the case of overnutrition, maternal consumption of
high calorie diets has been demonstrated to lead to fetal malnoushishment because these
diets are unbalanced in macronutrients and deficient in micronutrients necessary for
normal fetal development (Shafrir & Khassis, 1982). These diets are usually rich in
carbohydrates and saturated fat, but deficient in protein and essential vitamins, which
directly affect fetal nutrient availability (Rao et al., 2001; Villar et al., 2003). Also, the
diets have a direct impact on the health of the mother, because consumption of a high
calorie diet usually leads to the development of obesity. Maternal obesity can greatly
affect the nutrient supply to the fetus because placental function is significantly affected
if a mother is excessively overweight (Farley et al., 2009; Radaelli et al., 2009;
Varastehpour et al., 2006). The affect on the placenta often translates to fetal IUGR
because the complications of obesity result in fetal malnourishment. Maternal obesity
greatly increases the risk of obesity in their offspring. It is necessary to understand how
the unbalanced or restricted nutrient supply from these mothers affects the developing
fetus. My research focuses on how maternal obesity and the consumption of a high-
calorie/high-fat diet may affect the developing offspring.

Comstock, 5
Obesity
Obesity is a global epidemic. In fact, approximately 20% of the world’s
population is classified as either obese or overweight (Finucane et al.). However, in the
United States, the world leader in this health crisis, more than one third of adults are
obese, while an additional one third are classified as overweight (Ogden et al., 2006).
While obesity is a serious health concern, the added burden of the co-morbidities
associated with obesity, including T2DM and CVD, make this disease a significant
health burden (Burton, Foster, Hirsch, & Van Itallie, 1985). In fact, a classification
termed Metabolic Syndrome (MetS) has been designated to a cluster of metabolic risk
factors that usually appear together and directly promote the development of both CVD
and T2DM (Grundy et al., 2005). These factors include central obesity, elevated
triglycerides, reduced HDL cholesterol, elevated blood pressure and elevated fasting
glucose (Alberti et al., 2009) (Fig. 1.2). While some health organizations encourage
treating the symptoms individually and discourage this classification (R. Kahn, Buse,
Ferrannini, & Stern, 2005), the coexistence of these disorders appears to be more frequent
than would be expected by chance (Grundy, 2006). In addition, the clustering of these
symptoms increase the risk for CVD and T2DM above the effect of individual risk
factors. Moreover, increasing evidence indicates that insulin resistance may be the
common etiological factor that is leading to these symptoms (Haffner et al., 1992;
Zimmet, 1992).
An additional confounding factor that adds to the obesity crisis is children born to
obese mothers (Boney, Verma, Tucker, & Vohr, 2005; Forsen et al., 1997; Koupil &

Comstock, 6
Toivanen, 2008; Whitaker, 2004) or those who consume a high-fat diet (HFD) during
pregnancy (Bayol, Simbi, & Stickland, 2005; Buckley et al., 2005) are at increased risk
for childhood obesity and MetS. This is evidenced by the steep rise in childhood obesity
that has followed the increase in adult obesity within the last few decades. In fact, today
approximately 17% of children in the United States are classified as obese, while an
additional 14% are overweight (Ogden, Carroll, Curtin, Lamb, & Flegal, 2010).
Childhood obesity is becoming an epidemic that has far reaching effects in most modern
societies. Likewise, the International Obesity Task Force categorizes over 20% of
children in the European Union as being overweight or obese (Cattaneo et al., 2010).
Since early childhood and adolescent obesity is a strong predictor of being obese or
overweight as an adult (Guo, Wu, Chumlea, & Roche, 2002; Magarey, Daniels, Boulton,
& Cockington, 2003), this rise in childhood obesity indicates that we have not reached
the peak in the obesity health crisis that is plaguing our world today. If the incidence of
obesity continues to rise, especially among women, we will likely see an increased
incidence of childhood MetS in future generations. It is necessary to understand the
mechanisms that lead to the increased risk for childhood obesity and MetS in order to
treat or prevent this disease.

Comstock, 7
Homeostasis
In order to understand the disease progression of obesity and MetS, it is essential
to keep in mind the normal homeostatic mechanisms that are disregulated by these health
issues. As I indicated earlier, many factors are pushing the scale toward increased energy
input while minimizing energy output. However, the healthy individual maintains a
normal, steady weight due to a balance between signals from both the central nervous
system (CNS) and peripheral organs. There is complex interplay between peripheral
hormone signaling and CNS processing of these signals.
A important homeostatic mechanism is the regulation of whole-body glucose
homeostasis. Glucose is an essential fuel source for the body, that, when broken down
within individual cells, provides sufficient energy to support most cellular processes
(Dzeja & Terzic, 2003; Dzeja, Zeleznikar, & Goldberg, 1998). The circulating levels of
glucose within a healthy individual are tightly controlled by counterregulatory hormones.
In fact, after a meal, when circulating glucose levels rise, insulin is released by the
pancreas and leads to glucose uptake and utilization by various organs, which, in turn,
reduces the level of glucose in the circulation (Cushman & Wardzala, 1980; Lang,
Goldstein, & Levine, 1954). However, this uptake is counterbalanced by glucagon that is
released from the pancreas, when glucose levels fall, which results in the generation and
release of glucose back into circulation (Drury, Wick, Bancroft, & Mac, 1951; Staub,
Sinn, & Behrens, 1955) (Fig. 1.3). In a healthy individual, these hormones tightly control
glucose levels to meet the body’s requirements. However, disregulation of these
hormones can lead to obesity and T2DM. It is essential to understand the normal

Comstock, 8
function of the pancreas in order to determine how disregulation of insulin and glucagon
can lead to these diseases. In the next section, I will explain pancreas development and
morphology and the role of this organ in maintaining glucose homeostasis.

Comstock, 9
Pancreas Morphology, Function and Development
The pancreas is both an exocrine and an endocrine organ. The exocrine tissue is
composed of ductal cells that secrete bicarbonate (HCO3-), which acts to neutralize
stomach chyme that is delivered to the duodenum (Hegyi, Maleth, Venglovecz, &
Rakonczay, 2011), and also acinar cells that secrete digestive enzymes, which aid in the
digestion of protein, fat and carbohydrates within the intestine (Carriere, Barrowman,
Verger, & Laugier, 1993; Williams & Lee, 1976). The endocrine pancreas is made up of
islets of Langerhans, which are composed of four main cell types that secrete hormones
directly into the circulatory system. In humans and the the nonhuman primate (NHP), β
cells, which are the most common islet cell type (about 50-70%), secrete insulin and
amylin (Cabrera et al., 2006). The α cells make up 30-45% of the total islets and secrete
glucagon, glucagon like peptide (GLP1), gastric inhibitory peptide (GIP) and (Cabrera, et
al., 2006). Less common are the δ cells and the PP cells, which secrete somatostatin and
pancreatic polypeptide respectively (Ganong, 2007; Hall, 2000). In the rodent, a
commonly used model for studying islet morphology, the β cells form a core at the center
of the islet and are surrounded by α, δ and PP cells. However, the NHP islet, the model I
use for research, is more similar to the human islet, with a more random organization but
with clear associations with other endocrine cells, suggesting unique paracrine
interactions in islets of both humans and NHPs (Brissova et al., 2005; Cabrera, et al.,
2006; Kim et al., 2009). This makes the NHP an excellent model for the study of islet
development and function that is relevant to the human condition.
Comstock, 10
It should be noted that pancreas development follows a similar pattern in
mammals. The key developmental occurrences are indicated in Table 1.1 which is
derived from studies in humans and macaques (Fowden & Hill, 2001; Gerich, 1976; Hill,
2005; Kerr, Allen, Scheffler, & Couture, 1974; Myers et al., 1971; Piper et al., 2004;
Remacle et al., 2007). In summary, within the embryo, the pancreas develops from two
buds that form as an outgrowth from the primitive gut – termed the dorsal and ventral
buds. In the human and the macaque, the dorsal bud first appears less than a month after
conception; then the ventral bud appears in the embryo about 24 hours later. Ultimately
the ventral bud rotates around the stomach and fuses with the dorsal bud, forming one
organ. By the middle of the first trimester, the pancreas resembles the adult organ with a
head, body, tail and an uncinate process (Fig. 1.4). Endocrine cells and acinar cells
develop from ductal cell precursors. These cells bud off to form clumps of acinar cells or
endocrine cells, which differentiate into individual islet cells (Fowden & Hill, 2001;
Piper, et al., 2004; Remacle, et al., 2007). By the beginning of the second trimester,
mature islets are noticable, based on the accumulation of islet amyloid polypeptide
(IAPP) in α cells and β cells (Lukinius, Korsgren, Grimelius, & Wilander, 1996). Toward
the end of the second trimester, most islets are fully functional and they begin to
proliferate during the third trimester (Mourmeaux, Remacle, & Henquin, 1985). This
makes the third trimester a critical window of islet expansion. By birth, islets have been
demonstrated to compose approximately 4% of the human pancreas (Fowden & Hill,
2001). After birth, there is a significant period of islet remodeling that is marked by islet
replication and neogenesis which is counter-balanced by apoptosis (Bonner-Weir, 2001;
Georgia & Bhushan, 2004; Scaglia, Cahill, Finegood, & Bonner-Weir, 1997). However,
Comstock, 11
the potential for replication appears to significantly decline with age, so that by
adulthood, while the pancreas is significantly larger than it is at birth, islets now only
compose 1 to 2% of its total mass. Within the healthy adult, islet mass is usually
homeostatically maintained due to a balance between neogenesis and apoptosis (Butler et
al., 2010; Hanley et al., 2010; Reers et al., 2009); however, some factors can induce islet
loss or expansion. One such factor is obesity, which leads to islet expansion, principally
due to the expansion of β cells. A second phenomenon that results in islet size
disturbance is insulin resistance, which initially leads to islet expansion but ultimately
may result in β cell loss if the disease progresses to T2DM (Butler et al., 2003). In order
to determine the causes of islet cell destabilization, it is necessary to understand the
function of these cells.
The role of the pancreas is critical in maintaining glucose homeostasis due,
primarily to the function of β cells and α cells. In healthy subjects, β cells secrete insulin
in response to elevated circulating glucose levels. Glucose uptake and insulin secretion
by β cells is a complex pathway (Fig. 1.5). The first step in this pathway is mediated by
the facilitated glucose transporter 2 (GLUT2) which permits diffusion of glucose into the
β cell. Once glucose enters the cell, it is phosphorylated by hexokinase or glucokinase
(GCK) into glucose-6-phosphate (G6P). GCK is considered a “glucose sensor,”
determining the threshold level of glucose necessary for insulin secretion (Postic, Shiota,
& Magnuson, 2001). G6P is then metabolized by the additional steps of glycolysis to
produce pyruvate, NADH and ATP. NADH and pyruvate both enter the mitochondria
where they are metabolized to produce an estimated 98% of the total β cell ATP content
Comstock, 12
(MacDonald, Joseph, & Rorsman, 2005), resulting in the increase of cytosolic ATP/ADP
ratio. ATP-sensitive potassium (KATP) channels on the cell membrane are closed as a
result of the increased ATP/ADP ratio, leading to depolarization of the β cells. These
channels are composed of 2 subunits – the sulfonyurea receptor 1 (SUR1) and the
inwardly rectifying potassium channel 6.2 (Kir6.2, encoded by the KCNJ11 mRNA).
The depolarization of β cells leads to the opening of voltage-dependent calcium channels
that allow the influx of calcium. The rise in β cell calcium concentration triggers insulin
granule exocytosis (Miki, Nagashima, & Seino, 1999). After it is released into
circulation, insulin is bound by insulin receptors in various target tissues which leads to
the uptake of glucose to be used as a fuel source or stored for later use.
However, when glucose levels start to fall, α cells secrete glucagon. It should be
noted, however, that α cells also take up glucose via the glucose transporter Glut1, store it
as glycogen and then later metabolize glycogen as a fuel source ATP production
(Quesada, Tuduri, Ripoll, & Nadal, 2008). Thus, while glucose inhibits glucagon
secretion, glucose is also required for maintenance of α cell energetics. Little is known
about the mechanism that leads to the stimulation or inhibition of glucagon secretion
(Walker et al., 2011). However, recent studies indicate that glucagon secretion may be
mediated by the effects of insulin or other β cell secretory products on α cells. Elevated
insulin levels have been shown to lead to sensitization of KATP channels within the α
cell, which causes α cell hyperpolarization and inhibits glucagon release (Franklin,
Gromada, Gjinovci, Theander, & Wollheim, 2005; Leung et al., 2006). In contrast, when
glucose levels decline the inhibitory signal produced by β cell (i.e. insulin, zinc or
Comstock, 13
GABA) is diminished. This results in decreased efflux of potassium through KATP
channels, which when exposed to and alevated ATP/ADP ratio produced by glycogen
metabolism, will lead to depolarization of α cells and glucagon secretion. When
glucagon is elevated, it is taken up by hepatic cells which undergo glycogenolysis –
conversion of glycogen to glucose by the enzyme glucose-6-phosphatase – thereby
releasing glucose into the bloodstream. When glycogen stores are depleted, hepatic cells
produce glucose through a process called gluconeogenesis – anabolic converstion of non-
carbohydrate sources, such as lactate and pyruvate, into glucose (Chakravarty, Cassuto,
Reshef, & Hanson, 2005; Consoli, Nurjhan, Capani, & Gerich, 1989; Yoon et al., 2001).
Glucagon also promotes lipolysis of adipose tissue, which is the breakdown of
triglycerides from fat depots into FFAs and glycerol, by increasing the mobilization of
glycerol after lipolysis occurs (Slavin, Ong, & Kern, 1994). FFAs and glycerol can then
be used as sources of energy for the body.
It is evident that healthy, functional islet cells work in concert to maintain glucose
homeostasis. However, glucose homeostasis can be disrupted in obese individuals. This
often leads to the development of MetS, which puts the individual at increased risk for
developing T2DM. The mechanisms that lead to this disruption are intensely studied. In
the next section I will explain the etiology of T2DM and the progression of MetS to the
development of this disorder. I will also present the most widely accepted theory of the
mechanism of T2DM disease progression.

Comstock, 14
Type 2 Diabetes Mellitus and the Glucolipotoxicity Hypothesis
T2DM is a metabolic disorder that is characterized by elevated fasting glucose
(hyperglycemia) that results in metabolic abnormalities due to defects in insulin action
and insulin secretion. Diagnostic criteria for diabetes in adult humans is a fasting blood
glucose greater than 126 mg/dL and a glucose level of 200 mg/dL or greater two hours
after an oral glucose tolerance test ("Diagnosis and classification of diabetes mellitus,"
2011). The etiology of T2DM is not completely understood, but the disease progression
usually follows a similar pattern in animal models and humans. The risk for T2DM is
associated with an increase in insulin levels and insulin resistance of peripheral tissues.
This insulin resistance usually occurs concurrently with other maladies including central
obesity and increased circulating triglycerides (TGs) which are hallmark symptoms of
MetS. Ultimately T2DM will develop in 20% of MetS sufferers while the remaining
80% are able to compensate through β cell expansion (E. S. Ford, Giles, & Dietz, 2002;
Guiot, Sempoux, Moulin, & Rahier, 2001; L. C. Jones & Clark, 2001). Many theories
have been presented as what leads to T2DM progression. The most commonly accepted
theory of the pathogenesis of this disease is that concurrent glucotoxicity and lipotoxicity
of peripheral tissues, including pancreatic β cells, leads to insulin resistance and
ultimately progression to T2DM (Unger, 1995).
Glucotoxicity occurs when chronic hyperglycemia impairs glucose-stimulated
insulin release of β cells and reduces insulin gene transcription. β cells become
desensitized to glucose after a short exposure to elevated levels (above 100 mg/dL),
meaning they steadily release lower doses of insulin in response to the same glucose
Comstock, 15
stimulus. This is a normal physiological adaptation that is readily reversible if glucose
levels return to normal levels. However, if glucose is chronically elevated, β cells are
exhausted, meaning their releasable insulin pool is depleted (Kilpatrick & Robertson,
1998). Initially this exhaustion is reversible. However, after long term, chronic
hyperglycemia, exhaustion is no longer reversible and thus glucotoxicity ensues (Moran
et al., 1997). Recent studies have shown that this chronic hyperglycemia leads to
oxidative damage in β cells that diminishes the activity of two insulin gene promoters -
PDX1 (pancreatic-duodenal homeobox 1) and MafA (musculoaponeurotic fibrosarcoma
oncogene homolog A) - thereby reducing insulin gene transcription and insulin secretion
(Olson et al., 1995; Robertson, 2004; Sharma, Olson, Robertson, & Stein, 1995).
Lipotoxicity is a condition in which free fatty acids (FFAs) accumulate in excess
of the required need of oxidative pathways within an organism and spill over into non-
oxidative, toxic pathways (Unger & Zhou, 2001). FFAs provide an alternative fuel
source for the body during prolonged periods of fasting and protect against the use of
proteins that would otherwise be used for gluconeogenesis – production of glucose by the
liver. During the fed state, insulin is raised in order to use glucose as a fuel source and
thereby suppresses circulating FFA levels. However, it has been shown that, in obese
individuals and those who have MetS, FFA levels remain elevated in the presence of high
insulin, likely because of an increase in adipose tissue and adipocyte insensitivity to
insulin (Y. D. Chen, Golay, Swislocki, & Reaven, 1987; Groop et al., 1992). The feed-
back between adipocytes and β cells is thereby inhibited and thus leads to a paradoxical
elevation of both basal insulin and FFAs.
Comstock, 16
The glucolipotoxicity hypotheses postulates that chronically elevated glucose and
FFAs impair β cell function by inhibiting insulin transcription and secretion (Poitout,
2008). In patients that are susceptible to T2DM, there is a blunted response to nutrient
overload caused by excess glucose and FFA (Cusi, Kashyap, Gastaldelli, Bajaj, &
Cersosimo, 2007; Kashyap et al., 2003). As indicated, this occurs prior to the
development of the disease and may be a complicating factor that ultimately leads to
disease progression. However, in patients with MetS, glucolipotoxocity leads to similar
impairment of β cell function, yet 80% of these patients do not develop overt diabetes.
This disparity highlights the importance of investigating the causes that may lead to the
differential development of T2DM within susceptible individuals.
While many factors may influence whether an individual ultimately develops
T2DM, the early life environment likely plays a role in disease progression. While, both
maternal HFD consumption and obesity increase the risk of developing MetS and T2DM
in the offspring, it is unclear what mechanisms lead to this increased risk. Many others
have investigated the effects of maternal HFD consumption or obesity on offspring and
have provided insight into these mechanisms. These studies are reviewed in the
following pages.
Comstock, 17
Animal Models of Maternal Overnutrition
The most common animal models used to investigate HFD consumption and the
effects of obesity are rodents – principally rats and mice. In fact, our lab has used both
rats and mice as models of early post-natal overnutrition to study the effects of obesity on
metabolic systems (Enriori et al., 2007; Glavas et al., 2010; Xiao et al., 2007). By
reducing litter size, our group is able to increase nutrient availability to young rodents.
This results in increased susceptibility to obesity, insulin resistance and alterations in
energy homeostasis, indicating that early overnutrition may increase the risk of MetS.
In order to study the effects of HFD on offspring, many studies in rodents
provide the HFD to mothers during a portion of, or all of, gestation and/or lactation (Cerf,
Muller, Du Toit, Louw, & Wolfe-Coote, 2006; Cerf et al., 2005). However, the range of
maternal HFD exposure in many rodent studies varies greatly – 21 days (for gestation
only) up to 142 days (100 days prior to and including gestation and lactation). When
dams consume a chronic HFD more than 30 days prior to conception, this usually results
in maternal obesity – allowing some studies to focus on not only maternal HFD but also
maternal obesity effects in the offspring (H. Chen, Simar, Lambert, Mercier, & Morris,
2008; Ferezou-Viala et al., 2007; Howie, Sloboda, Kamal, & Vickers, 2009; Srinivasan,
Katewa, Palaniyappan, Pandya, & Patel, 2006). The results of these studies vary based on
the length of time the mother is exposed to the HFD. In most rodent models, the
consumption of the HFD leads to MetS-like effects in the offspring: they become obese,
hyperinsulemic, have a propensity to develop T2DM, and are at increased risk for

Comstock, 18
developing CVD (Koukkou, Ghosh, Lowy, & Poston, 1998; Srinivasan, et al., 2006;
Taylor et al., 2005).
Specific effects on the pancreas of offspring exposed to maternal HFD have been
described in a few of these models. In one study by Cerf et al., β cell mass was reduced in
1-day-old rats only if the mother consumed a HFD all throughout pregnancy. Short-term
exposure, for one week of the three week pregnancy, did not have a significant effect on
β cell mass, regardless of which week the mother consumed the HFD (Cerf, et al., 2005).
When this study was followed through until the animals were of weaning age, offspring
of mothers that were exposed to the diet through gestation and lactation were
normoglycemic. However, when they were fed the HFD during lactation only, the
offspring became hyperglycemic and hypoinsulinemic, indicating that switching from a
healthy diet to a HFD may be more harmful than continued exposure to HFD alone (Cerf,
et al., 2006).
While experimental models with sheep do not provide these animals a HFD, they
are often used as a model of overnutrition by increasing their food supply above the
recommended portion for their size (George et al., 2010; Zhu et al., 2008). These animals
achieve obesity if allowed to consume an obesogenic diet (150% of recommended
calories) 60 days prior to conception. Differential results have been reported on
developing islets from the fetuses of obese ewes based on the length of exposure to the
diet. One study indicates that obese ewes produce fetuses at mid-gestation that are
hyperglycemic, hyperinsulinemic, have over-growth of pancreatic islets and β cell
hyperplasia (S. P. Ford et al., 2009). However, if the fetuses were analyzed at the end of

Comstock, 19
pregnancy, there was a significant reduction in pancreatic growth and markedly
decreased numbers of β cells due to increased apoptosis, which resulted in reduced
circulating insulin concentrations in the fetuses from obese ewes (L. Zhang et al., 2011).
One confounding factor of this research is that only ewes carrying singleton fetuses were
analyzed in the mid-gestation study, whereas the fetuses that were carried to full term
were twins. This makes the results difficult to interpret, because there is possibly
increased growth restriction in the full term, twin sheep. Other studies in the sheep
model of overnutrition have examined the effects maternal obesity on various organs, but
do not describe how this affects the pancreatic islets (George, et al., 2010; Long et al.,
2010; Zhu, et al., 2008).
The effects of maternal overnutrition on fetal development indicate that this is
likely to cause MetS-like effects due to the increased adiposity, decreased insulin
sensitivity and hyperinsulinemia demonstrated in these animals. However, it is unclear
from these studies how pancreatic islets may be affected, since the reported results appear
to conflict between the sheep and rodent models. It will be necessary to perform similar
studies on a higher species, such as the NHP, that is more closely related to the human, in
order to determine if factors within the endocrine pancreas may be leading to the
association between maternal overnutrition and MetS in offspring.

Comstock, 20
Animal Models of Intrauterine Growth Restriction
A second model which leads to obesity is intrauterine growth restriction (IUGR).
Evidence from human studies has demonstrated that IUGR leads to an increased risk of
developing MetS in adults (Barker, 1995; Barker et al., 1993). In fact, Dr. Barker’s
hypothesis of the developmental origins of adult disease theorizes that associations
between poor fetal and infant growth and later development of T2DM and the MetS are a
result of poor nutrition in early life (Hales & Barker, 1992). IUGR is accomplished in
rodent models through a variety of methods, including restricing maternal caloric or
protein intake that both reduce the nutrient supply to the fetus. In addition, exposure to
high levels of glucocorticoids or restriction of placental blood supply by bilateral uterine
artery ligation both also lead to IUGR. These experimental models lead to decreased beta
cell mass and lower pancreatic insulin content in neonatal offspring, yet ultimately these
offspring become obese and diabetic (Dahri, Snoeck, Reusens-Billen, Remacle, & Hoet,
1991; Dumortier et al., 2007; Garofano, Czernichow, & Breant, 1997, 1998, 1999; Park,
Stoffers, Nicholls, & Simmons, 2008).
The ovine model of IUGR is accomplished by restricting maternal caloric intake,
exposing pregnant dams to elevated temperatures (40⁰ C versus 25⁰ C), induction of
maternal hypoglycemia by continuous insulin infusion, uterine horn ligation, induction of
uterine artery embolism or by surgical ablation of major uterine caruncles in the ewe
prior to conception (Darp et al., 2010; Limesand, Jensen, Hutton, & Hay, 2005; Meyer,
Koch, Ramadoss, Kling, & Magness, 2010; Morrison, 2008; Rozance, Limesand, & Hay,
2006; Sebert et al., 2011). While all these models produce IUGR by different

Comstock, 21
mechanisms, these protocols can result in smaller lambs that have deficient insulin
secretion and usually smaller β cells (Gatford et al., 2008; Limesand, Rozance, Zerbe,
Hutton, & Hay, 2006).
While studies in IUGR animals indicate that diabetes occurs due to the
deficiencies in β cell mass and insulin secretion, studies in human IUGR fetuses are not
consistent with these findings. The human studies indicate that IUGR does not change
fetal β cell mass (Beringue et al., 2002), although adults with born with IUGR do have an
increased risk for of developing T2DM, indicating that insulin resistance occurs first due
to the insult of IUGR, followed by hyperinsulinemia. While the results from the IUGR
animals may provide insight into islet development in animal models, they do not explain
the association between human IUGR and deficiencies in insulin secretion. An animal
model that may be more predictive of the effects of human IUGR would be the NHP. In
fact, one recently described model of inter-placental vessel ligation that is being
developed in rhesus macaques has the potential to lead to IUGR in its offspring (Roberts
et al., 2012). However, no significant pancreatic fetal effects have been reported to date.
Follow-up studies on these animals may provide insight into the mechanistic link
between IUGR and insulin resistance.
Based on the experimental models described in the last two sections, it is evident
that fetal malnutrition or early post-natal overnutrition may lead to the development of
MetS-like effects and ultimately may increase the risk for T2DM, just as has been
demonstrated in the human population. However, while the development of insulin
resistance and hyperinsulinemia are common to all models, the effects on islets vary

Comstock, 22
significantly. While some studies indicate that β cell mass may be affected, no consistent
effects on α cells have been studied or reported (Cerf, et al., 2005; S. P. Ford, et al., 2009;
L. Zhang, et al., 2011). In addition, the inconsistencies between the described animal
models and human studies make it evident that studies in higher species are necessary to
determine the process that leads to the increased risk of MetS and T2DM in these
offspring. For this reason, our lab has developed a NHP model of maternal HFD
consumption and obesity. The purpose of this model is to determine how the altered
maternal physiology may lead to an increased risk of metabolic complications in the
offspring. While many organ systems have been demonstrated to be affected by maternal
HFD and obesity in our NHP model, my research specifically focuses on the
development of β cells and α cells in these animals. Due to the counter-regulatory nature
of these cells, it is necessary to examine effects in both, rather than specifically focusing
on the β cell, as many other studies have done. In the next chapter, I will characterize the
model, explain the specific effects that have been demonstrated in other organ systems
thus far and describe the specific aims of my studies in these offspring.

Comstock, 23
Chapter 1 Figures

Comstock, 24
Figure 1.1: Metabolic Syndrome
Metabolic syndrome is a clustering of health effects that increase an individual’s risk for
developing cardiovascular disease and T2DM. The International Diabetes Federation
defines this disorder as abdominal obesity with two other associated symptoms listed
above, while the American Heart Association identifies this syndrome as a clustering of
any three symptoms listed above. Most organizations recognize insulin resistance as a
common etiology that leads to this disease.
Comstock, 25
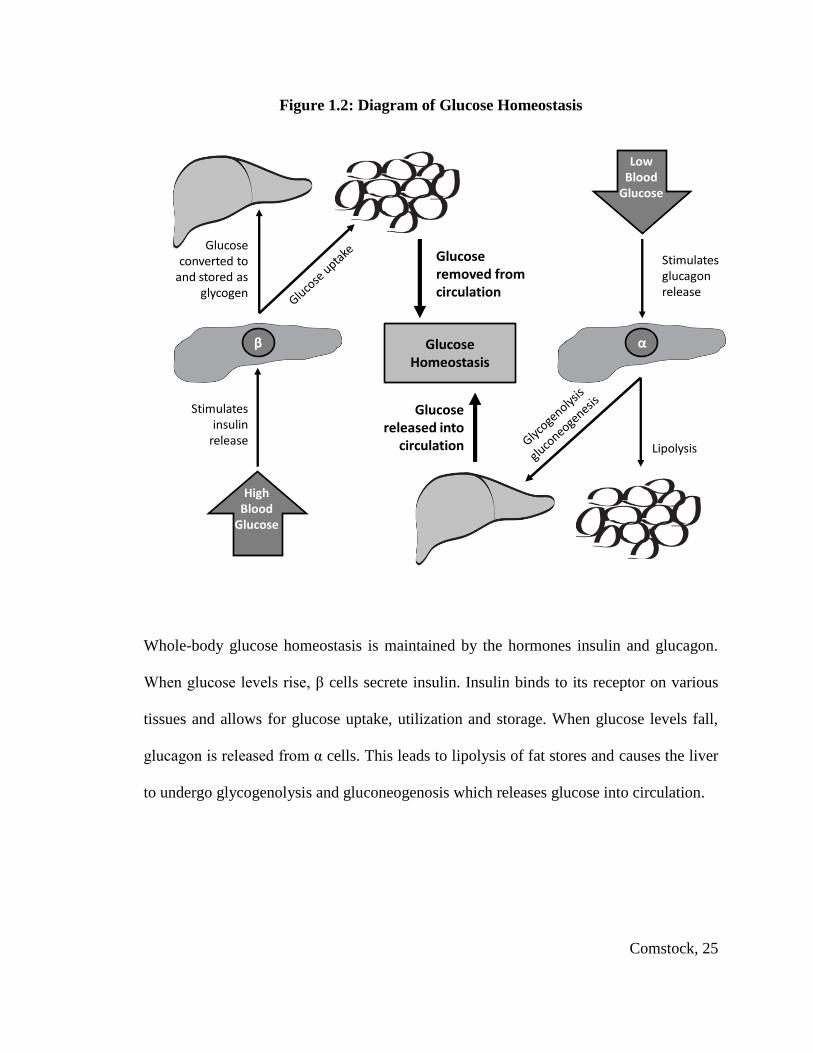
Figure 1.2: Diagram of Glucose Homeostasis
αβ
HighBlood
Glucose
LowBlood
Glucose
Stimulates glucagon release
Glucose released into
circulation
Glucose Homeostasis
Stimulates insulin
release
Glucose converted to
and stored as glycogen
Glucose removed from circulation
Lipolysis
Whole-body glucose homeostasis is maintained by the hormones insulin and glucagon.
When glucose levels rise, β cells secrete insulin. Insulin binds to its receptor on various
tissues and allows for glucose uptake, utilization and storage. When glucose levels fall,
glucagon is released from α cells. This leads to lipolysis of fat stores and causes the liver
to undergo glycogenolysis and gluconeogenosis which releases glucose into circulation.
Comstock, 26
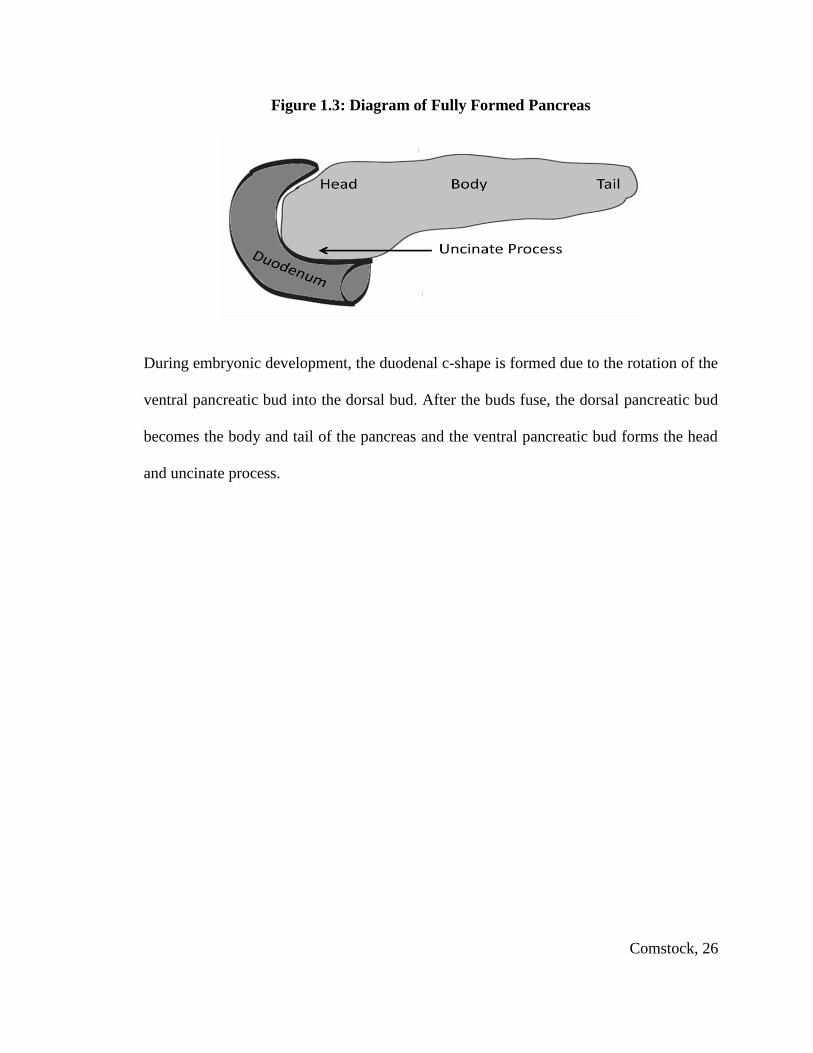
Figure 1.3: Diagram of Fully Formed Pancreas
During embryonic development, the duodenal c-shape is formed due to the rotation of the
ventral pancreatic bud into the dorsal bud. After the buds fuse, the dorsal pancreatic bud
becomes the body and tail of the pancreas and the ventral pancreatic bud forms the head
and uncinate process.

Comstock, 27
Figure 1.4: Glucose-stimulated Insulin Secretion in the β cell
Glucose is transported into the β cell by the facilitated glucose transporter, Glut2. It is
broken down by the enzyme glucokinase (GK) into glucose-6-phosphate, which
undergoes glycolysis to produce pyruvate. Pyruvate is transported into the mitochondria
and metabolized to produce ATP. The rise in intracellular ATP/ADP ratio leads to a
closure of ATP sensitive potassium (KATP) channels on the cell membrane, which
causes depolarization of the cell and Ca2+ influx via voltage gated calcium channels.
The influx of calcium leads to insulin granule exocytosis.

Comstock, 28
Chapter 1 Table

Comstock, 29
Table 1.1: Embryonic/Fetal Development of the Pancreas in Macaques and Humans
Macaque (day)
Human (day)
Development
15.5 26 Dorsal pancreatic bud first appears
16 26.5 Ventral pancreatic bud appears less than a day after the dorsal bud
21 35 The stomach rotates to the left and the ventral bud rotates around the forgut and comes in contact with the dorsal bud; the gland grows as a single unit
32 52 Pancreas resembles the adult pancreas with a tail, body, head & uncinate process.
33 54 First epithelial cells stain for insulin, first beta cells begin to develop and a fine capillary network is formed
36 59.5 Glucagon and somatostatin expressed separately in isolated epithelial cells
38 63 Endocrine cell precursors begin to form
38 63 Acini begin to develop and islet cell precursors begin to form and clump off
38 63 Ducts grow and branch until this point.
43 70 The first alpha cells begin to differentiate. PP cells are now detected
47 77 Delta cells first appear
51 84 Rare endocrine and exocrine cells are continue to differentiate
51-57 84-98 Islets begin to co-express IAPP - indicating mature is β cell and α cells; Diffuse staining PDX1 co-localized in insulin stained islets in both nucleus and cytoplasm
60 98 Capillary beds surround and penetrate the islets by this stage; Interlobular ducts are formed and acini begin to differentiate
67 112 Clusters of immature islet cells become vascularized and then encapuslated by connective tissue and isolated from ducts
71 119 Insulin secretion begins
73-85 120 – 140 Transient glucagon secretion begins; Well formed islets are identifiable although isolated endocrine cells persist between the acinar cells.
85 140 Fetal pancreas begins to demonstrate mature glucose transporter transporter levels
114-170 187-280 Beta cells double each day
114-170 187-280 Islet remodeling occurs
Birth Birth Islets account for 4% of the total pancreas

Comstock, 30
Chapter 2: Model and Study Design

Comstock, 31
A Nonhuman Primate Model of Maternal HFD Consumption
The Grove laboratory at the Oregon National Primate Research Center (ONPRC)
uses a Japanese macaque model to investigate the relationship between maternal HFD
consumption, maternal obesity and health risks in the offspring. Macaques are an
essential animal model to study the progression of obesity because they are
phylogenentically close to humans (Isa, Yamane, Hamai, & Inagaki, 2009). Their body
structure, physiology, gestation and development have been well characterized and are
more similar to humans than other commonly used laboratory animal models (i.e. rodents
and sheep) (Hamada, 1999). This model has been developed and used for the past 10
years to characterize effects of HFD consumption in adult females as well as their
offspring.
Adult female NHPs, ages 5 to 7, were randomly assigned to this project from a
larger breeding colony that has been at ONPRC since the 1960s. Females were age- and
weight-matched at the beginning of this study and placed into two separate groups. One
group was fed a normal, monkey chow control (CTR) diet supplying 13% of calories
from fat. The fat in the CTR diet is principally made of vegetable fat. The experimental
group was fed a high-calorie, high-fat diet (HFD) supplying 35% of calories from fat plus
calorically dense treats. This HFD is made from animal fats, principally lard, and is rich
in total fatty acids, saturated, and monounsaturated fat. Furthermore, this diet is balanced
in essential fatty acids but has an increased n-6 to n-3 polyunsaturated fatty acid ratio that
is similar to the current Western diet (Grant et al., 2011). The animals were maintained
on their respective diets until they reach early middle age (12 to 14 years of age).

Comstock, 32
All females were socially housed in indoor/outdoor housing with two males and
approximately 8 to 10 females per group. They were allowed to breed naturally and
become pregnant. The adult females have been extensively characterized during each
year of the study throughout the pre-gravid, pregnant, and lactation periods. Specifically,
animals were weighed monthly and checked for pregnancy throughout the breading
season (November through May). Dual-energy X-ray absorptiometry (DEXA) scans
were performed annually on each animal during the Fall (August – October). IVGTTs
were performed twice each year; once prior to breeding season and a second time at
approximately 123 days gestation (during the early third trimester). Like humans, the
HFD dams vary in their sensitivity to the diet. They are classified as either sensitive or
resistant to the diet based on their insulin clearance rates in response to an IVGTT at the
end of the second year on the diet, according to methods previously described (McCurdy
et al., 2009). To be classified as resistant to the diet, the HFD animal’s insulin area under
the curve (IAUC) must fall within 2 standard deviations of the mean of the control
animals for that same year (Fig. 2.1a).
A correlation analysis between the IAUC at the end of year 2 and body weight of
these animals at the end of year 4 demonstrated a significant correlation (Pearson
correlation = 0.46, p = 0.0092), indicating that insulin sensitivity at 2 years is a predictor
of long-term weight gain in these animals (Fig. 2.1b). Concurrent with this finding, all
HFD animals during year 4 displayed an increase in body weight and body fat (Fig.
1.1c&d). However, this increase was significantly more severe in the animals that were
classified as diet sensitive (HFD-S) versus the resistant (HFD-R) animals. A similar

Comstock, 33
response has been established in various rodent models in which a subset of animals
exposed to a HFD are more resistant to obesity (Enriori, et al., 2007; Speakman, Hambly,
Mitchell, & Krol, 2007).
Some offspring from the CTR and HFD mothers were collected by C-section at
gestational day 130 (G130). Since the normal pregnancy term in a Japanese macaque is
approximately 173 days (Hayama, Nakiri, & Konno, 2011), G130 corresponds to the
early third trimester of development, a critical period of islet development within the
fetus (Fowden & Hill, 2001) . Likewise, in order to investigate the effects of post-natal
HFD consumption, a subset of the CTR and HFD offspring were born by natural means
and maintained with their mothers in the same housing and on the same diet until
weaning at approximately 7 to 9 months of age. At this time, the offspring were weaned
and placed into a social housing facility with peers, where they were maintained on their
same diet or switched to the opposing diet for approximately 5 months. This produced
four post-weaning groups: CTR/CTR, CTR/HFD, HFD/CTR and HFD/HFD (Table 2.1).
As indicated above, the purpose of this model is to investigate the effects of HFD
consumption on fetal and early post-natal pancreatic development. We have chosen the
HFD as a model of overfeeding that is similar to the Western diet. By providing a highly
saturated fatty diet that is also calorically dense to our animals, we believe that we can
mimic the detrimental effects of the Western diet and begin to understand some of the
mechanisms that are leading to the health complications in children today. Also, by
allowing animals to be maintained with their mothers until weaning, we are endeavoring
to mimic the early lifestyle in humans. If a mother eats a healthy diet throughout her

Comstock, 34
pregnancy, she is likely to continue to do so during the breast-feeding period. The
opposite is true as well – a mother who eats fatty foods throughout her pregnancy will not
be likely to change her lifestyle during breastfeeding. While the CTR/CTR and the
HFD/HFD juvenile groups are best representative of the human population, the two
opposing groups, CTR/HFD and HFD/CTR are essential to test which might be the
factors (maternal diet versus post-weaning diet) that lead to the complications that we
demonstrate in these offspring.

Comstock, 35
Metabolic Syndrome and Type 2 Diabetes Mellitus in the Macaque
T2DM has been demonstrated to develop spontaneously in macaques as they
reach middle age (approximately 15 years of age), which is preceded by typical
symptoms of MetS in these animals. Macaques that develop MetS are obese, have
increased waist circumference, are insulin resistant and have elevated triglycerides, lower
HDL and increased fasting plasma glucose levels, when compared to healthy macaques
(Hansen & Bodkin, 1990; Wagner et al., 2001; X. Zhang et al., 2011). MetS occurs
spontaneously in approximately 5-15% of both young and middle aged macaques that eat
a healthy diet (Kaufman et al., 2005; X. Zhang, et al., 2011), while T2DM occurs in
nearly one third of macaques with MetS-like effects (Hansen & Bodkin, 1986).
While not all of the above mentioned markers of MetS were measured, in our
macaque model, MetS-like effects occur in approximately 13% (4/31) of CTR females
and are characterized by elevations in fasting plasma insulin, fasting blood glucose, body
weight and body fat (Fig. 2.2). In contrast, MetS occurs in approximately 72% (26/36) of
age matched HFD females that have consumed the diet for 4 years or more, while 28% of
remain resistant to MetS-like effects. All females that have consumed the HFD for 4
years or more are at least 9 years old; however, those that develop MetS tend to be about
2 years older than the average HFD female. Of the females who developed MetS, 12%
(3/26) went on to develop T2DM, which is characterized by an average fasting blood
glucose level of 117 mg/dL in these animals (Fig. 2.2). T2DM has not occurred
spontaneously in the CTR animals; however, females are removed from the study before
the onset of middle age.

Comstock, 36
Effect of Maternal HFD Consumption on NHP Offspring
We have previously demonstrated significant effects on fetal and early post-natal
development due to exposure to the HFD or maternal obesity. Maternal HFD
consumption translated to an increased n-6 to n-3 polyunsaturated fatty acid ratio in the
fetal offspring, with a reduction in the essential fatty acid docosahexaenoic acid (DHA).
This diet also decreased the supply of DHA to the nursing offspring through breast milk,
while increasing total insulin content of the breast milk (Grant, et al., 2011). This could
result in serious defects in the offspring, as DHA is essential for neuronal formation and
cognitive function (Uauy et al., 1996).
Placental studies established a significant reduction in uterine volume blood flow
from HFD animals and a significant increase in inflammatory cytokines regardless of
maternal sensitivity to the HFD. HFD consumption by obese mothers with
hyperinsulinemia also reduced volume blood flow on the fetal side of the placenta and
resulted in increased number of placental infarctions and stillbirths. These studies
indicate that a HFD, independent of obesity, may lead to placental insufficiency, and that
maternal obesity and insulin resistance results in decreased blood volume to the fetus
(Frias et al., 2011). The reduction in blood flow and the increase in cytokines are likely
to have a significant effect on various developing organs.
In fact, we have demonstrated an increase in local inflammatory response within
the brain of the HFD fetus. Specifically, we demonstrated disturbances in the
serotonergic system, which led to increased anxiety in the female postnatal offspring
Comstock, 37
from HFD mothers while males tend to be more aggressive in response to stress (Sullivan
et al., 2010). Also, within the melanocortin system, agouti-related peptide (AGRP)
mRNA expression and protein immunoreactivity were inhibited, while
proopiomelanocortin (POMC) mRNA expression was upregulated in hypothalamic
neurons of HFD fetal offspring (Grayson et al., 2010). These neuronal populations play a
key role in glucose homeostasis by sensing both glucose and insulin (Fioramonti et al.,
2007; Parton et al., 2007; Woods, Lotter, McKay, & Porte, 1979) and integrating this
signal by regulating hepatic glucose production (HGP) (Benoit et al., 2002; Pocai et al.,
2005; van den Hoek et al., 2004). Since AGRP neurons mediate the insulin inhibition of
hepatic glucose production (Konner et al., 2007), the inhibition of this peptide will likely
lead to increased HGP.
Accordingly, we demonstrated that fetal offspring from mothers in years 2
through 4 on the HFD had increased expression of hepatic gluconeogenic genes and
transcription factors. In addition, we demonstrated an increase in liver TGs and evidence
of hepatic oxidative stress early and increased hepatic apoptosis, consistent with the
development of nonalcoholic fatty liver disease (NAFLD) (Grant, et al., 2011; McCurdy,
et al., 2009). Notably, the increased hepatic TG levels persisted until post-natal day 180
(P180), indicating that early HFD exposure through the maternal diet will likely increase
the risk for early-onset NAFLD.
Finally, the HFD leads to aortic endothelial dysfunction in animals exposed to the
diet until 13 months of age (Fan et al., 2012). Endothelial dysfunction has been
established as an early marker for atherosclerosis, indicating that the HFD offspring are at

Comstock, 38
increased risk for developing cardiovascular disease (Celermajer, Sorensen, Bull,
Robinson, & Deanfield, 1994; Ludmer et al., 1986; Reddy, Nair, Sheehan, & Hodgson,
1994). Taken together, these results indicate that maternal HFD consumption places
increased metabolic pressure on the developing offspring. The increased liver
gluconeogenesis, elevation of circulating TGs and endothelial dysfunction indicate that
the HFD offspring may be susceptible to development of pediatric MetS and may
ultimately progress to T2DM. The purpose of my research is to determine how HFD
consumption by the mother and the post-natal offspring affect pancreas development. It
is necessary to determine if maternal HFD or obesity during pregnancy will lead to
effects on the pancreas that will increase their susceptibility to MetS. Furthermore, since
early life post-natal nutrition also plays a significant role in the risk for MetS and T2DM,
it is essential to determine if HFD consumption during the post-natal period will
contribute to this risk. It is my aim to establish how the pancreas responds to the
increased metabolic pressure of maternal HFD consumption previously described in these
offspring, and how this will affect long-term pancreas function.

Comstock, 39
Specific Aims
The first aim of this study was to determine if maternal HFD and/or obesity
consumption during fetal development will affect islet cell morphology or function. I
hypothesized that HFD during development would similarly suppress islet development
of fetal offspring regardless of maternal obesity. Since maternal HFD consumption leads
to similar effects on fetal liver TG content and upregulation of gluconeogenic genes
within these livers, it is likely that pancreatic islets will be similarly affected by the diet.
These islets would need to compensate for the increased glucose production of the liver
and elevation in FFA supplied by the maternal HFD and would, thus, display similar
effects regardless of maternal sensitivity to the diet.
My second aim was to characterize the metabolic profile of juvenile Japanese
macaques chronically exposed to a HFD. Specifically, I analyzed the physiology of these
animals up through weaning to determine if chronic HFD exposure affected glucose
homeostasis. I hypothesized that the effect on islets caused by HFD during gestation
would lead to disregulation of insulin secretion and increased susceptibility of the HFD
offspring to insulin resistance. While fetal exposure to the HFD should prepare the
animal for continued post-natal HFD exposure, the increased liver TG deposition will
likely lead to insulin resistance in this organ. This insulin resistance will likely be
compensated by an increase in insulin secretion in the HFD offspring.
My third aim was to determine if the changes in islet mass would persist after the
weaning period and lead to persistent changes in glucose homeostatic mechanisms. I
Comstock, 40
hypothesized that chronic HFD exposure in the HFD/HFD juvenile would lead to
hyperinsulinemia, increased insulin resistance, and persistent changes in islet
morphology. By returning the HFD animals to a CTR diet after weaning (HFD/CTR)
these changes would be ameliorated. Finally, it was my hypothesis that post-weaning
HFD alone (CTR/HFD) would lead to alterations in islet morphology that would have a
minimal affect on glucose homeostasis in these animals. I have reported the results of the
experiments testing these hypotheses in the following pages and have included the
methodologies that I used.

Comstock, 41
Chapter 2 Figures

Comstock, 42
Figure 2.1: Characterization of CTR and HFD Dams
IAUC after 2 years in the study is significantly increased in HFD-S but not HFD-R dams
(A). This correlates with body weight in dams after 4 years on HFD (B). Weight (C) and
body fat percentage (D) of dams after 4 years is significantly increased due to HFD and
HFD-S display a further increased over the HFD-R group.

Comstock, 43
Figure 2.2: Characterization of Metabolic Syndrome and Diabetes in Females
Females that have MetS have elevated fasting blood glucose (A), elevated fasting insulin
(B), increased body weight (C) and increased body fat (D) compared to others on the
same diet. Females that develop T2DM have increased fasting blood glucose, increased
fasting insulin and elevated body weight when compared to all other groups (A-C). Body
fat percentage was not significantly different from HFD female or other groups that
developed MetS (D)

Comstock, 44
Chapter 2 Table

Comstock, 45
Table 2.1: Post-natal offspring groups
Group Pre-natal Pre-weaning Post-weaning
CTR/CTR CTR CTR
CTR/HFD CTR HFD
HFD/CTR HFD CTR
HFD/HFD HFD HFD

Comstock, 46
Chapter 3: Maternal High-fat Diet Consumption During Pregnancy Leads to
Reduced α Cell Mass in Fetal Offspring

Comstock, 47
Introduction
The mechanisms that lead to the association between maternal obesity, childhood
obesity and metabolic syndrome need to be determined in order to treat or prevent this
effect from perpetuating. We have previously demonstrated that HFD consumption
during pregnancy, independent of maternal metabolic phenotype, can lead to a broad
range of complications in fetal development that may increase these animals’
susceptibility to obesity and diabetes later in life. We have demonstrated increased liver
TGs, a shift in genes involved in hepatic gluconeogenesis, and increased apoptosis,
suggesting early signs of NAFLD (Grant, et al., 2011; McCurdy, et al., 2009). We also
observed placental insufficiency and inflammation in pregnant macaques fed a HFD.
Importantly, the cytokines produced in the placenta are secreted specifically into the
developing fetus, where we hypothesized that they initiate inflammatory responses in
several developing organs (Frias, et al., 2011). Also, because placental insufficiency has
been demonstrated to lead to reduced islet vascularization, it is important to determine
how this will effect fetal islet cell development and function (Fahy, 2009; Martin-Gronert
& Ozanne, 2007).
The purpose of this study was to determine the effects of maternal obesity and/or
HFD consumption during pregnancy on the development of fetal pancreatic islets.
Principally, I chose to examine islet morphology, α cell and β cell mass, and regulation of
genes involved in glucose metabolism and islet development. Previous animal model
studies indicate that much of the disregulation of glucose homeostasis in offspring
associated with in-utero obesity exposure is due to β cell dysfunction or the suppression
Comstock, 48
of β cell proliferation in response to this early life insult (Bertin et al., 2002; Hales et al.,
1991; Van Assche, De Prins, Aerts, & Verjans, 1977; L. Zhang, et al., 2011). However,
recent data has demonstrated the complexity of pancreatic islet paracrine regulation of
both β cells and α cells that are disrupted in the development of T2DM (Ehses,
Ellingsgaard, Boni-Schnetzler, & Donath, 2009; Ellingsgaard et al., 2011). It is
important to understand how α cells may also be affected by maternal HFD consumption.
I chose to investigate these hypotheses in our well-characterized model that has
developmental similarities to humans and in which we can control and manipulate their
environment. My aim was to determine which islet cells may be affected by maternal
obesity and/or HFD consumption. I hypothesized that HFD during development would
similarly suppress islet development of fetal offspring regardless of maternal obesity.
Since maternal HFD consumption leads to effects on fetal liver triglyceride content and
upregulation of gluconeogenic genes within these livers, it is likely that pancreatic islets
will be similarly affected by the diet. These islets would need to compensate for the
increased glucose production of the liver and elevation in FFA supplied by the maternal
HFD and would thus display similar effects regardless of maternal sensitivity to the diet.
Comstock, 49
Materials and Methods
Animals. All animal procedures were in accordance with the guidelines of the
Institutional Animal Care and Use Committee of the ONPRC as previously described
(Frias et al.; Grant et al.; Grayson et al.; McCurdy, et al., 2009; Sullivan et al.). Briefly,
age and weight matched adult female Japanese macaques were fed a control (CTR) or
HFD for up to 4 years. Mothers were fasted overnight and fetal offspring were obtained
by c-section G130 (early 3rd
trimester) and immediately delivered to necropsy for tissue
collection. HFD fetal offspring used for this study were taken from mothers in their 4th
year on the HFD (Table 3.1).
Intravenous Glucose Tolerance Tests. In the dams we performed the IVGTTs at
123 days (± 5 days) gestation. Mothers were fasted overnight prior to a morning IVGTT,
while offspring were fasted for 5 hours and the IVGTT was performed in the afternoon.
Animals were sedated with ketamine (10 mg/kg) and administered a glucose bolus (50%
dextrose solution) at a dose of 0.6 g/kg via the saphenous vein. Baseline blood samples
were obtained prior to the infusion, and 500-µL blood samples were taken at 1, 3, 5, 10,
20, 40, and 60 min after infusion via the femoral artery. Glucose was measured
immediately using a OneTouch Ultra2 Blood Glucose Monitor (LifeScan), and the
remainder of the blood was kept in heparinized or clot tubes on ice for insulin
measurement. After the IVGTT, samples were centrifuged, and plasma was stored with
5% aprotinin at –80°C until assayed. Insulin was assayed in plasma by RIA (Millipore
catalog no. RI-13K, Billerica, MA). HOMA-IR was calculated as fasting serum insulin
(μU/ml) × fasting plasma glucose (mmol/l)/22.5 as previously described (Bonora et al.,
Comstock, 50
2000; Matthews et al., 1985). Glucose-stimulated insulin secretion was measured as the
insulin area under the curve (IAUC) minus basal fasting insulin levels, while total IAUC
is a measure of insulin secretion from time 0. Baseline samples were assayed for
glucagon (Millipore, catalog no. GL-32K, Billerica, MA), c-peptide (Roche Diagnostics,
catalog no. 03184897190, Indianapolis, IN) and leptin (Millipore catalog no. HL-81K,
Billerica, MA).
.RNA Isolation and Quantitative RT-PCR. Total RNA was isolated from 5
head-to-tail grouped sections of each offspring pancreas (Fig. 3.1) using TRIzol reagent
(Invitrogen, Carlsbad, CA). RNA was bioanalyzed with an Agilent Bioanalyzer
(Scotland, UK) and only high quality RNA was DNase treated and reverse-transcribed.
mRNA was measured by real-time quantitative RT-PCR using a PE Applied Biosystems
PRISM 7700 Sequences Detector System. Premade qPCR gene expression assays
directed against human sequences were purchased from Applied Biosystems. The
amplification was performed as follows: 2 min at 50°C, 10 min at 95°C, then 45 cycles
each at 95°C for 15 sec and at 60°C for 60 sec in the ABI/Prism 7700 Sequences Detector
System. Standard curves on serial dilutions of the cDNA (1:10, 1:50, 1:100 1:500, 1:1000
and 1:10,000) were done using cDNA from pooled pancreas samples. Standard curves
were drawn on the basis of the log of the input RNA versus the critical threshold (CT)
cycle, in which the fluorescence of the sample is greater than the threshold of the baseline
fluorescence. Although expression of classical housekeeping genes 18S, β-actin, and
GAPDH are commonly used to normalize gene expression levels in qRT-PCR assays, all
three genes were significantly differentially expressed in the fetal groups. A novel

Comstock, 51
reference gene, ALG9 (Kidd et al., 2007), was assayed and also shown to be
differentially expressed between fetal groups. Therefore, all qPCR results are normalized
to cDNA concentrations. We have also presented data as gene expression normalized to β
cell area, α cell area, or islet area, depending on the cell types in which the gene of
interest is expressed. This methodology has been previously described when whole
pancreas mRNA is used (Gatford, et al., 2008).
Immunohistochemistry. Pancreas tissue was collected from 5 head-to-tail areas
(Fig. 3.1), section number 3 was fixed with 10% zinc formalin, paraffin-embedded, and
cut into 5μm sections. Sections were deparaffinized in xylene and then 100%, 95%, 85%,
and 70% graded ethanol washes for 5 minutes each. Standard antigen retrieval with
microwave-heated citrate buffer was used. Standard immunohistochemical methods were
used. Briefly, sections were washed in KPBS and then blocked in 2% donkey serum in
0.4% triton X/KPBS. Antibodies against insulin (#AB9210, 1:2,000, Chemicon,
Temecula, CA) and glucagon (#4031-01F, 1:1500, Millipore, St. Charles, MO) were
used. Primary antibodies were diluted in 2% donkey serum in 0.4% triton X/KPBS and
applied to tissue sections where they were incubated overnight. Tissues were then washed
in KPBS and secondary antibodies were applied for 1 hour at room temperature at a
dilution of 1:200 (Jackson ImmunoResearch Laboratories, Inc, West Grove, PA).
Quantitative Analysis. Images were acquired with a MarianasTM imaging
workstation (Intelligent Imaging Innovations, Denver, CO) using a 20X objective and a
stereology module to montage images covering whole sections. Areas occupied by β and
α cells were measured based on intensity segmentation of each fluorescence channel

Comstock, 52
using Slidebook 5.0. The β and α cells fractions were calculated by dividing by the area
of the whole section. Total islet area, islet mass [(total islet area/pancreas area)x pancreas
weight], and β and α cell mass [(total cell area/pancreas area)x pancreas weight] were
calculated as previously reported (Uchida et al., 2005).

Comstock, 53
Results
Alpha Cell Mass is Decreased in HFD Fetal Offspring. Overall, the
physiological phenotype in the HFD fetus was minimally affected by the maternal
phenotype or diet. HFD fetal weight was slightly reduced (Table 3.1), which is
consistent with previous published findings from our lab, although it was not significant,
likely due to the smaller sample size used for this study (McCurdy, et al., 2009).
Furthermore, maternal HFD consumption did not lead to significant differences in
pancreas weight, glucose, or insulin in the fetus (Table 3.1). However, C-peptide was
significantly decreased in HFD fetuses and glucagon was decreased in fetuses from HFD-
sensitive (HFD-S) mothers (Table 3.1). Analysis of islets demonstrated no significant
difference in total islet mass between the fetal groups (Fig. 2.2a). However, a closer
analysis of specific cell types within the islets demonstrated a significant decrease in α
cell mass in the HFD offspring (Fig. 3.3a). While glucagon mRNA expression was also
significantly decreased in the HFD animals (Fig. 3.3b), when this expression was
normalized to α cell mass, the difference was lost (Fig. 3.3c). On the contrary, there was
no significant difference in β cell mass (Fig. 3.3d) or plasma insulin between groups
(Table 3.1). However, insulin gene expression was significantly decreased in the HFD
offspring (Fig. 3.3e) and normalizing to β cell area did not change this effect (Fig. 3.3f).
The effect on islet cell mass caused a significant increase in the β cell to α cell ratio in
HFD offspring (Fig. 3.4).
Since maternally derived glucose may exert an effect islet cell development, we
measured umbilical vein glucose, which is a measure of glucose delivered to the fetus

Comstock, 54
from the placenta (Kiserud, 2005; Konig, Vest, & Stahl, 1978), Umbilical-vein glucose
significantly correlated with the β cell to α cell ratio in these fetuses (Fig. 3.4b) In
addition, while circulating fetal insulin was not significantly affected in the fetal HFD
group, this may be due reduced clearance by the liver since c-peptide measures indicate
that there is a decrease in insulin secretion. Since we have previously demonstrated an
increase in gluconeogenic gene expression in the fetal HFD liver (McCurdy, et al., 2009),
we chose to investigate the relationship between islet cell mass and the expression of
these genes. Both β cell mass and the β cell to α cell ratio significantly correlated with
expression of phosphoenolpyruvate carboxykinase 1 (PCK1) and peroxisome
proliferator-activated receptor gamma, coactivator 1 alpha (PGC1A) (Fig. 3.4c-f).
Transcription Factor Expression in Fetal Pancreas. PDX1 mRNA, a critical
transcriptional regulator of early pancreatic development, islet cell neogenesis, and
insulin gene transcription, was downregulated in the HFD fetal pancreas (Fig. 3.5a).
PDX1 has also been shown to have multiple roles in pancreas development including bud
expansion (Jonsson, Carlsson, Edlund, & Edlund, 1994; Offield et al., 1996) and islet cell
differentiation (Ahlgren, Jonsson, Jonsson, Simu, & Edlund, 1998). We also examined
other genes responsible for differentiation of pancreas endocrine cells. Neurogenin
differentiation factor 1 (NeuroD), also known as choline dehydrogenase β2 (BETA2), is
responsible for endocrine cell differentiation and transcriptional activation of insulin
secretion (Sharma et al., 1999), while NK6 homeobox 1 (NKX6.1) is more specific to
expansion and maintenance of β cells at this stage of development (Johansson & Grapin-
Botton, 2002; Rivas-Carrillo, Okitsu, Tanaka, & Kobayashi, 2007). Consistent with the

Comstock, 55
decrease in PDX1, both NeuroD and NKX6.1 expression was decreased in the HFD fetal
pancreas (Fig. 3.5b&c).
Alteration of Genes Involved in Glucose-stimulated Insulin Secretion in the
Fetal Offspring. Since we were unable to directly test glucose-stimulated insulin
secretion, we analyzed gene expression of proteins involved in this pathway, in order to
determine if GSIS may be affected by the β cell to α cell ratio. The two initial factors in
the glucose-stimulated insulin secretion cascade are the facilitated glucose transporter 2
(Glut2) that allows glucose to enter the cell, expressed in β cells in macaques, and
glucokinase (GK), the rate-limiting enzyme in glycolysis (Iynedjian, 1993; Kramer,
Moeller, Hachey, Mansfield, & Wachtman, 2009; Matschinsky, 1996; Newgard &
McGarry, 1995). Glut2 gene expression, when normalized to β cell area, was increased in
the HFD animals (Fig. 3.6a). Since, GK is expressed in both α cells and β cells
(Heimberg et al., 1996), we normalized GK expression to islet area. GK was significantly
up-regulated in the HFD offspring (Fig. 3.6b). The ATP-sensitive potassium channel
found in both α and β cells is critical for regulating insulin and glucagon secretion. Gene
expression of both components of this channel, SUR1 and Kir6.2 (Moritz, Leech, Ferrer,
& Habener, 2001), when normalized to islet area, were not significantly affected by the
HFD. (Fig 3.6c&d). Hepatocyte nuclear factor-4 alpha (HNF-4α), a transcriptional
activator of KCNJ11, is required for maintenance of normal Kir6.2 mRNA levels (Gupta
et al., 2005). HNF-4α was also not significantly affected, when expression was
normalized to islet area (Table 3.2). Further analysis of qRT-PCR results demonstrated

Comstock, 56
that mRNA expression patterns from the fetal groups were not depended on maternal
sensitivity to the HFD.
Comstock, 57
Discussion
In the past couple of decades, there has been a clear increase in the occurrence of
metabolic diseases in children (Cook, Weitzman, Auinger, Nguyen, & Dietz, 2003; Weiss
et al., 2004) and a significant contributor to this increase has been nutritional and health
issues during pregnancy, commonly referred to the developmental origin of adult diseases
hypothesis. However, somewhat confusingly, the increase in early-onset obesity has
been shown to be associated with conditions of both undernutrition as well as
overnutrition during pregnancy. This has led us to search for a common underlying cause
between these opposing ends of the spectrum. Placental insufficiency is another
condition that greatly increases the risk of early-onset obesity and diabetes, subsequent to
fetal growth restriction and catch-up growth. Interestingly, our group recently
demonstrated that chronic consumption of a HFD during pregnancy in the NHP leads to a
significant reduction in placental blood flow (Frias, et al., 2011), similar to that observed
in models of placental insufficiency, thus providing a possible common link between
conditions of maternal undernutrition and placental insufficiency with that of maternal
obesity and overnutrition.
Previously, our group has also demonstrated a premature activation of the fetal
hepatic gluconeogenic pathway caused by chronic consumption of a HFD during
pregnancy (McCurdy, et al., 2009). At that time it was uncertain as to what the driving
factor for this activation was, especially since HFD fetal circulating glucose levels were
normal. Importantly, there are numerous reports that placental insufficiency and
maternal undernutrition is also associated with premature activation of the fetal

Comstock, 58
gluconeogenesis, including an increase in fetal glucagon levels and activation of hepatic
glucose production (HGP) (Fowden, Mijovic, & Silver, 1993; Limesand, Rozance, Smith,
& Hay, 2007). This is thought to be a compensatory response to adapt to the low levels
of glucose from maternal sources. This raised the question as to whether the placental
insufficiency caused by the maternal HFD resulted in an increase in glucagon secretion
and possibly an increase in α cell mass in the HFD fetal offspring. Surprisingly, in
contrast to placental insufficiency and maternal undernutrition, in our current study we
demonstrated a significant decrease. The correlation between hepatic gluconeogenic
gene expression and both the β cell to α cell ratio and β cell mass suggests that islet cells
may be adapting to normalize liver glucose secretion. This adjustment may allow the
fetuses to maintain glucose homeostasis. However, while the decline in α cell mass may
protect the fetus, this may be a maladaptive response that will ultimately lead to
significant physiological consequences that are not measureable at the fetal stage.
Analysis of the impact of the maternal metabolic phenotype (not shown) established that
the lower α cell mass occurred in HFD offspring regardless of maternal obesity or insulin
resistance.
Interestingly, although the decrease in α cell mass in HFD offspring suggests
some fundamental issue with islet development, glucagon gene expression, normalized
for α cell mass, was not significantly affected by the maternal HFD. However, the
decreased glucagon secretion in the HFD-sensitive fetal offspring indicates that maternal
obesity may be leading to a further decline in α cell function.

Comstock, 59
A second potential contributing factor to the decreased α cell mass is placental
glucose levels, since this was significantly correlated to β/α cell ratio (Fig. 3.4b). It is
possible that the higher levels of glucose coming from the placenta are a signal that
suppresses the α cell expansion that normally occurs during this time. Thus, while
maternal HFD may have some common abnormalities in placental function to maternal
undernutrition and placental insufficiency models, this does not result in a decrease in
glucose delivery to through the placenta. In fact, previous reports have demonstrated an
increase in glucose transporter expression in the placenta of obese mothers or mothers
who consume a HFD (H. N. Jones et al., 2009; Zhu, Ma, Long, Du, & Ford, 2010). This
may result in increased glucose transfer across the placenta of HFD dams, which would
impact fetal α cell development.
In addition, while HFD offspring have normal levels of β cell mass, we did
observe significant decreases in insulin mRNA expression. Even after normalization to
the β cell area, insulin mRNA fell to nearly 1/3 of the normal expression, indicating that
this is truly a decrease in expression on a per cell basis. Analysis of c-peptide from HFD
offspring indicates that the decreased insulin gene transcription does translate into
decreased insulin secretion, although total circulating insulin remained unchanged. In
order to understand what factors may be leading to the differences in insulin expression
and α cell mass we analyzed PDX1, NeuroD and NKX6.1. Similar to the decrease in
insulin mRNA, PDX1 gene transcription was also decreased. PDX1has been shown to
regulate insulin gene transcription and islet expansion (Brissova et al., 2002; Jonsson, et
al., 1994). NeuroD and NKX6.1 mRNA expression were also significantly decreased.

Comstock, 60
While the specific targets of these transcription factors in this NHP fetal tissue require
further investigation, it is likely that the decrease effects both insulin gene transcription
and α cell expansion. Previous studies have demonstrated that α cell secretory products
lead to increased PDX1 activation of insulin gene transcription (Buteau, Roduit, Susini,
& Prentki, 1999; Perfetti, Zhou, Doyle, & Egan, 2000; Wang et al., 1999). While further
studies in isolated islet are necessary to elucidate the mechanisms that lead to this
disregulation the decrease in both PDX1 and insulin expression may be due to decreased
paracrine regulation of β cells caused by the decrease in α cell mass.
In contrast, while there have been several studies demonstrating changes in β cell
development and function in response to maternal overnutrition, undernutrition and
obesity in rodent and sheep models, they have either not investigated abnormalities in the
α cell or have reported not changes in this cell type. In ewes, maternal obesity results in
accelerations in β cell, but not α cell, development in the fetus in mid gestation and
decreases β cell mass in late gestation (S. P. Ford, et al., 2009; L. Zhang, et al., 2011). In
rodent models, the timing of HFD consumption – beginning, middle, end or all of
gestation – results in differential islet effects in fetuses of pregnant rats (Cerf, et al.,
2005). Within these studies, it is not possible to determine if these differential effects are
due to species differences or whether they are a result of different types of diets and/or
different exposure periods to the diets. However, the effect on α cell mass in the NHP
offspring may represent a novel, unexplored avenue that clarifies the islet defects that
may occur prior to childhood obesity onset. Furthermore, because of the essential nature
of islet paracrine regulation for normal endocrine function, the change in β cell to α cell
Comstock, 61
ratio may lead to islet cell dysfunction (Franklin, et al., 2005; Leung, et al., 2006). In
fact, analysis of gene expression in these animals demonstrated an increase in Glut2 and
GK mRNA expression in the HFD fetus, indicating that maternal HFD consumption
could lead to increased glycolysis. However, since insulin gene transcription is
decreased, this will decrease the reserved supply of insulin in β cell, thereby limiting the
availability of the ready releasable insulin pool and decreasing insulin secretion which we
demonstrated by a decrease in c-peptide in these animals. In disassociated islets, β cells
exhibit a poor insulin secretory response, despite normal glucose metabolism (Holz,
Kuhtreiber, & Habener, 1993; Huypens, Ling, Pipeleers, & Schuit, 2000), indicating that
a basal level of glucagon or other α cell secretagogues that are required for efficient
insulin secretion. The decreased α cell mass demonstrated in these animals elucidate a
possible mechanism by which decreased β cells of insulin secretion results in a
disconnect between increased glucose metabolism by Glut2 and GK and decreased
insulin secretion. Studies from isolated fetal islets are essential to determine how the
glucose-stimulated insulin secretion mechanism may be biochemically altered. Although
the decrease in α cell mass was unexpected due to results from other animal model
studies, my hypothesis that HFD during development would similarly suppress islet
development of fetal offspring regardless of maternal obesity is supported by these
experiments.

Comstock, 62
Chapter 3 Figures
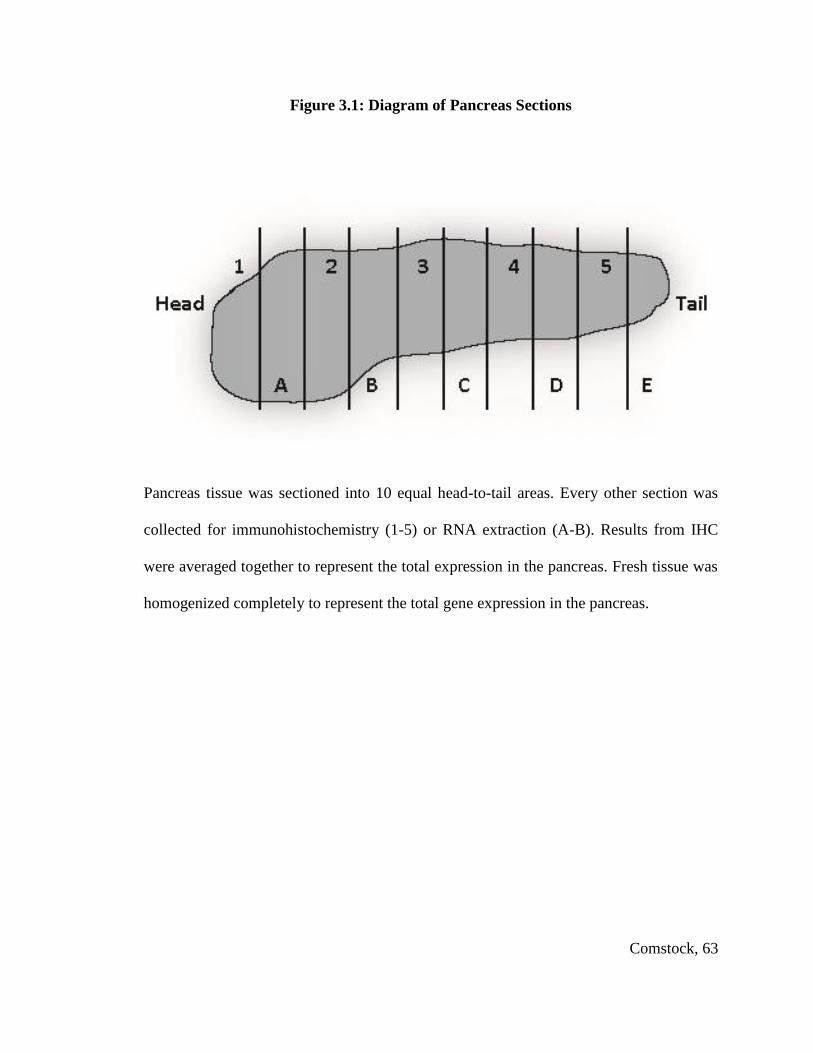
Comstock, 63
Figure 3.1: Diagram of Pancreas Sections
Pancreas tissue was sectioned into 10 equal head-to-tail areas. Every other section was
collected for immunohistochemistry (1-5) or RNA extraction (A-B). Results from IHC
were averaged together to represent the total expression in the pancreas. Fresh tissue was
homogenized completely to represent the total gene expression in the pancreas.
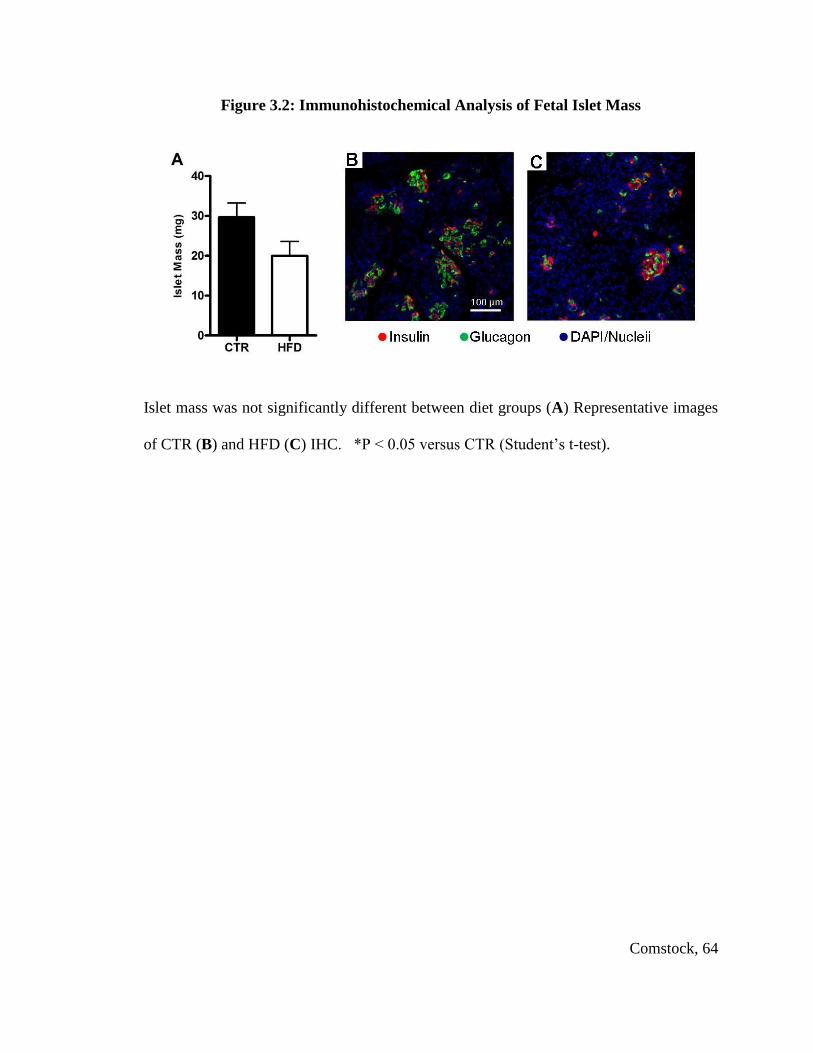
Comstock, 64
Figure 3.2: Immunohistochemical Analysis of Fetal Islet Mass
Islet mass was not significantly different between diet groups (A) Representative images
of CTR (B) and HFD (C) IHC. *P < 0.05 versus CTR (Student’s t-test).

Comstock, 65
Figure 3.3: Islet Characterization in Fetal Offspring
α cell mass was significantly decreased in the HFD fetal pancreas (A). Glucagon
expression was suppressed in HFD offspring (B). When normalized to α cell area this
effect was no longer significant (C). β cell mass was not affected in the HFD animals (D).
Insulin expression was suppressed (E) and remain suppressed when normalized to β cell
area (F). *P < 0.05 versus CTR (Student’s t-test). IHC: CTR n = 7, HFD n = 8; Real-
time: CTR n = 12, HFD n = 8
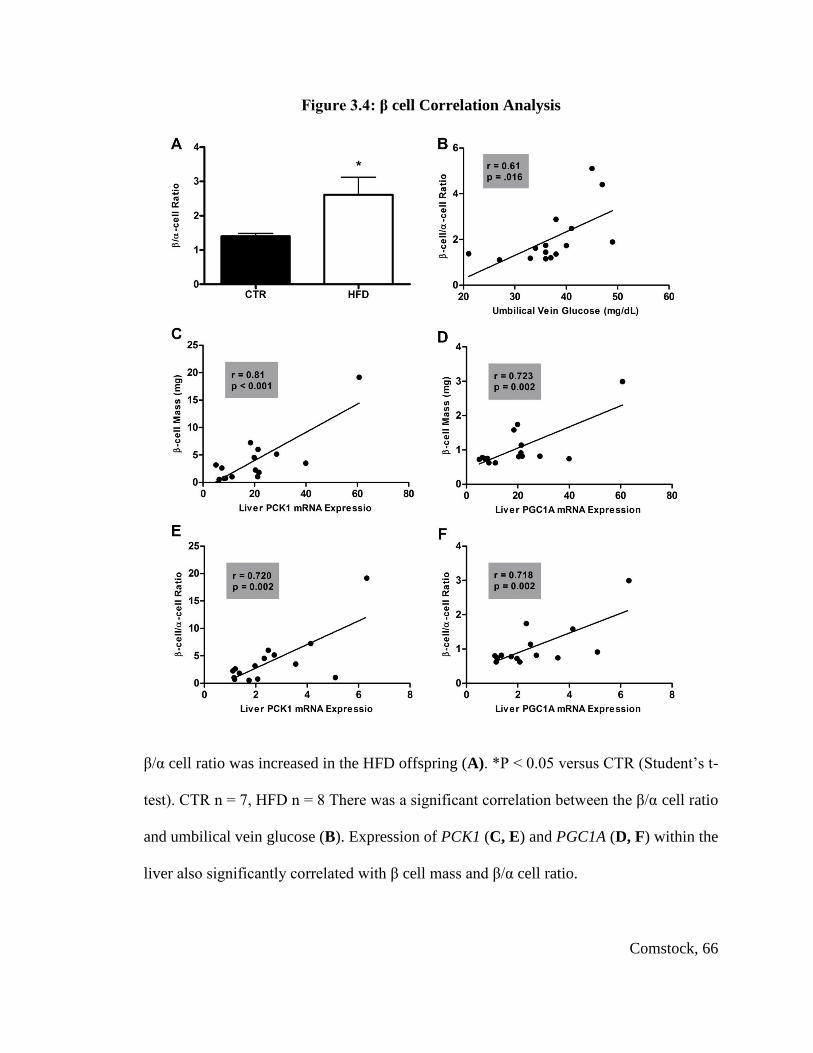
Comstock, 66
Figure 3.4: β cell Correlation Analysis
β/α cell ratio was increased in the HFD offspring (A). *P < 0.05 versus CTR (Student’s t-
test). CTR n = 7, HFD n = 8 There was a significant correlation between the β/α cell ratio
and umbilical vein glucose (B). Expression of PCK1 (C, E) and PGC1A (D, F) within the
liver also significantly correlated with β cell mass and β/α cell ratio.

Comstock, 67
Figure 3.5: Transcription Factor Expression in Fetal Pancreas
PDX1, NKX6.1 and NeuroD gene expression were significantly suppressed in the HFD
offspring (A-C). *P < 0.05 versus CTR (Student’s t-test). CTR n = 12, HFD n = 8

Comstock, 68
Figure 3.6: Expression of Genes Involved in Glucose-stimulated Insulin Secretion in
Fetal Pancreas
Glut2 was increased in the HFD offspring when normalized to β cell area (A).
Glucokinase was significantly elevated in the HFD offspring when normalized to islet
area (B). SUR1 (C) and KCNJ11 (D) were not significantly affected by the HFD when
normalized to islet area. *P < 0.05 versus CTR (Student’s t-test). CTR n = 12; HFD n =
8

Comstock, 69
Chapter 3 Tables

Comstock, 70
Table 3.1: Comparison of CTR and HFD Fetuses
Gestational Day 130 Control HFD
n 12 8
Weight (g) 350.2 ± 8.0 335.4 ± 18.1
Pancreas weight (mg) 256.0 ± 16.6 213.4 ± 14.3
Retro WAT Weight (mg) 120.8 ± 23.0 111.3 ± 18.9
Insulin (μU/mL) 5.56 ± 0.61 5.92 ± 0.06
C-peptide (ng/mL) 0.60 ± 0.06 0.44 ± 0.04 *
Glucose (mg/dL) 116.8 ± 12.2 90.3 ± 11.6
Glucagon (pg/mL) 126.5 ± 16.6 94.6 ± 15.1
Leptin (ng/mL) 0.52 ± 0.02 0.51 ± 0.01
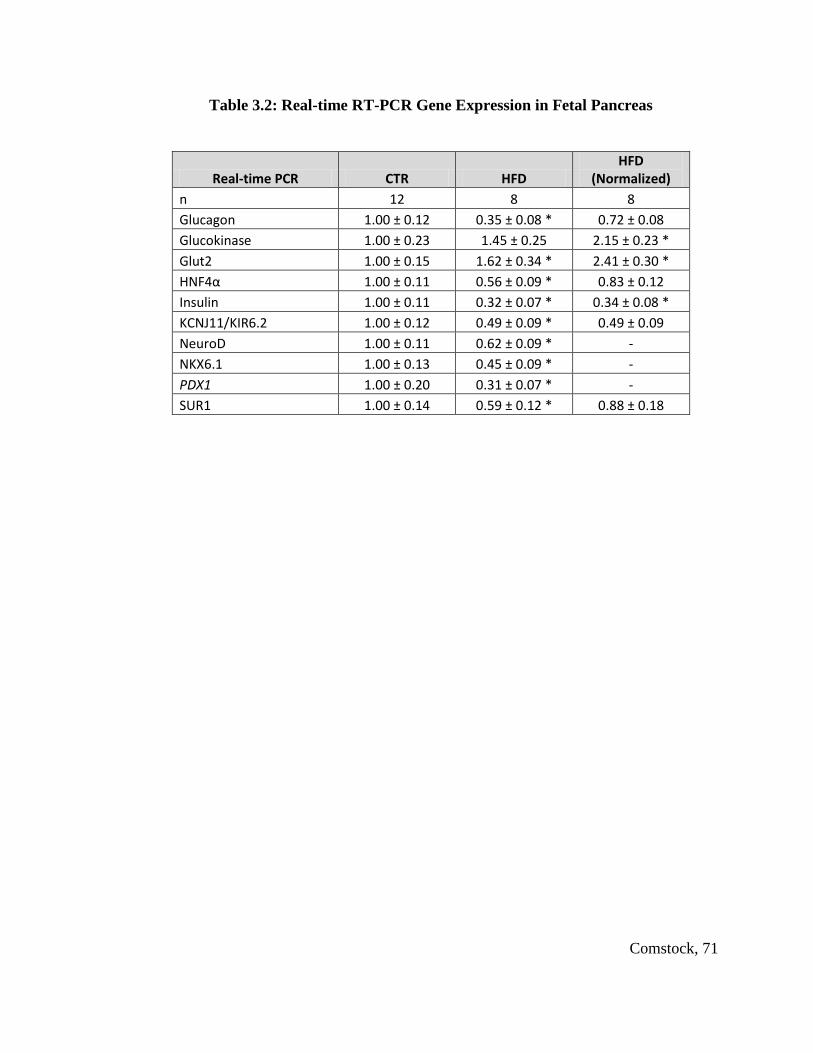
Comstock, 71
Table 3.2: Real-time RT-PCR Gene Expression in Fetal Pancreas
Real-time PCR CTR HFD HFD
(Normalized)
n 12 8 8
Glucagon 1.00 ± 0.12 0.35 ± 0.08 * 0.72 ± 0.08
Glucokinase 1.00 ± 0.23 1.45 ± 0.25 2.15 ± 0.23 *
Glut2 1.00 ± 0.15 1.62 ± 0.34 * 2.41 ± 0.30 *
HNF4α 1.00 ± 0.11 0.56 ± 0.09 * 0.83 ± 0.12
Insulin 1.00 ± 0.11 0.32 ± 0.07 * 0.34 ± 0.08 *
KCNJ11/KIR6.2 1.00 ± 0.12 0.49 ± 0.09 * 0.49 ± 0.09
NeuroD 1.00 ± 0.11 0.62 ± 0.09 * -
NKX6.1 1.00 ± 0.13 0.45 ± 0.09 * -
PDX1 1.00 ± 0.20 0.31 ± 0.07 * -
SUR1 1.00 ± 0.14 0.59 ± 0.12 * 0.88 ± 0.18
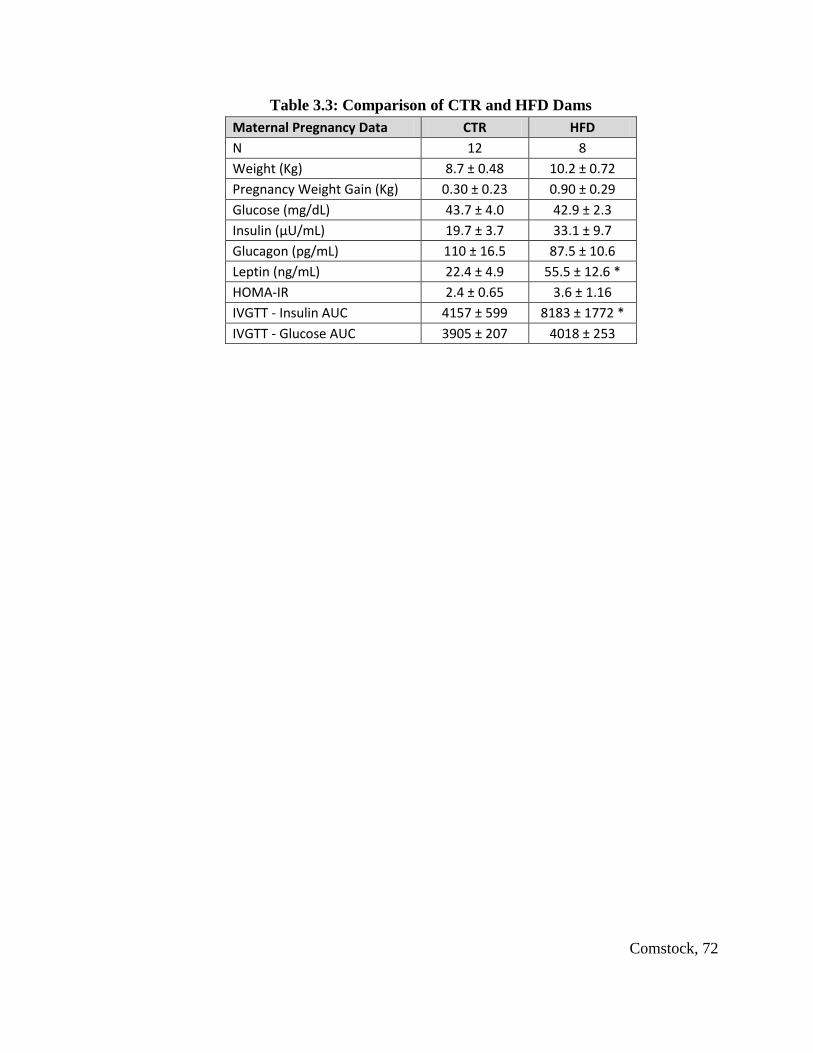
Comstock, 72
Table 3.3: Comparison of CTR and HFD Dams
Maternal Pregnancy Data CTR HFD
N 12 8
Weight (Kg) 8.7 ± 0.48 10.2 ± 0.72
Pregnancy Weight Gain (Kg) 0.30 ± 0.23 0.90 ± 0.29
Glucose (mg/dL) 43.7 ± 4.0 42.9 ± 2.3
Insulin (μU/mL) 19.7 ± 3.7 33.1 ± 9.7
Glucagon (pg/mL) 110 ± 16.5 87.5 ± 10.6
Leptin (ng/mL) 22.4 ± 4.9 55.5 ± 12.6 *
HOMA-IR 2.4 ± 0.65 3.6 ± 1.16
IVGTT - Insulin AUC 4157 ± 599 8183 ± 1772 *
IVGTT - Glucose AUC 3905 ± 207 4018 ± 253

Comstock, 73
Chapter 4: High-Fat Diet During Perinatal Development Leads to Early Insulin
Resistance in the Nonhuman Primate Infant

Comstock, 74
Introduction
Since maternal HFD consumption is a significant contributor to the increased risk
of MetS in children, it is essential to analyze the effects in our HFD post-natal offspring
to determine what physiological processes may be leading up to the development of this
syndrome. The purpose of these studies was to characterize the metabolic profile of
juvenile Japanese macaques chronically exposed to a HFD. The decrease in α cell mass
of fetal HFD offspring likely led to decreased paracrine regulation of β cells, which
resulted in dysfunction of insulin secretion. Due to this dysfunction, it is essential to
determine if continued exposure to the HFD will significantly affect glucose homeostasis
in the HFD offspring. I determined to analyze the physiology of the HFD animals up
through weaning to determine if the islet effects measured in the HFD fetuses would
translate to detrimental effects in infant glucose metabolism. I hypothesized that the
decreased α cell mass and relative increase in the β/α cell ratio caused by the HFD during
gestation would lead to perpetuation of the insulin secretory deficiency, but would
ultimately result in increased insulin secretion and increased susceptibility of the HFD
offspring to insulin resistance.
Comstock, 75
Materials and Methods
Animals. All animal procedures were performed in accordance with the
guidelines of the Institutional Animal Care and Use Committee of the ONPRC as
previously described (Frias, et al.; Grant, et al.; Grayson, et al.; McCurdy, et al., 2009;
Sullivan, et al., 2010) Briefly, age and weight matched adult female Japanese macaques
were fed a control (CTR) or high-fat diet (HFD) for up to 5 years. Juvenile offspring
were born naturally from CTR or HFD mothers during years 2 through 5 on the HFD.
Physiological data collected from animals occurred during the first 210 days of life, prior
to weaning.
Intravenous Glucose Tolerance Tests. We performed IVGTTs at P90 and P180
in the juveniles. In the dams we performed IVGTTs at 123 days (± 5 days) gestation and
at approximately 130 days (± 6 days) postnatally. Animals were sedated with ketamine
(10 mg/kg) and administered a glucose bolus (50% dextrose solution) at a dose of 0.6
g/kg via the saphenous vein. Baseline blood samples were obtained prior to the infusion,
and blood samples were taken at 1, 3, 5, 10, 20, 40, and 60 min after infusion via the
femoral artery. Glucose was measured immediately using a OneTouch Ultra2 Blood
Glucose Monitor (LifeScan), and the remainder of the blood was kept in heparinized
tubes on ice for insulin measurement. After IVGTT, samples were centrifuged, and
plasma was stored with 5% aprotinin at –80°C until assayed. Insulin was assayed in
plasma by RIA (Millipore catalog no. RI-13K, Billerica, MA). HOMA-IR was calculated
as fasting serum insulin (μU/ml) × fasting plasma glucose (mmol/l)/22.5 as previously
described (Bonora, et al., 2000; Matthews, et al., 1985). Baseline samples were assayed
Comstock, 76
for glucagon (Millipore, catalog no. GL-32K, Billerica, MA), and leptin (Millipore
catalog no. HL-81K, Billerica, MA).
Intravenous Insulin Tolerance Tests. We performed IVITTs at P210 on a subset
of animals. Animals were sedated with telazol (5 mg/kg) and a baseline blood sample
was collected and measured for glucose. The remainder of the blood was kept in a
heparinized tube on ice for insulin measurement. Insulin was infused at 0.05U/Kg and
sequential blood samples were taken at 1, 3, 5, 10, 15, 20, 25 and 30 minutes. After
IVITT, the initial baseline sample was centrifuged, and plasma was stored with 5%
aprotinin at –80°C until assayed. Insulin was assayed in plasma by RIA (Milllipore
catalog no. RI-13K, Billerica, MA). The insulin sensitivity index (ISI) was calculated as
the change in glycemia from baseline to 15 minutes (estimated using the linear regression
from baseline to 15 minutes) divided by the initial glycemia (average of both baselines)
as previously described (Grulet, Durlach, Hecart, Gross, & Leutenegger, 1993).

Comstock, 77
Results
Physiology of P30 and P90 Offspring. At postnatal day 30 (P30), body weight
was not significantly different between diet groups, although the HFD offspring did have
increased adiposity (Fig. 4.1a& c). Also, males were significantly heavier than females at
P30 (Fig. 4.1b). Body mass index (BMI) was significantly decreased in the HFD
offspring at P30 (Fig. 4.1d), indicating that the intra-uterine HFD exposure lead to growth
restriction in these animals.
At P90 males were still heavier than females (Fig. 4.2a). However, females tended
to have increased body fat (Table 4.1). Glucose was not significantly affected by the diet;
however, at P90 males did secrete approximately 15% more glucose than females (Fig.
4.2b). Also, insulin response to an IVGTT was significantly suppressed in the HFD
offspring (Fig. 4.2c). The decreased insulin secretion at P90 is likely due to an increase
in insulin secretion in the HFD mothers during lactation (Fig. 4.2d), as insulin is passed
into and absorbed from the breast milk (Jovanovic-Peterson, Fuhrmann, Hedden, Walker,
& Peterson, 1989). Previous publications from this lab have demonstrated an increase in
the insulin content of the breast milk of HFD mothers (Grant, et al., 2011).
Physiology of P180 and P210 Offspring. By P180 HFD offspring were
significantly heavier (Fig. 4.3a) and the sex effect was no longer demonstrable (Table
4.1). While still very lean, the HFD animals had elevated body fat (Fig. 4.3b). At P180
HFD offspring insulin secretion was normalized to control levels (Fig. 4.3c). At P210,

Comstock, 78
just prior to weaning, animals on the HFD had become insulin resistant as indicated by a
30% decrease in their insulin sensitivity index (Fig. 4.3d).

Comstock, 79
Discussion
In order to determine if fetal changes in islet composition and gene expression
might lead to lasting physiological effects in infant macaques from HFD dams, I studied
the physiology of these animals after birth until weaning. Infant offspring consume only
maternal milk during the first three months of life. Since previous studies from our lab
have shown no significant difference in total fatty acid content in milk from dams on the
CTR versus HFD, it is likely that they will not be exposed to the specific metabolic
pressure of the HFD until after P90. In fact, at P90, we demonstrated decreased insulin
secretion in the HFD offspring which may be reflective of the high insulin content of the
mother’s milk. However, since insulin secretion is clearly affected in the HFD fetal
offspring, this may reflect the decreased paracrine regulation of HFD fetal islets. By 7
months of age, the HFD animals were heavier, had increased body fat and were insulin
resistant. However, at this time, there was no significant difference in fasting insulin or
insulin response to an IVGTT. This indicates that, while HFD exposure during the early
post-natal period may lead to whole body insulin resistance. While islet defects were not
measureablel at this stage if α cell mass remained decreased, it may produce a beneficial
effect in the HFD post-natal offspring which will lead to decreased glucagon production
and allow them to adapt to the high lipid content of the diet.
Although HFD during fetal development may program the fetal pancreas to
withstand the early postnatal insults of this diet, this adaptation may not continue when
the juvenile offspring are chronically exposed to the increased metabolic pressure that the
HFD produces. As we have previously demonstrated, there are significant effects of the

Comstock, 80
HFD on liver function and morphology in the fetuses of HFD mothers (Grant, et al.,
2011; McCurdy, et al., 2009), indicating that insulin resistance in the HFD animal results
from dysfunction of peripheral tissues first and then hyperinsulinemia will occur as a
response to this resistance. While insulin hyper-secretion and insulin resistance occur
concurrently in the diabetic adult, in this model we have demonstrated that the pathway
to disease progression starts with insulin resistance. My hypothesis that decreased α cell
mass and relative increase in the β/α cell ratio caused by the HFD during gestation leads
to elevated insulin secretion is not supported by this data. The decreased insulin
secretion at P90 may be a result of β cell dysfunction; however, based on the limitations
of this study, it is not possible to determine how islet composition is affected. Yet, these
animals become insulin-resistant, as I hypothesized. It is essential to follow these
animals until a point at which there are significant physiologic measures of islet
dysfunction in order to determine how islets adapt in the juvenile animal to a HFD.

Comstock, 81
Chapter 4 Figures
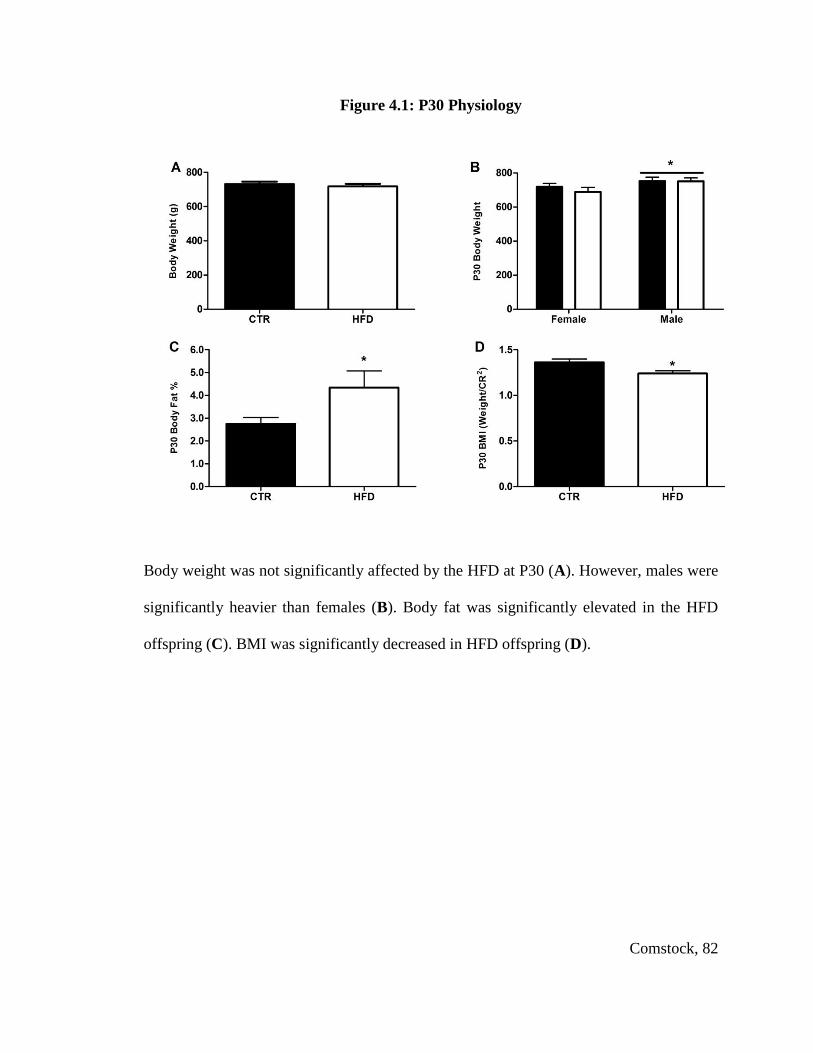
Comstock, 82
Figure 4.1: P30 Physiology
Body weight was not significantly affected by the HFD at P30 (A). However, males were
significantly heavier than females (B). Body fat was significantly elevated in the HFD
offspring (C). BMI was significantly decreased in HFD offspring (D).
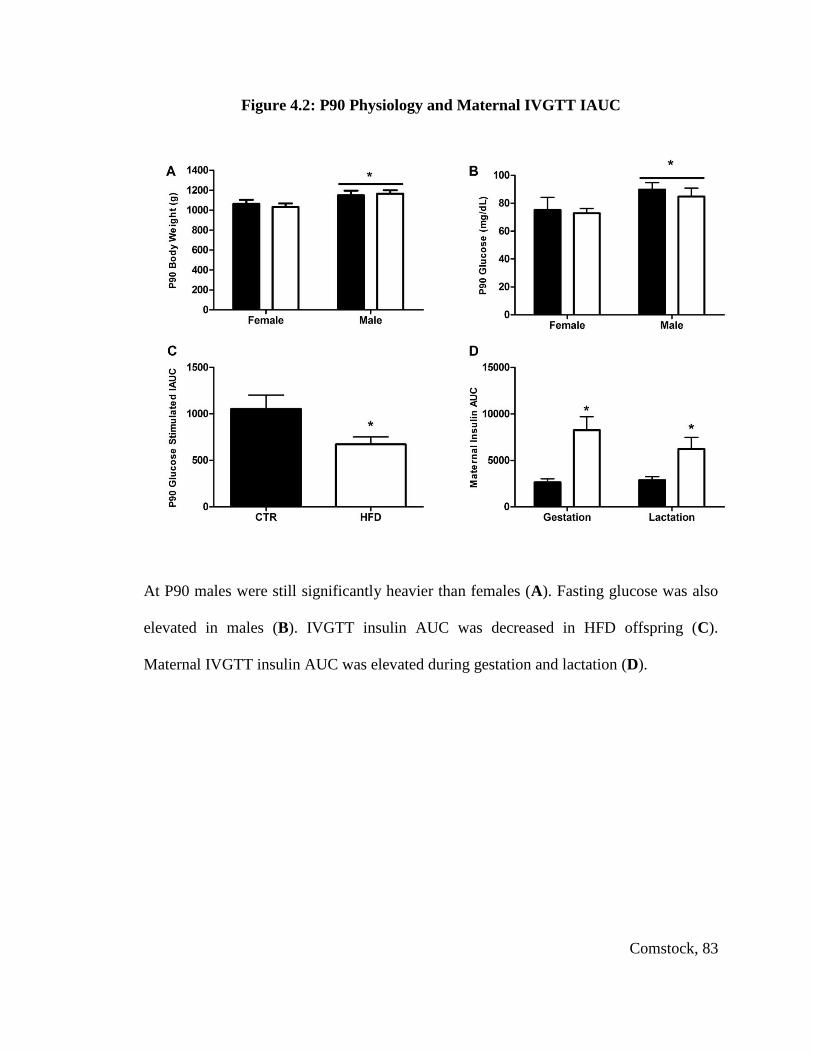
Comstock, 83
Figure 4.2: P90 Physiology and Maternal IVGTT IAUC
At P90 males were still significantly heavier than females (A). Fasting glucose was also
elevated in males (B). IVGTT insulin AUC was decreased in HFD offspring (C).
Maternal IVGTT insulin AUC was elevated during gestation and lactation (D).

Comstock, 84
Figure 4.3: P180 and P210 Physiology
Body weight was significantly increased in the HFD offspring by P180 (A). Body fat
percentage was significantly elevated in the P180 offspring (B). There was no significant
effect of HFD on insulin secretion during a GTT at P180 (C). *P < 0.05 versus CTR
(Student’s t-test) CTR n=24, HFD n= 35. By P210 HFD animals are insulin resistant
(D). *P < 0.05 versus CTR (Student’s t-test; CTR n=16, HFD n= 14)

Comstock, 85
Chapter 4 Tables

Comstock, 86
Table 4.1: Physiology of P30 and P90 Offspring
Sample Size 10 14 16 19 Diet or Sex
Effect Sex Female Male Female Male
Postnatal Day 30 CTR HFD
Weight (g) 719 ± 19.8 753 ± 22.1 688 ± 27.6 751 ± 20.1 SEX
Ponderal Index 57.5 ± 2.95 56.7 ± 2.24 55.7 ± 1.94 56.9 ± 2.93 -
Total Body Fat % 2.81 ± 0.44 2.69 ± 0.35 5.63 ± 1.32 3.42 ± 0.57 DIET
Postnatal Day 90 CTR HFD
Weight (g) 1064 ± 40.3 1149 ± 46 1031 ± 36 1165 ± 35 SEX
Ponderal Index 5.79 ± 0.24 5.9 ± 0.19 5.6 ± 0.2 5.6 ± 0.2 -
Body Mass Index 1.51 ± 0.04 1.59 ± 0.04 1.48 ± 0.05 1.53 ± 0.05 SEX
Total Body Fat % 4.85 ± 0.65 4.38 ± 0.60 5.99 ± 0.54 5.3 ± 0.47 -
Fasting Glucose (mg/dL) 75.2 ± 9.0 89.9 ± 4.9 72.8 ± 3.5 84.8 ± 6.0 SEX
Fasting Insulin (μU/mL) 13.9 ± 4.7 14.1 ± 4.5 10.4 ± 1.87 10.0 ± 2.48 -
Glucagon (pg/mL) 103.4 ± 36.6 110.9 ± 13.6 124.85 ± 25.5 110.5 ± 12.0 -
Leptin (ng/mL) 2.37 ± 0.52 2.20 ± 0.30 2.52 ± 0.34 2.02 ± 0.31 -
HOMA-IR 4.27 ± 1.31 4.18 ± 1.02 1.97 ± 0.42 2.44 ± 0.89 -
IVGTT – GSIS 1179 ± 260 958 ± 186 804 ± 158 579 ± 95 DIET
IVGTT - Glucose AUC 3712 ± 591 3802 ± 412 3416 ± 274 3788 ± 211 -
IVGTT - Total Insulin AUC 1663 ± 228 1953 ± 278 1318 ± 213 1286 ± 154 DIET
IVGTT - 1st Phase Insulin 15.7 ± 3.43 19 ± 4.0 22.0 ± 5.5 18.9 ± 3.4 -
IVGTT - 2nd Phase Insulin 1493 ± 201 1837 ± 262 1211 ± 93 1166 ± 142 -
Physiological measurements of infantile offspring taken at post-natal day 30 and 90. Diet
or sex effect indicated on table, P < 0.05 (2 way ANOVA, with Bonferroni’s post-hoc
test).
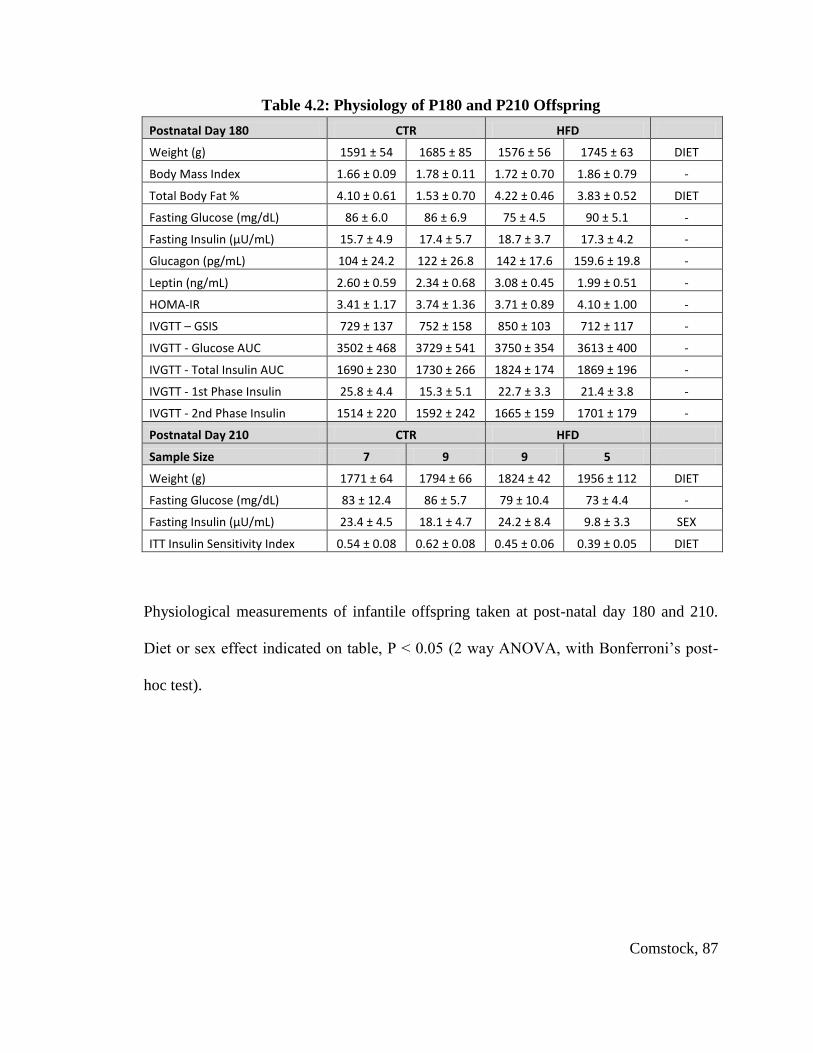
Comstock, 87
Table 4.2: Physiology of P180 and P210 Offspring
Postnatal Day 180 CTR HFD
Weight (g) 1591 ± 54 1685 ± 85 1576 ± 56 1745 ± 63 DIET
Body Mass Index 1.66 ± 0.09 1.78 ± 0.11 1.72 ± 0.70 1.86 ± 0.79 -
Total Body Fat % 4.10 ± 0.61 1.53 ± 0.70 4.22 ± 0.46 3.83 ± 0.52 DIET
Fasting Glucose (mg/dL) 86 ± 6.0 86 ± 6.9 75 ± 4.5 90 ± 5.1 -
Fasting Insulin (μU/mL) 15.7 ± 4.9 17.4 ± 5.7 18.7 ± 3.7 17.3 ± 4.2 -
Glucagon (pg/mL) 104 ± 24.2 122 ± 26.8 142 ± 17.6 159.6 ± 19.8 -
Leptin (ng/mL) 2.60 ± 0.59 2.34 ± 0.68 3.08 ± 0.45 1.99 ± 0.51 -
HOMA-IR 3.41 ± 1.17 3.74 ± 1.36 3.71 ± 0.89 4.10 ± 1.00 -
IVGTT – GSIS 729 ± 137 752 ± 158 850 ± 103 712 ± 117 -
IVGTT - Glucose AUC 3502 ± 468 3729 ± 541 3750 ± 354 3613 ± 400 -
IVGTT - Total Insulin AUC 1690 ± 230 1730 ± 266 1824 ± 174 1869 ± 196 -
IVGTT - 1st Phase Insulin 25.8 ± 4.4 15.3 ± 5.1 22.7 ± 3.3 21.4 ± 3.8 -
IVGTT - 2nd Phase Insulin 1514 ± 220 1592 ± 242 1665 ± 159 1701 ± 179 -
Postnatal Day 210 CTR HFD
Sample Size 7 9 9 5
Weight (g) 1771 ± 64 1794 ± 66 1824 ± 42 1956 ± 112 DIET
Fasting Glucose (mg/dL) 83 ± 12.4 86 ± 5.7 79 ± 10.4 73 ± 4.4 -
Fasting Insulin (μU/mL) 23.4 ± 4.5 18.1 ± 4.7 24.2 ± 8.4 9.8 ± 3.3 SEX
ITT Insulin Sensitivity Index 0.54 ± 0.08 0.62 ± 0.08 0.45 ± 0.06 0.39 ± 0.05 DIET
Physiological measurements of infantile offspring taken at post-natal day 180 and 210.
Diet or sex effect indicated on table, P < 0.05 (2 way ANOVA, with Bonferroni’s post-
hoc test).

Comstock, 88
Table 4.3: Physiology of Dams of Infant Offspring
Sample Size 10 14 16 19 Diet or Sex
Effect Offspring Sex Female Male Female Male
Maternal Pregnancy Data CTR HFD
Weight (Kg) 8.9 ± 1.1 9.7 ± 1.4 11.8 ± 1.7 11.9 ± 2.2 DIET
Pregnancy Weight Gain (Kg) 0.23 ± 0.4 0.72 ± 0.3 0.28 ± 0.2 1.4 ± 0.7 -
Glucose (mg/dL) 43 ± 4.2 42 ± 2.8 39 ± 2.8 48 ± 3.6 -
Insulin (μU/mL) 10.0 ± 2.2 11.5 ± 2.7 40.6 ± 6.4 63.9 ± 7.5 DIET
HOMA-IR 1.1 ± 0.2 1.3 ± 0.3 4.2 ± 1.1 8.5 ± 2.2 DIET
IVGTT - Insulin AUC 2725 ± 49 2388 ± 30 6406 ± 67 10493 ± 106 DIET
IVGTT - Glucose AUC 4791 ± 34 5341 ± 25 4575 ± 39 4320 ± 30 -
Maternal Lactation Data CTR HFD
Weight (Kg) 9.3 ± 0.6 9.5 ± 0.5 12.7 ± 0.7 11.9 ± 0.5 DIET
Glucose (mg/dL) 53 ± 3.7 51 ± 2.1 55 ± 1.7 53 ± 2.0 -
Insulin (μU/mL) 15.5 ± 5.0 16.0 ± 2.9 56.8 ± 19.7 32.5 ± 8.4 DIET
HOMA-IR 2.3 ± 0.8 2.0 ± 0.4 7.4 ± 2.4 5.0 ± 1.1 DIET
IVGTT - Insulin AUC 3242 ± 926 2819 ± 397 6157 ± 754 4195 ± 758 DIET
IVGTT - Glucose AUC 6199 ± 622 6260 ± 329 6113 ± 338 5539 ± 396 -
Physiological measurements of dams of infant offspring taken during the third trimester
of pregnancy and during the 3-4th
month of lacation, separated by sex of the offspring.
Diet or sex effect indicated on table, P < 0.05 (2 way ANOVA, with Bonferroni’s post-
hoc test).

Comstock, 89
Chapter 5: Chronic High-Fat Diet Consumption During Pregnancy and the Early
Postnatal Period Leads to Decreased α Cell Plasticity in the Juvenile Nonhuman
Primate

Comstock, 90
Introduction
In the previous chapters, I have shown that maternal obesity and/or HFD
consumption can impact fetal islet development and lead to insulin resistance in the post-
natal offspring prior to weaning. Specifically, I demonstrated a decrease in α cell mass
and a down-regulation of transcription factors involved in the differentiation pathway of
these cells during pregnancy(Comstock, 2012). In contrast, in rodent models, α cell mass
is increased in response to a HFD (Cerf, et al., 2005). However, in sheep models, there is
only evidence of β cell abnormalities when exposed to maternal overnutrition during the
second trimester of gestation (S. P. Ford, et al., 2009; L. Zhang, et al., 2011). While
many studies have been performed on post-natal development in the rodent, there are
significant species differences. Furthermore, in primate species, there is significant islet
expansion through puberty (Hansen & Bodkin, 1990; Wolfe-Coote, Louw, Woodroof, &
Du Toit, 1996). Therefore, post-natal nutrition may also significantly impact islet
development and function.
The primary purpose of these studies was to determine the relative impact of early
programming events (maternal diet) versus post-weaning dietary influence on pancreas
development and potential long-term susceptibility to diabetes. To accomplish this, I
compared islet development and function in juvenile macaques from four different
groups: CTR/CTR, CTR/HFD, HFD/CTR and HFD/HFD. Using these four groups, we
can determine the relative impact of maternal HFD versus the impact of the HFD during
the post-weaning period on islet structural morphology and function. I hypothesized that
the decreased α cell mass in the HFD offspring would perpetuate by continued HFD
Comstock, 91
exposure through the post-weaning period and would lead to hyperinsulinemia, increased
insulin resistance, and persistant changes in islet morphology. My second hypothesis was
that a post-weaning dietary intervention to a standard control (CTR) diet could reverse
the effects of HFD consumption during early development (HFD/CTR). Finally, my third
hypothesis was that post-weaning HFD alone (CTR/HFD) would lead to alterations in
islet morphology that would have diminished effects on glucose homeostasis, compared
to the HFD/HFD offspring.

Comstock, 92
Materials and Methods
Animals. All animal procedures performed were in accordance with the
guidelines of the Institutional Animal Care and Use Committee of the Oregon National
Primate Research Center (ONPRC) as previously described (Frias, et al.; Grant, et al.;
Grayson, et al.; McCurdy, et al., 2009; Sullivan, et al.). Briefly, age- and weight-matched
adult female Japanese macaques were fed a CTR or HFD. Juvenile offspring were born
naturally from CTR or HFD mothers during years 2 through 5 on the HFD and allowed to
stay with their mothers until weaning at approximately 8 months of age (249 +/- 4 days).
At 8 months, the juveniles were weaned and maintained on the same diet or switched to
the opposing diet, for 5 months (143 +/- 3 days), thus generating four juvenile groups:
CTR/CTR, CTR/HFD, HFD/CTR & HFD/HFD. These animals were necropsied at
approximately 13 months of age (393 +/- 4 days).
Intravenous Glucose Tolerance Tests. As previously described (Grant, et al.,
2011; McCurdy, et al., 2009), we performed an IVGTT 1 week prior to necropsy. Briefly,
after a 5 hour morning fast, animals are sedated with ketamine and administered a
glucose bolus at a dose of 0.6 g/kg via the saphenous vein. Baseline blood samples were
obtained prior to the infusion, and samples were taken at 1, 3, 5, 10, 20, 40, and 60
minutes after infusion via the femoral artery. Glucose was measured immediately and the
remainder of the blood was kept on ice for insulin measurement in plasma by RIA
(catalog no. RI-13K; Linco). HOMA-IR was calculated as fasting serum insulin (μU/ml)
× fasting plasma glucose (mmol/l)/22.5, as previously described (Bonora, et al., 2000;
Matthews, et al., 1985).
Comstock, 93
RNA Isolation and Quantitative RT-PCR. Total RNA was isolated from 5
head-to-tail grouped sections of each offspring pancreas (Chapter 3, Fig. 3.1) using
TRIzol reagent (Invitrogen, Carlsbad, CA). RNA was DNase-treated and reverse-
transcribed. mRNA was measured by real-time quantitative RT-PCR using a PE Applied
Biosystems PRISM 7700 Sequences Detector System (Invitrogen Life Technologies,
Carlsbad, CA). Premade qPCR gene expression assays directed against human sequences
were purchased from Applied Biosystems. The amplification was performed as follows: 2
min at 50°C, 10 min at 95°C, then 45 cycles each at 95°C for 15 sec and at 60°C for 60
sec in the ABI/Prism 7700 Sequences Detector System. Standard curves on serial
dilutions of the cDNA (1:10, 1:50, 1:100 1:500, 1:1000 and 1:10,000) were performed
using cDNA from pooled pancreas samples. Standard curves were drawn on the basis of
the log of the input RNA versus the critical threshold (CT) cycle, in which the
fluorescence of the sample is greater than the threshold of the baseline fluorescence. The
housekeeping gene β-actin was assayed and shown to be consistently expressed between
juvenile groups, while two other commonly used genes (18S and GAPDH) were
significantly differentially expressed in the various diet groups. Therefore, all qRT-PCR
results are normalized to β-actin expression.
Immunohistochemistry. Pancreas tissue was collected from 5 head-to-tail areas
(Chapter 3, Fig. 3.1) and cut into 5 μm paraffin-embedded sections. Sections were
deparaffinized in xylene and then washed with 100%, 95%, 85%, and 70% graded
ethanol for 5 minutes each. Microwaving in citrate buffer was used for antigen retrieval.
Standard immunohistochemical methods were used. Briefly, sections were washed in

Comstock, 94
KPBS and then blocked in 2% donkey serum in 0.4% triton X/KPBS. Antibodies against
insulin (#20056, 1:2000, Immmunostar, Hudson, WI) and glucagon (#4031-01F,
1:10,000, Linco, St. Charles, MO) were used, which have been previously described for
immunohistochemical identification of β cells and α cells, respectively (Elghazi, Cras-
Meneur, Czernichow, & Scharfmann, 2002; Prado, Pugh-Bernard, Elghazi, Sosa-Pineda,
& Sussel, 2004). Primary antibodies were diluted in 2% donkey serum in 0.4% triton
X/KPBS and applied to tissue sections where they were incubated overnight. Tissues
were then washed in KPBS and secondary antibodies were applied for 1 hour at room
temperature at a dilution of 1:200 (Jackson ImmunoResearch Laboratories, Inc, West
Grove, PA). The specificity of the antibodies were determined by omitting the primary
and using only the secondary. These tests did not produce staining.
Quantitative Analysis. Images were acquired with a MarianasTM imaging
workstation (Intelligent Imaging Innovations, Denver, CO), using a 20X objective and
the stereology module to montage images covering whole sections. Areas occupied by β
and α cells were measured based on intensity segmentation of each fluorescence channel
using Slidebook 5.0. The β and α cells fractions were calculated by dividing by the area
of the whole section. Total islet area (insulin and glucagon stained area/DAPI stained
area), islet mass (total islet area x pancreas weight), β and α cell mass [(total insulin or
glucagon stained area/DAPI stained area) x pancreas weight] and islet density (total islet
number/DAPI area) were calculated as previously reported (Uchida, et al., 2005). Islets
were classified based on size: stained cell clusters with an area greater than 1000 μm2 or
diameter approximately 35 µm were arbitrarily defined as large islets, while any clusters

Comstock, 95
smaller than this were classified as small islets. Individual α and β cell size and number
were quantified in a manner similar to that previously described (Beringue, et al., 2002;
Montanya & Tellez, 2009). Briefly, stereologically sampled 20x images from the tail
region of each pancreas were selected, and 3 to 5 whole islets were quantified from each
animal. Individual α and β cell area was measured based on glucagon and insulin
staining and the number of nuclei were quantified in that area.
Data Analysis. For all analyses not specifically described above, data were
compiled and tested for normality with SPSS Statistics 19 software (Armonk, New
York). Data was tested for maternal or post-weaning diet effect using two-way ANOVA,
then Bonferroni post-hoc analysis to test difference between individual groups. In order
to determine a sex effext, a three-way ANOVA was performed on all data for sex,
maternal diet and post-weaning diet. Significance was reported as p < 0.05. All graphs
were made with Prism software (GraphPad Software, Inc., La Jolla, CA).
Comstock, 96
Results
Metabolic Characteristics of Juvenile Offspring Exposed to a HFD. During
the post-weaning period, both CTR/HFD and HFD/HFD animals gain significantly more
weight than CTR/CTR animals (data not shown). However, by 13 months, only the
HFD/HFD animals were significantly heavier than CTR/CTR animals (Fig. 5.1a).
Maternal diet did not significantly affect final weight; rather, the post-weaning diet was
the most significant predictive of weight at necropsy. Interestingly, for the HFD/HFD and
HFD/CTR groups, males had a higher (approximately 10% higher) final weight than
females; in contrast, for the CTR/CTR and CTR/HFD, the final weights were similar for
males and females (Fig. 5.2a). While all animals exposed to HFD diet tended to have
slightly elevated overall body fat (as determined by DEXA); this was not significantly
different (Table 5.1). However, retroperitoneal white adipose tissue (RWAT) mass was
elevated in both post-wean fed HFD groups (Fig. 5.1b; Table 5.1), and subscapular
caliper measures, an indicator of subcutaneous fat mass, were also significantly greater in
these groups (not shown). It should be recognized that, as a whole, these animals are very
lean at 13 months, with less that 3% body fat (Table 5.1). Consistent, with the sex-
dependent differences in weight, fasting glucose was significantly elevated specifically in
the males that had been exposed to the maternal diet (HFD/HFD and HFD/CTR), but was
not significantly different between the female diet groups (Fig. 4.2b). In contrast, fasting
insulin, insulin area under the curve (IAUC) and HOMA-IR was similarly increased in
both sexes in response to the post-weaning high-fat diet exposure (Fig. 5.1c&d, Table

Comstock, 97
5.1); however, this was only significant in the HFD/HFD group. There was no significant
difference in basal glucagon levels between the different groups (Table 5.1).
Altered Islet Morphology in HFD Juveniles. Stereological analysis of
pancreatic islets was performed to determine the relative contribution of islet mass, size,
density and islet composition upon the physiological effects noted in the juveniles.
Importantly, pancreas weight was lower specifically in the CTR/HFD group (Table 5.1),
thus all subsequent measures were normalized to pancreas weight. Islet mass of the both
CTR/HFD and HFD/HFD animals was increased by 30% when compared to CTR/CTR,
while the HFD/CTR was not significantly different from CTR/CTR (Fig 5.3a).
Interestingly, the increase in islet mass in the HFD/HFD group was due to an increase in
the average islet diameter (Fig. 5.3b). However, the increase in the CTR/HFD was due to
an increase in islet density (Fig. 5.3c). Further analysis of islets by size demonstrated an
increase in large islet mass in the HFD/HFD group and an increase in small islet density
in the CTR/HFD group (Fig. 5.4a&c). In order to determine which cell type contributed
to the increase in islet mass, we quantified total α and β cell area separately. Surprisingly,
while the CTR/HFD group displayed a near doubling of both β cell cell area (Fig.
5.5a&b), only β cell area was significantly increased in the HFD/HFD (Fig. 5.5a). This
leads to a normal β/α cell ratio in the CTR/HFD group but an increase in the β/α cell ratio
in HFD/HFD animals (Fig. 5.5c). Since an increase in β cell or α cell area could be a
result of hyperplasia or hypertrophy, we also determined β cell and α cell size and
number. While β cell size did not change in any of the groups (Fig. 5.6a), β cell number
was increased in both the CTR/HFD and HFD/HFD groups (Fig. 5.6b); however, the

Comstock, 98
increase in the CTR/HFD was significantly greater than the HFD/HFD group. In contrast,
α cell size was increased in both the CTR/HFD and HFD/HFD groups (Fig. 5.6c), even
though only the CTR/HFD group displayed an increase in α cell number (Fig. 5.6d). This
indicates that the increase in α cell area in the CTR/HFD and HFD/HFD groups is due to
hyperplasia, while the increased β cell area in the CTR/HFD group is due to hypertrophy.
Differential Islet Gene Expression of HFD Offspring. In order to determine
which factors may be responsible for the increase in insulin secretion observed in HFD
offspring, we analyzed the mRNA expression in the whole pancreas of various genes
involved in insulin production and secretion. It should be noted that we have presented
data as both gene expression normalized to a house-keeping gene (β-actin (Fig. 5.78f) as
well as normalized to β cell area, α cell area, or islet area, depending on the cell types in
which the gene of interest is expressed. This methodology has been previously described
when whole-pancreas mRNA is used (Gatford, et al., 2008). Absolute insulin mRNA
expression was significantly elevated only in HFD/HFD pancreas, when compared to the
CTR/CTR group (Fig. 5.87a). When insulin mRNA levels were normalized to the β cell
area (insulin-producing cells), the effect in the HFD/HFD group was lost, but there was a
significant overall maternal diet effect (Fig. 5.8a). This would indicate that the increase in
the HFD groups may be partially dependent on the increase in β cell area, but that
maternal HFD diet causes an increase in cellular expression. Consistent with the lack of
differences in circulating glucagon levels, glucagon mRNA was not significantly
different between the groups (Fig. 5.7e), even after normalizing to the α cell area (Fig.
5.8e). The two key genes involved in the initiation of GSIS are the glucose transporter

Comstock, 99
Glut2 that facilitates diffusion of glucose into the cell, and glucokinase (GK), the rate-
limiting enzyme in glycolysis (Iynedjian, 1993; Matschinsky, 1996; Newgard &
McGarry, 1995). In preliminarily studies using immunohistochemistry, we demonstrated
that the primary glucose transporter in Japanese macaque β cells is Glut2 (Fig. 5.9).
Interestingly, Glut2 expression (Fig. 5.7c) was significantly increased specifically in the
CTR/HFD, while GK expression was specifically elevated in HFD/HFD group (Fig.
5.7b). However, when normalized for β cell area, the differences in Glut2 mRNA were
completely eliminated, suggesting that the change in Glut2 is dependent on changes in β
cell area. In contrast, when GK expression was normalized to islet area, the effect in the
HFD/HFD group was lost, but a decrease in expression in the CTR/HFD group was
unmasked. This indicates that cellular expression of GK in the islet is normal in
HFD/HFD animals, but lower in the CTR/HFD group.
Juveniles on the HFD are exposed to 4 times more fatty acids than the CTR
animals (Grant, et al., 2011), which can augment insulin secretion through activation of
the G-protein coupled receptor GPR40/FFAR1 (free fatty acid receptor 1) (Briscoe et al.,
2003; Nolan, Madiraju, Delghingaro-Augusto, Peyot, & Prentki, 2006). Offspring on the
post-weaning HFD had significantly increased FFAR1 gene expression (Fig. 5.7d). Since
FFAR1 has been confirmed in α cells as well as β cells (Del Guerra et al., 2010; Flodgren
et al., 2007; Tomita et al., 2006), FFAR1 expression was normalized to islet area. There
was no significant effect on normalized FFAR1 expression (Fig. 5.8d), indicating that the
up-regulation was likely secondary to the increase in islet mass, not individual cell gene
expression.

Comstock, 100
Discussion
It is clear from these studies that, in young animals, exposure to a HFD during the
postnatal period can have a similar impact on overall weight gain and glucose
homeostasis, irrespective of whether the animal was born to a mother on a CTR or HFD.
However, these studies point to some fundamental differences in the underlying
mechanisms leading to the impaired endocrine pancreas function between CTR and HFD
offspring. First, it should be noted that HFD/HFD and CTR/HFD offspring displayed a
higher average body weight, which was only significant in the HFD/HFD group, although
the increase is only approximately 10%. Furthermore, while these animals have
increased adiposity, overall the animals are very lean, with less than 3% body fat. In
spite of this modest phenotype, the HFD/HFD offspring have significantly increased
fasting and GSIS. There is also a modest sex difference in the metabolic effects. Body
weight in females is not significantly elevated, but CTR/HFD and HFD/HFD are insulin
resistant at this stage. However, males are heavier and the effect of the HFD is more
evident in this sex. Glucose levels are significantly elevated in both the HFD/CTR and
the HFD/HFD males, indicating that the metabolic effect of maternal HFD is more robust
in these animals. The sex effect that we have demonstrated is consistent with the findings
in rodent models in which males tend to be more susceptible to fetal HFD induced
metabolic effects (Dunn & Bale, 2009; Estrany, Proenza, Llado, & Gianotti, 2011;
Gomez-Perez, Gianotti, Llado, & Proenza, 2011; Medrikova et al., 2011). Importantly,
these effects were independent of maternal obesity or insulin resistance.

Comstock, 101
Islet mass is similarly increased in both the CTR/HFD and HFD/HFD offspring.
However, the underlying factors that contribute to this increase are different. Animals
exposed to the maternal HFD have larger islets, while the post-weaning HFD alone leads
to an increased number of islets. Both effects result in increased islet mass, although
morphological differences are likely to have differential long-term outcomes in these
animals. By increasing small islet density, CTR/HFD animals may be able to resist the
effect of the HFD for longer. Since islet maturation in the macaque continues through
puberty, the smaller islets will be able to continue to expand in response to metabolic
pressure and allow for increased insulin secretion in response to chronic, long-term HFD
exposure. In contrast, larger islets indicate that the HFD/HFD islets have already started
expanding in response to chronic HFD. The HFD/HFD juveniles will likely progress
through the stages of insulin resistance leading to diabetes more rapidly by reaching the
threshold of islet expansion sooner than the CTR/HFD juveniles.
We demonstrated that the CTR/HFD animals have increased α cell and β cell
mass, while the HFD/HFD offspring only have increased β cell mass. In contrast, the
HFD/CTR α cell and β cell mass are normalized to control levels, indicating that islet
cells are highly plastic during the peri-weaning period. We have previously demonstrated
that fetuses from HFD mothers have decreased α cell mass. Therefore, the lack of α cell
expansion in the HFD/HFD juveniles indicates that there is likely a programmed
suppression of α cells that is a result of chronic HFD throughout the peri-natal period.
This results in nearly a 40% increase in the β/α cell ratio in HFD/HFD offspring. While
the CTR/HFD juveniles do have larger islets, the ratio of β cells to α cells is maintained

Comstock, 102
at normal levels, thus expectedly maintaining paracrine function of these islets. Intact
paracrine regulation of islet cells is essential for long-term glucose homeostasis (Cabrera,
et al., 2006; Walker, et al., 2011), indicating that the relative contribution of α cell and β
cells to islet composition will ultimately predict islet efficiency. It is not known whether
the increase in β/α cell ratio in HFD/HFD juveniles is adaptive or maladaptive at this
stage. Therefore, future studies in these offspring should be performed in order to
determine the long-term effect that the differential ratio will have on glucose
homeostasis.
We also established that the increase in β cell mass in both CTR/HFD and
HFD/HFD offspring is due to β cell hyperplasia. Since there were no measurable
differences in fetal β cell mass from HFD mothers, this increase is likely due to the post-
natal diet. This effect is similar to a rodent model in which post-natal HFD exposure
leads to increased β cell mass (Matveyenko, Singh, Shin, Georgia, & Devaskar, 2010).
However, the effects of maternal versus post-weaning HFD exposure on α cell
development are novel when compared to other model species. In rodents and sheep
models, α cell area tends to be elevated or unaffected by maternal HFD consumption
(Cerf, et al., 2005; S. P. Ford, et al., 2009). The HFD/HFD juveniles have increased α cell
size, but display decreased α cell number, suggesting that they are unable to yield more α
cells in response to chronic HFD pressure. In contrast, the CTR/HFD offspring retain α
cell plasticity demonstrably by increasing cell density when hypertrophy is not sufficient
to balance augmented β cell mass. These differences indicate that maternal HFD

Comstock, 103
exposure limits the ability of α cells to replicate in response chronic post-natal HFD
pressure.
Ultimately, both CTR/HFD and HFD/HFD juveniles are hyperinsulinemic, but
analysis of gene expression in the pancreas provides evidence that the mechanism
underlying the elevation in insulin is maternally programmed. However, it should be
noted that total gene expression of the pancreas may be biased by the islet cell mass or
density when islets are isolated from whole pancreas tissue. Accordingly, gene
expression from isolated islets is biased toward large islets, because isolation protocols
generally score islets as high-quality if they have a minimum specified diameter above at
least 100 μM (Matsumoto et al., 2002). Therefore, in order to obtain gene expression that
is representative of islet content, we normalized gene expression to the area of tissue in
which the gene is expressed (i.e., α cell area, β cell area, or islet area). After
normalization, the key differences demonstrated were an up-regulation of insulin
expression, which is programmed by the maternal HFD and a down-regulation in GK in
the CTR/HFD juveniles. Previous studies have shown that GK is the rate-limiting step in
the initial phases of glucose-stimulated insulin secretion (De Vos et al., 1995; Liang,
Najafi, & Matschinsky, 1990). Decreased GK expression in the CTR/HFD animals will
likely cause these islets to be less responsive to glucose, while the β cells of HFD/HFD
juveniles are primed to respond to glucose. It is unclear what causes the increased
secretion demonstrated in CTR/HFD offspring. FFAR1 expression analysis indicates that
expression of this receptor rises with increasing islet area. Fatty acid potentiation of
glucose-stimulated insulin secretion is an additional factor that may contribute to the

Comstock, 104
increased insulin secretion measured in both post-weaned HFD juvenile groups.
However, future in-vivo and gene-expression studies are essential to determine the role
both glucose and FFAs play in modulation of GSIS in all diet groups.
Upon review of the effects of HFD in these animals, it is evident that HFD
consumption during pregnancy leads to decreased α cell plasticity in the juvenile
Japanese macaque. When animals are returned to a control diet, most factors are
ameliorated, indicating that this is a dynamic period of islet development. However,
maternally programmed metabolic effects are still evident to some extent in these
animals, since not all factors are normalized to control levels. Post-natal HFD exposure
appears to exacerbate the effects of early HFD programming. β cells are hyper-responsive
in the HFD/HFD juveniles (fasting insulin levels are doubled, but β cell mass is only
increased by 30%). This hyper-responsiveness is indicative of early insulin resistance
and the ultimate progression toward diabetes (Ahlgren, et al., 1998; Weir & Bonner-
Weir, 2004; Weir et al., 2009).
While there is a rise in β cell to α cell ratio in HFD/HFD juveniles, these animals
are still apparently capable of managing the metabolic insult. In HFD/HFD animals, α
cells hypersecrete glucagon. It is likely that by suppressing α cell proliferation, glucagon
levels are maintained at control levels. However, long-term exposure to the HFD could
increase the susceptibility of HFD/HFD animals to diabetes because they will be unable
to maintain an appropriate islet paracrine dynamic, which is essential for normal glucose
homeostasis. It is unclear if this imbalance in the islet cell ratio prepares the animal to
combat future metabolic pressure, or if they will reach a peak at which islets are no

Comstock, 105
longer able to withstand the metabolic insult. We anticipate that, by following the
HFD/HFD through the adolescent period, these animals will ultimately reach the plateau
of adaptation and start to decline into early metabolic syndrome. Eventually the
CTR/HFD and HFD/HFD are likely to develop similar metabolic complications because
adaptation to this HFD is unsustainable. However, these studies suggest that the
mechanisms in which the disease progresses and ultimately the timing of disease
progression will be accelerated in the HFD/HFD animals. This is similar to the human
population in which mothers consuming a HFD give rise to children that succumb to
metabolic pressures earlier in life.

Comstock, 106
Chapter 5 Figures

Comstock, 107
Figure 5.1: Juvenile Physiology
HFD/HFD animals were significantly heavier than the CTR/CTR, while CTR/HFD
displayed a similar trend (A) and RWAT was significantly elevated in the CTR/HFD and
HFD/HFD juveniles (B). HFD/HFD fasting (C) insulin and insulin area under the curve
(D) were significantly elevated when compared to CTR/CTR. Weight, RWAT weight,
fasting insulin and insulin AUC were significantly affected by the post-weaning diet.
Two-way ANOVA with Bonferroni’s post-hoc analysis. CTR/CTR, n = 22; CTR/HFD,
n=9; HFD/CTR, n=14; HFD/HFD, n=21.

Comstock, 108
Figure 5.2: Sex Differences in Body Weight and Fasting Glucose
HFD/HFD male offspring have significantly increased body weight, while no significant
difference was demonstrated in the females (A). HFD/CTR and HFD/HFD have
increased fasting glucose secretion and female groups are not significantly different (B).
Two-way ANOVA with Bonferroni’s post-hoc analysis. Males: CTR/CTR, n = 12;
CTR/HFD, n=5; HFD/CTR, n=7; HFD/HFD, n=11. Females: : CTR/CTR, n = 10;
CTR/HFD, n=4; HFD/CTR, n=7; HFD/HFD, n=10.

Comstock, 109
Figure 5.3: Juvenile Islet Mass and Contributing Factors
Pancreas weight was decreased in the CTR/HFD group due to a post-weaning and an
interacting diet effect (A). Both CTR/HFD and HFD/HFD juveniles had a 30% increase
in islet mass as compared to CTR/CTR animals, which is significantly affected by the
post-weaning diet (B). Mean islet diameter was significantly elevated only in the
HFD/HFD offspring, due to a maternal diet effect (C) while islet density was only
significantly elevated in CTR/HFD and displayed a maternal, post-weaning and
interacting diet effect (D). Two-way ANOVA with Bonferroni’s post-hoc analysis.
CTR/CTR, n = 7, CTR/HFD, n =6; HFD/CTR, n=7; HFD/HFD, n=7.
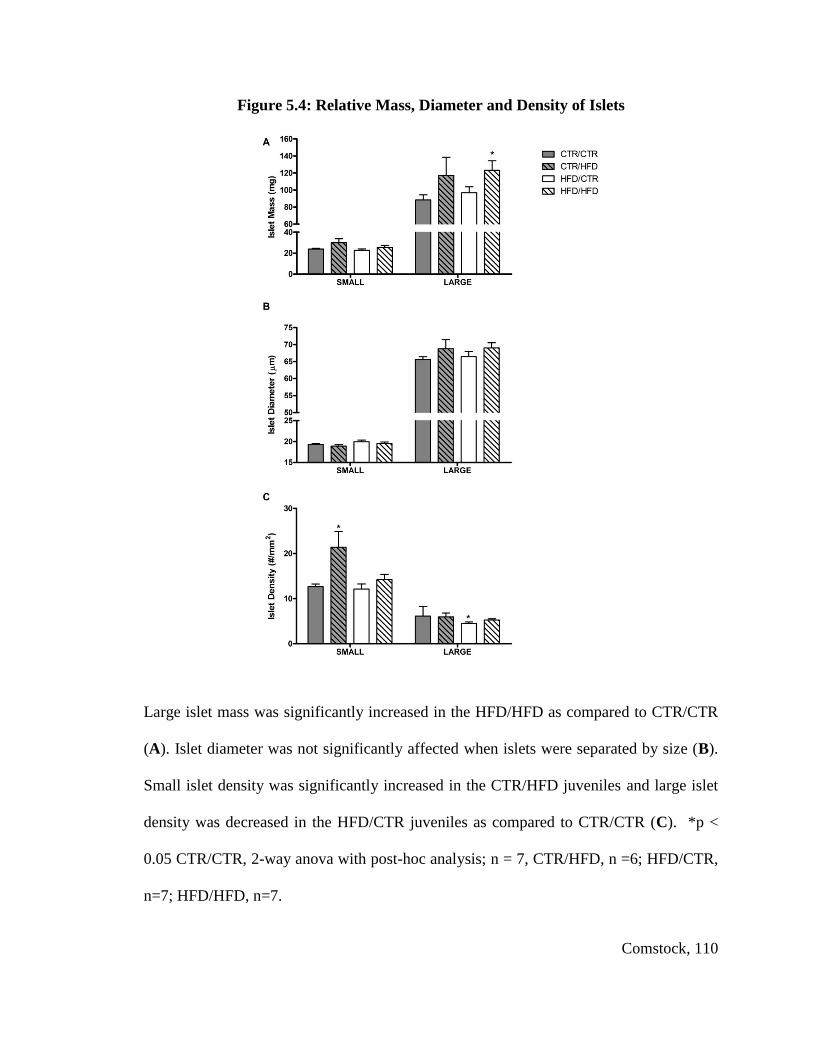
Comstock, 110
Figure 5.4: Relative Mass, Diameter and Density of Islets
Large islet mass was significantly increased in the HFD/HFD as compared to CTR/CTR
(A). Islet diameter was not significantly affected when islets were separated by size (B).
Small islet density was significantly increased in the CTR/HFD juveniles and large islet
density was decreased in the HFD/CTR juveniles as compared to CTR/CTR (C). *p <
0.05 CTR/CTR, 2-way anova with post-hoc analysis; n = 7, CTR/HFD, n =6; HFD/CTR,
n=7; HFD/HFD, n=7.
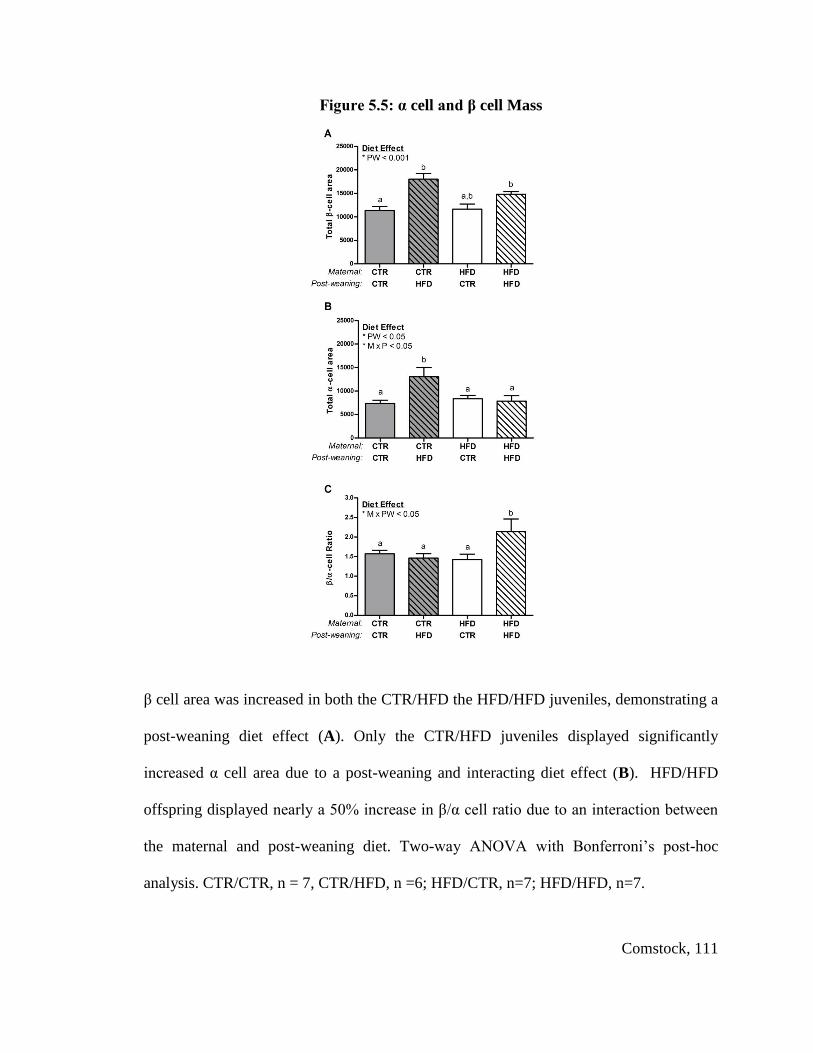
Comstock, 111
Figure 5.5: α cell and β cell Mass
β cell area was increased in both the CTR/HFD the HFD/HFD juveniles, demonstrating a
post-weaning diet effect (A). Only the CTR/HFD juveniles displayed significantly
increased α cell area due to a post-weaning and interacting diet effect (B). HFD/HFD
offspring displayed nearly a 50% increase in β/α cell ratio due to an interaction between
the maternal and post-weaning diet. Two-way ANOVA with Bonferroni’s post-hoc
analysis. CTR/CTR, n = 7, CTR/HFD, n =6; HFD/CTR, n=7; HFD/HFD, n=7.

Comstock, 112
Figure 5.6: β cell and α cell Quantification
There was no change in size of β cells from all juvenile groups (A) while β cells from
both HFD groups displayed significant hyperplasia and had a significant post-weaning
and interacting diet effect (B). α cell hypertrophy was significant in both CTR/HFD and
HFD/HFD offspring due to a post-weaning and interacting diet effect (C). Finally, while
CTR/HFD α cells tended to be hyperplasic, HFD/HFD displayed a decreased number
compared to the CTR/HFD animals. This response is due to a interacting diet effect (D).
Two-way ANOVA with Bonferroni’s post-hoc analysis. CTR/CTR n = 30, CTR/HFD n
=35, HFD/CTR n=30, HFD/HFD n=25.
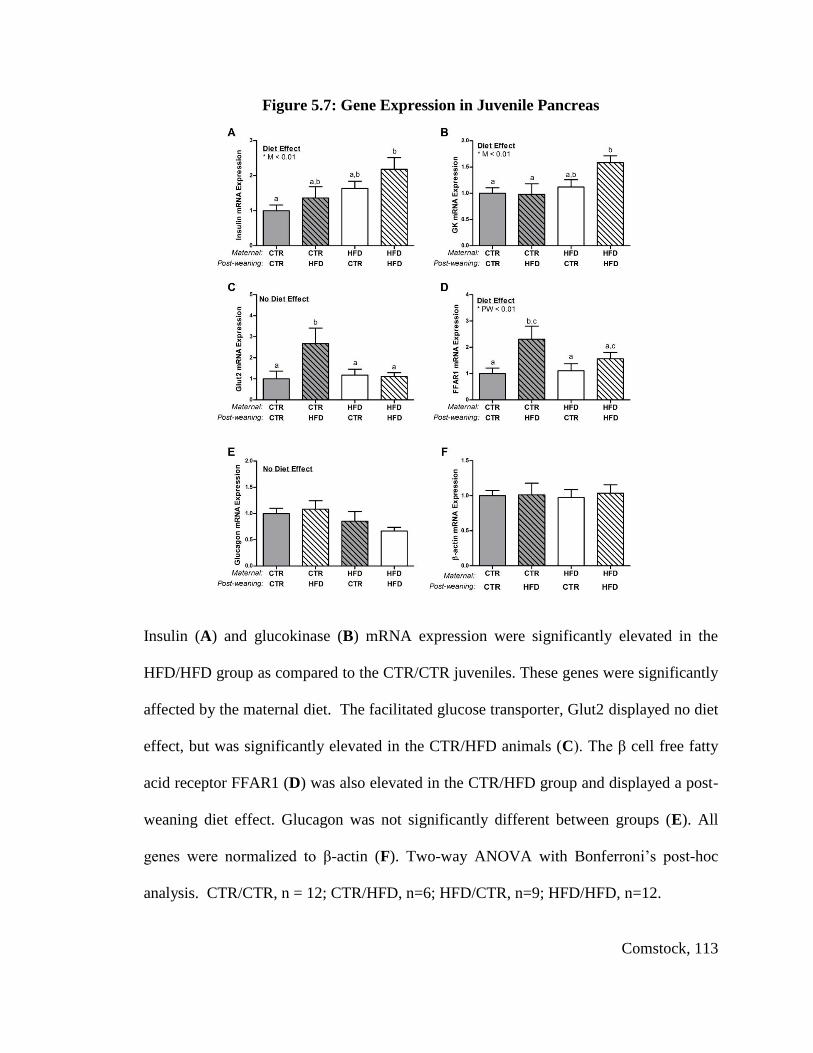
Comstock, 113
Figure 5.7: Gene Expression in Juvenile Pancreas
Insulin (A) and glucokinase (B) mRNA expression were significantly elevated in the
HFD/HFD group as compared to the CTR/CTR juveniles. These genes were significantly
affected by the maternal diet. The facilitated glucose transporter, Glut2 displayed no diet
effect, but was significantly elevated in the CTR/HFD animals (C). The β cell free fatty
acid receptor FFAR1 (D) was also elevated in the CTR/HFD group and displayed a post-
weaning diet effect. Glucagon was not significantly different between groups (E). All
genes were normalized to β-actin (F). Two-way ANOVA with Bonferroni’s post-hoc
analysis. CTR/CTR, n = 12; CTR/HFD, n=6; HFD/CTR, n=9; HFD/HFD, n=12.

Comstock, 114
Figure 5.8: Normalized Gene expression in Juvenile Pancreas
Insulin mRNA/β cell area is significantly affected by the maternal diet, but not different
between juvenile groups (A). Glucokinase mRNA/Islet Area is significantly down-
regulated in the CTR/HFD animals and affected by an interaction between the maternal
and post-weaning diet (B). Glut2/β cell area is not significantly affected (C). FFAR1
mRNA/Islet Area is not significantly affected (D). Glucagon mRNA/α cell area is
affected by the post-weaning diet but not significantly different between groups (E). All
genes were also normalized to β-actin. Two-way ANOVA with Bonferroni’s post-hoc
analysis. CTR/CTR, n = 12; CTR/HFD, n=6; HFD/CTR, n=9; HFD/HFD, n=12.

Comstock, 115
Figure 5.9: Glut2 versus Glut1 Expression
IHC of pancreas sections demonstrate that Glut1 is limited to exocrine tissue (A) while
Glut2 is present in islets, principally β cells (B). GLUT1 or GLUT2 labeled in blue,
insulin labeled in red, glucagon in green and co-labeled insulin and GLUT2 is purple.
Glut2 m RNA expression is more than double the expression of Glut1 mRNA in pancreas
tissue, Student’s t-test, n=39, *p<0.05 (C).

Comstock, 116
Chapter 5 Tables
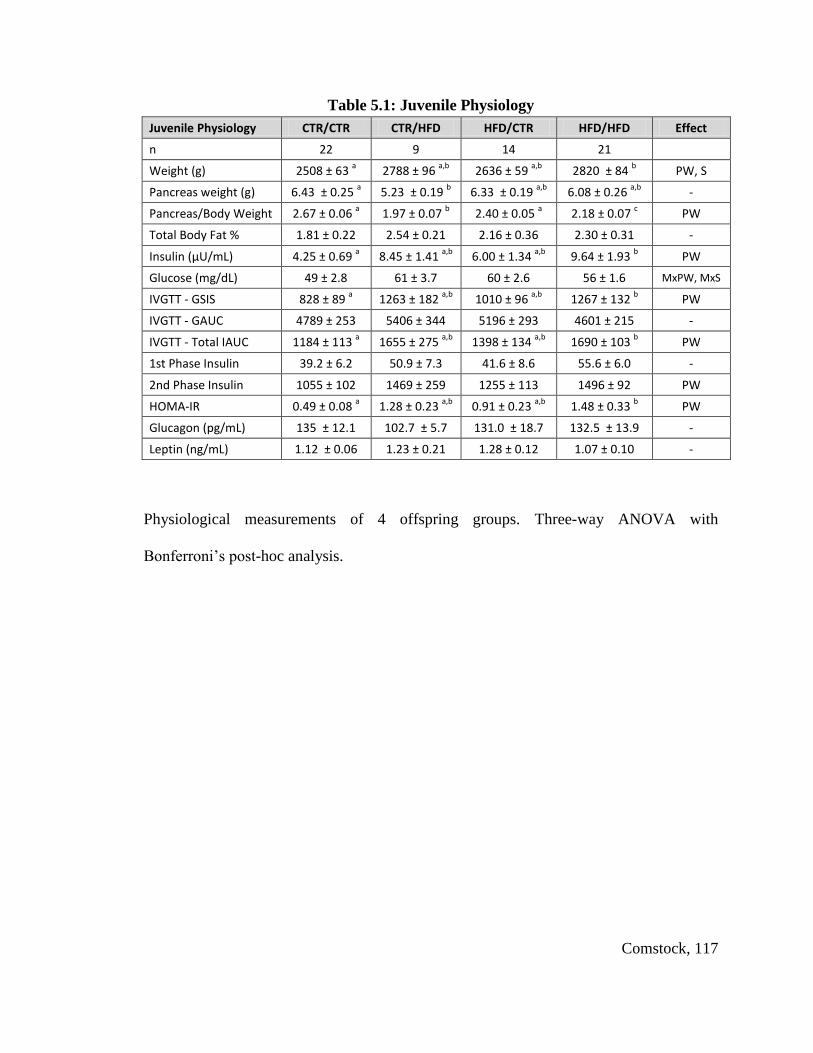
Comstock, 117
Table 5.1: Juvenile Physiology
Juvenile Physiology CTR/CTR CTR/HFD HFD/CTR HFD/HFD Effect
n 22 9 14 21
Weight (g) 2508 ± 63 a 2788 ± 96
a,b 2636 ± 59
a,b 2820 ± 84
b PW, S
Pancreas weight (g) 6.43 ± 0.25 a 5.23 ± 0.19
b 6.33 ± 0.19
a,b 6.08 ± 0.26
a,b -
Pancreas/Body Weight 2.67 ± 0.06 a 1.97 ± 0.07
b 2.40 ± 0.05
a 2.18 ± 0.07
c PW
Total Body Fat % 1.81 ± 0.22 2.54 ± 0.21 2.16 ± 0.36 2.30 ± 0.31 -
Insulin (μU/mL) 4.25 ± 0.69 a 8.45 ± 1.41
a,b 6.00 ± 1.34
a,b 9.64 ± 1.93
b PW
Glucose (mg/dL) 49 ± 2.8 61 ± 3.7 60 ± 2.6 56 ± 1.6 MxPW, MxS
IVGTT - GSIS 828 ± 89 a 1263 ± 182
a,b 1010 ± 96
a,b 1267 ± 132
b PW
IVGTT - GAUC 4789 ± 253 5406 ± 344 5196 ± 293 4601 ± 215 -
IVGTT - Total IAUC 1184 ± 113 a 1655 ± 275
a,b 1398 ± 134
a,b 1690 ± 103
b PW
1st Phase Insulin 39.2 ± 6.2 50.9 ± 7.3 41.6 ± 8.6 55.6 ± 6.0 -
2nd Phase Insulin 1055 ± 102 1469 ± 259 1255 ± 113 1496 ± 92 PW
HOMA-IR 0.49 ± 0.08 a 1.28 ± 0.23
a,b 0.91 ± 0.23
a,b 1.48 ± 0.33
b PW
Glucagon (pg/mL) 135 ± 12.1 102.7 ± 5.7 131.0 ± 18.7 132.5 ± 13.9 -
Leptin (ng/mL) 1.12 ± 0.06 1.23 ± 0.21 1.28 ± 0.12 1.07 ± 0.10 -
Physiological measurements of 4 offspring groups. Three-way ANOVA with
Bonferroni’s post-hoc analysis.
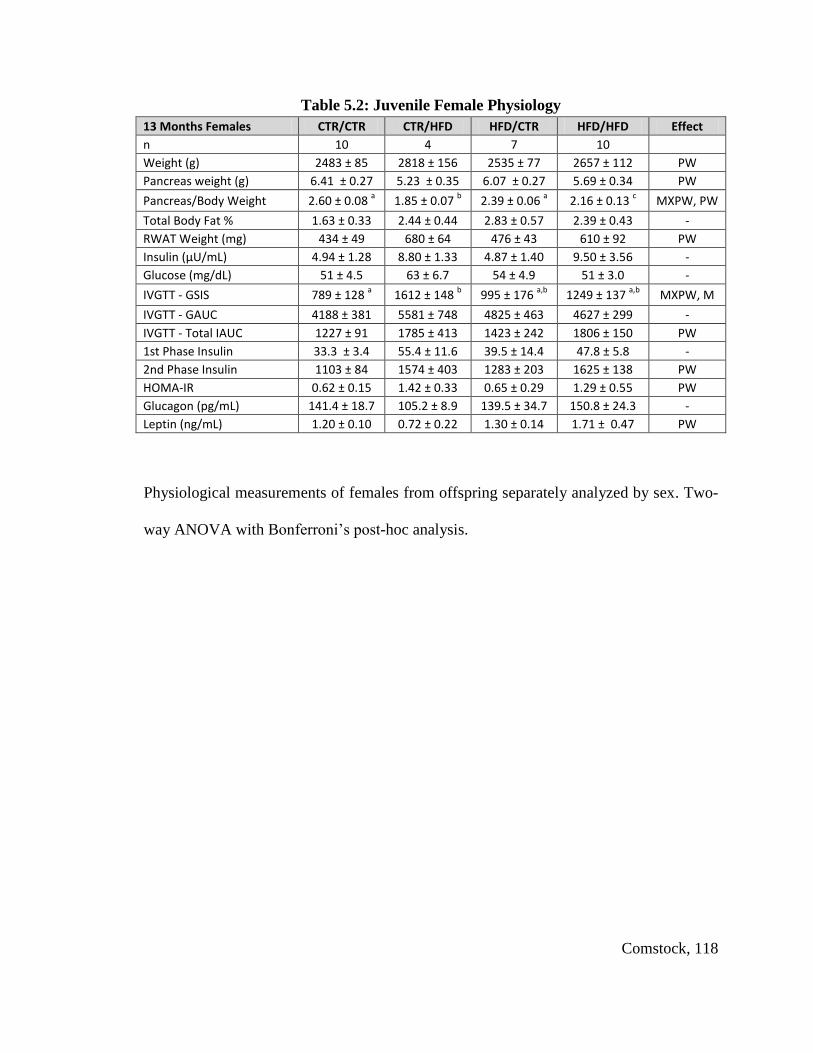
Comstock, 118
Table 5.2: Juvenile Female Physiology
13 Months Females CTR/CTR CTR/HFD HFD/CTR HFD/HFD Effect
n 10 4 7 10
Weight (g) 2483 ± 85 2818 ± 156 2535 ± 77 2657 ± 112 PW
Pancreas weight (g) 6.41 ± 0.27 5.23 ± 0.35 6.07 ± 0.27 5.69 ± 0.34 PW
Pancreas/Body Weight 2.60 ± 0.08 a 1.85 ± 0.07
b 2.39 ± 0.06
a 2.16 ± 0.13
c MXPW, PW
Total Body Fat % 1.63 ± 0.33 2.44 ± 0.44 2.83 ± 0.57 2.39 ± 0.43 -
RWAT Weight (mg) 434 ± 49 680 ± 64 476 ± 43 610 ± 92 PW
Insulin (μU/mL) 4.94 ± 1.28 8.80 ± 1.33 4.87 ± 1.40 9.50 ± 3.56 -
Glucose (mg/dL) 51 ± 4.5 63 ± 6.7 54 ± 4.9 51 ± 3.0 -
IVGTT - GSIS 789 ± 128 a 1612 ± 148
b 995 ± 176
a,b 1249 ± 137
a,b MXPW, M
IVGTT - GAUC 4188 ± 381 5581 ± 748 4825 ± 463 4627 ± 299 -
IVGTT - Total IAUC 1227 ± 91 1785 ± 413 1423 ± 242 1806 ± 150 PW
1st Phase Insulin 33.3 ± 3.4 55.4 ± 11.6 39.5 ± 14.4 47.8 ± 5.8 -
2nd Phase Insulin 1103 ± 84 1574 ± 403 1283 ± 203 1625 ± 138 PW
HOMA-IR 0.62 ± 0.15 1.42 ± 0.33 0.65 ± 0.29 1.29 ± 0.55 PW
Glucagon (pg/mL) 141.4 ± 18.7 105.2 ± 8.9 139.5 ± 34.7 150.8 ± 24.3 -
Leptin (ng/mL) 1.20 ± 0.10 0.72 ± 0.22 1.30 ± 0.14 1.71 ± 0.47 PW
Physiological measurements of females from offspring separately analyzed by sex. Two-
way ANOVA with Bonferroni’s post-hoc analysis.
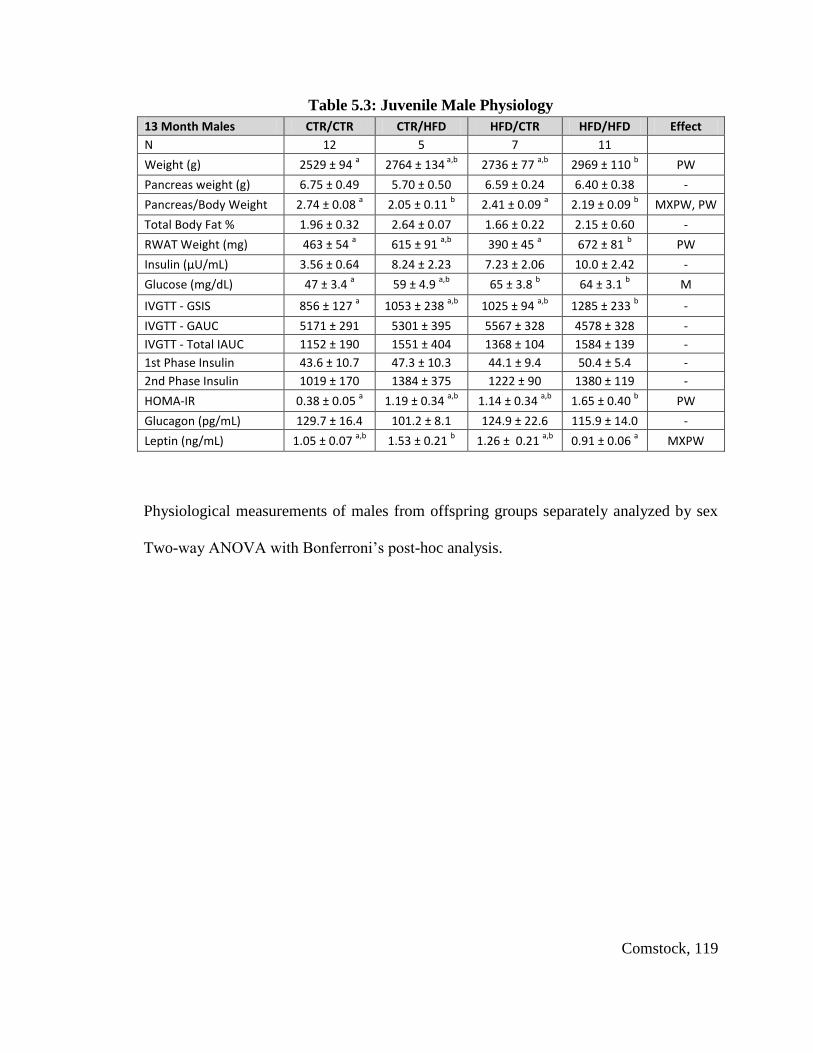
Comstock, 119
Table 5.3: Juvenile Male Physiology
13 Month Males CTR/CTR CTR/HFD HFD/CTR HFD/HFD Effect
N 12 5 7 11
Weight (g) 2529 ± 94 a 2764 ± 134
a,b 2736 ± 77
a,b 2969 ± 110
b PW
Pancreas weight (g) 6.75 ± 0.49 5.70 ± 0.50 6.59 ± 0.24 6.40 ± 0.38 -
Pancreas/Body Weight 2.74 ± 0.08 a 2.05 ± 0.11
b 2.41 ± 0.09
a 2.19 ± 0.09
b MXPW, PW
Total Body Fat % 1.96 ± 0.32 2.64 ± 0.07 1.66 ± 0.22 2.15 ± 0.60 -
RWAT Weight (mg) 463 ± 54 a 615 ± 91
a,b 390 ± 45
a 672 ± 81
b PW
Insulin (μU/mL) 3.56 ± 0.64 8.24 ± 2.23 7.23 ± 2.06 10.0 ± 2.42 -
Glucose (mg/dL) 47 ± 3.4 a 59 ± 4.9
a,b 65 ± 3.8
b 64 ± 3.1
b M
IVGTT - GSIS 856 ± 127 a 1053 ± 238
a,b 1025 ± 94
a,b 1285 ± 233
b -
IVGTT - GAUC 5171 ± 291 5301 ± 395 5567 ± 328 4578 ± 328 -
IVGTT - Total IAUC 1152 ± 190 1551 ± 404 1368 ± 104 1584 ± 139 -
1st Phase Insulin 43.6 ± 10.7 47.3 ± 10.3 44.1 ± 9.4 50.4 ± 5.4 -
2nd Phase Insulin 1019 ± 170 1384 ± 375 1222 ± 90 1380 ± 119 -
HOMA-IR 0.38 ± 0.05 a 1.19 ± 0.34
a,b 1.14 ± 0.34
a,b 1.65 ± 0.40
b PW
Glucagon (pg/mL) 129.7 ± 16.4 101.2 ± 8.1 124.9 ± 22.6 115.9 ± 14.0 -
Leptin (ng/mL) 1.05 ± 0.07 a,b
1.53 ± 0.21 b 1.26 ± 0.21
a,b 0.91 ± 0.06
a MXPW
Physiological measurements of males from offspring groups separately analyzed by sex
Two-way ANOVA with Bonferroni’s post-hoc analysis.
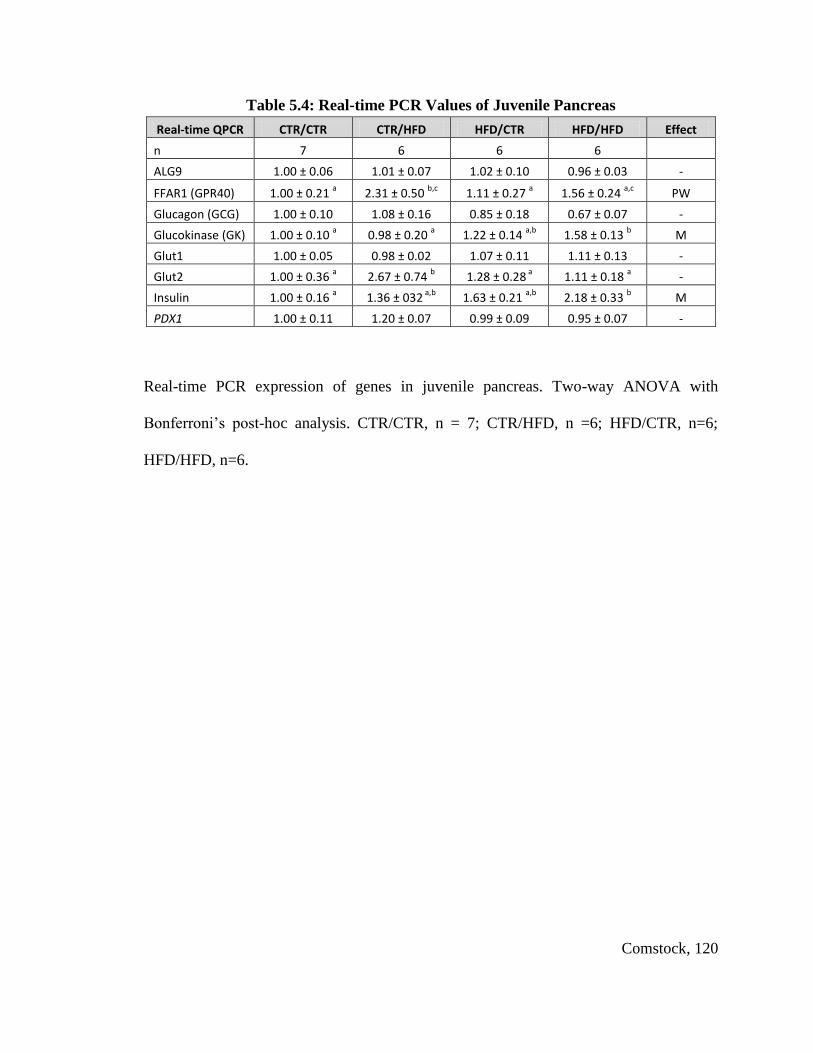
Comstock, 120
Table 5.4: Real-time PCR Values of Juvenile Pancreas
Real-time QPCR CTR/CTR CTR/HFD HFD/CTR HFD/HFD Effect
n 7 6 6 6
ALG9 1.00 ± 0.06 1.01 ± 0.07 1.02 ± 0.10 0.96 ± 0.03 -
FFAR1 (GPR40) 1.00 ± 0.21 a 2.31 ± 0.50
b,c 1.11 ± 0.27
a 1.56 ± 0.24
a,c PW
Glucagon (GCG) 1.00 ± 0.10 1.08 ± 0.16 0.85 ± 0.18 0.67 ± 0.07 -
Glucokinase (GK) 1.00 ± 0.10 a 0.98 ± 0.20
a 1.22 ± 0.14
a,b 1.58 ± 0.13
b M
Glut1 1.00 ± 0.05 0.98 ± 0.02 1.07 ± 0.11 1.11 ± 0.13 -
Glut2 1.00 ± 0.36 a 2.67 ± 0.74
b 1.28 ± 0.28
a 1.11 ± 0.18
a -
Insulin 1.00 ± 0.16 a 1.36 ± 032
a,b 1.63 ± 0.21
a,b 2.18 ± 0.33
b M
PDX1 1.00 ± 0.11 1.20 ± 0.07 0.99 ± 0.09 0.95 ± 0.07 -
Real-time PCR expression of genes in juvenile pancreas. Two-way ANOVA with
Bonferroni’s post-hoc analysis. CTR/CTR, n = 7; CTR/HFD, n =6; HFD/CTR, n=6;
HFD/HFD, n=6.
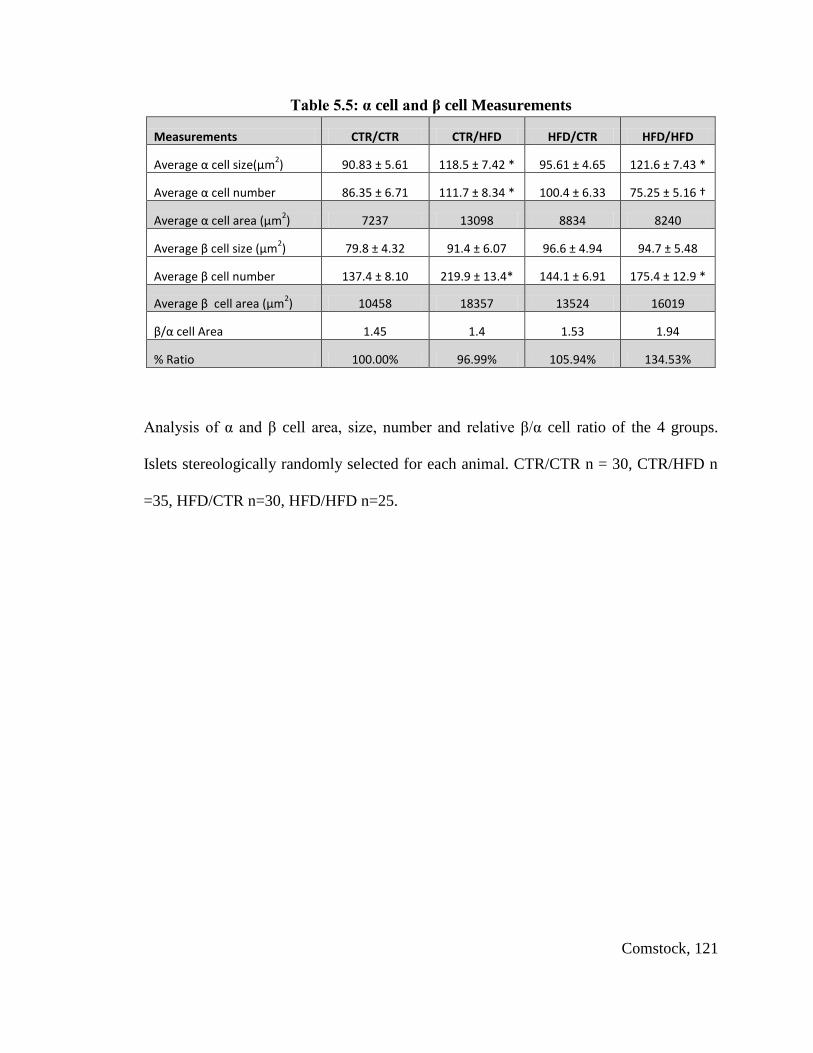
Comstock, 121
Table 5.5: α cell and β cell Measurements
Measurements CTR/CTR CTR/HFD HFD/CTR HFD/HFD
Average α cell size(μm2) 90.83 ± 5.61 118.5 ± 7.42 * 95.61 ± 4.65 121.6 ± 7.43 *
Average α cell number 86.35 ± 6.71 111.7 ± 8.34 * 100.4 ± 6.33 75.25 ± 5.16 †
Average α cell area (μm2) 7237 13098 8834 8240
Average β cell size (μm2) 79.8 ± 4.32 91.4 ± 6.07 96.6 ± 4.94 94.7 ± 5.48
Average β cell number 137.4 ± 8.10 219.9 ± 13.4* 144.1 ± 6.91 175.4 ± 12.9 *
Average β cell area (μm2) 10458 18357 13524 16019
β/α cell Area 1.45 1.4 1.53 1.94
% Ratio 100.00% 96.99% 105.94% 134.53%
Analysis of α and β cell area, size, number and relative β/α cell ratio of the 4 groups.
Islets stereologically randomly selected for each animal. CTR/CTR n = 30, CTR/HFD n
=35, HFD/CTR n=30, HFD/HFD n=25.

Comstock, 122
Chapter 6: Limitations and Future Studies

Comstock, 123
Limitations of the HFD Fed Macaque Model
While the macaque is an excellent animal model to study early MetS and disease
progression to T2DM, it does have some limitations. First, it should be noted that the
cost of this model compared to rodent and sheep models is high, which causes
experimental limits on these studies based on funding. However, since these animals are
so similar to humans in the development of MetS and T2DM, whenever possible it is
essential to design experiments that could be specifically tested in this model. Rodent
studies make an excellent starting point. However, much of the development of the
pancreas and other organs impacted by HFD consumption in the rodent occurs during the
early post-natal period, whereas the monkey and human have similar fetal development
(Aguayo-Mazzucato, Sanchez-Soto, Godinez-Puig, Gutierrez-Ospina, & Hiriart, 2006;
Fowden & Hill, 2001; Remacle, et al., 2007; Scaglia, et al., 1997). The sheep has also
been extensively used in developmental work; however, although these animals have
similar development to humans, they have ruminant digestion and do not process fats
(Oltjen & Beckett, 1996; Sanz Sampelayo, Chilliard, Schmidely, & Boza, 2007).
Therefore, the effects of maternal obesity induced by increased caloric intake can be
studied in fetal offspring, but it is not possible to study the effect of HFD in these
animals. Furthermore, they have a cotyledonary placenta that is very different from the
human and macaque placenta
A second limitation of this model is the time points of animal sacrifice and tissue
collection that we selected. In many rodent models, animals are sacrificed sequentially
throughout HFD exposure at intervals of a few days to a few weeks (Cerf, et al., 2005;
Scaglia, et al., 1997). This allows the investigator to understand sequential development
Comstock, 124
of the conditions that lead to the phenotype studied. We limited collection time points to
the early third trimester and the postnatal 13-month time point, due to limited animal
availability, cost of the animals, and ethical considerations – sacrificing as few animals as
possible to gain the most knowledge. Therefore, reasonable deductions about islet
development were made based on the morphology of islets at the two time points and the
physiological presentation of the animal between those time points. However, the time
points that we chose to characterize are critical for islet development. As a point of
emphasis, it has taken approximately ten years, to produce sufficient offspring to perform
these studies. This leads to a third limitation of the model, which is small sample size.
Sample size within these groups is somewhat limited (n = 9 to 21/group), when compared
to many rodent studies. However, compared to other primate studies (Choi et al., 2011;
de Koning, Bodkin, Hansen, & Clark, 1993), the sample size is relatively robust and it
has sufficient power to determine significant differences between groups. In spite of this
limitation our studies as a whole have identified key insights into the developmental
abnormalities that may contribute to early childhood obesity. In turn, we have increased
the awareness of the complications that may occur in mothers and their offspring who are
obese or consume a HFD during the pregnancy period. The experiments performed in
these animals have already begun to enlighten clinical investigators about the critical
period of development in fetal life and can help them understand how to intervene when
necessary. In addition, by understanding the effects of HFD consumption and obesity on
fetal development, physicians can now aid their patients in implementing lifestyle
changes in order to prevent these effects.

Comstock, 125
Future Study Recommendations
The specific aims of this study were accomplished but also led to many
unanswered questions. First, it is evident that maternal HFD or and/or obesity lead to a
decrease in α cell mass in the fetal animal. However, it is unclear what the maternal
trigger is that produces this: is it hyperinsulinemia, elevated TGs or increased glucose
exposure to the fetus? The cellular mechanisms that lead to the decreased mass of these
cells also need to be uncovered. Likewise, the timing of α cell loss or decreased
neogenesis or replication is not clear: what time point in pregnancy is critical for islet
development? First, in order to determine the mechanisms that lead to the adaptations in
fetal α cells, it will be necessary to establish the standard rate of α cell replication,
neogenesis and apoptosis in CTR fetal animals. By comparing these measures to the HFD
offspring, we can measure how cell cyclicity may be altered. One pilot experiment, in
CTR and HFD animals, performed in the spring of 2011, was intended to measure cell
replication in the fetuses. I gave CTR and HFD dams two thymidine analogs during their
pregnancy. One, 5-iododeoxyuridine (Idu) was administered at the end of the first
trimester, and the other, 5-chlorodeoxyuridine (Cldu), was administered at the end of the
second trimester in each of these animals. The fetal animal was then collected at G130.
These analogs are incorporated into a cell's DNA when the cell is dividing (during the S-
phase of the cell cycle) (Teta, Rankin, Long, Stein, & Kushner, 2007). They can then be
detected by double or triple label immunohistochemistry to determine which cells
underwent replication. While this experiment is still in process, we can use the pancreata
from these animals to determine the number of α or β cells that replicated during these
time periods.

Comstock, 126
In addition, while I have demonstrated a decrease in the α cell mass in the fetal
offspring, the biochemical changes that occur due to a decrease in α cell mass in the fetal
animal should also be measured. By isolating islets we can determine how the relative β
cell to α cell ratio affects islet function. First, I propose that whole islets be isolated from
fetal animals and the basal activity of these islets should be assessed by measuring insulin
and glucagon secretion in basal glucose islet media. This should be followed by
stimulation of islets with glucose, insulin, glucagon and FFAs to determine their relative
reactivity. I would also suggest disassociating islet cells, as previously described (Halban
et al., 1982), and performing similar experiments with varying ratios of β cells and α cell
to determine the effect the ratio of these cells has on secretory ability.
Also, the expression of insulin mRNA was decreased in fetal HFD offspring
which lead to a decrease in β cell insulin secretion, as measured by c-peptide content.
However, the changes demonstrated in other key genes do not always translate into
protein changes. I recommend following these studies with both western blotting and
immunohistochemistry to determine the relative levels of protein. PDX1 mRNA
expression was decreased in the fetal offspring; however, immunohistochemical anaylsis
did not reveal any differences in protein. This indicates that there may be key protein
signaling aspects that are impacted.
The second aim, to characterize the metabolic profile of the infant offspring of
HFD mothers, was accomplished. However, the signaling mechanism that results in
insulin resistance followed by hyperinsulinemia should be elucidated. The changes in
physiological adaptation to the HFD in the post-natal animal could be clarified by
Comstock, 127
performing clamp techniques. A hyperinsulinemic-euglycemic clamp requires a steady
infusion of insulin that retains glucose levels at normal fasting concentrations. This
clamp is intended to suppress hepatic glucose production but also allows determination of
insulin sensitivity of peripheral tissue. The degree of insulin resistance is inversely
related to glucose uptake during this protocol (McAuley et al., 2001). A second clamp
technique, the hyperinsulinemic-hyperglycemic clamp provides a better measure of β cell
function. Glucose concentration is raised above basal levels by a continuous infusion of
glucose then insulin is measured at various time points. Because the plasma glucose
concentration is held constant, the glucose infusion rate is an index of insulin secretion
and glucose metabolism (Bolli et al., 1984). These could be performed in the infant
animal as early as 90 days then followed through at various time points throughout the
first year of life to obtain an accurate indication of insulin sensitivity and β cell function.
Furthermore, based on the results of my third aim, it is clear that significant islet
remodeling is occurring during the post-weaning period. However, the time period of
these changes and the specific physiological triggers are still unclear. The thymidine
labeling protocol would be beneficial to elucidate the time period of islet changes during
postnatal development. By administering the two different thymidine analogs at different
time points before and after weaning, we may be able to target key stages of islet
development. β cell replication is likely a significant contributor to the changes observed
in insulin secretion in juvenile animal. These studies would allow us to determine what
changes are occurring during these key developmental periods. In addition to replication,
neogenesis and apoptosis are also likely contributors to the islet remodeling evident in the
juvenile animals. One marker of islet neogensis, which has been associated with β cell

Comstock, 128
mass expansion is the islet neogenesis associated protein related protein (INGAP)
(Rosenberg et al., 2004). Detection of this protein by immunohistochemistry would
provide some indication of the neogenesis that is occurring during the post-natal period.
Another protein, Ki67, is detectable in all cell types during active phases of the cell cycle
(G1, S, G2, and mitosis), but is absent from resting cells (G0) (Scholzen & Gerdes,
2000). Immuno-detection of this protein would indicate which cells are proliferating.
Co-localization of the Ki67 antibody with an INGAP antibody and a islet cell specific
antibody, would lead to clarification of which cell types are undergoing neogenesis,
replication or are static. A TUNEL (Terminal deoxynucleotidyl transferase dUTP nick
end labeling) stain, which detects DNA fragmentation, would establish the relative level
of apoptosis during the juvenile period (Gavrieli, Sherman, & Ben-Sasson, 1992).
Finally, since, it is evident that there are different mechanisms that lead to islet
expansion in the CTR/HFD versus the HFD/HFD offspring, the means by which the
differential islet effects occur should be studied in the post-weaned animal. Islet
isolation studies would be beneficial in the juvenile animals to determine how the
changes in islets effect function. In order to determine the mechanisms that lead to islet
response in these animals, I suggest stimulating islets with glucose, insulin, glucagon and
FFAs and determining the relative gene expression differences between the stimulated
and basally active islets. Key genes of interest would be those that were already
measured, including insulin, glucagon, GK, GLUT2, Kir6.2, SUR1, and FFAR1.
GLUT5, which is the glucose transporter in α cells (Sato et al., 1996), would also be of
critical importance. Since many of the gene expression differences in the juvenile
animals were inconclusive, I recommend following up on these studies by determining

Comstock, 129
the relative level of protein expression of the key genes examined within specific islet
cells. Triple label immunohistochemistry with anti-insulin, anti-glucagon and a third
antibody against the protein of interest would be necessary. Then sterological analysis of
islet cell specificity would be required.

Comstock, 130
Chapter 7: Summary and Discussion
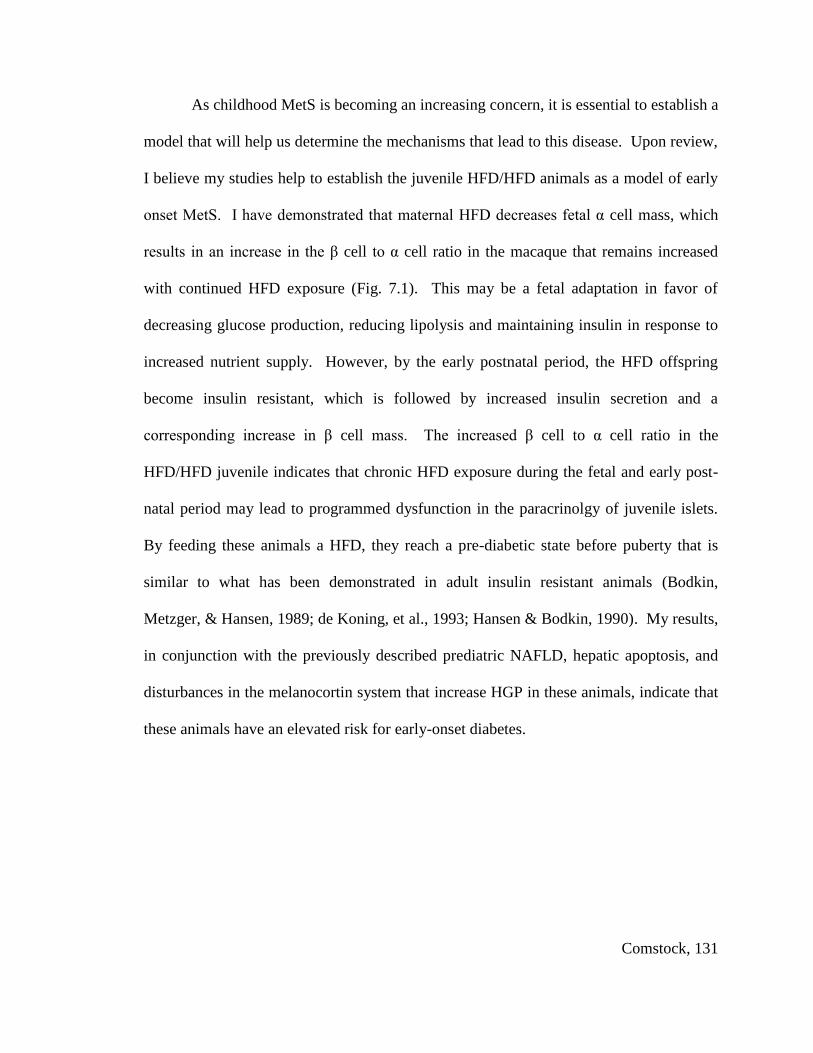
Comstock, 131
As childhood MetS is becoming an increasing concern, it is essential to establish a
model that will help us determine the mechanisms that lead to this disease. Upon review,
I believe my studies help to establish the juvenile HFD/HFD animals as a model of early
onset MetS. I have demonstrated that maternal HFD decreases fetal α cell mass, which
results in an increase in the β cell to α cell ratio in the macaque that remains increased
with continued HFD exposure (Fig. 7.1). This may be a fetal adaptation in favor of
decreasing glucose production, reducing lipolysis and maintaining insulin in response to
increased nutrient supply. However, by the early postnatal period, the HFD offspring
become insulin resistant, which is followed by increased insulin secretion and a
corresponding increase in β cell mass. The increased β cell to α cell ratio in the
HFD/HFD juvenile indicates that chronic HFD exposure during the fetal and early post-
natal period may lead to programmed dysfunction in the paracrinolgy of juvenile islets.
By feeding these animals a HFD, they reach a pre-diabetic state before puberty that is
similar to what has been demonstrated in adult insulin resistant animals (Bodkin,
Metzger, & Hansen, 1989; de Koning, et al., 1993; Hansen & Bodkin, 1990). My results,
in conjunction with the previously described prediatric NAFLD, hepatic apoptosis, and
disturbances in the melanocortin system that increase HGP in these animals, indicate that
these animals have an elevated risk for early-onset diabetes.

Comstock, 132
Fetal Effects of the Maternal HFD
Epidemiological and animal studies demonstrate an association between
childhood obesity and maternal obesity and/or high-fat/high calorie intake (Boney, et al.,
2005; Srinivasan, et al., 2006; Whitaker, 2004). However, while the phenotype of the
HFD macaque dams varies significantly, maternal sensitivity to weight gain had little
effect on islet morphology or glucoregulatory function in the offspring. In fact, maternal
HFD consumption was demonstrated to be the principal contributing factor to islet
defects in the fetal offspring, indicating that maternal diet choices may program fetal
susceptibility to islet malfunction.
The decreased α cell mass is a novel finding in fetal offspring of HFD mothers
that may be detrimental to long term islet function, because the paracrine interactions
between α cell and β cells are essential for glucose homeostasis. Glucagon secretion
decreases when circulating glucose levels rise. However, glucose does not have a direct
inhibitory effect on α cells, since glucose is an essential fuel source that is used in ATP
production in α cells. In fact, isolated α cells secrete glucagon in response to glucose
when they are disassociated from β cells and lack the paracrine interaction of these cells
(Franklin, et al., 2005). However, it has been demonstrated the α cell contains an
abundance of insulin receptors and recent findings have shown that insulin inhibits
glucagon release from these cells. While α cell stimulatory pathways are still largely
uncharacterized, it is evident that insulin and other β cell secretory products lead to
increased sensitivity of KATP channels, which results in α cell hyperpolarization and an
inhibition of glucagon secretion (Leung, et al., 2006). These studies indicate that the
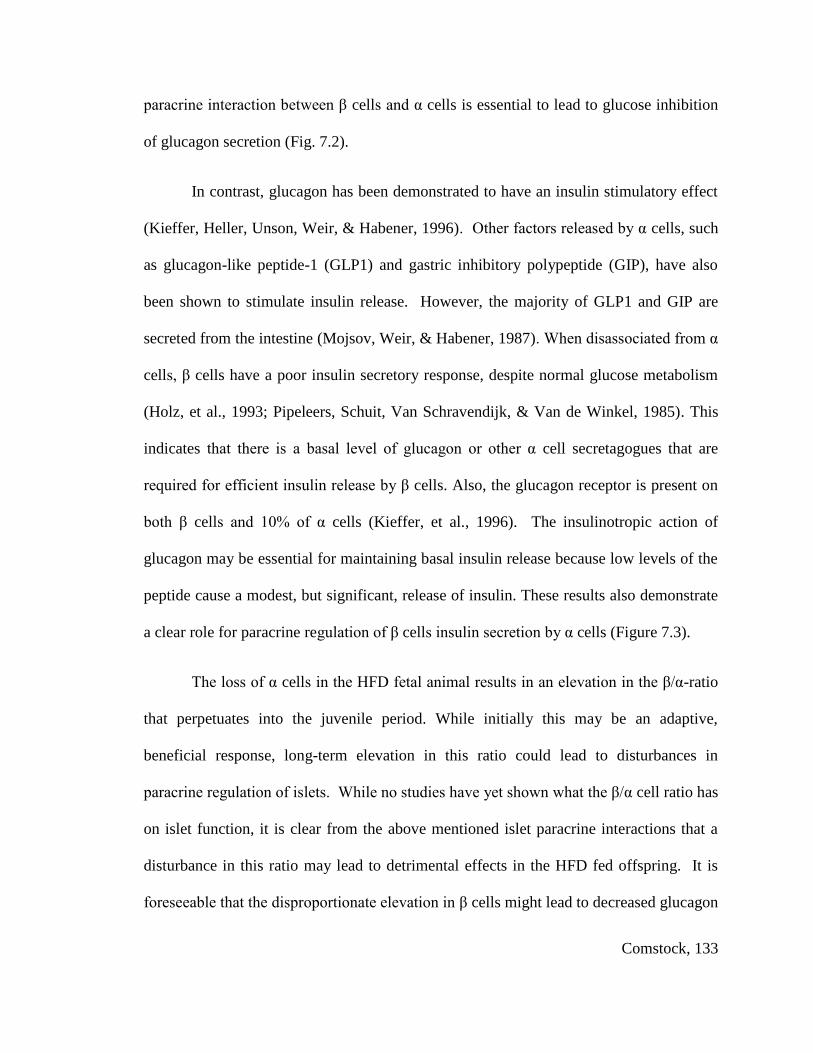
Comstock, 133
paracrine interaction between β cells and α cells is essential to lead to glucose inhibition
of glucagon secretion (Fig. 7.2).
In contrast, glucagon has been demonstrated to have an insulin stimulatory effect
(Kieffer, Heller, Unson, Weir, & Habener, 1996). Other factors released by α cells, such
as glucagon-like peptide-1 (GLP1) and gastric inhibitory polypeptide (GIP), have also
been shown to stimulate insulin release. However, the majority of GLP1 and GIP are
secreted from the intestine (Mojsov, Weir, & Habener, 1987). When disassociated from α
cells, β cells have a poor insulin secretory response, despite normal glucose metabolism
(Holz, et al., 1993; Pipeleers, Schuit, Van Schravendijk, & Van de Winkel, 1985). This
indicates that there is a basal level of glucagon or other α cell secretagogues that are
required for efficient insulin release by β cells. Also, the glucagon receptor is present on
both β cells and 10% of α cells (Kieffer, et al., 1996). The insulinotropic action of
glucagon may be essential for maintaining basal insulin release because low levels of the
peptide cause a modest, but significant, release of insulin. These results also demonstrate
a clear role for paracrine regulation of β cells insulin secretion by α cells (Figure 7.3).
The loss of α cells in the HFD fetal animal results in an elevation in the β/α-ratio
that perpetuates into the juvenile period. While initially this may be an adaptive,
beneficial response, long-term elevation in this ratio could lead to disturbances in
paracrine regulation of islets. While no studies have yet shown what the β/α cell ratio has
on islet function, it is clear from the above mentioned islet paracrine interactions that a
disturbance in this ratio may lead to detrimental effects in the HFD fed offspring. It is
foreseeable that the disproportionate elevation in β cells might lead to decreased glucagon

Comstock, 134
potentiation of insulin release and inefficient insulin secretion, which is often develops in
T2DM.

Comstock, 135
Post-natal Effects of the HFD
The post-natal HFD further exacerbates the effects I demonstrated in the HFD
fetus. However, in order to determine the severity of islet defects in these animals, it is
necessary to compare these effects to typical T2DM progression. The progression of this
disease occurs due to interplay between insulin resistance and defects in insulin secretion
that ultimately leads to impaired glucose tolerance (Fig. 7.4). However, during the initial
stages of the disease process, fasting insulin levels and glucose-stimulated insulin
secretion are sufficient to maintain normoglycemia. As the disease progresses, insulin
resistance occurs, due to contributing environmental factors, such as obesity, HFD
consumption, genetic susceptibility or early-life programming effects (Erlich et al., 1993;
Hales & Barker, 1992; Hancock et al., 2008; B. B. Kahn & Flier, 2000; Srinivasan et al.,
2005). Since MetS is associated with insulin resistance and obesity, MetS often develops
in subjects as a precursor to T2DM. At this stage, β cells compensate by secreting more
insulin and β cell mass usually expands in response to the increased need for insulin
production and thus normoglycemia is maintained. However, β cell compensation
eventually becomes insufficient to match insulin resistance and subjects develop impaired
glucose tolerance that ultimately results in persistent hyperglycemia (Augstein &
Salzsieder, 2009; Paulsen et al., 2010). This hyperglycemia has also been demonstrated
to correspond to excessive glucagon stimulation of hepatic gluconeogenesis. Ultimately,
in some subjects, insulin compensation declines as a result of either defective β cell
function or a loss of β cells (Jurgens et al., 2011; Maedler & Donath, 2004).
In comparison, both the CTR/HFD and HFD/HFD have increased β cell mass
and elevated insulin secretion that are characteristic of the initial stages of disease

Comstock, 136
progression, indicating that early post-natal HFD diet consumption significantly increases
MetS risk. In fact, in other NHP models, insulin resistance and other MetS-like effects
do not occur until at least three years of age (Choi, et al., 2011; Guardado-Mendoza et al.,
2009; Kaufman, et al., 2005), but the typical onset of this disease is during middle age
(15 to 20 years of age) (de Koning, et al., 1993). This suggests that HFD consumption
accelerates the development of this disease in juvenile macaques. However, while both
the CTR/HFD and HFD/HFD juveniles have increased β cell mass and elevated insulin
levels, maternal HFD programs the juveniles for excessive β cell hypersecretion. This is
evidenced by the fact that both the HFD/CTR and the HFD/HFD offspring have elevated
insulin gene transcription. In addition, the β cell hyper-responsiveness that is clearly
evident in only the HFD/HFD offspring indicates that maternal HFD accelerates disease
progression in these animals. The effect may be due to length of exposure to the HFD
since the CTR/HFD offspring have only consumed the diet for 5 months. However, the
maintenance of the elevated β cell to α cell ratio only in the HFD/HFD juvenile indicates
that maternal programming and post-weaning consumption produce a synergistic effect.
It should be noted that juvenile offspring are still immature and many effects of
the post-weaning diet may also program these animals for metabolic dysfunction later in
life. It will be necessary to follow these animals to adulthood to determine if maternal
HFD consumption increases the incidence of obesity and T2DM in these offspring.
Likewise, by placing both the CTR/CTR and the HFD/CTR animals onto a HFD as
adults, we will be able to measure the relative impact of the maternal programming effect
on the adult obesity onset which is so common in the world today.

Comstock, 137
In conclusion, my studies, in concert with the in-depth characterization of these
animals by other researchers my lab, have demonstrated an increased risk for MetS and
T2DM in the HFD/HFD offspring. The findings are most representative of the human
population today because mothers who consume a high-fat or high-calorie diet will
continue to feed their children a similar diet (Clark, Goyder, Bissell, Blank, & Peters,
2007; Johannsen, Johannsen, & Specker, 2006; Spruijt-Metz, Lindquist, Birch, Fisher, &
Goran, 2002). The evidence that maternal HFD consumption results in islet
abnormalities that are intensified by post-natal HFD consumption indicates that the early
nutritional environment is a significant contributor to increase in MetS. These studies
provide unique insight into the pathways that may be leading to the increase in pediatric
MetS today.

Comstock, 138
Chapter 7 Figures
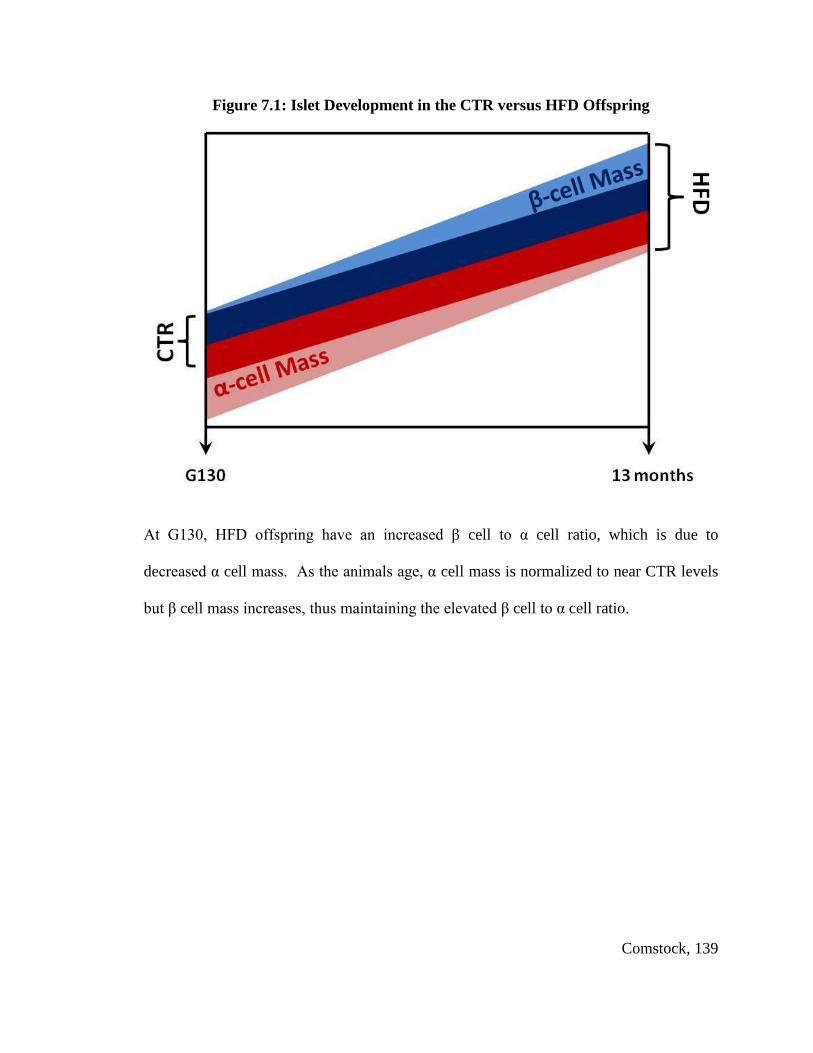
Comstock, 139
Figure 7.1: Islet Development in the CTR versus HFD Offspring
At G130, HFD offspring have an increased β cell to α cell ratio, which is due to
decreased α cell mass. As the animals age, α cell mass is normalized to near CTR levels
but β cell mass increases, thus maintaining the elevated β cell to α cell ratio.

Comstock, 140
Figure 7.2: Islet Paracrine Function – Glucagon Regulation of Insulin Secretion
Glucose is transported into the NHP β cell by GLUT2 and into α cells by GLUT5.
GLUT5 has a much lower binding affinity than GLUT2 for glucose, therefore more
glucose is taken up by the β cell. Insulin is released from the β cell in response to high
glucose. Insulin signaling via the insulin receptor leads to a sensitization of -ATP
channels in α cells. This leads to reduced glucagon secretion, because much more
glucose is required to produce a sufficiently elevated ATP/ADP ratio that will depolarize
the α cell membrane and lead to glucagon exocytosis. However, a basal level of glucagon
is maintained within the intra-islet space as well as within circulation. Insulin also
desensitizes KATP channels on β cells which augments insulin secretion. (IR = insulin
receptor).
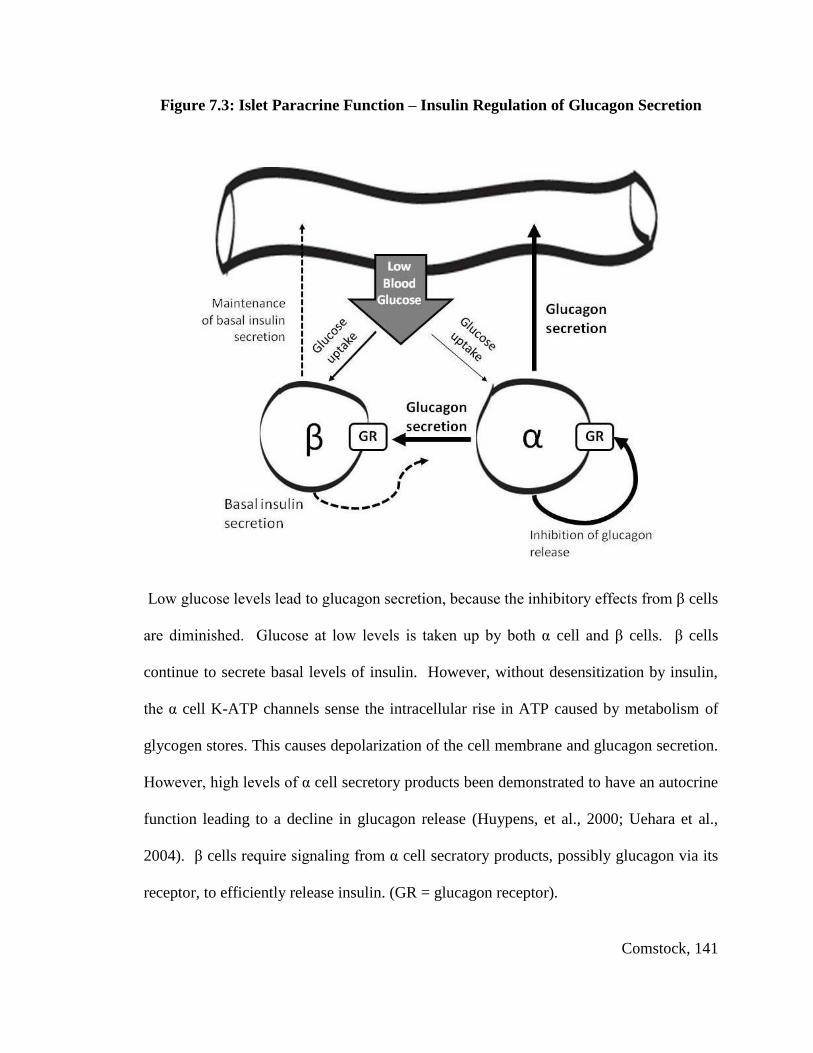
Comstock, 141
Figure 7.3: Islet Paracrine Function – Insulin Regulation of Glucagon Secretion
Low glucose levels lead to glucagon secretion, because the inhibitory effects from β cells
are diminished. Glucose at low levels is taken up by both α cell and β cells. β cells
continue to secrete basal levels of insulin. However, without desensitization by insulin,
the α cell K-ATP channels sense the intracellular rise in ATP caused by metabolism of
glycogen stores. This causes depolarization of the cell membrane and glucagon secretion.
However, high levels of α cell secretory products been demonstrated to have an autocrine
function leading to a decline in glucagon release (Huypens, et al., 2000; Uehara et al.,
2004). β cells require signaling from α cell secratory products, possibly glucagon via its
receptor, to efficiently release insulin. (GR = glucagon receptor).
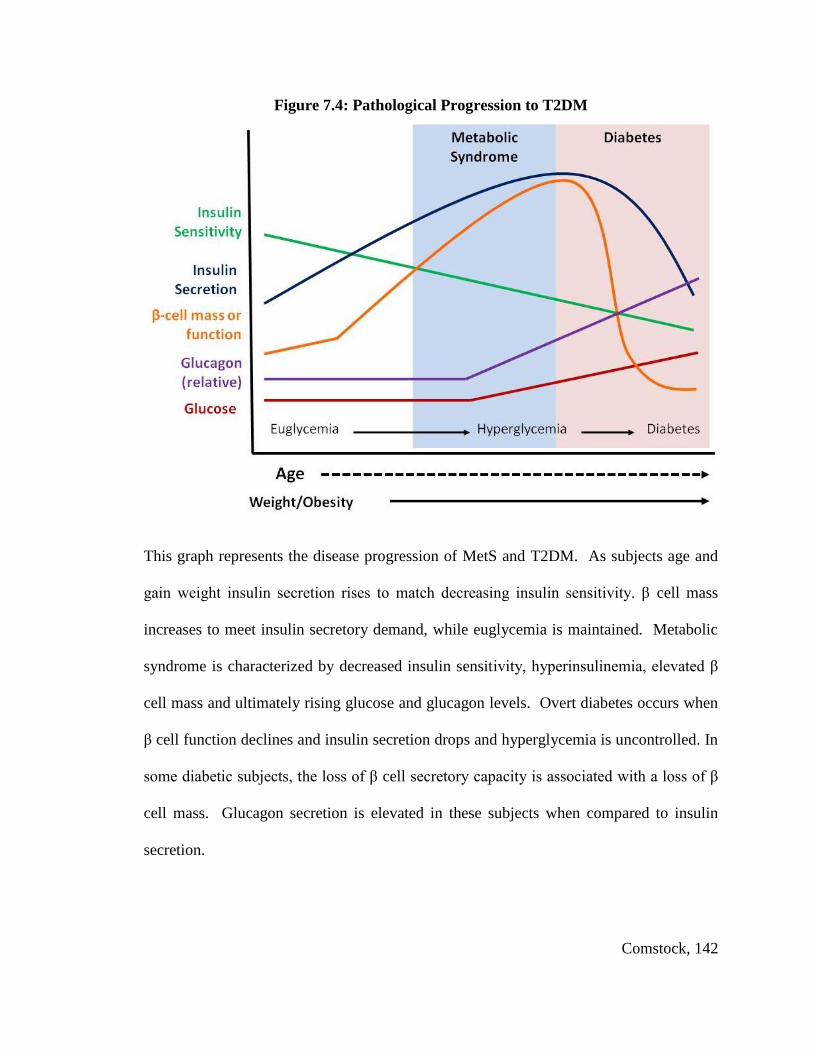
Comstock, 142
Figure 7.4: Pathological Progression to T2DM
This graph represents the disease progression of MetS and T2DM. As subjects age and
gain weight insulin secretion rises to match decreasing insulin sensitivity. β cell mass
increases to meet insulin secretory demand, while euglycemia is maintained. Metabolic
syndrome is characterized by decreased insulin sensitivity, hyperinsulinemia, elevated β
cell mass and ultimately rising glucose and glucagon levels. Overt diabetes occurs when
β cell function declines and insulin secretion drops and hyperglycemia is uncontrolled. In
some diabetic subjects, the loss of β cell secretory capacity is associated with a loss of β
cell mass. Glucagon secretion is elevated in these subjects when compared to insulin
secretion.

Comstock, 143
Works Cited

Comstock, 144
Aguayo-Mazzucato, C., Sanchez-Soto, C., Godinez-Puig, V., Gutierrez-Ospina, G., &
Hiriart, M. (2006). Restructuring of pancreatic islets and insulin secretion in a
postnatal critical window. PLoS One, 1, e35. doi: 10.1371/journal.pone.0000035
Ahlgren, U., Jonsson, J., Jonsson, L., Simu, K., & Edlund, H. (1998). beta-cell-specific
inactivation of the mouse Ipf1/Pdx1 gene results in loss of the beta-cell phenotype
and maturity onset diabetes. Genes Dev, 12(12), 1763-1768.
Alberti, K. G., Eckel, R. H., Grundy, S. M., Zimmet, P. Z., Cleeman, J. I., Donato, K. A.,
et al. (2009). Harmonizing the metabolic syndrome: a joint interim statement of
the International Diabetes Federation Task Force on Epidemiology and
Prevention; National Heart, Lung, and Blood Institute; American Heart
Association; World Heart Federation; International Atherosclerosis Society; and
International Association for the Study of Obesity. Circulation, 120(16), 1640-
1645. doi: CIRCULATIONAHA.109.192644 [pii]
10.1161/CIRCULATIONAHA.109.192644
Augstein, P., & Salzsieder, E. (2009). Morphology of pancreatic islets: a time course of
pre-diabetes in Zucker fatty rats. Methods Mol Biol, 560, 159-189. doi:
10.1007/978-1-59745-448-3_12
Barker, D. J. (1995). The fetal and infant origins of disease. Eur J Clin Invest, 25(7), 457-
463.
Barker, D. J., Gluckman, P. D., Godfrey, K. M., Harding, J. E., Owens, J. A., &
Robinson, J. S. (1993). Fetal nutrition and cardiovascular disease in adult life.
Lancet, 341(8850), 938-941. doi: 0140-6736(93)91224-A [pii]
Barker, D. J., Winter, P. D., Osmond, C., Margetts, B., & Simmonds, S. J. (1989).
Weight in infancy and death from ischaemic heart disease. Lancet, 2(8663), 577-
580. doi: S0140-6736(89)90710-1 [pii]
Bayol, S. A., Simbi, B. H., & Stickland, N. C. (2005). A maternal cafeteria diet during
gestation and lactation promotes adiposity and impairs skeletal muscle
development and metabolism in rat offspring at weaning. J Physiol, 567(Pt 3),
951-961. doi: jphysiol.2005.088989 [pii]
10.1113/jphysiol.2005.088989
Benoit, S. C., Air, E. L., Coolen, L. M., Strauss, R., Jackman, A., Clegg, D. J., et al.
(2002). The catabolic action of insulin in the brain is mediated by melanocortins.
J Neurosci, 22(20), 9048-9052. doi: 22/20/9048 [pii]
Beringue, F., Blondeau, B., Castellotti, M. C., Breant, B., Czernichow, P., & Polak, M.
(2002). Endocrine pancreas development in growth-retarded human fetuses.
Diabetes, 51(2), 385-391.
Bertin, E., Gangnerau, M. N., Bellon, G., Bailbe, D., Arbelot De Vacqueur, A., & Portha,
B. (2002). Development of beta-cell mass in fetuses of rats deprived of protein
and/or energy in last trimester of pregnancy. Am J Physiol Regul Integr Comp
Physiol, 283(3), R623-630. doi: 10.1152/ajpregu.00037.2002
Bodkin, N. L., Metzger, B. L., & Hansen, B. C. (1989). Hepatic glucose production and
insulin sensitivity preceding diabetes in monkeys. Am J Physiol, 256(5 Pt 1),
E676-681.
Bolli, G., De Feo, P., Perriello, G., De Cosmo, S., Compagnucci, P., Santeusanio, F., et
al. (1984). Mechanisms of glucagon secretion during insulin-induced
Comstock, 145
hypoglycemia in man. Role of the beta cell and arterial hyperinsulinemia. J Clin
Invest, 73(4), 917-922. doi: 10.1172/JCI111315
Boney, C. M., Verma, A., Tucker, R., & Vohr, B. R. (2005). Metabolic syndrome in
childhood: association with birth weight, maternal obesity, and gestational
diabetes mellitus. Pediatrics, 115(3), e290-296. doi: 115/3/e290 [pii]
10.1542/peds.2004-1808
Bonner-Weir, S. (2001). beta-cell turnover: its assessment and implications. Diabetes, 50
Suppl 1, S20-24.
Bonora, E., Targher, G., Alberiche, M., Bonadonna, R. C., Saggiani, F., Zenere, M. B., et
al. (2000). Homeostasis model assessment closely mirrors the glucose clamp
technique in the assessment of insulin sensitivity: studies in subjects with various
degrees of glucose tolerance and insulin sensitivity. Diabetes Care, 23(1), 57-63.
Briscoe, C. P., Tadayyon, M., Andrews, J. L., Benson, W. G., Chambers, J. K., Eilert, M.
M., et al. (2003). The orphan G protein-coupled receptor GPR40 is activated by
medium and long chain fatty acids. J Biol Chem, 278(13), 11303-11311. doi:
10.1074/jbc.M211495200
M211495200 [pii]
Brissova, M., Fowler, M. J., Nicholson, W. E., Chu, A., Hirshberg, B., Harlan, D. M., et
al. (2005). Assessment of human pancreatic islet architecture and composition by
laser scanning confocal microscopy. J Histochem Cytochem, 53(9), 1087-1097.
doi: jhc.5C6684.2005 [pii]
10.1369/jhc.5C6684.2005
Brissova, M., Shiota, M., Nicholson, W. E., Gannon, M., Knobel, S. M., Piston, D. W., et
al. (2002). Reduction in pancreatic transcription factor PDX-1 impairs glucose-
stimulated insulin secretion. J Biol Chem, 277(13), 11225-11232. doi:
10.1074/jbc.M111272200
M111272200 [pii]
Buckley, A. J., Keseru, B., Briody, J., Thompson, M., Ozanne, S. E., & Thompson, C. H.
(2005). Altered body composition and metabolism in the male offspring of high
fat-fed rats. Metabolism, 54(4), 500-507. doi: S0026049504004275 [pii]
10.1016/j.metabol.2004.11.003
Burton, B. T., Foster, W. R., Hirsch, J., & Van Itallie, T. B. (1985). Health implications
of obesity: an NIH Consensus Development Conference. Int J Obes, 9(3), 155-
170.
Buteau, J., Roduit, R., Susini, S., & Prentki, M. (1999). Glucagon-like peptide-1
promotes DNA synthesis, activates phosphatidylinositol 3-kinase and increases
transcription factor pancreatic and duodenal homeobox gene 1 (PDX-1) DNA
binding activity in beta (INS-1)-cells. Diabetologia, 42(7), 856-864. doi:
10.1007/s001250051238
Butler, A. E., Cao-Minh, L., Galasso, R., Rizza, R. A., Corradin, A., Cobelli, C., et al.
(2010). Adaptive changes in pancreatic beta cell fractional area and beta cell
turnover in human pregnancy. Diabetologia, 53(10), 2167-2176. doi:
10.1007/s00125-010-1809-6
Comstock, 146
Butler, A. E., Janson, J., Bonner-Weir, S., Ritzel, R., Rizza, R. A., & Butler, P. C. (2003).
Beta-cell deficit and increased beta-cell apoptosis in humans with type 2 diabetes.
Diabetes, 52(1), 102-110.
Cabrera, O., Berman, D. M., Kenyon, N. S., Ricordi, C., Berggren, P. O., & Caicedo, A.
(2006). The unique cytoarchitecture of human pancreatic islets has implications
for islet cell function. Proc Natl Acad Sci U S A, 103(7), 2334-2339. doi:
0510790103 [pii]
10.1073/pnas.0510790103
Carriere, F., Barrowman, J. A., Verger, R., & Laugier, R. (1993). Secretion and
contribution to lipolysis of gastric and pancreatic lipases during a test meal in
humans. Gastroenterology, 105(3), 876-888. doi: S0016508593002999 [pii]
Cattaneo, A., Monasta, L., Stamatakis, E., Lioret, S., Castetbon, K., Frenken, F., et al.
(2010). Overweight and obesity in infants and pre-school children in the European
Union: a review of existing data. Obes Rev, 11(5), 389-398. doi: OBR639 [pii]
10.1111/j.1467-789X.2009.00639.x
Celermajer, D. S., Sorensen, K. E., Bull, C., Robinson, J., & Deanfield, J. E. (1994).
Endothelium-dependent dilation in the systemic arteries of asymptomatic subjects
relates to coronary risk factors and their interaction. J Am Coll Cardiol, 24(6),
1468-1474. doi: 0735-1097(94)90141-4 [pii]
Cerf, M. E., Muller, C. J., Du Toit, D. F., Louw, J., & Wolfe-Coote, S. A. (2006).
Hyperglycaemia and reduced glucokinase expression in weanling offspring from
dams maintained on a high-fat diet. Br J Nutr, 95(2), 391-396. doi:
S0007114506000523 [pii]
Cerf, M. E., Williams, K., Nkomo, X. I., Muller, C. J., Du Toit, D. F., Louw, J., et al.
(2005). Islet cell response in the neonatal rat after exposure to a high-fat diet
during pregnancy. Am J Physiol Regul Integr Comp Physiol, 288(5), R1122-1128.
doi: 00335.2004 [pii]
10.1152/ajpregu.00335.2004
Chakravarty, K., Cassuto, H., Reshef, L., & Hanson, R. W. (2005). Factors that control
the tissue-specific transcription of the gene for phosphoenolpyruvate
carboxykinase-C. Crit Rev Biochem Mol Biol, 40(3), 129-154. doi: 40/3/129 [pii]
10.1080/10409230590935479
Chen, H., Simar, D., Lambert, K., Mercier, J., & Morris, M. J. (2008). Maternal and
postnatal overnutrition differentially impact appetite regulators and fuel
metabolism. Endocrinology, 149(11), 5348-5356. doi: en.2008-0582 [pii]
10.1210/en.2008-0582
Chen, Y. D., Golay, A., Swislocki, A. L., & Reaven, G. M. (1987). Resistance to insulin
suppression of plasma free fatty acid concentrations and insulin stimulation of
glucose uptake in noninsulin-dependent diabetes mellitus. J Clin Endocrinol
Metab, 64(1), 17-21.
Choi, J., Li, C., McDonald, T. J., Comuzzie, A., Mattern, V., & Nathanielsz, P. W.
(2011). Emergence of insulin resistance in juvenile baboon offspring of mothers
exposed to moderate maternal nutrient reduction. Am J Physiol Regul Integr
Comp Physiol, 301(3), R757-762. doi: ajpregu.00051.2011 [pii]
10.1152/ajpregu.00051.2011

Comstock, 147
Clark, H. R., Goyder, E., Bissell, P., Blank, L., & Peters, J. (2007). How do parents'
child-feeding behaviours influence child weight? Implications for childhood
obesity policy. J Public Health (Oxf), 29(2), 132-141. doi: fdm012 [pii]
10.1093/pubmed/fdm012
Comstock, S. M. (2012). High fat diet during perinatal development reduces α-cell mass
and leads to early insulin resistance in the infantile nonhuman primate.
Consoli, A., Nurjhan, N., Capani, F., & Gerich, J. (1989). Predominant role of
gluconeogenesis in increased hepatic glucose production in NIDDM. Diabetes,
38(5), 550-557.
Cook, S., Weitzman, M., Auinger, P., Nguyen, M., & Dietz, W. H. (2003). Prevalence of
a metabolic syndrome phenotype in adolescents: findings from the third National
Health and Nutrition Examination Survey, 1988-1994. Arch Pediatr Adolesc Med,
157(8), 821-827. doi: 10.1001/archpedi.157.8.821
157/8/821 [pii]
Cushman, S. W., & Wardzala, L. J. (1980). Potential mechanism of insulin action on
glucose transport in the isolated rat adipose cell. Apparent translocation of
intracellular transport systems to the plasma membrane. J Biol Chem, 255(10),
4758-4762.
Cusi, K., Kashyap, S., Gastaldelli, A., Bajaj, M., & Cersosimo, E. (2007). Effects on
insulin secretion and insulin action of a 48-h reduction of plasma free fatty acids
with acipimox in nondiabetic subjects genetically predisposed to type 2 diabetes.
Am J Physiol Endocrinol Metab, 292(6), E1775-1781. doi: 00624.2006 [pii]
10.1152/ajpendo.00624.2006
Dahri, S., Snoeck, A., Reusens-Billen, B., Remacle, C., & Hoet, J. J. (1991). Islet
function in offspring of mothers on low-protein diet during gestation. Diabetes,
40 Suppl 2, 115-120.
Darp, R. A., de Boo, H. A., Phua, H. H., Oliver, M. H., Derraik, J. G., Harding, J. E., et
al. (2010). Differential regulation of igf1 and igf1r mRNA levels in the two
hepatic lobes following intrauterine growth restriction and its treatment with intra-
amniotic insulin-like growth factor-1 in ovine fetuses. Reprod Fertil Dev, 22(8),
1188-1197. doi: RD09292 [pii]
10.1071/RD09292
de Koning, E. J., Bodkin, N. L., Hansen, B. C., & Clark, A. (1993). Diabetes mellitus in
Macaca mulatta monkeys is characterised by islet amyloidosis and reduction in
beta-cell population. Diabetologia, 36(5), 378-384.
De Vos, A., Heimberg, H., Quartier, E., Huypens, P., Bouwens, L., Pipeleers, D., et al.
(1995). Human and rat beta cells differ in glucose transporter but not in
glucokinase gene expression. J Clin Invest, 96(5), 2489-2495.
Del Guerra, S., Bugliani, M., D'Aleo, V., Del Prato, S., Boggi, U., Mosca, F., et al.
(2010). G-protein-coupled receptor 40 (GPR40) expression and its regulation in
human pancreatic islets: the role of type 2 diabetes and fatty acids. Nutr Metab
Cardiovasc Dis, 20(1), 22-25. doi: S0939-4753(09)00039-8 [pii]
10.1016/j.numecd.2009.02.008
Diagnosis and classification of diabetes mellitus. (2011). Diabetes Care, 34 Suppl 1, S62-
69. doi: 34/Supplement_1/S62 [pii]

Comstock, 148
10.2337/dc11-S062
Drury, D. R., Wick, A. N., Bancroft, R. W., & Mac, K. E. (1951). Glucose utilization by
the extra-hepatic tissues. Am J Physiol, 164(1), 207-212.
Dumortier, O., Blondeau, B., Duvillie, B., Reusens, B., Breant, B., & Remacle, C.
(2007). Different mechanisms operating during different critical time-windows
reduce rat fetal beta cell mass due to a maternal low-protein or low-energy diet.
Diabetologia, 50(12), 2495-2503. doi: 10.1007/s00125-007-0811-0
Dunn, G. A., & Bale, T. L. (2009). Maternal high-fat diet promotes body length increases
and insulin insensitivity in second-generation mice. Endocrinology, 150(11),
4999-5009. doi: en.2009-0500 [pii]
10.1210/en.2009-0500
Dzeja, P. P., & Terzic, A. (2003). Phosphotransfer networks and cellular energetics. J
Exp Biol, 206(Pt 12), 2039-2047.
Dzeja, P. P., Zeleznikar, R. J., & Goldberg, N. D. (1998). Adenylate kinase: kinetic
behavior in intact cells indicates it is integral to multiple cellular processes. Mol
Cell Biochem, 184(1-2), 169-182.
Ehses, J. A., Ellingsgaard, H., Boni-Schnetzler, M., & Donath, M. Y. (2009). Pancreatic
islet inflammation in type 2 diabetes: from alpha and beta cell compensation to
dysfunction. Arch Physiol Biochem, 115(4), 240-247. doi:
10.1080/13813450903025879
Elghazi, L., Cras-Meneur, C., Czernichow, P., & Scharfmann, R. (2002). Role for
FGFR2IIIb-mediated signals in controlling pancreatic endocrine progenitor cell
proliferation. Proc Natl Acad Sci U S A, 99(6), 3884-3889. doi:
10.1073/pnas.062321799
062321799 [pii]
Ellingsgaard, H., Hauselmann, I., Schuler, B., Habib, A. M., Baggio, L. L., Meier, D. T.,
et al. (2011). Interleukin-6 enhances insulin secretion by increasing glucagon-like
peptide-1 secretion from L cells and alpha cells. Nat Med, 17(11), 1481-1489. doi:
nm.2513 [pii]
10.1038/nm.2513
Enriori, P. J., Evans, A. E., Sinnayah, P., Jobst, E. E., Tonelli-Lemos, L., Billes, S. K., et
al. (2007). Diet-induced obesity causes severe but reversible leptin resistance in
arcuate melanocortin neurons. Cell Metab, 5(3), 181-194.
Erlich, H. A., Zeidler, A., Chang, J., Shaw, S., Raffel, L. J., Klitz, W., et al. (1993). HLA
class II alleles and susceptibility and resistance to insulin dependent diabetes
mellitus in Mexican-American families. Nat Genet, 3(4), 358-364. doi:
10.1038/ng0493-358
Estrany, M. E., Proenza, A. M., Llado, I., & Gianotti, M. (2011). Isocaloric intake of a
high-fat diet modifies adiposity and lipid handling in a sex dependent manner in
rats. Lipids Health Dis, 10, 52. doi: 1476-511X-10-52 [pii]
10.1186/1476-511X-10-52
Fahy, A. (2009). Vascularization of the pancreas and islets of langerhans in intrauterine
growth restricted fetuses and lambs. BS Bachelor, University of Arizona, Tucson.

Comstock, 149
Fan, L., Lindsley, R., Comstock, S. M., Takahashi, D., Evans, A. E., Thornburg, K. L., et
al. (2012). Maternal High-Fat Diet Programs Endothelial Dysfunction in the Aorta
of Juvenile Nonhuman Primates. International Journal of Obesity, In press.
Farley, D., Tejero, M. E., Comuzzie, A. G., Higgins, P. B., Cox, L., Werner, S. L., et al.
(2009). Feto-placental adaptations to maternal obesity in the baboon. Placenta,
30(9), 752-760. doi: S0143-4004(09)00206-9 [pii]
10.1016/j.placenta.2009.06.007
Ferezou-Viala, J., Roy, A. F., Serougne, C., Gripois, D., Parquet, M., Bailleux, V., et al.
(2007). Long-term consequences of maternal high-fat feeding on hypothalamic
leptin sensitivity and diet-induced obesity in the offspring. Am J Physiol Regul
Integr Comp Physiol, 293(3), R1056-1062. doi: 00117.2007 [pii]
10.1152/ajpregu.00117.2007
Finucane, M. M., Stevens, G. A., Cowan, M. J., Danaei, G., Lin, J. K., Paciorek, C. J., et
al. National, regional, and global trends in body-mass index since 1980:
systematic analysis of health examination surveys and epidemiological studies
with 960 country-years and 9·1 million participants. The Lancet, 377(9765), 557-
567. doi: 10.1016/s0140-6736(10)62037-5
Fioramonti, X., Contie, S., Song, Z., Routh, V. H., Lorsignol, A., & Penicaud, L. (2007).
Characterization of glucosensing neuron subpopulations in the arcuate nucleus:
integration in neuropeptide Y and pro-opio melanocortin networks? Diabetes,
56(5), 1219-1227. doi: db06-0567 [pii]
10.2337/db06-0567
Flodgren, E., Olde, B., Meidute-Abaraviciene, S., Winzell, M. S., Ahren, B., & Salehi, A.
(2007). GPR40 is expressed in glucagon producing cells and affects glucagon
secretion. Biochem Biophys Res Commun, 354(1), 240-245. doi: S0006-
291X(06)02867-1 [pii]
10.1016/j.bbrc.2006.12.193
Ford, E. S., Giles, W. H., & Dietz, W. H. (2002). Prevalence of the metabolic syndrome
among US adults: findings from the third National Health and Nutrition
Examination Survey. JAMA, 287(3), 356-359. doi: jbr10281 [pii]
Ford, S. P., Zhang, L., Zhu, M., Miller, M. M., Smith, D. T., Hess, B. W., et al. (2009).
Maternal obesity accelerates fetal pancreatic beta-cell but not alpha-cell
development in sheep: prenatal consequences. Am J Physiol Regul Integr Comp
Physiol, 297(3), R835-843. doi: 00072.2009 [pii]
10.1152/ajpregu.00072.2009
Forsen, T., Eriksson, J. G., Tuomilehto, J., Teramo, K., Osmond, C., & Barker, D. J.
(1997). Mother's weight in pregnancy and coronary heart disease in a cohort of
Finnish men: follow up study. Bmj, 315(7112), 837-840.
Fowden, A. L., & Hill, D. J. (2001). Intra-uterine programming of the endocrine
pancreas. Br Med Bull, 60, 123-142.
Fowden, A. L., Mijovic, J., & Silver, M. (1993). The effects of cortisol on hepatic and
renal gluconeogenic enzyme activities in the sheep fetus during late gestation. J
Endocrinol, 137(2), 213-222.

Comstock, 150
Franklin, I., Gromada, J., Gjinovci, A., Theander, S., & Wollheim, C. B. (2005). Beta-
cell secretory products activate alpha-cell ATP-dependent potassium channels to
inhibit glucagon release. Diabetes, 54(6), 1808-1815. doi: 54/6/1808 [pii]
Frias, A. E., Morgan, T. K., Evans, A. E., Rasanen, J., Oh, K. Y., Thornburg, K. L., et al.
Maternal high-fat diet disturbs uteroplacental hemodynamics and increases the
frequency of stillbirth in a nonhuman primate model of excess nutrition.
Endocrinology, 152(6), 2456-2464.
Frias, A. E., Morgan, T. K., Evans, A. E., Rasanen, J., Oh, K. Y., Thornburg, K. L., et al.
(2011). Maternal high-fat diet disturbs uteroplacental hemodynamics and
increases the frequency of stillbirth in a nonhuman primate model of excess
nutrition. Endocrinology, 152(6), 2456-2464. doi: en.2010-1332 [pii]
10.1210/en.2010-1332
Ganong, W. F. (2007). Review of Medical Physiology (22nd ed.). Columbus, OH:
McGraw Hill.
Garofano, A., Czernichow, P., & Breant, B. (1997). In utero undernutrition impairs rat
beta-cell development. Diabetologia, 40(10), 1231-1234. doi:
10.1007/s001250050812
Garofano, A., Czernichow, P., & Breant, B. (1998). Beta-cell mass and proliferation
following late fetal and early postnatal malnutrition in the rat. Diabetologia,
41(9), 1114-1120. doi: 10.1007/s001250051038
Garofano, A., Czernichow, P., & Breant, B. (1999). Effect of ageing on beta-cell mass
and function in rats malnourished during the perinatal period. Diabetologia,
42(6), 711-718. doi: 10.1007/s001250051219
Gatford, K. L., Mohammad, S. N., Harland, M. L., De Blasio, M. J., Fowden, A. L.,
Robinson, J. S., et al. (2008). Impaired beta-cell function and inadequate
compensatory increases in beta-cell mass after intrauterine growth restriction in
sheep. Endocrinology, 149(10), 5118-5127. doi: en.2008-0233 [pii]
10.1210/en.2008-0233
Gavrieli, Y., Sherman, Y., & Ben-Sasson, S. A. (1992). Identification of programmed cell
death in situ via specific labeling of nuclear DNA fragmentation. J Cell Biol,
119(3), 493-501.
George, L. A., Uthlaut, A. B., Long, N. M., Zhang, L., Ma, Y., Smith, D. T., et al. (2010).
Different levels of overnutrition and weight gain during pregnancy have
differential effects on fetal growth and organ development. Reprod Biol
Endocrinol, 8, 75. doi: 1477-7827-8-75 [pii]
10.1186/1477-7827-8-75
Georgia, S., & Bhushan, A. (2004). Beta cell replication is the primary mechanism for
maintaining postnatal beta cell mass. J Clin Invest, 114(7), 963-968. doi:
10.1172/JCI22098
Gerich, J. E. (1976). Alpha cell function in diabetes mellitus. Metabolism, 25(11 Suppl
1), 1513-1516.
Glavas, M. M., Kirigiti, M. A., Xiao, X. Q., Enriori, P. J., Fisher, S. K., Evans, A. E., et
al. (2010). Early overnutrition results in early-onset arcuate leptin resistance and
increased sensitivity to high-fat diet. Endocrinology, 151(4), 1598-1610. doi:
en.2009-1295 [pii]

Comstock, 151
10.1210/en.2009-1295
Gomez-Perez, Y., Gianotti, M., Llado, I., & Proenza, A. M. (2011). Sex-dependent
effects of high-fat-diet feeding on rat pancreas oxidative stress. Pancreas, 40(5),
682-688. doi: 10.1097/MPA.0b013e31821f2645
Grant, W. F., Gillingham, M. B., Batra, A. K., Fewkes, N. M., Comstock, S. M.,
Takahashi, D., et al. Maternal high fat diet is associated with decreased plasma n-
3 fatty acids and fetal hepatic apoptosis in nonhuman primates. PLoS One, 6(2),
e17261.
Grant, W. F., Gillingham, M. B., Batra, A. K., Fewkes, N. M., Comstock, S. M.,
Takahashi, D., et al. (2011). Maternal high fat diet is associated with decreased
plasma n-3 fatty acids and fetal hepatic apoptosis in nonhuman primates. PLoS
One, 6(2), e17261. doi: 10.1371/journal.pone.0017261
Grayson, B. E., Levasseur, P. R., Williams, S. M., Smith, M. S., Marks, D. L., & Grove,
K. L. Changes in melanocortin expression and inflammatory pathways in fetal
offspring of nonhuman primates fed a high-fat diet. Endocrinology, 151(4), 1622-
1632.
Grayson, B. E., Levasseur, P. R., Williams, S. M., Smith, M. S., Marks, D. L., & Grove,
K. L. (2010). Changes in melanocortin expression and inflammatory pathways in
fetal offspring of nonhuman primates fed a high-fat diet. Endocrinology, 151(4),
1622-1632. doi: en.2009-1019 [pii]
10.1210/en.2009-1019
Groop, L. C., Bonadonna, R. C., Simonson, D. C., Petrides, A. S., Shank, M., &
DeFronzo, R. A. (1992). Effect of insulin on oxidative and nonoxidative pathways
of free fatty acid metabolism in human obesity. Am J Physiol, 263(1 Pt 1), E79-
84.
Grulet, H., Durlach, V., Hecart, A. C., Gross, A., & Leutenegger, M. (1993). Study of the
rate of early glucose disappearance following insulin injection: insulin sensitivity
index. Diabetes Res Clin Pract, 20(3), 201-207. doi: 0168-8227(93)90079-K [pii]
Grundy, S. M. (2006). Does a diagnosis of metabolic syndrome have value in clinical
practice? Am J Clin Nutr, 83(6), 1248-1251. doi: 83/6/1248 [pii]
Grundy, S. M., Cleeman, J. I., Daniels, S. R., Donato, K. A., Eckel, R. H., Franklin, B.
A., et al. (2005). Diagnosis and management of the metabolic syndrome: an
American Heart Association/National Heart, Lung, and Blood Institute Scientific
Statement. Circulation, 112(17), 2735-2752. doi:
CIRCULATIONAHA.105.169404 [pii]
10.1161/CIRCULATIONAHA.105.169404
Guardado-Mendoza, R., Davalli, A. M., Chavez, A. O., Hubbard, G. B., Dick, E. J.,
Majluf-Cruz, A., et al. (2009). Pancreatic islet amyloidosis, beta-cell apoptosis,
and alpha-cell proliferation are determinants of islet remodeling in type-2 diabetic
baboons. Proc Natl Acad Sci U S A, 106(33), 13992-13997. doi: 0906471106 [pii]
10.1073/pnas.0906471106
Guiot, Y., Sempoux, C., Moulin, P., & Rahier, J. (2001). No decrease of the beta-cell
mass in type 2 diabetic patients. Diabetes, 50 Suppl 1, S188.

Comstock, 152
Guo, S. S., Wu, W., Chumlea, W. C., & Roche, A. F. (2002). Predicting overweight and
obesity in adulthood from body mass index values in childhood and adolescence.
Am J Clin Nutr, 76(3), 653-658.
Gupta, R. K., Vatamaniuk, M. Z., Lee, C. S., Flaschen, R. C., Fulmer, J. T., Matschinsky,
F. M., et al. (2005). The MODY1 gene HNF-4alpha regulates selected genes
involved in insulin secretion. J Clin Invest, 115(4), 1006-1015.
Haffner, S. M., Valdez, R. A., Hazuda, H. P., Mitchell, B. D., Morales, P. A., & Stern, M.
P. (1992). Prospective analysis of the insulin-resistance syndrome (syndrome X).
Diabetes, 41(6), 715-722.
Halban, P. A., Wollheim, C. B., Blondel, B., Meda, P., Niesor, E. N., & Mintz, D. H.
(1982). The possible importance of contact between pancreatic islet cells for the
control of insulin release. Endocrinology, 111(1), 86-94.
Hales, C. N., & Barker, D. J. (1992). Type 2 (non-insulin-dependent) diabetes mellitus:
the thrifty phenotype hypothesis. Diabetologia, 35(7), 595-601.
Hales, C. N., Barker, D. J., Clark, P. M., Cox, L. J., Fall, C., Osmond, C., et al. (1991).
Fetal and infant growth and impaired glucose tolerance at age 64. BMJ,
303(6809), 1019-1022.
Hall, A. C. G. a. J. E. (2000). Textbook of Medical Physiology (10 ed.). Philadelphia, PA:
WB Saunder Company.
Hamada, Y. (1999). Adolescent Growth and Development in Japanese Macaques
(Macacafuscata): Punctuated Adolescent Growth Spurt by Season. Primates,
40(3), 14.
Hancock, C. R., Han, D. H., Chen, M., Terada, S., Yasuda, T., Wright, D. C., et al.
(2008). High-fat diets cause insulin resistance despite an increase in muscle
mitochondria. Proc Natl Acad Sci U S A, 105(22), 7815-7820. doi: 0802057105
[pii]
10.1073/pnas.0802057105
Hanley, S. C., Austin, E., Assouline-Thomas, B., Kapeluto, J., Blaichman, J., Moosavi,
M., et al. (2010). {beta}-Cell mass dynamics and islet cell plasticity in human
type 2 diabetes. Endocrinology, 151(4), 1462-1472. doi: en.2009-1277 [pii]
10.1210/en.2009-1277
Hansen, B. C., & Bodkin, N. L. (1986). Heterogeneity of insulin responses: phases
leading to type 2 (non-insulin-dependent) diabetes mellitus in the rhesus monkey.
Diabetologia, 29(10), 713-719.
Hansen, B. C., & Bodkin, N. L. (1990). Beta-cell hyperresponsiveness: earliest event in
development of diabetes in monkeys. Am J Physiol, 259(3 Pt 2), R612-617.
Hayama, S., Nakiri, S., & Konno, F. (2011). Pregnancy rate and conception date in a wild
population of Japanese monkeys. J Vet Med Sci, 73(6), 809-812. doi:
JST.JSTAGE/jvms/10-0420 [pii]
Hegyi, P., Maleth, J., Venglovecz, V., & Rakonczay, Z., Jr. (2011). Pancreatic ductal
bicarbonate secretion: challenge of the acinar Acid load. Front Physiol, 2, 36. doi:
10.3389/fphys.2011.00036
Heimberg, H., De Vos, A., Moens, K., Quartier, E., Bouwens, L., Pipeleers, D., et al.
(1996). The glucose sensor protein glucokinase is expressed in glucagon-
producing alpha-cells. Proc Natl Acad Sci U S A, 93(14), 7036-7041.
Comstock, 153
Hill, D. J. (2005). Development of the endocrine pancreas. Rev Endocr Metab Disord,
6(3), 229-238. doi: 10.1007/s11154-005-3054-8
Holz, G. G. t., Kuhtreiber, W. M., & Habener, J. F. (1993). Pancreatic beta-cells are
rendered glucose-competent by the insulinotropic hormone glucagon-like peptide-
1(7-37). Nature, 361(6410), 362-365. doi: 10.1038/361362a0
Howie, G. J., Sloboda, D. M., Kamal, T., & Vickers, M. H. (2009). Maternal nutritional
history predicts obesity in adult offspring independent of postnatal diet. J Physiol,
587(Pt 4), 905-915. doi: jphysiol.2008.163477 [pii]
10.1113/jphysiol.2008.163477
Huypens, P., Ling, Z., Pipeleers, D., & Schuit, F. (2000). Glucagon receptors on human
islet cells contribute to glucose competence of insulin release. Diabetologia,
43(8), 1012-1019. doi: 10.1007/s001250051484
Isa, T., Yamane, I., Hamai, M., & Inagaki, H. (2009). Japanese macaques as laboratory
animals. Exp Anim, 58(5), 451-457. doi: JST.JSTAGE/expanim/58.451 [pii]
Iynedjian, P. B. (1993). Mammalian glucokinase and its gene. Biochem J, 293 ( Pt 1), 1-
13.
Johannsen, D. L., Johannsen, N. M., & Specker, B. L. (2006). Influence of parents' eating
behaviors and child feeding practices on children's weight status. Obesity (Silver
Spring), 14(3), 431-439. doi: 14/3/431 [pii]
10.1038/oby.2006.57
Johansson, K. A., & Grapin-Botton, A. (2002). Development and diseases of the
pancreas. Clin Genet, 62(1), 14-23.
Jones, H. N., Woollett, L. A., Barbour, N., Prasad, P. D., Powell, T. L., & Jansson, T.
(2009). High-fat diet before and during pregnancy causes marked up-regulation of
placental nutrient transport and fetal overgrowth in C57/BL6 mice. FASEB J,
23(1), 271-278. doi: fj.08-116889 [pii]
10.1096/fj.08-116889
Jones, L. C., & Clark, A. (2001). beta-cell neogenesis in type 2 diabetes. Diabetes, 50
Suppl 1, S186-187.
Jonsson, J., Carlsson, L., Edlund, T., & Edlund, H. (1994). Insulin-promoter-factor 1 is
required for pancreas development in mice. Nature, 371(6498), 606-609.
Jovanovic-Peterson, L., Fuhrmann, K., Hedden, K., Walker, L., & Peterson, C. M.
(1989). Maternal milk and plasma glucose and insulin levels: studies in normal
and diabetic subjects. J Am Coll Nutr, 8(2), 125-131.
Jurgens, C. A., Toukatly, M. N., Fligner, C. L., Udayasankar, J., Subramanian, S. L.,
Zraika, S., et al. (2011). beta-cell loss and beta-cell apoptosis in human type 2
diabetes are related to islet amyloid deposition. Am J Pathol, 178(6), 2632-2640.
doi: S0002-9440(11)00270-7 [pii]
10.1016/j.ajpath.2011.02.036
Kahn, B. B., & Flier, J. S. (2000). Obesity and insulin resistance. J Clin Invest, 106(4),
473-481. doi: 10.1172/JCI10842
Kahn, R., Buse, J., Ferrannini, E., & Stern, M. (2005). The metabolic syndrome: time for
a critical appraisal. Joint statement from the American Diabetes Association and
the European Association for the Study of Diabetes. Diabetologia, 48(9), 1684-
1699. doi: 10.1007/s00125-005-1876-2

Comstock, 154
Kashyap, S., Belfort, R., Gastaldelli, A., Pratipanawatr, T., Berria, R., Pratipanawatr, W.,
et al. (2003). A sustained increase in plasma free fatty acids impairs insulin
secretion in nondiabetic subjects genetically predisposed to develop type 2
diabetes. Diabetes, 52(10), 2461-2474.
Kaufman, D., Smith, E. L., Gohil, B. C., Banerji, M., Coplan, J. D., Kral, J. G., et al.
(2005). Early appearance of the metabolic syndrome in socially reared bonnet
macaques. J Clin Endocrinol Metab, 90(1), 404-408. doi: jc.2004-0452 [pii]
10.1210/jc.2004-0452
Kerr, G. R., Allen, J. R., Scheffler, G., & Couture, J. (1974). Fetal and postnatal growth
of rhesus monkeys (M. mulatta). J Med Primatol, 3(4), 221-235.
Kidd, M., Nadler, B., Mane, S., Eick, G., Malfertheiner, M., Champaneria, M., et al.
(2007). GeneChip, geNorm, and gastrointestinal tumors: novel reference genes for
real-time PCR. Physiol Genomics, 30(3), 363-370.
Kieffer, T. J., Heller, R. S., Unson, C. G., Weir, G. C., & Habener, J. F. (1996).
Distribution of glucagon receptors on hormone-specific endocrine cells of rat
pancreatic islets. Endocrinology, 137(11), 5119-5125.
Kilpatrick, E. D., & Robertson, R. P. (1998). Differentiation between glucose-induced
desensitization of insulin secretion and beta-cell exhaustion in the HIT-T15 cell
line. Diabetes, 47(4), 606-611.
Kim, A., Miller, K., Jo, J., Kilimnik, G., Wojcik, P., & Hara, M. (2009). Islet
architecture: A comparative study. Islets, 1(2), 129-136. doi: 10.4161/isl.1.2.9480
Kiserud, T. (2005). Physiology of the fetal circulation. Semin Fetal Neonatal Med, 10(6),
493-503. doi: S1744-165X(05)00068-5 [pii]
10.1016/j.siny.2005.08.007
Konig, S., Vest, M., & Stahl, M. (1978). Interrelation of maternal and foetal glucose and
free fatty acids. The role of insulin and glucagon. Eur J Pediatr, 128(3), 187-195.
Konner, A. C., Janoschek, R., Plum, L., Jordan, S. D., Rother, E., Ma, X., et al. (2007).
Insulin action in AgRP-expressing neurons is required for suppression of hepatic
glucose production. Cell Metab, 5(6), 438-449. doi: S1550-4131(07)00131-3 [pii]
10.1016/j.cmet.2007.05.004
Koukkou, E., Ghosh, P., Lowy, C., & Poston, L. (1998). Offspring of normal and diabetic
rats fed saturated fat in pregnancy demonstrate vascular dysfunction. Circulation,
98(25), 2899-2904.
Koupil, I., & Toivanen, P. (2008). Social and early-life determinants of overweight and
obesity in 18-year-old Swedish men. Int J Obes (Lond), 32(1), 73-81.
Kramer, J., Moeller, E. L., Hachey, A., Mansfield, K. G., & Wachtman, L. M. (2009).
Differential expression of GLUT2 in pancreatic islets and kidneys of New and
Old World nonhuman primates. Am J Physiol Regul Integr Comp Physiol, 296(3),
R786-793. doi: 90694.2008 [pii]
10.1152/ajpregu.90694.2008
Lang, G., Goldstein, M. S., & Levine, R. (1954). Influence of the liver on uptake of
glucose by extrahepatic tissues. Am J Physiol, 177(3), 447-450.
Leung, Y. M., Ahmed, I., Sheu, L., Gao, X., Hara, M., Tsushima, R. G., et al. (2006).
Insulin regulates islet alpha-cell function by reducing KATP channel sensitivity to

Comstock, 155
adenosine 5'-triphosphate inhibition. Endocrinology, 147(5), 2155-2162. doi:
en.2005-1249 [pii]
10.1210/en.2005-1249
Liang, Y., Najafi, H., & Matschinsky, F. M. (1990). Glucose regulates glucokinase
activity in cultured islets from rat pancreas. J Biol Chem, 265(28), 16863-16866.
Limesand, S. W., Jensen, J., Hutton, J. C., & Hay, W. W., Jr. (2005). Diminished beta-
cell replication contributes to reduced beta-cell mass in fetal sheep with
intrauterine growth restriction. Am J Physiol Regul Integr Comp Physiol, 288(5),
R1297-1305. doi: 00494.2004 [pii]
10.1152/ajpregu.00494.2004
Limesand, S. W., Rozance, P. J., Smith, D., & Hay, W. W., Jr. (2007). Increased insulin
sensitivity and maintenance of glucose utilization rates in fetal sheep with
placental insufficiency and intrauterine growth restriction. Am J Physiol
Endocrinol Metab, 293(6), E1716-1725. doi: 00459.2007 [pii]
10.1152/ajpendo.00459.2007
Limesand, S. W., Rozance, P. J., Zerbe, G. O., Hutton, J. C., & Hay, W. W., Jr. (2006).
Attenuated insulin release and storage in fetal sheep pancreatic islets with
intrauterine growth restriction. Endocrinology, 147(3), 1488-1497. doi: en.2005-
0900 [pii]
10.1210/en.2005-0900
Long, N. M., George, L. A., Uthlaut, A. B., Smith, D. T., Nijland, M. J., Nathanielsz, P.
W., et al. (2010). Maternal obesity and increased nutrient intake before and during
gestation in the ewe results in altered growth, adiposity, and glucose tolerance in
adult offspring. J Anim Sci, 88(11), 3546-3553. doi: jas.2010-3083 [pii]
10.2527/jas.2010-3083
Ludmer, P. L., Selwyn, A. P., Shook, T. L., Wayne, R. R., Mudge, G. H., Alexander, R.
W., et al. (1986). Paradoxical vasoconstriction induced by acetylcholine in
atherosclerotic coronary arteries. N Engl J Med, 315(17), 1046-1051. doi:
10.1056/NEJM198610233151702
Lukinius, A., Korsgren, O., Grimelius, L., & Wilander, E. (1996). Expression of islet
amyloid polypeptide in fetal and adult porcine and human pancreatic islet cells.
Endocrinology, 137(12), 5319-5325.
MacDonald, P. E., Joseph, J. W., & Rorsman, P. (2005). Glucose-sensing mechanisms in
pancreatic beta-cells. Philos Trans R Soc Lond B Biol Sci, 360(1464), 2211-2225.
Maedler, K., & Donath, M. Y. (2004). Beta-cells in type 2 diabetes: a loss of function and
mass. Horm Res, 62 Suppl 3, 67-73. doi: 80503 [pii]
10.1159/000080503
Magarey, A. M., Daniels, L. A., Boulton, T. J., & Cockington, R. A. (2003). Predicting
obesity in early adulthood from childhood and parental obesity. Int J Obes Relat
Metab Disord, 27(4), 505-513.
Martin-Gronert, M. S., & Ozanne, S. E. (2007). Experimental IUGR and later diabetes. J
Intern Med, 261(5), 437-452. doi: JIM1800 [pii]
10.1111/j.1365-2796.2007.01800.x
Matschinsky, F. M. (1996). Banting Lecture 1995. A lesson in metabolic regulation
inspired by the glucokinase glucose sensor paradigm. Diabetes, 45(2), 223-241.

Comstock, 156
Matsumoto, S., Qualley, S. A., Goel, S., Hagman, D. K., Sweet, I. R., Poitout, V., et al.
(2002). Effect of the two-layer (University of Wisconsin solution-
perfluorochemical plus O2) method of pancreas preservation on human islet
isolation, as assessed by the Edmonton Isolation Protocol. Transplantation,
74(10), 1414-1419. doi: 10.1097/01.TP.0000034206.66890.B0
Matthews, D. R., Hosker, J. P., Rudenski, A. S., Naylor, B. A., Treacher, D. F., & Turner,
R. C. (1985). Homeostasis model assessment: insulin resistance and beta-cell
function from fasting plasma glucose and insulin concentrations in man.
Diabetologia, 28(7), 412-419.
Matveyenko, A. V., Singh, I., Shin, B. C., Georgia, S., & Devaskar, S. U. (2010).
Differential effects of prenatal and postnatal nutritional environment on beta-cell
mass development and turnover in male and female rats. Endocrinology, 151(12),
5647-5656. doi: en.2010-0978 [pii]
10.1210/en.2010-0978
McAuley, K. A., Williams, S. M., Mann, J. I., Walker, R. J., Lewis-Barned, N. J.,
Temple, L. A., et al. (2001). Diagnosing insulin resistance in the general
population. Diabetes Care, 24(3), 460-464.
McCurdy, C. E., Bishop, J. M., Williams, S. M., Grayson, B. E., Smith, M. S., Friedman,
J. E., et al. (2009). Maternal high-fat diet triggers lipotoxicity in the fetal livers of
nonhuman primates. J Clin Invest, 119(2), 323-335.
Medrikova, D., Jilkova, Z. M., Bardova, K., Janovska, P., Rossmeisl, M., & Kopecky, J.
(2011). Sex differences during the course of diet-induced obesity in mice: adipose
tissue expandability and glycemic control. Int J Obes (Lond). doi: ijo201187 [pii]
10.1038/ijo.2011.87
Meyer, K. M., Koch, J. M., Ramadoss, J., Kling, P. J., & Magness, R. R. (2010). Ovine
surgical model of uterine space restriction: interactive effects of uterine anomalies
and multifetal gestations on fetal and placental growth. Biol Reprod, 83(5), 799-
806. doi: biolreprod.110.085381 [pii]
10.1095/biolreprod.110.085381
Miki, T., Nagashima, K., & Seino, S. (1999). The structure and function of the ATP-
sensitive K+ channel in insulin-secreting pancreatic beta-cells. J Mol Endocrinol,
22(2), 113-123.
Mojsov, S., Weir, G. C., & Habener, J. F. (1987). Insulinotropin: glucagon-like peptide I
(7-37) co-encoded in the glucagon gene is a potent stimulator of insulin release in
the perfused rat pancreas. J Clin Invest, 79(2), 616-619. doi: 10.1172/JCI112855
Montanya, E., & Tellez, N. (2009). Pancreatic remodeling: beta-cell apoptosis,
proliferation and neogenesis, and the measurement of beta-cell mass and of
individual beta-cell size. Methods Mol Biol, 560, 137-158.
Moran, A., Zhang, H. J., Olson, L. K., Harmon, J. S., Poitout, V., & Robertson, R. P.
(1997). Differentiation of glucose toxicity from beta cell exhaustion during the
evolution of defective insulin gene expression in the pancreatic islet cell line,
HIT-T15. J Clin Invest, 99(3), 534-539. doi: 10.1172/JCI119190
Moritz, W., Leech, C. A., Ferrer, J., & Habener, J. F. (2001). Regulated expression of
adenosine triphosphate-sensitive potassium channel subunits in pancreatic beta-
cells. Endocrinology, 142(1), 129-138.

Comstock, 157
Morrison, J. L. (2008). Sheep models of intrauterine growth restriction: fetal adaptations
and consequences. Clin Exp Pharmacol Physiol, 35(7), 730-743. doi: CEP4975
[pii]
10.1111/j.1440-1681.2008.04975.x
Mourmeaux, J. L., Remacle, C., & Henquin, J. C. (1985). Morphological and functional
characteristics of islets neoformed during tissue culture of fetal rat pancreas. Mol
Cell Endocrinol, 39(3), 237-246.
Myers, R. E., Hill, D. E., Holt, A. B., Scott, R. E., Mellits, E. D., & Cheek, D. B. (1971).
Fetal growth retardation produced by experimental placental insufficiency in the
rhesus monkey. I. Body weight, organ size. Biol Neonate, 18(5), 379-394.
Newgard, C. B., & McGarry, J. D. (1995). Metabolic coupling factors in pancreatic beta-
cell signal transduction. Annu Rev Biochem, 64, 689-719.
Nolan, C. J., Madiraju, M. S., Delghingaro-Augusto, V., Peyot, M. L., & Prentki, M.
(2006). Fatty acid signaling in the beta-cell and insulin secretion. Diabetes, 55
Suppl 2, S16-23. doi: 55/Supplement_2/S16 [pii]
10.2337/diabetes.
Offield, M. F., Jetton, T. L., Labosky, P. A., Ray, M., Stein, R. W., Magnuson, M. A., et
al. (1996). PDX-1 is required for pancreatic outgrowth and differentiation of the
rostral duodenum. Development, 122(3), 983-995.
Ogden, C. L., Carroll, M. D., Curtin, L. R., Lamb, M. M., & Flegal, K. M. (2010).
Prevalence of high body mass index in US children and adolescents, 2007-2008.
JAMA, 303(3), 242-249. doi: 2009.2012 [pii]
10.1001/jama.2009.2012
Ogden, C. L., Carroll, M. D., Curtin, L. R., McDowell, M. A., Tabak, C. J., & Flegal, K.
M. (2006). Prevalence of overweight and obesity in the United States, 1999-2004.
Jama, 295(13), 1549-1555.
Olson, L. K., Sharma, A., Peshavaria, M., Wright, C. V., Towle, H. C., Rodertson, R. P.,
et al. (1995). Reduction of insulin gene transcription in HIT-T15 beta cells
chronically exposed to a supraphysiologic glucose concentration is associated
with loss of STF-1 transcription factor expression. Proc Natl Acad Sci U S A,
92(20), 9127-9131.
Oltjen, J. W., & Beckett, J. L. (1996). Role of ruminant livestock in sustainable
agricultural systems. J Anim Sci, 74(6), 1406-1409.
Park, J. H., Stoffers, D. A., Nicholls, R. D., & Simmons, R. A. (2008). Development of
type 2 diabetes following intrauterine growth retardation in rats is associated with
progressive epigenetic silencing of Pdx1. J Clin Invest, 118(6), 2316-2324. doi:
10.1172/JCI33655
Parton, L. E., Ye, C. P., Coppari, R., Enriori, P. J., Choi, B., Zhang, C. Y., et al. (2007).
Glucose sensing by POMC neurons regulates glucose homeostasis and is impaired
in obesity. Nature, 449(7159), 228-232. doi: nature06098 [pii]
10.1038/nature06098
Paulsen, S. J., Jelsing, J., Madsen, A. N., Hansen, G., Lykkegaard, K., Larsen, L. K., et
al. (2010). Characterization of beta-cell mass and insulin resistance in diet-
induced obese and diet-resistant rats. Obesity (Silver Spring), 18(2), 266-273. doi:
oby2009245 [pii]
Comstock, 158
10.1038/oby.2009.245
Perfetti, R., Zhou, J., Doyle, M. E., & Egan, J. M. (2000). Glucagon-like peptide-1
induces cell proliferation and pancreatic-duodenum homeobox-1 expression and
increases endocrine cell mass in the pancreas of old, glucose-intolerant rats.
Endocrinology, 141(12), 4600-4605.
Phillips, D. I. (1996). Insulin resistance as a programmed response to fetal undernutrition.
Diabetologia, 39(9), 1119-1122.
Pipeleers, D. G., Schuit, F. C., Van Schravendijk, C. F., & Van de Winkel, M. (1985).
Interplay of nutrients and hormones in the regulation of glucagon release.
Endocrinology, 117(3), 817-823.
Piper, K., Brickwood, S., Turnpenny, L. W., Cameron, I. T., Ball, S. G., Wilson, D. I., et
al. (2004). Beta cell differentiation during early human pancreas development. J
Endocrinol, 181(1), 11-23.
Pocai, A., Lam, T. K., Gutierrez-Juarez, R., Obici, S., Schwartz, G. J., Bryan, J., et al.
(2005). Hypothalamic K(ATP) channels control hepatic glucose production.
Nature, 434(7036), 1026-1031. doi: nature03439 [pii]
10.1038/nature03439
Poitout, V. (2008). Glucolipotoxicity of the pancreatic beta-cell: myth or reality?
Biochem Soc Trans, 36(Pt 5), 901-904. doi: BST0360901 [pii]
10.1042/BST0360901
Postic, C., Shiota, M., & Magnuson, M. A. (2001). Cell-specific roles of glucokinase in
glucose homeostasis. Recent Prog Horm Res, 56, 195-217.
Prado, C. L., Pugh-Bernard, A. E., Elghazi, L., Sosa-Pineda, B., & Sussel, L. (2004).
Ghrelin cells replace insulin-producing beta cells in two mouse models of
pancreas development. Proc Natl Acad Sci U S A, 101(9), 2924-2929. doi:
10.1073/pnas.0308604100
0308604100 [pii]
Quesada, I., Tuduri, E., Ripoll, C., & Nadal, A. (2008). Physiology of the pancreatic
alpha-cell and glucagon secretion: role in glucose homeostasis and diabetes. J
Endocrinol, 199(1), 5-19. doi: JOE-08-0290 [pii]
10.1677/JOE-08-0290
Radaelli, T., Lepercq, J., Varastehpour, A., Basu, S., Catalano, P. M., & Hauguel-De
Mouzon, S. (2009). Differential regulation of genes for fetoplacental lipid
pathways in pregnancy with gestational and type 1 diabetes mellitus. Am J Obstet
Gynecol, 201(2), 209 e201-209 e210. doi: S0002-9378(09)00405-0 [pii]
10.1016/j.ajog.2009.04.019
Rao, S., Yajnik, C. S., Kanade, A., Fall, C. H., Margetts, B. M., Jackson, A. A., et al.
(2001). Intake of micronutrient-rich foods in rural Indian mothers is associated
with the size of their babies at birth: Pune Maternal Nutrition Study. J Nutr,
131(4), 1217-1224.
Ravelli, A. C., van der Meulen, J. H., Michels, R. P., Osmond, C., Barker, D. J., Hales, C.
N., et al. (1998). Glucose tolerance in adults after prenatal exposure to famine.
Lancet, 351(9097), 173-177. doi: S0140673697072449 [pii]
Reddy, K. G., Nair, R. N., Sheehan, H. M., & Hodgson, J. M. (1994). Evidence that
selective endothelial dysfunction may occur in the absence of angiographic or
Comstock, 159
ultrasound atherosclerosis in patients with risk factors for atherosclerosis. J Am
Coll Cardiol, 23(4), 833-843. doi: 0735-1097(94)90627-0 [pii]
Reers, C., Erbel, S., Esposito, I., Schmied, B., Buchler, M. W., Nawroth, P. P., et al.
(2009). Impaired islet turnover in human donor pancreata with aging. Eur J
Endocrinol, 160(2), 185-191. doi: EJE-08-0596 [pii]
10.1530/EJE-08-0596
Remacle, C., Dumortier, O., Bol, V., Goosse, K., Romanus, P., Theys, N., et al. (2007).
Intrauterine programming of the endocrine pancreas. Diabetes Obes Metab, 9
Suppl 2, 196-209. doi: DOM790 [pii]
10.1111/j.1463-1326.2007.00790.x
Rivas-Carrillo, J. D., Okitsu, T., Tanaka, N., & Kobayashi, N. (2007). Pancreas
development and beta-cell differentiation of embryonic stem cells. Curr Med
Chem, 14(14), 1573-1578.
Roberts, V. H., Rasanen, J. P., Novy, M. J., Frias, A., Louey, S., Morgan, T. K., et al.
(2012). Restriction of placental vasculature in a non-human primate: A unique
model to study placental plasticity. Placenta, 33(1), 73-76. doi: S0143-
4004(11)00494-2 [pii]
10.1016/j.placenta.2011.10.003
Robertson, R. P. (2004). Chronic oxidative stress as a central mechanism for glucose
toxicity in pancreatic islet beta cells in diabetes. J Biol Chem, 279(41), 42351-
42354. doi: 10.1074/jbc.R400019200
R400019200 [pii]
Roseboom, T., de Rooij, S., & Painter, R. (2006). The Dutch famine and its long-term
consequences for adult health. Early Hum Dev, 82(8), 485-491. doi: S0378-
3782(06)00184-8 [pii]
10.1016/j.earlhumdev.2006.07.001
Roseboom, T. J., van der Meulen, J. H., Osmond, C., Barker, D. J., Ravelli, A. C.,
Schroeder-Tanka, J. M., et al. (2000). Coronary heart disease after prenatal
exposure to the Dutch famine, 1944-45. Heart, 84(6), 595-598.
Rosenberg, L., Lipsett, M., Yoon, J. W., Prentki, M., Wang, R., Jun, H. S., et al. (2004).
A pentadecapeptide fragment of islet neogenesis-associated protein increases
beta-cell mass and reverses diabetes in C57BL/6J mice. Ann Surg, 240(5), 875-
884. doi: 00000658-200411000-00021 [pii]
Rozance, P. J., Limesand, S. W., & Hay, W. W., Jr. (2006). Decreased nutrient-
stimulated insulin secretion in chronically hypoglycemic late-gestation fetal sheep
is due to an intrinsic islet defect. Am J Physiol Endocrinol Metab, 291(2), E404-
411. doi: 00643.2005 [pii]
10.1152/ajpendo.00643.2005
Sanz Sampelayo, M. R., Chilliard, Y., Schmidely, P., & Boza, J. (2007). Influence of
type of diet on the fat constituents of goat and sheep milk. Small Ruminant
Research, 68(1–2), 42-63. doi: 10.1016/j.smallrumres.2006.09.017
Sato, Y., Ito, T., Udaka, N., Kanisawa, M., Noguchi, Y., Cushman, S. W., et al. (1996).
Immunohistochemical localization of facilitated-diffusion glucose transporters in
rat pancreatic islets. Tissue Cell, 28(6), 637-643.
Comstock, 160
Scaglia, L., Cahill, C. J., Finegood, D. T., & Bonner-Weir, S. (1997). Apoptosis
participates in the remodeling of the endocrine pancreas in the neonatal rat.
Endocrinology, 138(4), 1736-1741.
Scholzen, T., & Gerdes, J. (2000). The Ki-67 protein: from the known and the unknown.
J Cell Physiol, 182(3), 311-322. doi: 10.1002/(SICI)1097-
4652(200003)182:3<311::AID-JCP1>3.0.CO;2-9 [pii]
10.1002/(SICI)1097-4652(200003)182:3<311::AID-JCP1>3.0.CO;2-9
Sebert, S. P., Dellschaft, N. S., Chan, L. L., Street, H., Henry, M., Francois, C., et al.
(2011). Maternal nutrient restriction during late gestation and early postnatal
growth in sheep differentially reset the control of energy metabolism in the gastric
mucosa. Endocrinology, 152(7), 2816-2826. doi: en.2011-0169 [pii]
10.1210/en.2011-0169
Shafrir, E., & Khassis, S. (1982). Maternal-fetal fat transport versus new fat synthesis in
the pregnant diabetic rat. Diabetologia, 22(2), 111-117.
Sharma, A., Moore, M., Marcora, E., Lee, J. E., Qiu, Y., Samaras, S., et al. (1999). The
NeuroD1/BETA2 sequences essential for insulin gene transcription colocalize
with those necessary for neurogenesis and p300/CREB binding protein binding.
Mol Cell Biol, 19(1), 704-713.
Sharma, A., Olson, L. K., Robertson, R. P., & Stein, R. (1995). The reduction of insulin
gene transcription in HIT-T15 beta cells chronically exposed to high glucose
concentration is associated with the loss of RIPE3b1 and STF-1 transcription
factor expression. Mol Endocrinol, 9(9), 1127-1134.
Slavin, B. G., Ong, J. M., & Kern, P. A. (1994). Hormonal regulation of hormone-
sensitive lipase activity and mRNA levels in isolated rat adipocytes. J Lipid Res,
35(9), 1535-1541.
Smith, C. A. (1947a). The effect of wartime starvation in Holland upon pregnancy and its
product. Am J Obstet Gynecol, 53(4), 599-608.
Smith, C. A. (1947b). Effects of maternal under nutrition upon the newborn infant in
Holland (1944-1945). J Pediatr, 30(3), 229-243.
Speakman, J., Hambly, C., Mitchell, S., & Krol, E. (2007). Animal models of obesity.
Obes Rev, 8 Suppl 1, 55-61.
Spruijt-Metz, D., Lindquist, C. H., Birch, L. L., Fisher, J. O., & Goran, M. I. (2002).
Relation between mothers' child-feeding practices and children's adiposity. Am J
Clin Nutr, 75(3), 581-586.
Srinivasan, M., Aalinkeel, R., Song, F., Mitrani, P., Pandya, J. D., Strutt, B., et al. (2005).
Maternal hyperinsulinemia predisposes rat fetuses for hyperinsulinemia and adult-
-onset obesity and maternal mild food restriction reverses this phenotype. Am J
Physiol Endocrinol Metab.
Srinivasan, M., Katewa, S. D., Palaniyappan, A., Pandya, J. D., & Patel, M. S. (2006).
Maternal high-fat diet consumption results in fetal malprogramming predisposing
to the onset of metabolic syndrome-like phenotype in adulthood. Am J Physiol
Endocrinol Metab, 291(4), E792-799. doi: 00078.2006 [pii]
10.1152/ajpendo.00078.2006
Staub, A., Sinn, L., & Behrens, O. K. (1955). Purification and crystallization of glucagon.
J Biol Chem, 214(2), 619-632.

Comstock, 161
Sullivan, E. L., Grayson, B., Takahashi, D., Robertson, N., Maier, A., Bethea, C. L., et al.
Chronic consumption of a high-fat diet during pregnancy causes perturbations in
the serotonergic system and increased anxiety-like behavior in nonhuman primate
offspring. J Neurosci, 30(10), 3826-3830.
Sullivan, E. L., Grayson, B., Takahashi, D., Robertson, N., Maier, A., Bethea, C. L., et al.
(2010). Chronic consumption of a high-fat diet during pregnancy causes
perturbations in the serotonergic system and increased anxiety-like behavior in
nonhuman primate offspring. J Neurosci, 30(10), 3826-3830. doi: 30/10/3826
[pii]
10.1523/JNEUROSCI.5560-09.2010
Taylor, P. D., McConnell, J., Khan, I. Y., Holemans, K., Lawrence, K. M., Asare-Anane,
H., et al. (2005). Impaired glucose homeostasis and mitochondrial abnormalities
in offspring of rats fed a fat-rich diet in pregnancy. Am J Physiol Regul Integr
Comp Physiol, 288(1), R134-139. doi: 10.1152/ajpregu.00355.2004
00355.2004 [pii]
Teta, M., Rankin, M. M., Long, S. Y., Stein, G. M., & Kushner, J. A. (2007). Growth and
regeneration of adult beta cells does not involve specialized progenitors. Dev Cell,
12(5), 817-826. doi: S1534-5807(07)00158-X [pii]
10.1016/j.devcel.2007.04.011
Tomita, T., Masuzaki, H., Iwakura, H., Fujikura, J., Noguchi, M., Tanaka, T., et al.
(2006). Expression of the gene for a membrane-bound fatty acid receptor in the
pancreas and islet cell tumours in humans: evidence for GPR40 expression in
pancreatic beta cells and implications for insulin secretion. Diabetologia, 49(5),
962-968. doi: 10.1007/s00125-006-0193-8
Uauy, R., Peirano, P., Hoffman, D., Mena, P., Birch, D., & Birch, E. (1996). Role of
essential fatty acids in the function of the developing nervous system. Lipids, 31
Suppl, S167-176.
Uchida, T., Nakamura, T., Hashimoto, N., Matsuda, T., Kotani, K., Sakaue, H., et al.
(2005). Deletion of Cdkn1b ameliorates hyperglycemia by maintaining
compensatory hyperinsulinemia in diabetic mice. Nat Med, 11(2), 175-182.
Uehara, S., Muroyama, A., Echigo, N., Morimoto, R., Otsuka, M., Yatsushiro, S., et al.
(2004). Metabotropic glutamate receptor type 4 is involved in autoinhibitory
cascade for glucagon secretion by alpha-cells of islet of Langerhans. Diabetes,
53(4), 998-1006.
Unger, R. H. (1995). Lipotoxicity in the pathogenesis of obesity-dependent NIDDM.
Genetic and clinical implications. Diabetes, 44(8), 863-870.
Unger, R. H., & Zhou, Y. T. (2001). Lipotoxicity of beta-cells in obesity and in other
causes of fatty acid spillover. Diabetes, 50 Suppl 1, S118-121.
Van Assche, F. A., De Prins, F., Aerts, L., & Verjans, M. (1977). The endocrine pancreas
in small-for-dates infants. Br J Obstet Gynaecol, 84(10), 751-753.
van den Hoek, A. M., Voshol, P. J., Karnekamp, B. N., Buijs, R. M., Romijn, J. A.,
Havekes, L. M., et al. (2004). Intracerebroventricular neuropeptide Y infusion
precludes inhibition of glucose and VLDL production by insulin. Diabetes,
53(10), 2529-2534. doi: 53/10/2529 [pii]

Comstock, 162
Varastehpour, A., Radaelli, T., Minium, J., Ortega, H., Herrera, E., Catalano, P., et al.
(2006). Activation of phospholipase A2 is associated with generation of placental
lipid signals and fetal obesity. J Clin Endocrinol Metab, 91(1), 248-255. doi:
jc.2005-0873 [pii]
10.1210/jc.2005-0873
Villar, J., Merialdi, M., Gulmezoglu, A. M., Abalos, E., Carroli, G., Kulier, R., et al.
(2003). Nutritional interventions during pregnancy for the prevention or treatment
of maternal morbidity and preterm delivery: an overview of randomized
controlled trials. J Nutr, 133(5 Suppl 2), 1606S-1625S.
Wagner, J. D., Cline, J. M., Shadoan, M. K., Bullock, B. C., Rankin, S. E., & Cefalu, W.
T. (2001). Naturally occurring and experimental diabetes in cynomolgus
monkeys: a comparison of carbohydrate and lipid metabolism and islet pathology.
Toxicol Pathol, 29(1), 142-148.
Walker, J. N., Ramracheya, R., Zhang, Q., Johnson, P. R., Braun, M., & Rorsman, P.
(2011). Regulation of glucagon secretion by glucose: paracrine, intrinsic or both?
Diabetes Obes Metab, 13 Suppl 1, 95-105. doi: 10.1111/j.1463-
1326.2011.01450.x
Wang, X., Cahill, C. M., Pineyro, M. A., Zhou, J., Doyle, M. E., & Egan, J. M. (1999).
Glucagon-like peptide-1 regulates the beta cell transcription factor, PDX-1, in
insulinoma cells. Endocrinology, 140(10), 4904-4907.
Weir, G. C., & Bonner-Weir, S. (2004). Five stages of evolving beta-cell dysfunction
during progression to diabetes. Diabetes, 53 Suppl 3, S16-21.
Weir, G. C., Marselli, L., Marchetti, P., Katsuta, H., Jung, M. H., & Bonner-Weir, S.
(2009). Towards better understanding of the contributions of overwork and
glucotoxicity to the beta-cell inadequacy of type 2 diabetes. Diabetes Obes
Metab, 11 Suppl 4, 82-90.
Weiss, R., Dziura, J., Burgert, T. S., Tamborlane, W. V., Taksali, S. E., Yeckel, C. W., et
al. (2004). Obesity and the metabolic syndrome in children and adolescents. N
Engl J Med, 350(23), 2362-2374. doi: 10.1056/NEJMoa031049
350/23/2362 [pii]
Whitaker, R. C. (2004). Predicting preschooler obesity at birth: the role of maternal
obesity in early pregnancy. Pediatrics, 114(1), e29-36.
Williams, J. A., & Lee, M. (1976). Microtubules and pancreatic amylase release by
mouse pancreas in vitro. J Cell Biol, 71(3), 795-806.
Wolfe-Coote, S., Louw, J., Woodroof, C., & Du Toit, D. F. (1996). The non-human
primate endocrine pancreas: development, regeneration potential and metaplasia.
Cell Biol Int, 20(2), 95-101. doi: S1065-6995(96)90013-X [pii]
10.1006/cbir.1996.0013
Woods, S. C., Lotter, E. C., McKay, L. D., & Porte, D., Jr. (1979). Chronic
intracerebroventricular infusion of insulin reduces food intake and body weight of
baboons. Nature, 282(5738), 503-505.
Xiao, X. Q., Williams, S. M., Grayson, B. E., Glavas, M. M., Cowley, M. A., Smith, M.
S., et al. (2007). Excess weight gain during the early postnatal period is associated
with permanent reprogramming of brown adipose tissue adaptive thermogenesis.
Endocrinology, 148(9), 4150-4159.

Comstock, 163
Yoon, J. C., Puigserver, P., Chen, G., Donovan, J., Wu, Z., Rhee, J., et al. (2001). Control
of hepatic gluconeogenesis through the transcriptional coactivator PGC-1. Nature,
413(6852), 131-138. doi: 10.1038/35093050
35093050 [pii]
Zhang, L., Long, N. M., Hein, S. M., Ma, Y., Nathanielsz, P. W., & Ford, S. P. (2011).
Maternal obesity in ewes results in reduced fetal pancreatic beta-cell numbers in
late gestation and decreased circulating insulin concentration at term. Domest
Anim Endocrinol, 40(1), 30-39. doi: S0739-7240(10)00097-4 [pii]
10.1016/j.domaniend.2010.08.004
Zhang, X., Zhang, R., Raab, S., Zheng, W., Wang, J., Liu, N., et al. (2011). Rhesus
macaques develop metabolic syndrome with reversible vascular dysfunction
responsive to pioglitazone. Circulation, 124(1), 77-86. doi:
CIRCULATIONAHA.110.990333 [pii]
10.1161/CIRCULATIONAHA.110.990333
Zhu, M. J., Han, B., Tong, J., Ma, C., Kimzey, J. M., Underwood, K. R., et al. (2008).
AMP-activated protein kinase signalling pathways are down regulated and
skeletal muscle development impaired in fetuses of obese, over-nourished sheep.
J Physiol, 586(10), 2651-2664. doi: jphysiol.2007.149633 [pii]
10.1113/jphysiol.2007.149633
Zhu, M. J., Ma, Y., Long, N. M., Du, M., & Ford, S. P. (2010). Maternal obesity
markedly increases placental fatty acid transporter expression and fetal blood
triglycerides at midgestation in the ewe. Am J Physiol Regul Integr Comp Physiol,
299(5), R1224-1231. doi: ajpregu.00309.2010 [pii]
10.1152/ajpregu.00309.2010
Zimmet, P. Z. (1992). Kelly West Lecture 1991. Challenges in diabetes epidemiology--
from West to the rest. Diabetes Care, 15(2), 232-252.