examining the oxidative capacity of the troposphere in the remote tropical western pacific julie...
TRANSCRIPT

Examining the oxidative capacity of the troposphere in the remote tropical Western
Pacific
Julie Nicely23 October 2014University of Maryland
Ross Salawitch, Tim Canty, DanAnderson, Doug Kinnison, Teresa Campos,Cameron Homeyer, Dan Riemer, Andy Weinheimer, et al.

Outline
• Why OH in the tropical western Pacific is of particular interest
• Box modeling method
• Early results:– OH box modeled from CONTRAST data– OH box modeled from CAMChem output– Impact of high O3/low H2O filaments on OH
• Future work
2

Rex et al., ACP, 2014
Sondes, Oct 2009
24 Hr Avg OH,GEOS-Chem
first half Oct 2009
“OH Hole” predicted by Rex et al. in tropical western Pacific
3

24 Hr Avg OH,CAM-Chem
Oct 2008
24 Hr Avg OH,CAM-ChemFeb 2008
Analysis of POLMIP CTM model archive
4
“OH Hole” predicted by Rex et al. in tropical western Pacific

Gao et al., JAC, 2014
Gao et al. (2014) & Rex et al. (2014) associate
NO < 1108 cm3 with this “tropical OH hole”
[NO] this low was rarely seenduring CONTRAST
5
“OH Hole” predicted by Rex et al. in tropical western Pacific...but did NO get low enough?
1.0
0.9
0.8
0.7
0.6
0.5
0.4
0.3
0.2
0.1
0.0
NO
Con
cent
ratio
n (×
109 c
m-3
)
0 20 40 60 80 100O3 Mixing Ratio (ppbv)
16
14
12
10
8
6
4
2
0
Altit
ude
(km
)
CONTRAST

6
Also want to investigate impact of high O3/low H2O on OH

7
Also want to investigate impact of high O3/low H2O on OH

Box Model
8
DSMACC: Dynamically Simple Model for Atmospheric Chemical Complexity tropospheric chemistry box model
that can interface to various chemical mechanisms
-Emmerson and Evans, ACP, 2009
Makes use of the:
KPP (Kinetics PreProcessor)Damian et al., Computers and
Chemical Engineering, 2002.
Leeds Master Chemical MechanismJenkin et al., Atmos. Environ., 1997;Saunders et al., ACP, 2003
Box model can be run with inputs from observations, from a global model, or a combination of both
Box model inputs:all measured on GV
p
T
H2O
O3
CO
CO2
NO
NO2
CH4
Acetone
C3H8
Isoprene
MVK
MACR
CH3OH
CH3CHO
HCHO
J(O1D)
J(NO2)

OHRF07
9
Box Modeling with Data
Flighttrack
Guam

OHRF07
10
Box Modeling with CAM-Chem
Flighttrack
Guam
Box model results with observed inputs
Box model results with CAM-Chem inputs:
Box model is good approximation of CAM-Chem chem mechanism

OHRF07
11
Box Modeling with CAM-Chem + GV O3
Flighttrack
Guam

OHRF07
12
Flighttrack
Guam
Box Modeling with CAM-Chem + GV CO

OHRF07
13
Flighttrack
Guam
Box Modeling with CAM-Chem + GV H2O
OHRF07
14
Flighttrack
Guam
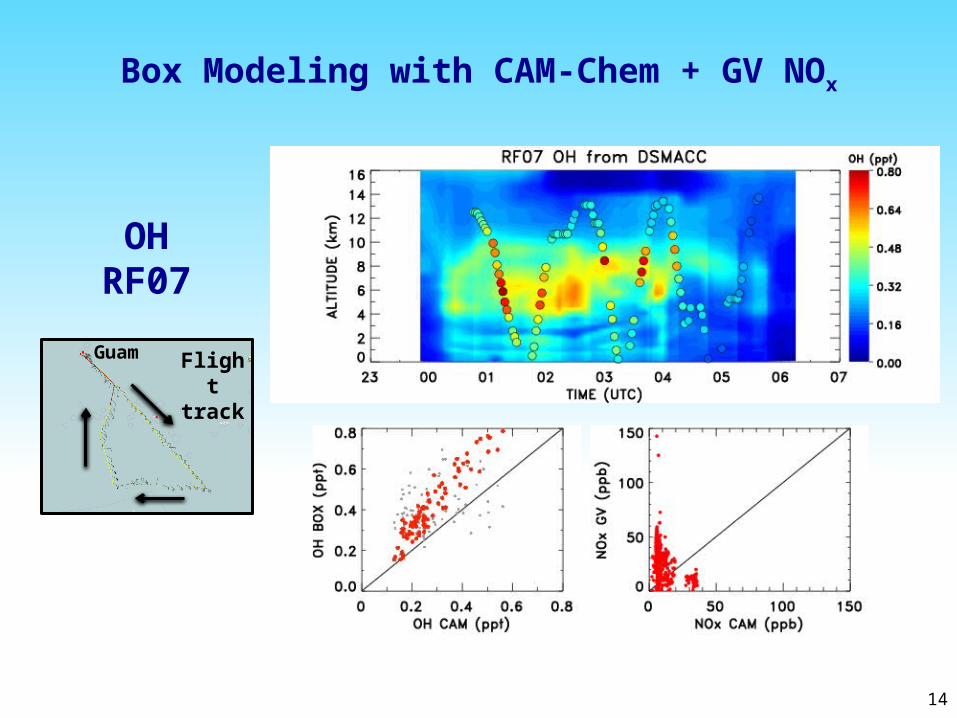
Box Modeling with CAM-Chem + GV NOx

OHRF07
15
Flighttrack
Guam
Box Modeling with CAM-Chem + GV O3+NOx

OHRF12
16
Box Modeling with Data
Flighttrack
Guam

OHRF12
17
Box Modeling with CAM-Chem
Flighttrack
Guam

OHRF12
18
Box Modeling with CAM-Chem + GV O3
Flighttrack
Guam
OHRF12
19
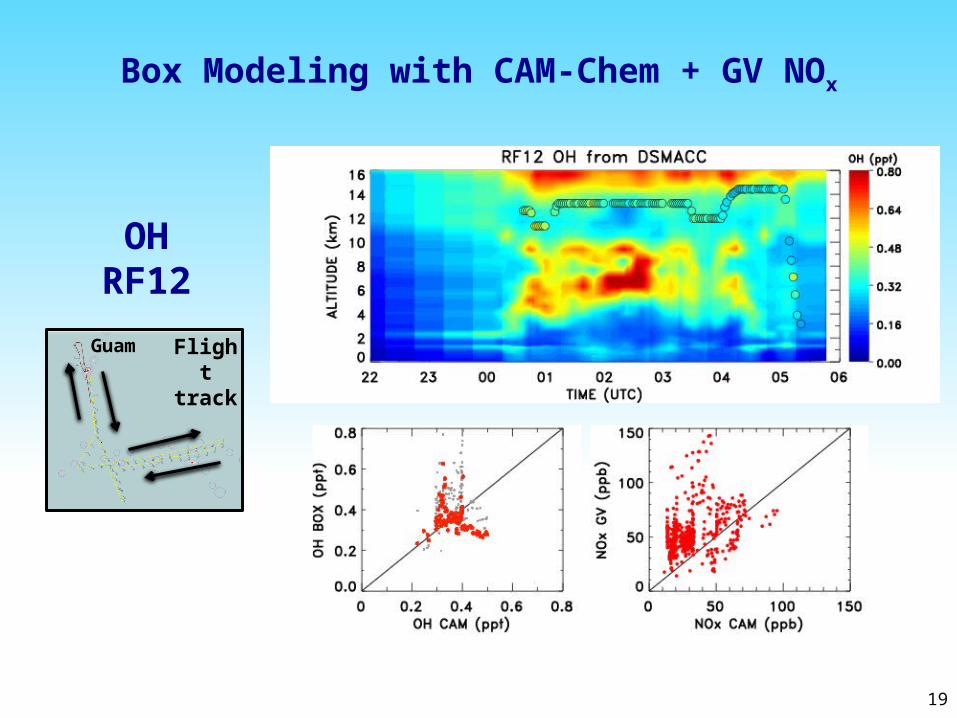
Box Modeling with CAM-Chem + GV NOx
Flighttrack
Guam

OHRF12
20
Box Modeling with CAM-Chem + GV VOCs
Flighttrack
Guam
VOCs = ISOP + C3H8 + CH3COCH3 + MVK + MACR + CH3OH + CH3CHO + HCHO

OHRF12
21
Box Modeling with CAM-Chem + GV NOx+VOCs
Flighttrack
Guam

22
First Look: Effect of O3 filaments
1.) Box model run as if filament doesn’t exist

Elevated O3 causes modeled OH to rise
23
First Look: Effect of O3 filaments
1.) Box model run as if filament doesn’t exist2.) Run with elevated O3, but not low H2O

Elevated O3 causes modeled OH to rise
24
First Look: Effect of O3 filaments
1.) Box model run as if filament doesn’t exist2.) Run with elevated O3, but not low H2O

Elevated O3 causes modeled OH to rise
25
First Look: Effect of O3 filaments
1.) Box model run as if filament doesn’t exist2.) Run with elevated O3, but not low H2O

Depressed H2O causes modeled OH to fallby more than the O3 induced rise
26
First Look: Effect of O3 filaments
1.) Box model run as if filament doesn’t exist2.) Run with elevated O3, but not low H2O3.) Run with elevated O3 and low H2O

Conclusions• Inferred OH doesn’t reach values nearly as low as predicted by Rex et
al. *Analysis is contingent on accuracy of NOx measurements; NOx used
here is in-field, preliminary data
• Effect of low H2O > effect of high O3 on OH in filaments
• CAM-Chem is underestimating OH due to combination of O3, NOx, & VOCs
Future Work• Continue box modeling OH for more flights/as data are revised and
comparing to CAM-Chem
• Continue O3 filament examination: effect on OH & τ’s
• Compare model vs observations in similar air masses– Use tracer-tracer relationships– Independent of whether model predicts filament location 27

28
Backup

29
Δ(OH Column) as a result of swapping fields of CO between CAM-Chem and GMI
Results from neural network analysis of POLMIP CTMs
CAM-Chem + (GMI CO) GMI + (CAM-Chem CO)
Relatively small effect on OH, τCH4 in TWP region

30

OHRF07
31
Flighttrack
Guam
Box Modeling with CAM-Chem + GV VOCs

OHRF07
32
Flighttrack
Guam
Box Modeling with CAM-Chem + GV O3+NOx+H2O

OHRF12
33
Box Modeling with CAM-Chem + GV CO
Flighttrack
Guam

OHRF12
34
Box Modeling with CAM-Chem + GV H2O
Flighttrack
Guam

35

36

37

38
Older analysis
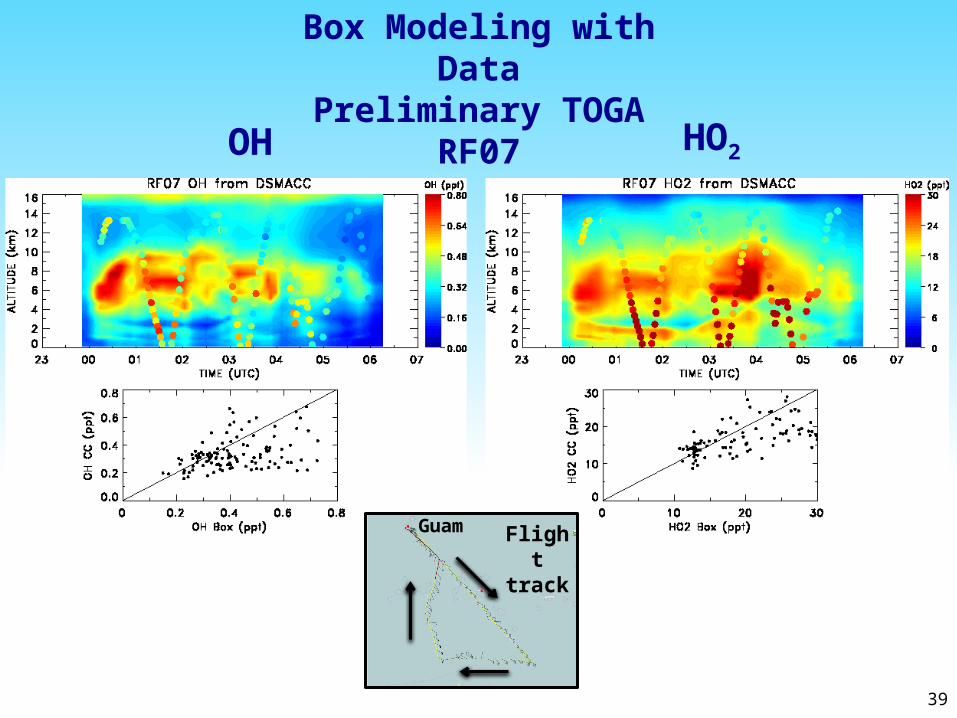
OH HO2
Box Modeling with DataPreliminary TOGA
RF07
39
Flighttrack
Guam

OH HO2
40
Box Modeling with BothData + CAMChem CH4
RF07
Flighttrack
Guam

OH HO2
41
Box Modeling with DataFinalized TOGA/preliminary everything else
RF07
Flighttrack
Guam

OH HO2
42
Box Modeling with CAMChemRF07
Flighttrack
Guam

OH HO2
43
Box Modeling with DataFinalized TOGA/preliminary everything else
RF07
Flighttrack
Guam

OH HO2
44
Box Modeling with BothData + CAMChem CO
RF07
Flighttrack
Guam
OH HO2
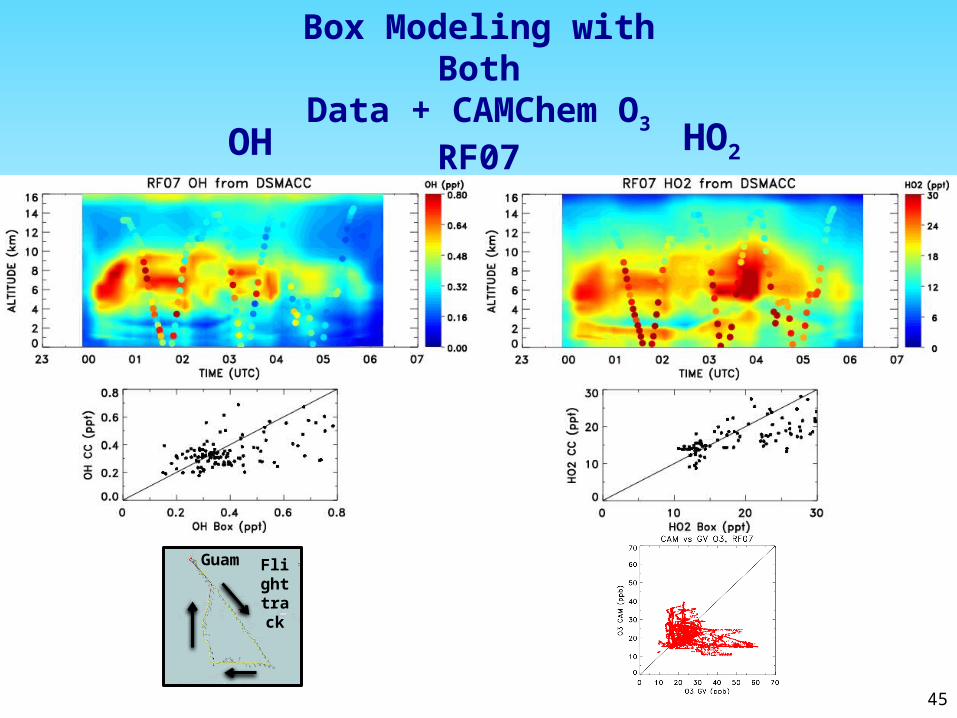
45
Box Modeling with BothData + CAMChem O3
RF07
Flighttrack
Guam