examining the selectivity in the impact of pulmonary p-gp
TRANSCRIPT

i
Examining the selectivity in the impact
of pulmonary P-gp upon the absorption
of its substrates using an IPML model
with knockout mice.
A thesis submitted in accordance with the conditions governing candidates for the degree of
Philosophiae Doctor in Cardiff University
June 2015
Daniel Price
B.Sc.(Hons)
School of Pharmacy
Cardiff University

ii
DECLARATION
This work has not been submitted in substance for any other degree or award at this or any other university or place of learning, nor is being submitted concurrently in candidature for any degree or other award.
Signed ……………………… ………………… (candidate) Date ……16/12/2015……………………
STATEMENT 1
This thesis is being submitted in partial fulfillment of the requirements for the degree of
…………PhD………………(insert MCh, MD, MPhil, PhD etc, as appropriate)
Signed ………………………………………… (candidate) Date ………16/12/2015…………………
STATEMENT 2
This thesis is the result of my own independent work/investigation, except where otherwise stated.
Other sources are acknowledged by explicit references. The views expressed are my own.
Signed ………………………………………… (candidate) Date ……16/12/2015……………………
STATEMENT 3
I hereby give consent for my thesis, if accepted, to be available online in the University’s Open
Access repository and for inter-library loan, and for the title and summary to be made available to
outside organisations.
Signed ………………………………………… (candidate) Date ……16/12/2015……………………

iii
Student ID Number: C1144707
Summary of Thesis:
P-glycoprotein is an ATPase binding cassette (ABC) drug-transporter protein represented by MDR1 in
humans and mdr1a and mdr1b in mice. The substrate specificity of this protein is unusually large due
to the polyspecific nature of its binding pocket and as a result a wide range of endogenous and
exogenous compounds are effluxed by this transporter. There is a large body of literature about the
role of P-glycoprotein in limiting the absorption of drug substrates at a number of barriers but
currently data in the lung is limited. P-gp expression and localisation studies have confirmed its
presence in lung tissue but there is conflicting data with regards to the functional relevance on lung
absorption.
The aims of this project were to establish a knockout, mdr1a/b (-/-), isolated perfused mouse lung
model (IPML) to investigate the role of pulmonary P-gp upon lung delivery. Utilising the lungs of
knockout mice in the IPML allowed the investigation of P-gp function with the effects of chemical
inhibition which may have resulted in the discordance observed in its functional significance in the
literature.
IPML experiments were conducted with a panel of 18 P-gp substrates which were chosen for
diversity in their physicochemical characteristics. The discordance in P-gp functionality in the lung
observed in the literature was replicated in the IPML model. Ten of the substrates showed significant
efflux from the lung by pulmonary P-gp whereas the absorption of the remaining eight was
unaffected.
Further studies into the mechanism behind the differential effects of pulmonary P-gp showed that it
was a barrier specific effect as it was not observed in the intestine. The effect was also not explained
by differences in the P-gp binding kinetics off the substrates.
Investigations in to the membrane affinity of the panel revealed a potential mechanism for the
selectivity of P-gp in the lung with regards to the passive permeability of the molecules and
specifically the paracellular pathway.

iv
Table of contents
Declaration …………………………………………………………………………………………………………………………………. ii
Summary of thesis ………………………………………………………………………………………………………………………. iii
Table of contents ………………………………………………………………………………………………………………………… iv
Abbreviations list ………………………………………………………………………………………………………………………… vi
Chapter 1. General Introduction…………………………………………………………………………………………………. 1
1.1 Lung Transporters and recognized impact on pulmonary transport…………………………. 2
1.2 P-gp efflux – the effect of passive membrane permeability…………………………….. ……… 6
1.3 Lung perfusion models in physiology and pharmaceutical sciences…………………………. 7
1.4 Thesis aims and objectives……………………………………………………………………………………….. 9
Chapter 2. Development and Validation of the IPML……………………………………………………............. 11
2.1 Introduction…………………………………………………………………………………………………………………………. 12
2.1.1 General lung physiology………………………………………………………………………………………… 13
2.1.2 IPL models for drug absorption……………………………………………………………………………… 15
2.1.3 Experimental Objectives………………………………………………………………………………………… 17
2.2 Materials and Methods …………………………………………………………………………………………………………. 18
2.2.1 IPML setup…………………………………………………………………………………………………………..... 18
2.2.2 IPML surgery…………………………………………………………………………………………………………… 21
2.2.3 Dosing strategies……………………………………………………………………………………………………. 24
2.2.4 Absorption studies…………………………………………………………………………………………………. 29
2.3 Results……………………………………………………………………………………………………………………………………. 34
2.2.1 IPML tissue viability………………………………………………………………………………………………… 34
2.2.2 Dosing validation…………………………………………………………………………………………………….. 35
2.2.3 IPML validation – permeability……………………………………………………………………………….. 38
2.4 Discussion………………………………………………………………………………………………………………………………. 42
Chapter 3. Generation and validation of mdr1a/b (-/-) mice…………………………………………………….. 47
3.1 Introduction…………………………………………………………………………………………………………………………... 48
3.1.1 Literature pharmacokinetic (PK) studies utilising P-gp deficient mice…………………….. 48
3.1.2 Experimental objectives…………………………………………………………………………………………. 51
3.2 Materials and Methods………………………………………………………………………………………………………… 52
3.2.1 Establishing a mdr1a/b (-/-) and mdr1a/b (+/+) breeding colony…………………………… 52
3.2.2 Validation of the knockouts – absorption experiments …………………………………………. 55
3.3 Results …………………………………………………………………………………………………………………………………… 58
3.3.1 Evidence of genetic knockout…………………………………………………………………………………. 58
3.3.2 Absorption experiments – IPML…………………………………………………………………………….. 59
3.4 Discussion ……………………………………………………………………………………………………………………………… 62
Chapter 4. Pulmonary absorption in the IPML with mdr1a/b (-/-) mice……………………………………. 64
4.1 Introduction…………………………………………………………………………………………………………………………… 65
4.1.1 Pulmonary expression of P-glycoprotein ………………………………………………………………. 65
4.1.2 IPL studies to investigate drug transporters ………………………………………………………….. 68
4.1.3 Experimental objectives ………………………………………………………………………………………… 68
4.2 Materials and Methods …………………………………………………………………………………………………………. 69
4.2.1 Materials ……………………………………………………………………………………………………………….. 69

v
4.2.2 Analytical methods ………………………………………………………………………………………………… 71
4.2.3 Absorption experiments ………………………………………………………………………………………… 75
4.3 Results …………………………………………………………………………………………………………………………………… 80
4.3.1 HPLC-MS/MS Validation, Precision and Accuracy …………………………………………………. 80
4.3.2 Absorption experiments – IPML ……………………………………………………………………………. 83
4.3.3 Pharmacokinetic analysis ……………………………………………………………………………………….. 95
4.4 Discussion ……………………………………………………………………………………………………………………………… 100
Chapter 5. Intestinal absorption in an Ussing chamber …………………………………………………………….. 108
5.1 Introduction ………………………………………………………………………………………………………………………….. 109
5.1.1 Intestinal P-gp expression ……………………………………………………………………………………… 109
5.1.2 Balancing intestinal P-gp efflux and passive permeability ……………………………………… 112
5.1.3 Experimental objectives ………………………………………………………………………………………… 114
5.2 Materials and Methods ……………………………………………………………………………………………………….. 115
5.2.1 Ussing chamber studies of intestinal absorption ……………………………………………………. 115
5.2.2 In vitro assessment of P-gp binding kinetics …………………………………………………………… 118
5.3 Results …………………………………………………………………………………………………………………………………… 121
5.3.1 Ussing chamber studies of intestinal absorption ……………………………………………………. 121
5.3.2 In vitro assessment of P-gp binding kinetics ………………………………………………………. 126
5.4 Discussion ……………………………………………………………………………………………………………………………… 129
Chapter 6 Physicochemical properties and membrane affinity..……………………………………………….. 135
6.1 Introduction …………………………………………………………………………………………………………………………… 136
6.1.1 Physicochemical characteristics for predicting membrane interaction ………………….. 137
6.1.2 Experimental methods for predicting membrane interaction ………………………………… 138
6.1.3 Experimental objectives …………………………………………………………………………………………. 141
6.2 Materials and Methods …………………………………………………………………………………………………………. 142
6.2.1 IAM chromatography …………………………………………………………………………………………….. 142
6.2.2 Liposome partitioning ……………………………………………………………………………………………. 142
6.2.3 Computer generated physicochemical properties …………………………………………………. 143
6.3 Results …………………………………………………………………………………………………………………………………… 145
6.3.1 IAM Chromatography ……………………………………………………………………………………………. 145
6.3.2 Liposome partitioning …………………………………………………………………………………………… 146
6.2.3 Physicochemical properties …………………………………………………………………………………… 146
6.4 Discussion …………………………………………………………………………………………………………………………….. 149
Chapter 7. General Discussion …………………………………………………………………………………………………. 151
Chapter 8. Appendix 1 ………………………………………………………………………………………………………………. 156
References ………………………………………………………………………………………………………………………………….. 158

vi
Abbreviation list
ABC – ATP binding cassette
ATP – Adenosine triphosphate
BBB – Blood-brain barrier
BCRP – Breast cancer resistance protein
DMSO – Dimethyl sulfoxide
GSK – GlaxoSmithKline plc.
HPLC – High-performance liquid chromatography
IAM – Immobilised artificial membrane
IPML – Isolated perfused mouse lung
IPRL – Isolated perfused rat lung
KH – Krebs-Henseleit buffer
LCMS – Liquid chromatography mass spectrometry
LC-MS/MS – Liquid chromatography tandem mass spectrometry
MLV – Multilamellar vesicles
mRNA – Messenger RNA
MRP – Multidrug resistance-associated protein
NHBE – Lonza’s normal human bronchial epithelial cells
OAT – Organic anion transporter
OATP – Organic anion-transporting polypeptide
OCT – Organic cation transporter
OCTN – Sodium dependent organic cation transporter
PBS – Phosphate buffered saline
PC – Phosphatidylcholine
PG – Phosphatidylglycerol
PD - Pharmacodynamics
P-gp – P-glycoprotein

vii
PK - Pharmacokinetics
pMDI – Pressurised metered dose inhaler
SAR - Structure-activity relationship
SLC – Solute carrier

1
Chapter 1
General Introduction

2
1. GENERAL INTRODUCTION
1.1 Lung Transporters and recognised impact on pulmonary transport
The role of drug-transporters in the absorption and distribution and elimination of low-molecular
weight drugs is increasingly well studied at a range of barriers including the lung. The current
knowledge of the pulmonary expression and function of drug-transporters places emphasis on three
families of transporter proteins, the ABC binding cassette proteins (including P-gp, MRP and BCRP),
the solute carrier proteins (including the OCT and OCTN proteins) and the organic anion transporters
(OATs and OATPs).
Despite the recent increase in the interest of pulmonary transporters the determination of their
effects upon pulmonary pharmacokinetics suffers from a shortage of information. It is the case that
for many of the pulmonary transporters data on their localisation within the lung is scarce or
contradictory and experiments of transporter functionality in whole lung assays is limited.
ABC binding cassette proteins
P-glycoprotein (P-gp)
P-gp belongs to the ABC subfamily B (ABCB1) and is perhaps the most extensively studied
transporter across all barriers. The importance of P-gp to drug disposition is due in part to its large
substrate specificity. The crystal structure of P-gp has been elucidated and has led to a greater
understanding of the reason for this broad range of substrates (1). The crystal structure of P-gp
shows a large binding pocket wherein drug binding is mediated by mainly hydrophobic and aromatic
residues located on β-sheets. Aromatic and hydrophobic residues are especially prevalent towards
the upper half of the binding pocket, the lower half possessing more polar and charged residues.
These charged residues may accommodate the binding of positively charged hydrophobic substrates
and subsequently neutralise the charge. Crystal structures generated with P-gp bound to substrate
highlight the numerous distinct binding sites within the binding pocket that are thought to be the
cause of the broad substrate specificity.
Even though the substrates of P-gp cover a broad range of physicochemical parameters they do
share similarities. P-gp substrates tend to be large lipophilic or amphiphilic planar molecules which
are able to form weak hydrogen bond associations and often express a weak or delocalised positive
charge (2–4).

3
P-gp expression in the lung has now been demonstrated by multiple groups at both the genetic and
protein level. The expression has been localised to a range of pulmonary tissues known to be
important for drug absorption. These studies as well as the functional evidence generated from in
vitro, ex vivo and in vivo absorption studies is discussed in detail in chapter 4.
Breast cancer resistance protein – BCRP
BCRP (ABCG2) is a member of the ATP binding cassette (ABC) transporters expressed on the apical
membranes of epithelial cells where it acts as an efflux transporter for a range of exogenous
chemicals from anti-cancer drugs to ion channel blockers.
Data for BCRP activity within the lung is sparse with much fewer studies performed than for the well
characterised ABC transporter P-gp. In 2007, Bleasby (5) studied the relative levels of transporter
protein mRNA in many organs across a range of species. In the case of BCRP in the lung the
expression levels were found to be in the moderate to higher quartile (50-75%) in human lungs.
Further investigations were reported across a range of species including dog and rodent, although
expression levels were lower in rodent lungs. This relatively high expression of pulmonary BCRP has
also been observed by two recent studies in both human lung tissue (6) and immortalised human
lung cell lines (7). In these studies it was observed that BCRP protein levels were the third highest of
all transporters analysed, with only the expression of MRP1 and OCTN1 higher.
This relatively high level of mRNA presence in the lung is represented by the expression of the
protein in in vitro cell culture models. In both Calu-3 and 16HBE14o- cells BCRP expression is
observed (8) although the protein is much more highly expressed in the 16HBE14o- cell line in which
it appears overexpressed.
There are few studies in the literature which have investigated the expression at a protein level and
those present appear contradictory. Work by Fetsch et al (9) using immunostaining techniques
showed expression of BCRP within unspecified alveolar pneumocytes (it was not mentioned whether
these were type I or II or both) and little or no staining of the bronchial epithelia. Discordantly to this
observation, earlier work by Scheffer (10) had seen staining of the bronchial epithelial cells and
endothelial capillaries but not in alveolar pneumocytes. It appears that staining for the presence of
BCRP protein produces varying apparent expression patterns dependent on the stains and
techniques used. It is however likely that given the staining seen and the high levels of mRNA
present in lung homogenate and in vitro cell lines that BCRP is present in the lung and if assumptions
are drawn from other barriers this is likely to be expressed on the apical membranes of epithelia
cells.

4
Multidrug Resistance Proteins
The MRPs are members of the ABC subfamily of ATPase binding cassette (ABC) transporters which
consists of at least 13 separate transporters. Of these MRP1 is amongst the most well studied and
functions primarily as a co-transporter of glutathione, glucuronic acid or sulphate conjugated drugs;
usually at the basolateral membrane of cells. It was primarily identified due to a role in
chemotherapy resistance of cancer but plays a role in the pharmacokinetics of many non-cancer
drugs as well with relatively large substrate specificity. In the lung the protein is of interest as it has
been reported that MRP1 reduces the oxidative stress generated by smoking and therefore may play
a therapeutic role in COPD.
The microarray work of Bleasby (5) identifies MRP1 expression as moderate to high (50-75%) in the
human and rodent lung, a finding corroborated by other mRNA based studies (11).
The work with mRNA is backed up by evidence of protein staining from intact lungs. Initial work by
Flens et al in 1996 (12) used immunostaining of wax embedded lung sections to show expression of
MRP1 in a normal lung, this was seen as localised around the apical region of the cytoplasm of
bronchial epithelia cells. The same study also shows strong expression of the protein using Western
blot analyses. Two later studies confirmed the presence of MRP1 using immunohistochemical
techniques but instead of localisation below the cilia these studies witnessed localisation of MRP1
on the basolateral membrane (10,13); a finding common with the proteins expression at other
barriers. This evidences of the presence of MRP1 is corroborated by a recent study utilising LC-
MS/MS techniques to analyse the levels of a variety of transporters from human lung tissue (6). The
study found the expression of MRP1 in the human lung was high, second only to OCTN1.
In 2009 a study by Endter et al investigated the expression of a wide range of transporters within in
vitro cell models of respiratory cell lines (8). This study found evidence of a high level of MRP1
expression in all cell lines studied. This in vitro activity has been confirmed using functional studies
by measuring the reduction in efflux of the substrate carboxydichlorofluorescein in the presence of
an MRP inhibitor MK-571 (14).
Despite a large number of studies using in vitro cell lines to study the possible roles of MRPs in lung
tissue, functional data from an intact lung system is not available. Given the proteins potential role
in the protection against oxidative stress in smokers it is of great interest as a lung transporter. The
data currently available provides very strong evidence for the presence of MRP1 within the lung,
particularly at the basolateral membrane of bronchial epithelia, however this does need to be
corroborated with whole lung functional transporter assays.

5
Organic cation transporters – OCT/N
The OCT proteins are members of the solute carrier (SLC22A) superfamily of proteins. They function
as facilitative transporters able to carry a range of endogenous and exogenous molecules across the
plasma membrane in either direction.
Localisation
By utilising rtPCR a number of groups have observed the expression of OCT/N in both human and
rodent species. Lips et al. have shown the expression of OCT1-3 in human (15)and mouse (16)
epithelia from the trachea and bronchi. The same study reported the protein expression of OCT1,
OCT2 and OCT3 on the apical membrane of ciliated epithelial cells of the trachea and bronchi, it is
noted that the level of OCT3 was lower than that of OCT1 and OCT2. The group also showed strong
staining of OCT3 on the membranes of basal cells. As well as the presence of the OCTs the
expression of OCTN1 and OCTN2 has also been observed in the mouse lung (17). A recent study by
Sakamoto et al. investigating the expression of a wide range of transporters in human lung tissue by
LC-MS/MS has also shown the presence of OCT1, OCT2 and OCTN1. Indeed, the levels of OCTN1
were the highest observed for any transporter in the study.
A microarray analysis performed by Bleasby et al. has also shown transcripts of OCT1-3 and OCTN1-2
to be present in the lung (5). The study showed expression of OCT2 to be in the lower quartile in the
lung, OCT1 and OCT3 were in the moderate quartile and the expression levels of OCTN1 and 2 were
considerably higher in the 50-75 % quartile. It is worth noting that the sampling in the microarray
analysis was performed on whole lung homogenates. This means it is possible high levels of localised
transporter expression in the lung could be diluted by non-expressing tissues in the sample.
The high levels of OCTN1-2 expression seen in the microarray analysis have also been corroborated
in later studies. Horvath et al. observed relatively high expression of OCTN1 and OCTN2 transcripts
in the epithelial cells of the human airway (18). This mRNA expression was corroborated by
localisation of OCTN1 and OCTN2 protein in the airways and strong expression of OCTN2 in the
alveolar epithelium. Further, the levels of OCTNs in a range of respiratory epithelial cell models has
been shown to be higher than that of the OCTs (8).
Function
A number of the drugs routinely delivered to the lung have been identified as substrates for the
OCT/N transporter proteins. For example, salbutamol and formoterol have both been shown to
modulate the uptake of model cation substrate in in vitro human bronchial cell lines (18,19).

6
However, despite identifying inhaled drugs which interact with OCTs there is no direct evidence
available for a role for the transporters in the pulmonary pharmacokinetics of these drugs.
Organic anion transporters (OATs) and organic anion transporting peptides (OATPs)
The OATs and OATPs belong to the solute carrier family of proteins (SLC22 and SLC21, respectively).
Despite implications of a possible role for these transporters at a number of barriers there is a
distinct lack of data with regards to their lung distribution.
A review of the relevant data on OAT mRNA expression within the lung (20) concluded that this
family of transporters are absent from the lung. It is the case that the microarray study by Bleasby et
al. recorded no expression for 5 of the 6 isoforms, although the study did suggest relatively high
expression of OAT2 in pulmonary tissue (5).
Conversely, the expression of a range of the OATP isoforms has been detected in the lung tissue. At
the mRNA level the expression of OATP4A1 was shown to be very strong in lung tissue, OATP3A1
and OATP2A1 also showed strong expression with lower levels of expression seen for OATP2B1 (21).
The microarray analysis of Bleasby et al. is in agreement with these findings with similar high
expression of these OATPs observed whilst the expression of the other OATPs were in the lowest
quartile, essentially absent from the lung (5).
1.2 P-gp efflux – the effect of passive membrane permeability
It is now generally accepted that P-glycoprotein is present within the lung tissue, a finding
corroborated by studies across multiple groups, however, functional studies in intact lungs have so
far provided conflicting data. The effect of P-gp upon the absorption of rhodamine 123 and digoxin
from an intact lung has been investigated in multiple studies and in both mice and rat lungs (22–25).
Despite both molecules being well established substrates in both in vitro assays and as seen by efflux
in the intestine the effect of P-gp upon their pulmonary absorption has proved discordant.
The absorption of rhodamine 123 has been assessed from an IPRL model. The study shows the
absorption of rhodamine 123 from the rat lungs is a saturable process, suggesting an active
component in the pulmonary absorption of rhodamine 123. The active component was identified as
P-gp by studies with a chemical inhibitor (GF120918). The absorption of rhodamine 123 was
significantly increased in the presence of the chemical inhibitor providing strong evidence for an
effect of P-gp to attenuate the pulmonary absorption of this substrate (22).

7
Subsequent studies utilising digoxin as the model substrate did not show the same effect of P-gp. In
a study comparable to that of rhodamine 123 the addition of a P-gp inhibitor did not enhance
pulmonary absorption of digoxin. Likewise, absorption from the lungs of spontaneous mdr1a (-/-) CF-
1 mice was no different to that from the wild type counterparts. This data would suggest that
pulmonary P-gp does not play a role in the absorption of digoxin.
This discordance in the efflux of recognised substrates has been observed at other barriers and
attributed to the contribution of passive transport overcoming P-gp efflux. A more complete
discussion of the mechanism behind this is presented in chapter 5. Briefly, as explained earlier P-gp
substrates tend to be lipophilic molecules which partition readily to the membrane. Absorption of
these drugs across a membrane is not that of a continuous diffusion gradient, rather they are
absorbed by distinct flip-flop events whose rate is compound specific. The flip-flop event is a
mechanism of transport across a lipid bilayer (26) and explained in detail in chapter 6. The flip-flop
event is the rate limiting step in passive absorption for these molecules and therefore determines
the transmembrane movement rate. Work by Eytan et al. (26) has shown that the rate of these flip-
flop events contributes to the overall net effect of efflux. In some cases, as for verapamil, the rate of
transmembrane movement is significantly higher than the possible extrusion rate of P-gp. Therefore,
despite being a P-gp substrate with good affinity to the protein verapamil absorption across a P-gp
expressing membrane is unaffected by efflux.
In this thesis this contribution of passive permeability to the overall effect of efflux will be repeatedly
discussed as to its role in pulmonary efflux. The evidence provided by studies in the intestine will be
used to develop a hypothesis for the discordance in pulmonary efflux and ultimately used to predict
pulmonary drugs likely to exhibit efflux from the lung.
1.3 Lung perfusion models in physiology and pharmaceutical sciences
History of the technique
Isolated organ perfusions have been utilised for the study of physiology since the mid 1800’s.
Isolated organs proved vital tools for many early scientific discoveries such as the work of Claude
Bernard on the role of the pancreas in digestion and the glycogenic function of the liver.

8
The original uses of the lungs in isolated organ models was a respirator for heart-lung preparation
(27,28) in which it functioned purely to maintain the viability of the heart tissue. The use of the
isolated perfused lung (IPL) itself as a model for studying lung physiology began in the 1950’s. The
initial lungs utilised were those of the larger species such as rabbits, dogs and guinea pigs (29)
presumably due to the relative ease of their setup and maintenance.
The first documented use of the isolated perfused rat lung (IPRL) came shortly after in 1970 by Leary
and Smith. The model used in these primary experiments was developed and represented the first
standardised IPL model from which current IPL setups are established. Following the development of
these early IPL protocols the usage of the technique has increased and as a consequence there now
exists a variation of preparations regularly utilised for studies of lung pharmacology. This range of IPL
preparations are routinely utilised for a wide array of investigations including drug delivery
applications, drug discovery, physiology and histology.
Adaptation for drug absorption and deposition studies
The use of the IPL model for drug absorption studies was pioneered by the studies of Ryrfeldt et al.
in the lungs of rats and guinea pigs. The group utilised the model to investigate the absorption of a
range of molecules including but not limited to ibuterol, terbutaline (30) and budesonide (31). The
group not only utilised the IPL models for the study of drug absorption but also applied it to studies
of pharmacodynamics of drugs delivered both in the perfusate and as aerosol doses.
One particular IPRL setup, that of Byron and Niven (32), stands out as a model that has been used
repeatedly to investigate drug deposition and absorption from the lung (32–34).The Byron and Niven
model allows the delivery of an aerosolised dose to the rat lungs in a manner more consistent with
human dosing than the tracheal instillation commonly used in vivo. This model allowed the
development of the IPL preparations for the purpose of drug delivery and absorption investigations,
a field in which they are now routinely used. There now exists a body of data on the absorption of a
range of solutes from the Byron and Niven model (34–37) and it has been established as the
standard model in this field. Another example of the use of IPL experiments in drug absorption
studies is the work of Tronde. A large study by Tronde generated absorption profiles of a range of
inhaled drugs from the IPRL and determined the physicochemical properties which resulted in
enhanced absorption from the lungs (38).
Compared to in vivo models the IPL experiments allow increased control over the ventilation and
perfusion of the lung as well as facilitating dosing strategies unavailable in in vivo experiments. The

9
ease of sampling and ability to sample multiple times from the same animal an absorption profile
can be determined from a single lung and therefore without the inter-animal variability necessary
with in vivo investigations. This also has the benefit of markedly reducing the animal usage of the IPL
models. The absorption profile is also generated without the confounding effects of systemic ADME
present in whole body studies.
Isolated perfused mouse lung studies of absorption
As discussed more fully in chapter 2, there is currently little data on the use of an isolated perfused
mouse lung (IPML) for studies of drug absorption. However the model is particularly well used for
studies of pharmacodynamic effects such as vasoconstriction and mediator release (39–43). These
studies of pharmacodynamics provide sufficient data on the methodology of the IPML to adapt the
model of Byron and Niven for use with the mouse lungs.
The prevalence of data for the IPML is pharmacodynamic studies is in party due to the availability of
a number of knockout mice strains. The adaption of the IPML for the absorption studies will enable a
similar use of a range of genetic knockouts to elucidate the role of transporters upon pulmonary
pharmacokinetics, of particular interest here are mdr1a/b (-/-) mice.
1.4 Thesis aims and objectives
The adaptation of a current IPRL setup for use with mouse lungs.
o Validate the setup and maintenance of the IPML by determining tissue viability over
the time course of the experiments.
o Develop a means of reproducible aerosol dose to the mouse lungs with deposition at
the absorptive airways.
o Validate the barrier properties of the IPML by the absorption of paracellular probes
o Investigate the applicability of the IPML to drug transporter studies by investigating
the absorption of digoxin and rhodamine 123 with chemical inhibition and
comparing the effect of P-gp to that seen previously in the literature.
Establish a stable breeding colony of both mdr1a (-/-) and (+/+) mice in order to investigate
the effect of P-gp knockout in the IPML.
o Validate the ability of the knockout model to identify P-gp mediated effects by
comparing the absorption of rhodamine 123 and digoxin to that obtained in CD1
mice with chemical inhibition.

10
Investigate the absorption of a panel of P-gp substrates in the IPML with both knockout and
wild type mice. The panel will then form the dataset used to investigate the discordance
seen in digoxin and rhodamine 123 absorption.
Investigate the effect of P-gp upon the intestinal absorption of the panel as a means of
identifying if the discordance seen in the lung is present at other barriers.
Establish the P-gp binding kinetics of the panel in order to investigate whether the
discordance in efflux is attributable to variations in the affinity of the substrates to P-gp.
Investigate the membrane partitioning in both an IAM and liposome experiment. This will be
used to advance the hypothesis for the role of passive permeability in the discordance seen
in the lung by highlighting the possible importance of the paracellular pathway in this organ.
The physicochemical properties of the panel will then be established and used as a
predictive tool to highlight other substrates which may show P-gp attenuated absorption in
the lung.

11
Chapter 2
Development and Validation of the IPML

12
2.1 INTRODUCTION
2.1.1 General Lung Physiology
The airways
The primary function of the lung is to facilitate the gaseous exchange between inspired air and the
circulatory system, i.e. the oxygenation of the blood and removal of carbon dioxide from the body.
For optimum efficiency this process requires a large surface area for gaseous exchange coupled with
ample blood perfusion to the gas exchange tissues. As a consequence of the large surface area and
thin barrier properties of the lung it is a promising route for drug delivery for both local and systemic
actions (44,45).
As a result of its function the mammalian lung is a particularly heterogeneous organ consisting of
over 60 cell types in two main regions (46). The upper region of the lung, roughly 10 % of the volume
of the lung, forms the conducting region of the airways. As shown in figure 2.1.1 this region consists
of the sinuses, nasal cavity, pharynx, larynx (all not shown), trachea, bronchi and bronchioles. At the
bifurcation, at the terminus of the trachea, the airways split in to two branches forming the bronchi;
each subsequent airway bifurcation results in an exponential increase in airway surface area and a
decrease in epithelial cell size. In humans the conducting region of the airways is generally formed
from generation 0-16 (trachea to terminal bronchioles) whilst generations 17-23 form the
respiratory region. However, the number of airway branchings before the respiratory region is
reached can vary greatly from as few as 6 to as many as 30 (47).

13
Figure 2.1.1 A schematic of the airway branching of the lung highlighting the two main regions, the conducting and respiratory zones. Taken from Patton, 1996 (48).
The respiratory region accounts for the majority of lung tissue, roughly 85 % of the total lung
volume, and is composed of alveolar epithelial cells and the capillary bed on either side of a thin
basement membrane (46). The alveolar region is the most important for both gaseous exchange and
drug absorption. The region consists of epithelial type I and II cells, brush cells and alveolar
macrophages. From a drug delivery perspective absorption across the alveolar type I cells is the
most prevalent route of transcellular absorption with regards to absorption from the lung; they have
a smaller cell thickness, fewer organelles, higher cytoplasmic volume and cover the majority of the
alveolar surface (roughly 96%) in comparison to the type II cuboidal cells (49). The effect of lung
physiology on drug absorption is discussed in more detail in chapter 5, where it is compared with the
intestine with regards to their drug permeability.
Respiratory rates and volume
The tidal volume of the lungs is a measure of the total volume of air inspired and expired
with a normal breath and is well below the maximum volume (vital capacity) of the lung. For the
mouse lung the tidal volume differs across strains and ages and averages approximately 0.2 mL for
mice of 9-12 weeks of age (50). Similarly, the respiratory rate of the mouse has also shown variability
between strains and animal sizes with documented rates of between 60 and 230 breaths/min

14
(51,52). The lung must be inflated with an adequate volume and rate to prevent the collapse of the
respiratory surfaces, atelectasis.
Blood circulation to the lungs
The circulatory system of the mouse lungs is distinct from that of other common laboratory lung
models, e.g. rat lungs, due to the lack of a bronchial circulation in the upper airways of the mouse
(53). In the majority of model mammalian species the blood is perfused through the lungs as part of
two separate circulations (54). The conducting region of the airways is perfused by the bronchial
circulation, connected to the systemic circulation of the body. As such the bronchial circulation
receives approximately 1% of the cardiac output and provides oxygenated blood and nutrients to the
trachea and bronchioles. It has been suggested that the bronchial circulation may play an important
role in the uptake of systemic drugs to the lung (55).
The respiratory regions of the airways are perfused by the pulmonary circulation. Here the blood
supply originates from the pulmonary artery and consequently provides the complete cardiac output
to the alveolar capillaries. This ensures efficient gas exchange due to the low oxygen concentration
of the blood as well as providing nutrients to the alveolar cells. The two circulations are not
completely distinct and are linked by anastomoses in the bronchioles of the lung (56).
The lack of the bronchial circulation in the mouse lung sets it apart from the lungs of the rat and
larger mammalian models in that no systemic (bronchial) circulation is present (53). The entirety of
the lung’s blood supply is delivered by the pulmonary circulation, i.e. both the conducting and
respiratory regions are perfused by the pulmonary circulation. As the entirety of the lungs blood
supply therefore originates from the pulmonary artery it is possible to determine the rate of
perfusion of the lung vasculature by measurements in the pulmonary artery. Previous literature
suggests the heart rate of a mouse is approximately 450 beats per minute and produces a mean
blood velocity of 90 cm/s. As the aortic diameter of a mouse is approximately 1.2 mm the resulting
perfusion rate to the lungs is 14.8 mL/min (57).
With regards to the isolated perfused lung (IPL) studies the presence of a singular pulmonary
circulation may prove advantageous for the mouse lung model. In the IPL models perfusion is
achieved by cannulation of the pulmonary artery and therefore, perfusion occurs through the
pulmonary circulation. In the rat and other models this results in limited perfusion of the conducting
region due to the restricted supply of blood/perfusate via the anastomoses of the two circulations.
For studies which are influenced by events in the upper airways it may be the case that a mouse lung

15
model may prove advantageous as the conducting regions would be perfused to a normal
physiological level.
2.1.2 IPL models for drug absorption
The IPL model is now well established for studies of lung physiology and drug absorption, as
discussed in chapter 1. In comparison to in vivo studies the IPL provides a model with precise control
over perfusion and ventilation, simple administration to the airways or blood and easy sampling of
the perfusate or lavage fluid with ready determination of mass balance. Also, as the organ is isolated
from the systemic circulation it is possible to study lung specific events in an intact lung without the
confounding effects of systemic actions (58). The IPL model may also prove more ethically sound as
multiple samples can be taken from the perfusate following drug administration whereas in an in
vivo model an animal would be sacrificed at each time point. This has the additional benefit of
reducing inter-animal variability in drug absorption. The major limitation of the IPL is the period of
viability, for the rat lungs this is approximately 3-5 hours and is considerably lower in mice with
viability of 1-2 hours common. However, for the study of the absorption of low molecular weight
drugs this may prove adequate as the absorption of these molecules from the lung tends to be
relatively rapid. Currently, most reports utilising the IPL for drug delivery applications have been in
the form of the isolated perfused rat lung (IPRL) and these have been summarised previously by
Tronde (59).
Despite the lack of literature reporting drug absorption from an IPML the model is well established
for investigations of lung physiology. The model is particularly well used for studies of pulmonary
vasoconstriction and mediator release (39–43) where knockout mice strains for relevant proteins
provide a useful insight in to the physiological mechanisms in an intact organ. The IPL lends itself
well to these studies as the physical effects of vasoconstriction are easily measured by increases in
pressure at the perfusate pump and regular samples can be taken from the perfusate to measure
the release of mediators such as cytokines. The use of the isolated perfused mouse lung in published
literature is discussed in more detail in chapter 1.
These physiological studies provide useful information on the mechanics of performing an IPML,
such as ventilation rates, tidal volumes and perfusion flow rates. Past research using IPML models
has used perfusate flow rates of 1 mL/min (60–64), approximately 7% of the total cardiac output
received by the lungs in an in vivo situation (15 mL/min). Efforts have been made to adjust
perfusate flow rate to mouse size (65), however, the adjustments necessary are small and the
majority of studies instead use mice of a similar size to minimise the variation in the flow rate to lung

16
size ratio. Ventilation volumes utilised in the IPML generally mimic the tidal volumes observed in
vivo in order to prevent atelectasis, on average the tidal volume of a mouse is approximately 0.2
mL/min.
The respiratory rate of the mouse is also significantly different from that of the rat, with rat rates
documented as 70-115 breaths/min (66) and mice significantly faster at 80-230 breaths/min (51,52)
with variations dependent upon the size and strain of mouse used. The in house IPRL model has
previously been used to study drug absorption (22) and utilises a respiratory rate of 20 breaths/min,
roughly a fifth of the normal respiratory rate of the rat. This proved adequate to prevent atelectasis
whilst improving lung viability. Similarly IPML models from the literature use respiratory rates below
that of the normal in vivo situation, with rates of 50-100 breaths/min utilised (60,62,65,67).
The current in house IPRL model utilises a dosing method proposed by Byron (32) involving
horizontal dosing of the lungs using a metered dose inhaler (MDI). This dosing strategy has been
shown to be reproducible and able to deliver more than 90 % of the dose to the lobar regions of the
lung (68). As discussed previously, it is the lobar regions which are most important for drug
absorption and therefore delivery to the lung periphery is key to the success of the model. Ideally,
this MDI method of lung dosing would be applicable to the mouse lung although there is no
evidence in the literature of its use with this species. Other dosing methods will also be investigated
for their applicability to the mouse lung model and delivery to the lung periphery. Delivery of the
dose in the form of small droplets can increase the deposition in to the deep lung. To this end a Penn
Century MicrosprayerTM is available and can be utilised to generate a liquid aerosol for delivery to
the lung. However, particle size and therefore lung deposition have been shown to be effected by a
drug’s physicochemical properties (69) which could be seen to result in drug specific differences in
absorption following delivery by this method.
The simplest methods reported in the literature utilise intratracheal instillation of the dose via a
syringe and a bolus of air (23,65,70). This method provides a convenient way of ensuring identical
volumes are delivered to the lung in a reproducible manner with easy determination of mass
balance possible. This method has been shown to produce an even distribution of drug to the lungs
and avoids the complications of particle size apparent with the previously discussed aerosolisation
methods.
Here we aim to use the mechanics of the IPML and in vivo mouse studies reported in the literature in
order to adapt an in house IPRL methodology for use with a mouse lung. The use of a mouse model
will enable us to develop transgenic animals for the purpose of the study of the role of P-gp upon

17
the absorption of drugs from the lung without the requirements of a chemical inhibitor. There is
already evidence in the literature for the use of IPML techniques with transgenic animals for
physiological studies but data regarding the models use for a drug absorption purpose is scarce.
2.1.3 Experimental Objectives
The objective of this chapter is based around the development of an IPML model by using the in
house expertise to adapt an existing IPRL system. In order to establish the new model this chapter
aims to:
- Show tissue viability for greater than the time periods of the experiments.
- Develop a reproducible drug dosing technique with even deposition of dose in the deep
airways.
- Investigate the absorption of model probes and a small number of substrates to
compare the IPML to previous studies using rat lungs.

18
2.2 Materials and Methods
2.2.1 IPML Setup
Materials
Mechanical ventilator – 50 1718 (Harvard Apparatus, Cambs, UK)
Peristaltic pump - MINIPULS 3 (Gilson Inc., WI, USA)
Circulating water bath
Glassware
Water jacketed artificial glass thorax, custom made (Radleys, Essex, UK)
Water jacketed perfusate reservoir, custom made (School of Chemistry, Cardiff University, UK)
Artificial thorax lid and perfusate reservoir lid, custom made (School of Chemistry, Cardiff University,
UK)
Perfusate line warmer, B14 socket and cone, SQ13 side arms, custom made (Radleys, Essex, UK)
SQ13 Plastic hose connector (Radleys, Essex, UK, product: 451002)
Plastic tubing and connectors
Perfusate tubing: PE50, 0.965 mm OD and 0.58 mm ID (VWR, PA, USA)
Pump tubing: Accu-rated PVC pump tubing, 2.972 mm OD, flow 1 mL/min (Fisher Scientific,
Loughborough, UK)
Water lines: Tygon R-1000, 11.1 mm OD and 6.3 mm ID (VWR, PA, USA)
T-shape waterline connector: ADF-715-070W (Fisher Scientific, Loughborough, UK)
Perfusate
D-glucose anhydrous; C6H12O6, (Fisher Scientific, Loughborough, UK, G/0450/60)
Potassium chloride; KCl, (Fisher Scientific, Loughborough, UK, Cat: P/4280/53)
Magnesium sulphate heptahydrate; MgSO4.7H2O, (Fisher Scientific, Loughborough, UK, Cat:
M/0600/53)

19
Sodium bicarbonate; NaHCO3, (Fisher Scientific, Loughborough, UK, Cat: S/4200/60)
Calcium chloride dihydrate; CaCl2.2H2O, (Fisher Scientific, Loughborough, UK, Cat: C/1500/50)
Sodium chloride; NaCl, (Fisher Scientific, Loughborough, UK, Cat: S/3105/63)
Potassium dihydrogen phosphate; KH2PO4, (Fisher Scientific, Loughborough, UK, Cat: P/4800/53)
Bovine serum albumin; BSA, (Sigma-Aldrich, Dorset, UK, Cat: A7906-1kg)
Figure 2.2.1 A photograph showing the equipment setup used for all IPML experiments, note: the artificial thorax lid is replaced with parafilm in the photograph for the purpose of temperature measurement inside the thorax. Blue arrows indicate the perfusate flow during normal experimental conditions.
The IPML equipment is setup as shown in figure 2.2.1 with recirculation of perfusate from the
reservoir via the lungs. The recirculation from the reservoir makes it easy to sample from the
reservoir and simple to maintain a constant perfusate volume throughout all experiments. The water
jacketed glassware is supplied by water from the water bath at a constant 37 oC. Within the
perfusate line warmer a metre of perfusate tubing is coiled to ensure the perfusate is warmed to 37

20
OC before being passed through the lung vasculature. The setup is adapted from that of the Byron
and Niven IPRL experiments (as seen in figure 2.2.2).
Figure 2.2.2 A schematic of the Byron and Nivel based IPRL setup from which the IPML was adapted.
Ventilation
The volume and rate of ventilation for inflation of the lungs is determined by the mechanical
ventilator. Literature discussed in the introduction suggests an average tidal volume of 0.2 mL for a
mouse lung but it was found that increasing this to 0.3 mL decreased the rate of oedema formation
within the experiments and therefore 0.3 mL was chosen as the ventilation volume throughout the
experiments. Restrictions, due to the model of ventilator available, mean it is not possible to make
small adjustments to the volume to compensate for changes in mouse size, instead the size of mice
used in the experiments is kept constant at 30 g ± 3 g. In all experiments performed in the IPML a
ventilation rate of 70 breaths/min was used, this in within the range of ventilation rates used with
similar models in the literature (see Introduction).
Perfusion Rate
The perfusion rate of the lungs in the IPML is determined by the peristaltic pump. A perfusion rate of
1 mL/min was chosen (setting 7.15 on the pump) similar to values used in previous literature studies

21
(see Introduction). This flow rate was decreased during cannulation of the pulmonary artery to 0.5
mL/min (setting 3.6 on the pump) to ease this process of the surgery.
2.2.2 IPML Surgery
Materials
Mouse tracheal cannula, 1.3 mm OD and 1.0 mm ID (Harvard Apparatus, Cambs, UK, Cat: 730028)
Euthatal (200 mg/ml) (Merial Animal Health Ltd., Harlow, UK)
1 ml syringe (Fisher Scientific, Loughborough, UK, Cat: SZR-150-011Q).
25G x 5/8IN needles orange (Fisher Scientific, Loughborough, UK, Cat: SZR-175-510A).
Cotton thread
Isolation and perfusion of the lungs
Animals
Male pathogen-free CD1 mice (Harlan, UK) were used throughout the preliminary method
development experiments. The mice were housed in temperature and humidity controlled rooms
(19-21 oC and 40-60 % humidity) with a 12 hour dark-light cycle. All mice had access to food and
water ad libitum and were acclimatised for at least 24 hours following transport to the experimental
laboratories. All animal experiments were performed in adherence to the Animal (Scientific
Procedures) Act 1986 and were approved by Cardiff University and GSK, Stevenage.
Perfusate
Perfusate solution was prepared as a Krebs-Henseleit (pH 7.4) buffer containing 10 % w/v BSA and
filtered using Whatman grade No.91 filter paper under vacuum. All perfusate batches were made
between 16 and 24 h before an experiment and were stirred continuously at 4 oC for 16 hours before
use. Batches not used within 48 h were discarded.
Preparation
All glassware and 15 mL of perfusate in the reservoir were brought to the experimental temperature
(37 oC) for at least 30 min prior to surgery. The perfusate reservoir was constantly oxygenated by a

22
gas line pumping 95% O2, 5% CO2 in to the reservoir throughout the experiment. Once at
temperature the perfusate was pumped through the system and the first 5 mL of circulated
perfusate was discarded. Surgical implements were thoroughly cleaned in 50 % ethanol and a
Euthatal dose was prepared (60 mg/kg dose or approximately 0.1mL of the 200 mg/mL stock) in a 1
mL sterile syringe with a 25G needle attached.
Animals were then retrieved from housing and euthanised with the dose of Euthatal via an IP
injection as per Schedule 1. After animals stopped responding to applied stimuli (blink test and foot
pinch test) death was guaranteed by separation of the spinal cord in the neck. From this point
surgery took an average of 6 min to result in suspension of perfused lungs in the artificial thorax.
Surgery
Following euthanasia, an incision was made in the throat and expanded to expose the trachea,
taking care not to sever any of the major blood vessels of the neck. Once the trachea was exposed a
small incision of about half of the tracheas circumference was made below the 4th cartilage ring. This
allowed the tracheal cannula to be inserted until 2-3mm short of the first bifurcation. The cannula
was then secured in the trachea by tying with cotton thread.
The abdominal cavity was then opened across its entire width to expose the diaphragm. The
diaphragm could then be removed, great care must be taken to avoid touching any lung tissue, this
is made simpler by first making a small incision in the diaphragm causing the pressure to be released
in the cavity and the lungs to fall away from it. The ribcage was then dissected on both sides in a
single large cut from the base of the ribs to the neck in order to expose the lungs and heart. The
sternum was then clamped and secured above the head of the animal.
The base of the heart was then clamped with plastic forceps and held firmly. Both atria were then
cut to allow free flow of perfusate. A small incision was then made roughly 3-5 mm below the entry
of the pulmonary artery. The cut was made perpendicular to the path of the artery and roughly 5mm
long. Through this incision it was possible to insert perfusate tubing from the reservoir (perfusion
rate of 0.5 mL/min), 5 mm in to the pulmonary artery from the ventricle of the heart. The perfusate
tubing acts as the pulmonary artery catheter in these experiments. Once inserted an artery clamp
was utilised to hold the tubing in place whilst the catheter was secured by tying with cotton thread
between the clamp and the incision in the ventricle. Two cotton loops were used to tie off the
catheter to ensure redundancy if one was loose. Both ventricles of the lung were then cut to allow
perfusate from the lungs to drain freely from the heart.

23
Removal of the lungs from the thoracic cavity was initiated at the trachea. The cannula was held
with forceps and lifted as the trachea was cut above the cannula. Thoracic connections were then
severed as the lungs were lifted gently by the trachea until the lungs were removed completely. Care
was taken to ensure the lungs did not contact the severed rib cage at this point. Once removed, the
lungs were suspended vertically in the artificial glass thorax by suspending them from the tracheal
cannula. The cannula was then attached to the mechanical ventilator and ventilation initiated.
The first 2 mL of perfusate pumped through the lungs was discarded to waste (as it was high in
blood) and the perfusate flow rate was increased to the experimental rate of 1 mL/min. The
perfusate reservoir was topped up with warmed perfusate to a predetermined mark indicating 10
mL of perfusate was present in the system.
Lung perfusion and viability
Complete and effective perfusion of the lungs is easily confirmed in the IPML model; the lungs
change from a reddish-pink colour to a brilliant white (figure 2.2.3) when properly perfused. Loss of
lung viability is also easy to distinguish as area of the lung turn transparent due to pulmonary
oedema. Visual observations in early experiments suggest that pulmonary oedema begins to form in
the mouse lungs between 45 and 75 min after experimental setup.
This viability throughout the duration of the experiment (approximately 40 min after isolation) was
confirmed by measuring the wet/dry weight ratio of the lungs. Lung tissue was removed from the
IPML setup upon termination of the experiment and blotted dry and weighed in a 50 mL centrifuge
tube (the centrifuge tube was previously weighed and its mass subtracted). The tissue was then
frozen in liquid nitrogen and lyophilised (Thermo Systems, UK) for 48 hours under vacuum. The lung
tissue was them reweighed to determine the dry weight of the lungs.
Viability of an hour is considerably shorter than that observed in the rat lung, a model which has
shown to be viable for more than two hours (38). Due to the shorter viability of the mouse lungs the
absorption experiments were run for 30 min instead of the 60 min our group has used previously for
the IPRL.

24
Figure 2.2.3 Isolated perfused mouse lungs suspended in an artificial thorax by the tracheal cannula. Note the brilliant white colouration of the lungs indicating effective perfusion.
2.2.3 Dosing strategies
Following the isolation and perfusion of the lungs they were maintained in the artificial thorax for 5
min to ensure the perfusion and ventilation of the lungs was performed effectively. An initial
perfusate sample (0.5 mL) was taken before dosing by extraction from the perfusate reservoir using
a Gilson pipette. The perfusate volume was then restored by the addition of 0.5 mL fresh perfusate
at 37 oC in to the reservoir. The lungs were then dosed via the tracheal cannula using the methods
described in detail below.
pMDI and PE50 loop
Two MDI actuators (one HFA227 and the other HFA134A) with 25 µl valves were acquired. A short
length of PE50 (length can be varied to exactly account for dose volume to be administered) was
connected to the MDI actuators using a 25G needle. The tubing was used to hold the dose and
replicate the dosing port used previously by our group for the IPRL model (71,72). With a 12 mm
length of PE10 inserted into the end of the PE50, the dose does not drip out when held vertically.

25
Figure 2.2.4 The setup of the prototype pMDI delivery device for the aerosol delivery of small volumes of dose (15-25 µL) to the IPML. The setup proved unsuitable for the model providing either too large an aerosol volume or too little force to expel the dose as an aerosol.
The volume of gas expelled by the device was measured by connecting to a gas tight syringe to the
dose delivery end of the PE50 tubing and measuring the displacement. The aerosol generated with
this device is excellent; however the volume of the aerosol is too large for delivery to mouse lungs.
The total lung capacity for a mouse varies with the size of the animal but is in general 0.9-1.5 mL
(51).
Attempts were made to reduce the aerosol volume of the device. For instance, a spacer was
included in the system between the PE50 tube holding the dose and the MDI in order to increase the
dead volume. However, this either created too little pressure to expel the dose as an aerosol or still
gave too large a volume of expelled gas (although over a longer timescale).
Boring holes in the spacer tubing was attempted to divert fractions of the generated aerosol out of
the system, to achieve a relevant volume of air passing through the dose tubing. This proved difficult
to engineer, and the hole could easily be stretched by escaping gas and change size, making the
system inherently inconsistent. Also, with small tubing such as the PE50, it is difficult to ensure an
airtight connection. No IPML or deposition experiments were attempted using this device due
engineering difficulties in producing an aerosol of adequate volume for dosing the IPML.

26
Hamilton syringe- pre-inflated lungs
There is a precedent in the literature for dosing the lungs via tracheal instillation of a liquid dose. To
increase the penetration of the dose to the lower airways attempts were made to dose the lung
whilst it was pre-inflated. Pre-inflation was achieved by utilising a 1 mL air filled syringe and a 3-way
valve. This setup allowed the lungs to be inflated by the injection of air from the syringe, the valve
was then closed and the upper valve opened. The upper valve was made air-tight by the inclusion of
a suba-seal through which dose could be injected using a Hamilton syringe. Mechanical problems
with the setup lead to the method being discarded before deposition experiments were possible.
Penn-Century Microsprayer
The Microsprayer (Model 1A-1C-M, Penn-Century, Philadelphia, USA) is a delivery device designed to
create an air-free aerosol specifically for intratracheal delivery to mouse lungs. The atomiser
generates an aerosol using the manual pressure from the syringe alone, i.e. it does not rely on
compressed air or gas, indeed if any air is present in the system the dose is expelled as a liquid
stream rather than an aerosol. Similarly, if the plunger is not depressed with sufficient force an
aerosol is not produced.
Figure 2.2.5 The two components of the Penn-Century Microsprayer, the Aerosolizer (A) and the high pressure syringe (B). Images from the online manual for the device.
Whilst the isolated lungs were equilibrated following surgery the dosing system was setup. The high
pressure syringe was first purged of all air by the injection of water in to the base of the syringe
using the provided Air Purge syringe and needle. The high pressure syringe was held vertically and
the dose injected in to the base of the syringe as the needle was withdrawn. This was repeated until
no more air bubbles were seen to escape the syringe and a meniscus of liquid was seen at the top of
the syringe. The Aerosolizer was then attached and dose forced through by the syringe until all air
had been removed. The 25 µL spacer was then attached to the plunger and the plunger depressed

27
until the spacer was tight to both the handle of the plunger and the syringe, the spacer was then
removed. The dose remaining in the syringe and Aerosolizer at this point is the 25 µL dose for
delivery.
The Aerosolizer is then inserted in to the trachea to a depth just short of the first bifurcation and the
plunger rapidly depressed to deliver the aerosolised dose.
Hamilton syringe with an air bolus
Two variants of a simple dosing solution were also investigated utilising a Hamilton syringe. The first
simply drew 25 µL of the dose solution in to a 50 µL Hamilton syringe, this was then instilled in to the
trachea by rapid depression of the plunger. Care was needed to ensure the plunger did not depress
under gravity prior to dosing. The second method was similar but differed in that prior to drawing
the dose solution in to a 250 µL Hamilton, 250 µL of air were drawn in to the syringe. This was
achieved by drawing the plunger back to the 250 µL marker and then inserting the tip of the needle
into the dosing solution and drawing the plunger further until the dose reached the 15 µL marker.
Dose was not drawn to the 25 µL marker to the expulsion of the dead volume of the syringe (10 µL)
when the instillation was forced with the bolus of air. Again this was dosed by simply depressing the
plunger rapidly whilst the needle was maintained just above the first bifurcation of the lungs.
Stoplock Hamilton syringe
The dosing methods above were improved by the inclusion of the gas-tight Stoplock Hamilton
syringe (250 µL, 1700 series). The method utilised was similar to the air bolus method above except
after the syringe was loaded the valve could be closed. The Hamilton could then be positioned
without fear of the plunger depressing due to gravity. Dosing was achieved by depressing the
plunger to the 25 µL marker and then opening the valve, this pressurised the air in a reproducible
manner to ensure more consistent dosing.
Dosing volume studies
In order to ensure the same volume of the dose was being delivered to the lungs in a reproducible
manner by each dosing device, the variability in dosing volume was investigated. The dosing systems
were prepared as described above with solutions of 14[C]-mannitol (5 nCi per 25 µL dose) in PBS. The
dose was then injected in to a micro-centrifuge tube in the same manner as it would be delivered to
the lungs. Following this, 1 mL of water was added to the tube and the concentration of the resulting
solution was determined as per the methods described below. By calculating the amount of
mannitol present following dosing it was possible to determine the percentage of the dose delivered

28
by each device, this was repeated ten times in order to gauge the variability inherent with each
dosing system.
Deposition studies
In order to ensure the delivery systems were able to deliver the dose to the lungs in a reproducible
manner studies were undertaken to investigate the lobar distribution of the dose following a
particular dosing strategy. The IPML surgery was carried out and the lungs were dosed as described
above with a dose of 14[C]-mannitol (5 nCi per 25 µL dose) in PBS. Immediately following dosing, the
lungs were removed from the artificial thorax and the lobes separated into micro-centrifuge tubes.
To calculate the amount of dose present in each lobe 1 mL of PBS was added and the lobe
homogenised using an Ultra-turrax t25 homogeniser for 2 minutes per sample. Concentrations of
the radiolabelled dose were then determined by scintillation as described below.
In order to account for the differences in lobar mass, the percentage of dose present in each lobe
was corrected according to the ratio of lobar mass to total lung mass. The mass of each lobe in
relation to the mass of the complete animal and the lung mass was determined by sacrificing 5
animals and weighing each lobe, the lobar mass to animal and lung mass ratios are shown in table
2.2.1 below.
Lobe
Lobar mass to
body mass
ratio (%)
Lobar mass
to lung mass
ratio (%)
Left 0.175 34
Superior 0.101 19.61
Middle 0.064 12.43
Inferior 0.13 25.06
Postcaval 0.046 8.94
Table 2.2.1 The ratios of the masses of the lobes of the lung in comparison to the total body mass of the mice (average = 38.51 g) and the total mass of the lung (average = 0.516 g). Data is presented as an average from 5 animals and expressed as percentages.

29
2.2.4 Absorption studies
Absorption studies- paracellular probes
The variability in IPML experiments utilising different delivery systems was investigated. The surgery
and dosing was performed as described above for the deposition studies. Following dosing the
delivery device was left in the tracheal cannula for the first 5 minutes of the experiment. At set time
points (0, 1, 2, 3, 4, 5, 10, 15, 20 and 30 minutes) 500 µL samples were removed from the perfusate
reservoir and transferred to micro-centrifuge tubes. After the 5 minute time point was removed
from the reservoir the tubing from the ventilator was reattached to the tracheal cannula and lung
ventilation reinitiated.
At 30 minutes the experiment was terminated and the samples were centrifuged at 16,000 rcf to
pellet any blood cells and other contaminants. The supernatant was then transferred to a clean
micro-centrifuge tube and analysed as described below.
The concentration of the dose present in each sample was compared to the amount of drug initially
deposited in the lung in order to ascertain the percentage of deposited dose absorbed during the
time course of the experiment.
Chemical inhibition studies- P-gp substrates
In order for comparisons of the P-gp functionality present in the lungs of the IPML model developed
here and the rat lung model used in the literature previously, investigations were conducted in to
the effect of a chemical P-gp inhibitor upon the absorption of two P-gp substrates (rhodamine 123
and digoxin) from the mouse lungs. The chemical inhibitor used in these studies was GF120918 (GSK,
Stevenage, UK), an inhibitor which has been widely used in the literature for the purpose of
inhibiting P-gp functionality. A summary of previous uses of GF120918 in the literature is available in
table 2.2.2 as well as the concentrations at which it was utilised in these studies. To investigate the
effect of P-gp inhibition on lung absorption characteristics, the pulmonary absorption of both
substrates was compared in the presence and absence of the inhbitor.
In the inhibitor experiments presented here, GF120918 was utilised at a concentration of 500 nM, a
level at which previous work from our laboratory has shown efficient inhibition of pulmonary P-gp
(71,72) and one which is consistent with the level used in previous literature, table 2.2.1. A 25 µL
pre-dose of GF120918 (0.5 % DMSO) was delivered to the lungs via the delivery device 5 minutes
prior to the experimental dose, the inhibitor was also present in the perfusate at 500 nM, this
ensured even inhibition of P-gp functionality throughout the lung. The same concentration (i.e. 500

30
nM) was also present in the 25 µL substrate dose delivered to the lungs. In the non-inhibitor
experiments the GF120918 was replaced by a 0.5 % DMSO solution and the dosing schedule was
identical; a pre-dose was delivered 5 minutes prior to the substrate dose.
Other than the pre-dose the experiments were carried out in the same manner as those above for
the absorption studies. Substrate doses were prepared as described in detail in chapter 4.2 with a 25
µL dose of 50 µM rhodamine 123 and 0.25 Ci (16 pM) of 3[H]-digoxin. A marker of the paracellular
barrier integrity was present in all doses in the form of 0.25 µCi of 14[C]-mannitol (17 pM).
Mass Balance
Following experimentation both the dosing system and tracheal cannula were washed with 1 mL of
water. The concentration of the dose present in the wash fluid of the syringe enabled calculations of
the actual dose instilled in to the lungs during dosing by allowing the subtraction of dose remaining
in the dosing device. Likewise, the concentration of the dose present in the wash fluid of the cannula
allowed the portion of drug refluxed during dosing to be subtracted from the overall dose. Together
this allowed an accurate estimation of the actual deposited dose in the lungs from which percentage
dose absorbed was calculated.
Analytical Methods
Radiolabelled doses were analysed by liquid scintillation as described in detail in chapter 4.2. Briefly
perfusate samples (200 µL) were added to translucent scintillation tubes. Scintillation cocktail was
added (3 mL) and the samples were measured in a Tri-Carb scintillation counter on dual-counting
mode. By comparing the DPM of the sample to that of the standard curve it is possible to calculate
the concentration present in each sample.
In order to analyse the doses of the non-radiolabelled rhodamine 123 HPLC-MS/MS was utilised. This
technique provided sufficient lower limits of quantification (LLQ) for the analysis of rhodamine 123
in the sample and is described fully in chapter 4.2.
Data Analysis
The absorption profiles of the two experimental groups were compared in a non-compartmental
manner using area under the curve analysis (AUC). AUC analysis was performed on the % deposited
dose absorbed at all time points using Graphpad Prism 5 software.

31
To determine the significance of the differences in absorption between the wild type mdr1a/b (+/+)
and the knockout mdr1a/b (-/-) mice an independent T-test was performed upon the percentage of
deposited dose absorbed at 30 min and the AUC analyses. In all cases significance was accepted as
p< 0.05.
Correlations between datasets were performed using Microsoft Excel 2010 by calculating the
Pearson’s moment of correlation. Graphs representing these correlations were generated using
Graphpad Prism 5 software.

32
GF120918 Concentration Cell Type Substrate Inhibitor Solvent Reference
2, 10, 20, 70 µM Whole lung (rabbit) rhodamine 123 DMSO (73)
1 µM HeLa cells rhodamine 123 N/A (74)
0.5-2 µM Primary hepatocytes (rat) rhodamine 123 N/A (75)
100 nM EMT6/P cells rhodamine 123 N/A (76)
100 mg/kg (5 mg/mouse) Whole animal (mouse) saquinavir N/A (77)
500 mg/kg (animal) 0.5 µM (in vitro) Whole animal (rat)
BBCEC Cells
rhodamine 123
morphine HPMC: Tween 80: H2O (78)
25 mg/kg Whole animal (mouse) paclitaxel WFI: Tween 80: H2O (79)
250 mg/kg (animal) 300-800 nM (in vitro) Whole animal (mouse) coelenterazine HPMC: Tween 80: H2O (80)
0.001- 10 µM MDCKII cells
calcein-AM
colchicine
digoxin
prazosin
vinblastine
DMSO (81)
250 mg/kg (animal) 300 nM (in vitro) Whole animal (rat)
NIH3T cells 99mTc-sestamibi HPMC: Tween 80: H2O (82)
0.5, 2, 10 µM Caco-2 cells fexofenadine N/A (83)
1 µM MDCKII cells saquinavir DMSO (84)
500 nM Caco-2 cells amprenavir HPMC: Tween 80: H2O (85)
Table 2.2.1 A compilation of experiments from the literature which utilise GF120918 as a chemical inhibitor of P-gp and the concentrations at which it was used. Adapted from Francombe, 2011 (86). HPMC: Hydroxypropyl methylcellulose, DMSO: dimethyl sulfoxide

33
2.2 Results 2.2.1 IPML tissue viability
In order to assess the viability of the IPML following forced instillation and a 30 minute experiment
the wet:dry weight ratio of the lungs at the end of the experimental timeframe and freshly isolated
lungs was investigated (table 2.3.1). It was apparent that lungs with no visible oedema after the
completion of a 30 minute absorption experiment showed no difference in wet:dry ratio to lungs
freshly removed from the animal (p = 0.63). This indicates that the lung tissue is still viable at the end
of an absorption experiment if no visible oedema is seen.
In experiments where damage has occurred to the lung tissue, either during surgery or dosing
oedema can form rapidly (seen within the first 10 minutes of an experiment). On these occasions the
wet:dry ratio of the lung mass is seen to be significantly increased from that of healthy lungs (p =
0.024). Taken together this shows that in the absence of damage caused to the lungs during surgery
or dosing the IPML remains viable for the time course of the experiment. In examples where damage
has occurred this is easily identified by visible oedema which correlates well with increases in lung
wet:dry mass ratios providing a useful visual check for lung viability in each experiment.
Lung wet mass (mg)
Lung dry mass (mg)
Wet:Dry Ratio
Freshly isolated lungs 256 ± 41 78 ± 14 3.32 ± 0.34
No visible oedema 280 ± 50 87 ± 13 3.23 ± 0.27
Visible oedema 522 ± 83 81 ± 18 6.89 ± 2.76
Table 2.3.1 The mass of lungs before and after lyophilisation was established for lungs immediately after removal from the animal, following a 30 minute absorption experiment where no oedema is visible at the end of the experiment and after a 30 minute absorption experiment where oedema is visible. As can be seen the wet:dry ratio of the lung mass is increased when oedema is present. Data are presented as mean ± S.D, n = 5.

34
2.2.2 Dosing validation
Reproducible dosing volumes
In the isolated perfused rat lung model (IPRL) already established within the group dosing is
achieved using a modified pMDI device. The same was attempted with the mouse lungs using both
an HFA227 and HFA134a pMDIs. These devices proved unsuitable for use with the mouse lungs due
to the large volume of aerosol generated (approximately 5 ml for HFA227 and 7.2 ml for HFA134a).
As the tidal volume of the mouse lungs is approximately 1 ml this aerosol volume would have caused
unacceptable damage to the lung tissue. Attempts to reduce the volume generated by the addition
of spacers or by boring holes in the tubing to release gas resulted in either too small a reduction in
volume or insufficient aerosol generation for the experiments. It was therefore decided not to
proceed with the pMDIs as a mechanism for dose delivery to the IPML.
Likewise, pre-inflation of the lungs was discarded as a possible dosing technique early on in the
method development. In practice this setup proved unsuitable for the IPML experiments. There
were problems encountered with the orientation of the valves, syringes and dosing needle during
experimentation which resulted in inconsistent dosing. It also proved difficult to maintain the air-
tight nature of the system; a prerequisite necessary to ensure the lungs remained inflated
throughout dosing. Due to these issues this dosing setup was not used for any deposition
experiments with the IPML.
Three remaining possible dosing strategies showed potential for dosing in to the IPML experiments,
the Penn-Century Microsprayer, a Hamilton syringe with an air bolus and a Stoplock Hamilton also
with a bolus of air. The air bolus in the syringes helped to inflate the lungs upon dosing in order to
encourage dosing deeper in to the airways.
In order to evaluate the fraction of dose delivered from the three potential dosing devices a number
of test doses of 3[H]-mannitol were expelled from the dosing mechanisms into micro-centrifuge
tubes and the volume of dose emitted was determined. It was observed that the Hamilton syringe
which relied on operator pressure to expel the dose and air bolus was unacceptably variable with
regards to the volume of dose delivered (table 2.3.2). This was greatly improved by the more
consistent pressure applied by the Stoplock Hamilton. The valve in the Stoplock syringe allowed the
plunger to be depressed to the same point (30 µL) with the valve closed and therefore the air bolus

35
was pressurised to the same extent with each dose. Sudden release of the valve then generated a
more consistent dose. The Microsprayer also showed low variability in the volume of dose expelled
from the device although it is of note that the device often blocked due to the presence of air
bubbles which were introduced during loading (experiments with a blocked device were not
included in the variability analysis). Due to the poor variability in the dosing with the 250 µL
Hamilton no further experiments were conducted with this technique.
Percentage of dose expelled (%)
Standard deviation (%)
Penn-Century Microsprayer 87.28 8.99
250 µL Hamilton with air bolus 91.26 23.15
250 µL Stoplock Hamilton with air
bolus 96.09 1.15
Table 2.3.2 The reproducibility of the doses delivered from the three dosing devices selected for delivery to the IPML. Data shows the percentage of mannitol initially loaded in to the device which was measured in the delivered dose. N=10 for each device.
Figure 2.3.1 Absorption profiles of the paracellular probe mannitol from the IPML with the lungs of CD1 mice after deliver by [A] the Penn-Century Microsprayer and [B] the Stoplock Hamilton syringe with a 250 µL bolus of air. Data are presented as the mean ± S.D and n=6 for both experiments. The increased variability off the Microsprayer in comparison to the Stoplock Hamilton, seen in the
simple dose volume reproducibility experiments, was also observed in the absorption profiles of the
paracellular probe mannitol from the IPML (figure 2.3.1). During these early absorption experiments
with the Microsprayer it became apparent that the device blocking was an issue, in total 10 IPML
experiments were performed with the Microsprayer and the results of 4 produced no meaningful

36
data and recorded no absorption of mannitol observed above background levels. This is due to the
device failing to generate an aerosol if air bubbles are introduced during loading. Unfortunately this
does not become apparent until after the experiment is analysed and if carried forward would result
in unacceptable animal and resource use. Due to the increased reliability and dose volume
reproducibility the Stoplock Hamilton was chosen as the preferred dosing device going forward.
Reproducible deposition
The deposition profile following dosing with the Stoplock Hamilton syringe was investigated to
ensure the profile was consistent across experiments and dosing to the peripheral airways was
achieved. The depth of dose penetration in to the lung was observed visually by dosing with a
solution of Evans Blue. As can be seen in figure 2.3.2 the dye can be seen in the parenchyma of the
lung lobes immediately after dosing, however, it is of note that concentrations of dye are also
observed in the lower trachea and major bronchi of the lungs.
Figure 2.3.2 The distribution of Evan’s Blue dye seen following forced instillation with a Stoplock Hamilton in the IPML. The reproducibility of this dosing pattern was investigated by identifying the proportion of a 3[H]-
sucrose associated with each lobe immediately after dosing. Following the dosing of sucrose 80 % of
the total deposited dose was recovered from the lung tissue, 2 % is lost in the trachea and tracheal
cannula and the remaining 18 % is unaccounted for in the tissue processing and analysis. The largest
proportion of the dose (27 %) was recovered from the left lobe of the lung; this lobe is also the
largest with an average mass of 85 ± 15 mg. The remaining lobes also show proportions relative to
their mass as can be seen in figure 2.3.3

37
Figure 2.3.3 The deposition of sucrose in each lobe of the mouse lung following forced instillation with a Stoplock Hamilton and a bolus of air is both consistent and relative to lobar mass. Data is presented as a mean ± S.D, n=5. BW= body weight 2.3.2 IPML validation – permeability
Permeability to paracellular markers
The general permeability of the CD1 mouse lungs was assessed by investigating the absorption of
two paracellular probes, mannitol and sodium fluorescein (F-Na). The probes were delivered to the

38
lung using the Stoplock Hamilton and the percentage of the dose present in the perfusate was
measured at intervals to produce an absorption profile for each (figure 2.3.4). It was observed that
the absorption of F-Na from the lung was extensive with 87% of the deposited dose absorbed within
30 minutes. The lungs of CD1 mice proved less restrictive to mannitol absorption with 40% of the
deposited dose absorbed within 30 minutes.
Figure 2.3.4 The permeability of the lungs of CD1 mice in the IPML to the paracellular probes [A] mannitol and [B] F-Na. Data are presented as mean ± S.D, n = 5-6. Due to the restrictive nature of the pulmonary barrier to the absorption of mannitol a radiolabelled dose (3[H]-mannitol) was included in all experiments of pulmonary absorption going forward. Experiments which showed mannitol absorption outside the range of 49 ± 9 % of deposited dose absorbed at 30 minutes (1 S.D from the mean) from the lungs of CD1 mice were discarded.
Permeability to P-gp substrates – effect of GF120918 on absorption
In order to evaluate the suitability of the IPML model for the investigation of the effect of P-gp upon
the pulmonary absorption of its substrates transport studies were carried out with rhodamine 123
and digoxin. These two substrates are well characterised and have been utilised in studies of
pulmonary P-gp in the literature previously.

39
Figure 2.3.5 The absorption of the P-gp substrates [A] digoxin and [B] rhodamine 123 from the lungs
of CD1 mice in the presence and absence of the selective P-gp inhibitor GF120918. Data is also
shown for the paracellular control, [C] mannitol, included as a co-dose with the rhodamine 123
experiments showing no change in the general permeability of the lung with the addition of
GF120918. Data are presented as mean ± S.D, n = 5-6, * indicates a significant difference (p < 0.05).
Results for rhodamine 123 show that in the absence of P-gp functionality the percentage of
deposited dose absorbed is increased over the no-inhibitor controls (AUC = 250 ± 122 %.min-1. in the

40
absence of GF120918 and 629 ± 181 %.min-1 in experiments where the inhibitor was present, p=
0.007). This suggests that P-gp functions to attenuate the absorption of rhodamine 123 from the
mouse lungs in the absence of the inhibitor (figure 2.3.5 A).
The absorption profile of digoxin in the presence and absence of GF120918 does not suggest a role
for P-gp in its absorption. There is no difference in the percentage of the dose absorbed or the AUC
in the presence and absence of the inhibitor (AUC = 1051 ± 308 and 908 ± 219 %.min-1 respectively, p
= 0.835) suggesting GF120918 does not enhance digoxin absorption (figure 2.3.5 B)
The difference seen in the absorption of rhodamine 123 in the presence of the inhibitor is not
explained by a general increase in the permeability of the lungs for this group of experiments. The
paracellular probe mannitol was included in all of the IPML experiments and its absorption shows no
significant difference between any of the experimental groups (figure 2.3.5 C)
The difference observed in the absorption of rhodamine 123 in the presence of GF120918 verifies
that the IPML model developed here is able to determine the effects of P-gp attenuation upon the
absorption of its substrates. The lack of effect seen in the absorption of digoxin highlights the lack of
effect seen in the absorption of this substrate previously in the literature.

41
2.4 DISCUSSION
There is an increased interest in the delivery of drugs to the systemic circulation via the pulmonary
route in recent times; it is being investigated as a route of delivery with the potential for rapid and
extensive uptake for drug candidates with poor oral bioavailability. It is therefore important to
develop suitable models for the assessment of pulmonary pharmacokinetics for the examination of
drug transport across the lung. The isolated perfused lung (IPL) models have been well utilised in this
regard for a considerable time (87) and have been shown to be well suited for establishing the
pharmacokinetics of a range of low molecular weight drugs (38). Previous studies, both in the
literature and within our group, utilise an isolated perfused rat lung (IPRL) for drug absorption
studies and here the Byron IPRL setup is adapted for use with mouse lungs. These studies in the IPRL
are summarised in the introduction to this chapter.
Utilising the lungs of mice rather than rats will allow us to investigate the role of P-gp on lung
absorption by the development of P-gp deficient mice. Due to the reduced breeding time and
current availability of P-gp deficient mice they are a far more suited species to genetic knockout
applications than rats. To this end the chapter presented here focuses on the development and
validation of the ex vivo isolated perfused mouse lung (IPML) model by the adaptation of an IPRL
setup originally proposed by Byron and Niven (32). The aim of this model is to sufficiently represent
the effect of the complex structure of the lungs upon the absorption by maintaining in vivo
structures whilst allowing the control of experimental factors and eliminating the confounding
effects of systemic ADME seen in in vivo models.
Validation of the dosing technique
It has been reported previously in the literature that tissue viability in IPL experiments is enhanced
by the addition of albumin to the perfusate (88), it was demonstrated that when albumin was added
to the perfusate an approximately 5-fold increase in the duration of lung viability was observed
(before pulmonary oedema was witnessed) (89). In line with previous studies both in the literature
and within our group using the IPRL 4 % bovine serum albumin (BSA) was added to the perfusate
buffer in order to increase lung viability.
During the development of the IPML model attempts were made to utilise a similar dosing
mechanism to that used previously in IPRL experiments within the laboratory, i.e. a pMDI (71,72).

42
Unfortunately, this forced instillation technique proved unsuitable for the mouse lung as the volume
of the aerosol was too large and would result in unacceptable damage to the lungs. Attempts to
reduce the volume of the pMDI aerosol were unsuccessful; the reduction in aerosol volume was
either too small or resulted in an insufficient force to generate an aerosol.
Investigations were conducted in to the suitability of a Penn-Century Microsprayer for delivery to
the IPML. Despite the device generating a good aerosol when loaded correctly, it proved unreliable
as a dosing technique. Experiments in which air was introduced in to the Microsprayer resulted in
erratic dosing as the device became blocked and failed to deliver the dose as an aerosol. The failure
of the dosing device was not evident until the analysis of the experiment and therefore resulted in
the loss of animals and resources. The aerosol generated by the device is not delivered “forced” with
a bolus of air/expellant as in the pMDI and there was subsequently no inflation of the lungs during
delivery. This is expected to result in a less extensive delivery to the lower lungs.
In order to most closely replicate the forced instillation techniques of the pMDI delivery in the IPRL a
bolus of air is needed to inflate the lungs during delivery. This was achieved by using a Stoplock
Hamilton syringe, the device allowed a 250 µL bolus of air to be pressurised in a reproducible
manner and delivered to the lungs rapidly by opening the valves. This delivery mechanism resulted
in the most reproducible dosing volumes of all the devices investigated, with a reproducible fraction
of the dose delivered by the device and a reproducible deposition within the lung tissue. The lung
deposition of the dose delivered via this technique was investigated visually by dosing Evan’s Blue
dye and the fraction of dose present in each lobe was established by dosing radiolabelled sucrose.
These investigations show that the dosing technique allows efficient dosing to the lung parenchyma
with blue staining seen in the lung periphery immediately following dosing of Evan’s Blue. It is of
note that a concentration of dye was evident in the bronchi and trachea indicating that a portion of
the dose does not reach the periphery of the lung. The proportion of the dose which was deposited
in the trachea was shown to be consistent between experiments at roughly 2 %. The deposition
profile in the lung following dosing with the Stoplock Hamilton was shown to be even and
reproducible across multiple experiments. The percentage of the deposited dose recovered from
each lobe of the lung showed an acceptable variability and was in relation to the lobar mass, i.e. the
largest percentage of the dose was consistently present in the largest lobe (left lobe). The
reproducibility of the dosing to the lobes of the lungs witnessed with this dosing device is an
improvement on similar results observed with a pMDI in a previous IPRL (68) where consistent
deposition to the trachea was observed but the delivery to the lobes showed a large variability
between experiments. Preliminary investigations in to the absorption of a paracellular probe

43
(mannitol) confirmed the reproducibility of this dosing strategy with a consistent absorption profile
seen across all experiments. It was determined that the Stoplock Hamilton provided efficient
reproducible dosing to the lung in a manner which offers concurrent reproducible inflation, the
device was therefore chosen as an acceptable method going forward.
Validation of tissue viability
Following the forced instillation of dose by the Stoplock Hamilton it was important to investigate the
duration for which the lung preparation remained viable. During experiments the lungs were
constantly observed for signs of pulmonary oedema formation, when present oedema causes the
chalky white perfused tissue to become transparent and pink. In addition to this the wet:dry mass of
the lungs was determined both before and after the experiment, a technique utilised extensively in
the literature to determine tissue viability (90–92). The assumption with this technique is that during
the formation of oedema the water content of the lungs will be increased and therefore an increase
in the wet:dry ratio will be observed. By comparing the post-experiment ratio to that of healthy
lungs the viability of the IPML during the time frame of the experiments can be determined.
The wet:dry mass ratios were determined in three groups, lungs freshly removed from CD1 mice,
lungs with no visual oedema at the termination of an absorption experiment and lungs from aborted
experiments in which pulmonary oedema was visually apparent. In all cases where no pulmonary
oedema was observed following an absorption experiment there was no significant difference
between the wet:dry mass ratio and that of the freshly removed lungs. Conversely, lungs with visible
oedema showed a significant two-fold increase in the ratios when compared to healthy lungs. The
wet:dry ratios reported in the viable lungs post-IPML are in agreement with those reported in the
literature where a ratio under four is considered to represent viable lungs (91). These viability
studies show that experiments which show no visible sign of oedema during the absorption
timeframe are viable and visual formation of pulmonary oedema is a good indicator of tissue
viability. It is worth noting that when oedema formation was witnessed it tended to occur soon after
the lungs were isolated, it is assumed that oedema formation in this IPML setup is therefore due to
accidental damage caused during surgery or dosing and when the technique is performed correctly
the lungs remain viable for the duration of the experiments.

44
Permeability to paracellular probes
In order to validate the IPML model the absorption profile of two paracellular probes, mannitol and
sodium fluorescein (F-Na), was investigated in the CD1 mice. The absorption of both was shown to
be more extensive than that previously seen in the IPRL (71) with the absorption of F-Na being
almost complete at 30 minutes (87 % deposited dose absorbed), in the rat lungs a similar extent of
absorption was observed at 60 minutes. The pulmonary barrier was shown to be more restrictive to
the absorption of mannitol although the absorption was more extensive than that observed in the
rat model with an approximately two-fold increase in the percentage of deposited dose absorbed at
30 minutes in the mouse model. The increased absorption of F-Na in comparison to mannitol is
consistent with previous literature and provides evidence to support the validity of the IPML. This
data suggests that the mouse lungs may prove generally more permeable than those of the rat
model, in particular with regards to the paracellular pathway. The absorption profile of mannitol in
the lung lends itself well to a use as a control in experiments going forward. In all absorption
experiments a radiolabelled mannitol dose was included and if the extent of absorption of this
paracellular control was outside of one standard deviation of the mean (49 ± 9% for CD1 mice) the
experiment was considered invalid.
Permeability to P-gp substrates – chemical inhibition
Previous studies in the literature have investigated the role of P-gp in the pulmonary absorption of
rhodamine 123 and digoxin from an IPRL (22,24). The results of these two studies appear discordant
with a role for P-gp identified in the pulmonary absorption of rhodamine 123 and digoxin absorption
unaffected by P-gp attenuation. The two studies are discussed in more detail in chapter 4. Both of
these studies utilise chemical inhibition of P-gp function to ascertain its role in the absorption of
substrates from the lung and therefore similar experiments were conducted with the IPML using
GF120918 as a selective and potent inhibitor of P-gp functionality.
Results from the absorption of the two substrates from the IPML are in agreement with the previous
literature studies. The absorption of rhodamine 123 was significantly enhanced in the presence of
GF120918 suggesting pulmonary P-gp functions to attenuate rhodamine 123 absorption. Conversely
the absorption of digoxin showed no significant difference in the presence or absence of the
inhibitor suggesting P-gp does not play a role in its absorption.

45
The difference seen in the absorption of rhodamine 123 in the presence of GF120918 is unlikely to
be due to a general increase in permeability in this group of animals. It was shown that the
absorption of the paracellular probe mannitol, included as a control in all experiments, showed no
difference in absorption between the two groups. Combined with the lack of difference in the
absorption of digoxin this provides strong evidence that GF120918 does not increase the general
permeability of the lungs. It is possible that the discrepancy seen in the absorption of the two
substrates is due to a non-P-gp related compound specific effect of GF120918; for example the
displacement of rhodamine 123 from intraluminal binding sites. However, competition for binding
sites would seem unlikely as there are significant chemical differences between rhodamine 123 (a
lipophilic amine and GF120918 (a highly lipophilic carboxamide). In order to completely address the
issue of the chemical inhibitor the IPML model will be further developed by the inclusion of P-gp
deficient mice. These genetic knockouts will remove the need for the inclusion of a chemical
inhibitor to assess P-gp function.
Overall, the principle aim of this chapter was the development and validation of the IPML model.
The results presented in this chapter confirm the viability and dosing strategies utilised in the IPML
are sufficient to provide a model which is well suited for the investigation of pulmonary drug
absorption. The use of a mouse model instead of the more conventional rat model will allow the
inclusion of genetic knockout mice for the investigation of P-gp functionality in the lung without the
confounding effects on a chemical inhibitor.

46
Chapter 3
Generation and validation of mdr1a/b (-/-) mice

47
3.1 Introduction
In the previous chapter an IPML model was developed and validated for the investigation of the
pulmonary absorption of low molecular weight drugs. One aim of this thesis is the application of this
technique to determine the role of P-gp in the pulmonary absorption of its substrates. As discussed
in the previous chapter, previous literature studies investigating the role of P-gp in the pulmonary
absorption of its substrates have utilised chemical inhibition of P-gp functionality in an IPRL model.
In order to avoid the confounding effects of possible non-P-gp mediated functionality of the
chemical inhibitors a genetic knockout model is required.
3.1.1 Literature pharmacokinetic (PK) studies utilising P-gp deficient mice
The use of genetic knockout mice is well established in the study of the role of P-gp in the
pharmacokinetics of a range of molecules. In rodents there are two P-gp genes expressed, mdr1a
and mdr1b. Of these mdr1a is more abundant at all the barriers of interest for drug transport
including the lung (5) although the lung does possess relatively higher levels of mdr1b in comparison
to other barriers. Literature studies with P-gp deficient mice have shown altered pharmacokinetics
of a range of P-gp substrates at multiple barriers using the single knockout mdr1a (-/-) mice and the
double knockout mdr1a/b (-/-) mice.
The lack of mdr1a/b expression in the P-gp deficient mice has been shown by a range of histological,
serochemical and immunological parameters to have no significant biological effect (93). Mice
deficient in both mdr1a and mdr1b were shown to display completely normal development, viability
and fertility up to 1 year of age. As well as witnessing no abnormalities under macro and microscopic
analyses of all the major organs a range of serum and haematological techniques were used to
assess the biological effect of P-gp knockout. The study performed a range of analyses such as
measurements of the serum levels of bilirubin, alkaline phosphatase, aspartate aminotransferase,
alanine aminotransferase, lactate dehydrogenase, creatinine, urea, sodium, potassium, chlorine,
calcium, phosphate, total protein and albumin in both sexes. Measurements of the haemoglobin
level, haematocrit, erythrocyte, leukocyte and thrombocyte counts were also determined in blood.
In all cases the results of the analyses concluded that the biological significance of P-gp knockout
was negligible and the only differences identified between the knockout and wild type mice was in
their pharmacokinetics and dynamics.
Since the initial use of the P-gp knockout mice in the mid 1990’s they have been widely utilised to
study the pharmacokinetics of a range of drugs at many barriers. One of the most well studied of
48
these is the blood-brain barrier. An early observation on the effect of P-gp at the blood brain barrier
was an observation of a drastically increased (100-fold) sensitivity of a sub-population of CF-1 mice
to ivermectin and avermectin given to the mice as anti-parasitic drugs (94,95). The spontaneous
mdr1a deficient sub-population of CF-1 mice has since been isolated and used in a range of studies
investigating the impact of P-gp upon drug pharmacokinetics. Increased brain penetration of
ivermectin in P-gp deficient mice had been observed earlier in mdr1a (-/-) knockouts by the group of
Schinkel (96), they had shown that in the absence of mdr1a functionality sensitivity to both
vinblastine and ivermectin was increased due to increased brain penetration in mdr1a deficient
mice. An early example of the use of the spontaneous mdr1a deletion in the CF-1 mice investigated
the systemic effect of P-gp in these mice on the absorption, metabolism and disposition of
ivermectin and cyclosporine-A (97). The study showed that in the absence of P-gp the concentration
of both substrates was greatly increased in the brain of the mice, explaining the increased sensitivity
of these mice to ivermectin toxicity. An effect of P-gp in the intestine was also shown as following
oral dosing blood levels of the drug were higher in the P-gp deficient animals. Interestingly, they
observed no difference in the concentrations of the substrates in the liver and a survey of drug-
metabolising enzymes in the livers of both deficient and wild type mice suggested there was no
difference in the hepatic metabolic activity of either group.
Since these early investigations, there are multiple examples of the spontaneous mdr1a (-/-) CF-1
mice and the double knockout mdr1a/b (-/-) generated by Schinkel being utilised for
pharmacokinetic analysis. In the late 1990’s, the double knockout mice were used to both
investigate the role of P-gp in the pharmacokinetics of digoxin and the ability of a novel chemical
inhibitor (SDZ PSC833) to inhibit P-gp activity. The brain penetration of digoxin was markedly
increased in the knockout mice suggesting in the wild type animals brain penetration was
attenuated by P-gp, the addition of the inhibitor to the wild-type mice showed a similar increase in
brain penetration although not to the same extent. Interestingly when the inhibitor was dosed to
the knockout mice the hepatobiliary excretion of digoxin was markedly decreased (this was also
seen in the wild type animals) this suggests that the inhibitor is not selective for P-gp activity and
was causing the inhibition of other drug transporters as well. The study illustrates the power of the
P-gp knockout mice in pharmacokinetic studies with P-gp substrates.
The use of the knockout mice has helped to confirm the role of P-gp as a major barrier to blood-
brain barrier penetration. Multiple studies have confirmed an increase in absorption of a P-gp
substrate across the blood-brain barrier in P-gp knockout mice. A comparison of the blood-brain
barrier permeation of a group of substrates (loperamide, domperidone and ondansetron) and non-

49
substrates (haloperidol, clozapine and flunitrazepam) showed increased brain penetration of the
substrates in the knockout mice whilst the non-substrates showed no difference in their absorption
over wild type animals. The study highlighted the need to assess P-gp functionality as penetration of
loperamide in to the brain caused potent opiate-like activity in the knockout mice, this must be a
consideration when dosing multiple drugs as drug-drug interactions could lead to increased
concentrations of P-gp substrates in the brain. Multiple studies confirm this increase in brain
accumulation in the absence of P-gp functionality across a broad range of drugs including but not
limited to vinblastine (98), salinomycin (99), saquinavir and ritonavir (100), digoxin (101), rhodamine
123 (102) and asimadoline (103).
The use of the knockout mouse has not been limited to studies of brain penetration; it has
highlighted a role for P-glycoprotein in the pharmacokinetics of drugs at multiple barriers as well as
enhancing elimination and reducing toxicity in some cases. For example, a recent study of the
pharmacokinetics of salinomycin, a coccidiostatic antibiotic commonly fed to livestock, implicated P-
gp in both the oral bioavailability and toxicity of the drug (99). Markedly increased plasma levels of
salinomycin were recorded in P-gp deficient mice following oral dosing which was coupled with a
decrease in plasma clearance. Coupled with an increase in brain penetration it was shown that the
animals deficient in P-gp had an increased sensitivity to the drug.
The mdr1a/b (-/-) mice also show an increase in accumulation of P-gp substrates in cardiac tissue
(104). Following IV dosing the retention of doxorubicin was shown to be prolonged in the cardiac
tissue (as well as the brain and liver) of P-gp deficient mice. This highlights the risk that decreased P-
gp functionality may increase the risk of cardiac toxicity (as well as the well characterised CNS
toxicity) for drugs which are substrates of the transporter.
The effect of P-gp expression upon oral bioavailability, observed in a number of the studies
discussed above, is also well characterised in the knockout mice models. Indeed the plasma
concentration profile of paclitaxel following oral dosing has been shown to be six-fold higher in P-gp
deficient mice (105).
The spontaneous mdr1a deficient CF-1 mice have also been utilised to investigate the role of
pulmonary P-gp upon the pulmonary absorption of digoxin (23). This is currently the only example of
the use of P-gp knockout mice for the study of pulmonary pharmacokinetics. The absorption of
digoxin from the knockout mice showed no evidence of a role for P-gp in the pulmonary absorption
of digoxin. This is despite the P-gp deficient mice showing increased brain penetration and oral
bioavailability of digoxin in previous studies (101). It is possible that due to the relatively high levels

50
of mdr1b present in the lungs in comparison to the intestine that mdr1b efflux masked the effect of
mdr1a. However, this would seem unlikely as the lack of effect of pulmonary P-gp upon the lung
absorption of digoxin closely mirrors similar experiments utilising chemical inhibition (24,71)
Whilst the pharmacokinetic studies discussed here are by no means an exhaustive list they represent
the large body of literature that has been generated using P-gp deficient mice. The studies highlight
the importance of the genetic knockouts in establishing a role for P-gp in the oral bioavailability,
brain penetration, organ accumulation, clearance and toxicity of a wide range of drugs. As the
knockouts show no obvious biological changes other than P-gp expression they represent a powerful
model for the investigation of P-gp mediated effects. The inclusion of the lungs of P-gp knockout
mice in the IPML will allow the investigation of the role for P-gp in the absorption of substrates from
the lung without the confounding effects of chemical inhibition. The lack of an effect of pulmonary
P-gp seen in the absorption of digoxin with these mice should not be interpreted to reduce their
usefulness for the study of lung absorption, indeed similar effects have been seen previously with
digoxin utilising chemical inhibition.
3.1.2 Experimental objectives
The aim of this chapter is to establish a breeding colony of mdr1a/b (-/-) double knockout mice and
their relevant wild type counterparts. The application of this genetic knockout to the investigation of
the role of pulmonary P-gp will be validated by the assessment of the absorption of both paracellular
markers and a small subset of P-gp substrates (digoxin and rhodamine 123). The absorption from
both the double knockout mice and the wild type mice will be compared to the previous absorption
experiments carried out with chemical inhibition in CD1 mice.

51
3.2 Materials and Methods
3.2.1 Establishing a mdr1a/b (-/-) and mdr1a/b (+/+) breeding colony
Animals
FVB/B6 hybrid mice were bred in-house (Cardiff University, UK) and male CD1 mice were purchased
from Harlan (UK). All animals were kept under a 12 hour light-dark cycle at 21 oC and 45-60 %
humidity in conventional housing. The animals had access to food and water ad libitum. At the point
of experimentation all mice weighed 30 ± 3 g. All animal studies were ethically reviewed and carried
out as Schedule 1 in accordance with the Animals (Scientific Procedures) Act 1986 and the GSK Policy
on the Care, Welfare and Treatment of Animals.
Breeding
A pair of male double knockout mdr1a/b (-/-) FVB mice was purchased from Taconic (Hudson, NY,
USA). These knockout mice are from the same background as the double knockout mdr1a/b (-/-)
used by the group of Schinkel in the 1990’s. The disruption of the mdr1b gene had been achieved by
the insertion of a neomycin resistance cassette between the adjacent NcoI fragments containing
exons 3, 4 and 5. Secondary targeting of the mdr1a gene was achieved using the insertion of a
hygromycin resistance cassette into an XbaI site of the mdr1a gene, as shown in figure 3.2.1
(96,106).
Figure 3.2.1 A diagram showing the disruption of mdr1a and mdr1b in the knockout mice by the interruption of the genome with antibiotic resistance cassettes. Following disruption the genes no longer express functional P-gp. Adapted from Schinkel, 1997 (93).

52
In accordance with the licencing agreement for their use the male FVB double knockouts were cross-
bred in-house (Cardiff University, UK) with wild type B6 females to produce F1 heterozygous FVB/B6
hybrids. The F1 hybrids were cross-bred and the F2 generation were genotyped and bred to form a
stable colony of mdr1a/b (-/-) double knockouts and mdr1a/b (+/+) wild types. Mice in generations
F2-F5 were all genotyped. At F2 no mice exhibited homozygous double knockout, mdr1a (-/-), mdr1b
(+/-) mice were bred with mdr1a (+/-), mdr1b (-/-) mice in generations F3-F4 until sufficient numbers
of mdr1a/b (-/-) double knockouts were obtained. Concurrently, homozygous wildtype mice were
also bred to produce a stable wild type strain as a counterpart to the knockouts. Following the
establishment of both breeding colonies one male animal from each litter going forward was
genotyped to ensure the genotype was stable and non-breeding females were culled. All females
chosen for breeding purposes were genotyped before breeding.
Genotyping
Materials
DNeasyMini Kit (Qiagen, Hilden, Germany)
HotStarTaq DNA Polymerase kit (Qiagen, Hilden, Germany)
Nuclease free water (Ambion, Austin, Texas)
1 kb+ DNA ladder (New England Biolabs, Hitchin, Herts, UK).
DNA Extraction
In order to genotype the animals tail clippings were used as a tissue source and the DNA extracted
using the DNeasy Mini Kit. The protocol was performed as per the manufacturer’s instructions for
tail clipping. In summary, tail clippings were digested overnight in ligase and the resultant
supernatant was passed through a filter to which DNA adhered. Several wash steps were performed
with solutions containing 40 % ethanol to prevent the solubilisation and subsequent elution of DNA.
Elution was then achieved using 100 µL of nuclease free water and the resultant DNA solution was
stored at 4 oC.

53
Primer Sequences
The primer sequences used for the amplification of mdr1a and mdr1b can be seen in table 3.2.1. The
primers for amplification of mdr1a were provided by Taconic. The binding site for MDR1AS2 is
downstream of the insertion site of the hygromycin cassette and the primer is therefore common to
both knockout and wild type genomes. The MDR1AW2 primer binds to a region of DNA extracted
when during the insertion of the hygromycin cassette and therefore amplifies a 269bp segment of
DNA only in the wild type genome. The MDR1AKO2 primer binds within the hygromycin cassette and
therefore amplifies a segment of 461bp only in the knockout genomes.
Gene Primer Sequence
Melting
Temperature
(oC)
Wild type
product
size (bp)
Knockout
product
size (bp)
mdr1a
MDR1AS2 5-CTC CTC CAA GGT GCA TAG ACC-3
55 269 461 MDR1AW2 5-CCC AGC TCT TCA TCT AAC TAC CCT G-3
MDR1AKO2 5-CTT CCC AGC CTC TGA GCC CAG-3
mdr1b
HSAS6+ 5-CAA GCT GTG CAT GAT TCT GGG AAC-3
60 540 453 HSAS3+ 5-GGA GAG AAA CCA TGT CCT TCC AG-3
HS5NEO+ 5-TGT CAA GAC CGA CCT GTC CGG TG-3
HS3NEO2+ 5-CAT GAT ATT CGG CAA GCA GGC ATC G-3
Table 3.2.1 The primers and their respective product sizes used for the genotyping of the mdr1a/b (-/-) mice. All reactions were performed as a multiplex PCR at the stated melting temperature.
Primers for the amplification of mdr1b were designed in house using a murine mdr1b sequence
(GenBank ID 18669) and the sequence of the neomycin cassette inserted into the gene during the
generation of the knockout mice. Sequences were identified within either the neomycin cassette (for
knockout amplification) or the excluded wild type DNA sequence (for wild type amplification) which
possessed approximately 50:50 GC:AT ratios. The HSAS6+/3+ primer pair amplified a 540bp segment
of the mdr1b gene only present in the wildtype genome. The binding sites for these primers lay
within the restriction sites used for the insertion of the neomycin cassette and therefore the binding
sites were absent in the knockout genome. The knockout genome was identified by amplifying a
453bp segment from within the neomycin cassette which is present only in the knockout mice. The
primers were checked for the possibility of hairpin formation, primer dimerization using the online

54
tool OligoCalc (107) and designed to include a G/C clamp (for efficient binding primers were
designed to begin and terminate with a G or C). Melting temperatures (Tm) were also calculated
using the OligoCalc online software with primers designed to possess a Tm of 55-60 oC.
PCR amplification
Amplification of the target sequences was achieved by PCR using the HotStarTaq DNA polymerase kit
(Qiagen). The reaction was performed by adding:
2.5 µL 10x PCR buffer (final concentration of MgCl2 = 1.5 mM)
0.5 µL 10 mM dNTPs
0.125 µL DNA polymerase
0.5 µL primer stock
Nuclease free water to a final volume of 25 µL
Prior to cycling the reaction was maintained at 95 oC for 15 minutes, a necessary step for the
activation of HotStarTaq. Following the activation period the amplification was performed with
thermal cycling (35 cycles of 94 oC for 1 minute, 55 oC or 60 oC (primer Tm) for 1 minute, 72 oC for 1
minute) after cycling the mixture was maintained for a final extension period at 72 oC for 10 minutes.
Following PCR the DNA fragments were separated by agarose gel electrophoresis (1.25 % agarose) at
80 V (6.5 V/cm) for 45 minutes. During the formation of the agarose gel 3 drops of ethidium bromide
were added to the molten agarose prior to pouring. Ethidium bromide interacts with DNA and emits
fluorescence under UV light allowing the visualisation of the DNA bands. A 1kb+ DNA ladder was
loaded in to the wells immediately prior and after the PCR products in order to allow the
determination of the size of the fragments present in each band.
3.2.2 Validation of the knockouts – absorption experiments
In order to validate the use of the genetic knockout mice lungs for investigating the role of P-gp in
pulmonary pharmacokinetics, absorption experiments were conducted with two P-gp substrates
(digoxin and rhodamine 123) and the paracellular marker mannitol. The absorption of the molecules
was determined from both the wild type mdr1a/b (+/+) and the knockout mdr1a/b (-/-) lungs using
the IPML methodology described in detail in chapter 2. Briefly, the 25 µL dose (as described in
chapter 4) was administered to the IPML by forced instillation with a bolus of air utilising a Stoplock
Hamilton. All of the doses were administered as solutions in PBS (pH 7.4) containing 0.1 % DMSO as

55
detailed in chapter 4. Following dosing, the concentration of the molecule present in the perfusate
at a range of time points (0, 5, 10, 15, 20 and 30 minutes) was determined and the percentage of
deposited dose absorbed was calculated. The absorption from the knockout and wild type mice
could then be compared in order to draw conclusions about the role of P-gp in the pulmonary
absorption of the molecule.
Analysis of rhodamine 123
The perfusate samples from the experiments with rhodamine 123 were analysed by HPLC-MS/MS as
described in detail in chapter 4. Briefly, the protein was removed from the samples by precipitation
with acetonitrile (60 %) and centrifugation at 16,000 rcf for 10 minutes. Following protein
precipitation 10 µL of the sample was injected on to a C18 HPLC column for chromatic separation.
The eluted rhodamine 123 and mobile phase were then passed through the mass spectrometer for
analysis by MS/MS. Comparison of the peak areas of the samples to those of a standard curve allows
the calculation of the concentration present in each sample.
Analysis of mannitol and digoxin
In the absorption experiments detailed in this chapter, mannitol and digoxin were delivered as
radiolabelled doses (i.e. 14[C]-mannitol and 3[H]-digoxin). These radiolabelled doses were analysed by
liquid scintillation. Perfusate samples (200 µL) were added to translucent scintillation tubes.
Scintillation cocktail was added (3 mL) and the samples were measured in a Tri-Carb scintillation
counter on dual-counting mode. In the presence of decay the scintillation cocktail emits
fluorescence which is detected by the counter, in dual counting mode the fluorescence from both
3[H] and 14[C] decay are measured simultaneously and an output of counts per minute (CPM) is
produced. This is converted to decompositions per minute and gives a measure of the total amount
of each radiolabel present in the sample. By comparing the DPM of the sample to that of the dose it
is possible to calculate the % of dose absorbed to the perfusate at each time point.
Data Analysis
The absorption profiles of the two experimental groups were compared in a non-compartmental
manner using area under the curve analysis (AUC). AUC analysis was performed on the % deposited

56
dose absorbed at all time points using Graphpad Prism 5 software and presented as the mean AUC ±
S.D.
To determine the significance of any differences in absorption between the wild type mdr1a/b (+/+)
and the knockout mdr1a/b (-/-) mice an independent T-test was performed upon the percentage of
deposited dose absorbed at 30 min and the AUC analyses. In all cases significance was accepted as
p< 0.05.

57
3.3 Results
3.3.1 Evidence of genetic knockout
In order to establish a breeding colony of mdr1a/b (-/-) and mdr1a/b (+/+) mice, two homozygous,
male knockout FVB mice were purchased. As per the licence agreement for their breeding, these
were cross bred in-house with a strain of mice which is known to possess no inherent respiratory
problems (B6). The resulting F1 FVB/B6 hybrids were all heterozygous for both mdr1a and mdr1b. By
breeding the heterozygotes we were able to produce two homozygous strains, one homozygous wild
type, mdr1a/b (+/+), and one homozygous knockout, mdr1a/b (-/-).
In order to select the necessary animals for breeding, it was necessary to establish the genotype of
the mice. This was achieved by amplification of the mdr1a/b genes using primers which produced
different sized DNA fragments in the knockout and wild type mice; if both fragment sizes were
present the genotype was heterozygous for the gene. An example of this is shown in figure 3.3.1
where the results of the amplification on homozygous wild type, heterozygous and homozygous
knockout mice are shown for both genes. By selectively breeding the homozygous wild type and
homozygous knockout mice stable knockout lines were produced.
After the establishment of the breeding colonies, a single male mouse from each litter was
genotyped to ensure the maintenance of the colony. In all cases the genotype proved stable and the
homozygotes were maintained throughout the duration of the experiments.

58
Figure 3.3.1 Images showing examples of the resulting gels from agarose gel electrophoresis of the DNA fragments from all possible genotypes of the FVB/B6 hybrids. Lanes 1 and 5 are loaded with the 1kb+ ladder in order to ascertain the size of the fragments in each band. [2-4] The possible fragment profiles for the genotypes of mdr1a: [2] homozygous wild type, [3] hetorozygote and [4] homozygous knockout. [6-8] The possible fragment profiles for the genotypes of mdr1b: [6] homozygous wild type, [7] heterozygote and [8] homozygous knockout.
3.3.2 Absorption experiments – IPML
Initial absorption experiments in the IPML using the lungs of the knockout mice show similarly
discordant results of P-gp functionality as those seen in chapter 2 with chemical inhibition. As seen
in figure 3.3.2 the absorption of rhodamine 123 was significantly increased in the knockout mice in
comparison to the wild type (AUC = 376 ± 159 and 712 ± 79 %.min, respectively, p = 0.003), whereas
the absorption of digoxin was unchanged (AUC = 761 ± 128 and 910 ± 242, p = 0.44).

59
Figure 3.3.2 The absorption profiles of [A] rhodamine 123 and [B] digoxin following dosing to the
IPML with the lungs of wild type or mdr1a/b (-/-) mice. Data are presented as mean ± S.D, n = 5-6.
The paracellular permeability of the lungs showed no difference between the wild type and
knockout mice (AUC = 717 ± 60 and 734 ± 110, respectively, p = 0.894) with no difference seen in the
mannitol absorption in either experiment.
AUC (%.min)
T-test
(p)
AUC (%.min) T-test
(p)
CD1 + 0.1%
DMSO
FVB/B6 wild
type
CD1 +
GF120918
FVB/B6
knockout
Rhodamine
123 250 ± 122 376 ± 159 0.19 629 ± 181 712 ± 71 0.10
Digoxin 1051 ± 308 761 ± 128 0.58 908 ± 219 910 ± 242 0.15
Table 3.3.1 A comparison of the extent of absorption as determined by AUC between the CD1 and FVB/B6 mice with chemical and genetic knockout of P-gp function. Data are presented as mean ± S.D, n= 5-6.
In order to validate the absorption data from the FVB/B6 breeding colonies comparisons were made
to the absorption profiles from CD1 mice with chemical inhibition (table 3.3.1). As measured by AUC
the absorption of both rhodamine and digoxin showed no significant difference between both the
wild type FVB/B6 mice and the CD1 in the absence of inhibitor, or the knockout FVB/B6 mice and the
CD1 mice in the presence of GF120918. The similarity in the absorption profiles of the P-gp
substrates in both strains of mice was mirrored by the absorption of the paracellular marker,
mannitol. In the CD1 mice the AUC of mannitol absorption was 822 ± 150 %.min, this was not
significantly different to the value for the FVB/B6 mice of 717 ± 60 %.min.

60
The similarity in the extent of absorptions as measured by AUC between the two strains of mice is
also witnessed in the percentage of deposited dose absorbed throughout the experiment. Figure
3.3.3 shows the absorption profiles of mannitol, rhodamine 123 and digoxin compared between the
FVB/B6 and CD1 mice and the similarities between them are apparent.
Figure 3.3.3 A comparison of the absorption profiles for [A-B] mannitol, [C-D] rhodamine 123 and [E-
F] digoxin in the CD1 mice with chemical inhibition of P-gp and the FVB/B6 mice with genetic
knockout. [A, C, E] Show the absorption profile comparison between the wildtype FVB/B6 mice and
the CD1 in the absence of inhibitor, [B, D, F] compare the knockout mice to the CD1 experiments
with GF120918. All data are presented as mean ± S.D, n = 5-6.

61
3.4 Discussion
The use of P-gp deficient mice is well established and provides an opportunity to investigate the
impact of the drug transporter on pulmonary absorption without the confounding effects of the
inhibitor. The aim of this chapter is to generate a breeding colony of knockout mdr1a/b (-/-) FVB/B6
mice and their wild type counterparts and validate their use in studies of lung absorption by
comparing the absorption of rhodamine 123 and digoxin to previous studies.
Mice with genetic knockouts of mdr1a/b have been utilised for the investigation of the effects of P-
gp upon the pharmacokinetics of its substrates since the mid 1990’s (96) when both spontaneous
mdr1a deficient CF-1 mice and the mdr1a/b knockouts generated by Schinkel et al were first utilised.
These knockout mice have been used to demonstrate the role of P-gp in the restriction of transport
at many barriers including the brain, liver and intestine as well as the impacts of P-gp upon the
toxicity of a range of drugs and possibility of enhanced toxicity with certain dosing combinations.
The CF-1 mice which possess a spontaneous deleterious mutation of the mdr1a gene have previously
been utilised to investigate the role of P-gp in the pulmonary absorption of digoxin (23). Manford
used an instilled dose of digoxin in an in vivo drug absorption model to investigate the effect of
pulmonary P-gp upon its absorption from the lung. The study found no difference between the
absorption of digoxin from the lung in the spontaneous mdr1a (-/-) mice or the wild type
counterparts, suggesting P-gp plays no role in pulmonary absorption of digoxin. However, the same
experiments did illustrate a role for P-gp in the systemic pharmacokinetics of digoxin as a 10-fold
increase in brain accumulation was seen in the mdr1a (-/-) mice. This lack of effect of pulmonary P-
gp upon the absorption of digoxin from the lung seems surprising considering an early observation
where digoxin accumulation in the lungs of P-gp deficient mice was increased over that seen in wild
type animals (108) suggesting an impact of pulmonary P-gp on digoxin pharmacokinetics. Despite
this studies utilising chemical P-gp inhibition to investigate the effect of P-gp upon the pulmonary
absorption of digoxin all report the same lack of effect (24,71). Indeed absorption of digoxin from
the CD1 mouse lungs in chapter 2 was unaffected by the addition of a chemical inhibitor (GF120918).
There was no difference observed in the absorption of digoxin between the P-gp knockout and wild
type mice. This correlates well with the previous studies both in the literature and chapter 2 where
no effect of P-gp upon the pulmonary absorption of digoxin has been observed in a variety of models
using both chemical and genetic inhibition of P-gp functionality.

62
Similarly the increase in the absorption of rhodamine 123 seen from the lungs of the knockout mice
is in agreement with previous literature. A previous study utilising chemical inhibition of P-gp in an
IPRL witnessed a similar effect with an increase in both the rate and extent of rhodamine 123
absorption when co-dosed with an inihibitor (22).
Interestingly the absorption of both substrates (digoxin and rhodamine 123) in the genetic mdr1a/b
knockout model showed no significant difference to the comparable chemical inhibition studies in
CD1 mice, i.e. the results of chemical and genetic inhibition of P-gp produced similar absorption
profiles in the CD1 and FVB/B6 mice. Thus proving that the increase in the pulmonary absorption of
rhodamine 123 in the presence of GF120918 is due to the presence of P-gp and not a non-P-gp
mediated effect of the inhibitor. This similarity in absorption profiles between the chemical and
genetic inhibition models also further validates the use of the knockout mice in the IPML due to the
consistency of the results with the published literature.
The lack of difference in the absorption of digoxin and mannitol between the wild type FVB/B6 and
the mdr1a/b (-/-) mice illustrates that there is no general increase in the permeability of the
knockout lungs. If the genetic knockout of P-gp increased the overall pulmonary permeability we
would have expected to see an increase in absorption for all molecules and this is not the case.
Conversely the increase witnessed in the absorption of rhodamine 123 from the knockout lungs
shows that the model is capable of highlighting an effect of P-gp upon the absorption of a substrate
whose pulmonary absorption has previously been shown to be attenuated by P-gp. Therefore
showing that the IPML performed with P-gp knockout mice is a suitable model for determining the
role of P-gp in the pulmonary absorption of its substrates.

63
Chapter 4
Pulmonary absorption in the IPML with mdr1a/b (-/-) mice

64
4.1 Introduction
4.1.1 Pulmonary expression of P-glycoprotein
P-glycoprotein (P-gp) is a broad substrate drug-transporter encoded by the MDR1 gene in humans
and the mdr1a and mdr1b genes in rodents. It is amongst the most highly studied of the ABC
transporters with a large volume of published work in a range of barriers including the intestine,
kidney, liver and blood-brain barrier (BBB). P-gp substrates cover a broad range of therapeutic
classes and physicochemical properties although they tend to be lipophilic or amphipathic (3)
enabling entry in to the plasma membrane, a necessity for interaction with the transporter’s
substrate binding site.
Gene expression in the lung
In 2006 Bleasby et al. (5) performed a microarray analysis of transporter expression across a range of
species and organs. In all species the expression witnessed in the lung was in the lower quartile, a far
lower level than that seen in the intestine or the liver, however, it does need to be considered that
the analysis was done on whole organ homogenate and as such the heterogeneous nature of the
lung tissue could have served to dilute the mRNA transcript level if only a few cell types show
expression. It does seem likely, however, that the expression levels in the lung epithelia are not as
high as those seen in the intestine. It is interesting to note that in the rodent species the level of
expression of mdr1b was higher than mdr1a in the lung, whereas in all other studied mdr1a is the
more abundant (109). This observation has also been made in in vitro cell models, specifically those
of primary isolated alveolar cells (110).
Protein expression in the lung
A number of groups since the early 1990’s have investigated the spatial expression of P-gp within the
lung using immunohistochemical (IHC) analyses. All observed P-gp expression within the lung
epithelia but there are discrepancies with the localisations dependent on the specific techniques and
antibodies used.
Initially Cordon-Cardo et al. (111) and van der Valk et al. (112)showed positive staining on the
luminal surface of bronchial and bronchiolar epithelial cells in frozen tissue samples of human lung.
The group of van der Valk also showed variable staining of the alveolar epithelia depending on the
antibody used and positive staining of alveolar macrophages. The positive staining of the bronchial
epithelia also has been seen by all groups (110,113,114). The alveolar staining witnessed by van der
Valk et al. has also been more recently confirmed in studies by Campbell et al. (110) and Endter et al.

65
(115) with Campbell showing positive staining of the intact alveolar epithelia of rats and Endter with
human tissue samples, both groups also showed the presence of the P-gp protein by Western blot
analysis in the respective isolated primary alveolar cell lines.
Functional evidence - in vitro studies
Currently there is no standard cell line used in in vitro studies of drug permeability instead many cell
lines, both immortalised and primary, are used. Work by the group of Endter et al. (115) showed
polarised transport of the well characterised P-gp substrate rhodamine 123 (rh123) in primary
isolated human alveolar epithelial cells, this was both saturable and inhibited by verapamil (a well
characterised P-gp inhibitor), together providing good evidence for P-gp mediated efflux. A similar
study was performed in rat primary cells by Campbell et al. (110) in which the accumulation of rh123
was increased by co-incubation with verapamil. Later work by Madlova et al. (24) using the human
NHBE and Calu-3 cell lines showed polarised transport of digoxin in both cell types, although
transport was less polarised than in the intestinal Caco-2 cells. In all cell lines the polarised transport
was abolished by co-dosing with GF120918, a selective P-gp inhibitor. P-gp efflux from Calu-3 cells
has also been demonstrated using the fluoroquinolone antibiotic moxifloxacin (116), again using a P-
gp inhibitor (PSC-833). Finally Ehrhardt et al. (117) showed polarised transport of rh123 in the
bronchial epithelia cell line 16HBE14o- which was inhibited by co-dosing with verapamil.
Taken together these studies provide compelling evidence that pulmonary cells grown in vitro
express functional P-gp at a level high enough to significantly impact the PK/PD of drugs delivered to
the lung or indeed drugs with sites of action in the lung delivered systemically. Questions are raised
however about the expression of transporter proteins in these in vitro cell lines in comparison to
intact pulmonary epithelia and whether they are truly models of the pulmonary barrier. To this end
studies in intact lungs are necessary to elucidate a role for the transporters if there is one.
Functional evidence – intact lung studies
Although P-gp is the most well studied of the pulmonary drug transporters data in an intact lung
system is still scarce. In 2003, the group of Kuhlmann et al. (118) looked at the effect of P-gp on the
accumulation of idarubicin in lung tissue after dosing via the circulation. They found that in the
experiments with the inhibitors the accumulation of the substrate in lung tissue was significantly
increased. This would imply that P-gp inhibition is occurring at the endothelial barrier preventing
efflux back in to the blood, a finding supported by a similar study by Roerig (73) in a rabbit model
with rhodamine 6G performed a year later.
66
This hypothesis appears to be in agreement with experiments carried out by the group of Tronde et
al. (38). These experiments investigated the absorption of drugs from the lung in to the blood using
both in vivo and isolated lung models. In both cases the absorption of losartan was above 95% and it
was assumed that there was no attenuating effect of P-gp efflux on absorption from the lung lumen.
The experiments were not designed to investigate efflux and therefore the concentrations used
were higher than ideal and could cause saturation of the pump and the group did not use P-gp
inhibitors to investigate efflux. It therefore could not be determined if P-gp effected the rate of
absorption, this could be a distinct possibility due to the observed rate of absorption of losartan
being considerably lower than would be predicted from its physicochemical properties.
Manford et al. (23) provided further evidence for the lack of effect of P-gp from the lumen to blood
using digoxin as a substrate in an isolated rat lung. Then group used spontaneous mdr1a deficient
mice and showed that there was no difference in the rate and extent of digoxin absorption between
the deficient and control mice. Contrary to this a study in a similar isolated rat lung model using
rhodamine 123 as the substrate showed a significant increase in the absorption of rhodamine 123
from the lung to the blood when co-dosed with GF120918 (a selective P-gp inhibitor) (22).
Subsequently a study was published investigating the effects of pulmonary P-gp in an isolated lung
on a larger selection of substrates (71). This work corroborates the results of both of the previous
two studies using both rat and mouse isolated perfused lung models. In both models a significant
increase in the absorption of rhodamine 123 was observed when co-dosed with GF120918, an
observation not seen in digoxin where the inhibitor did not alter the absorption profile. This
observation was expanded upon in the same publication with two other P-gp substrates, loperamide
and saquinavir. A similar pattern was seen with the two new compounds, loperamide appears
similar to rhodamine 123 and shows increased absorption in the presence of the inhibitor, and
conversely saquinavir absorption was not altered by co-dosing with GF120918.
Summary
The studies discussed above provide persuasive evidence for a role for P-gp in lung tissue, its
presence has been observed in a variety of models from in vitro cell culture to human sections at
both the protein and mRNA levels and functionality has now been observed in isolated perfused lung
models in both rat and mouse. P-gp efflux has been shown to reduce the absorption of a set of
substrates from the airways to the blood yet the transporter appears to have no effect on other well
characterised substrates such as digoxin. Despite this it is apparent that P-gp can affect drug
absorption after pulmonary delivery and as such needs to be considered when developing and

67
delivering drugs which are known substrates as it could well significantly impact their
pharmacokinetics/dynamics.
4.1.2 The IPL for studies of pulmonary drug transporters
As described above, the IPL model has been utilised to investigate the role of P-gp upon the
pulmonary absorption of a small number of its substrates. In addition to these studies the model has
been used to investigate the effects of other pulmonary drug transporters.
Active transport processes have been observed in the IPL model as both active uptake and active
efflux. The work of Sakagami (68,119) has shown saturable and inhibitable uptake of both F-PHEA
and IgG from the ex vivo rat lung. Initial experiments with F-PHEA showed unexpectedly rapid
absorption, far more rapid than would be expected from the molecules physicochemical
characteristics. The group suggested this was attributable to active uptake within the lung and
accounted for high transport rate by adjusting the simple passive model of Byron to include
Michaelis-Menton kinetics of active uptake. The evidence for this assumption was provided by IPL
experiments performed at lower temperatures and dosed with transcytosis inhibitors, both of which
reduced the transport rate back towards the level initially expected.
Despite the scarcity of data on the use of an IPL for the assessment of the role of pulmonary drug
transporters on pharmacokinetics in the lung, the experiments discussed here reveal the ability of
the isolated perfused lung models to identify the impact of transporter proteins, both for active
uptake and for efflux. IPL model shave been used to comprise the first evidence of a role for drug
transporters within an intact lung, a role which, though suggested, has yet to be confirmed using the
comparable in vivo models. This may well be due to the isolated lung models preventing the
confounding effects of the transporters at other barriers such as the liver which make whole body
experiments more difficult to interpret.
4.1.3 Experimental Objectives
Here we aim to further investigate the apparent discordance in the literature with regards to the
effects of pulmonary P-gp upon the absorption of its substrates form the lung. Currently, it appears
that not all substrates which are effluxed by P-gp at other barriers are affected by the transporter in
the lung. In order to investigate this further, this chapter aims to investigate the absorption of a
larger and diverse panel of P-gp substrates in an attempt to ascertain the mechanism behind the
discordance.

68
4.2 Material & Methods
4.2.1 Materials
Chemicals and Equipment
P-glycoprotein (P-gp) substrates dosed to the lungs of the IPML and analysed by tandem mass
spectrometry (LC-MS/MS) are shown in table 4.2.1 below.
Salt Purity Purchase Code
Acrivastine
> 98% HPLC SML0119
Chloroquine Diphosphate salt > 98% HPLC C6628
Colchicine
> 95% HPLC C9754
Domperidone
> 98% HPLC D122
Eletriptan Hydrobromide >98% HPLC PZ0011
Erythromycin
> 95% E5389
GSK1
n/a
GSK2
n/a
GSK3
n/a
Indacaterol
n/a
Mitoxantrone Dihydrochloride > 97% HPLC M6545
Monensin Sodium salt 90 - 95% TLC M5273
Puromycin Dihydrochloride hydrate 99% 10781691
Rhodamine
123 > 98% GC R8004
Salbutamol
> 96% GC S8260
Salmeterol Xinafoate > 98% HPLC S5068
Saquinavir Mesylate > 98% HPLC S8451
Table 4.2.1 The non-radiolabelled P-gp substrates delivered to the IPML along with their salts, purities and supplier details.
Digoxin and the mannitol controls were delivered to the lung as radiolabelled doses, allowing the
delivery of a much lower amount of drug whilst still retaining the necessary lower limit of
quantification (LLQ). The details of these radiolabelled compounds are found in table 4.2.2 below.

69
Compound Radiolabel Radioactivity Purchase Code Supplier
Digoxin [3H(G)] 15-40 Ci/mmol NET222250UC PerkinElmer, USA
Mannitol D-[2-3H] 10-20 Ci/mmol ART 0263 ARC, St Louis, MO, USA
Mannitol D-[1-14C] 50-60 mCi/mmol ARC 0127 ARC, St Louis, MO, USA
Table 4.2.2 Compounds delivered to the IPML as radiolabels either as P-gp substrates or paracellular permeability markers. Compounds are shown along with their relevant radiolabels and supplier details.
The equipment for performing the IPML experiments, as well as the relevant chemicals for the
production of the perfusate and phosphate buffered saline (PBS), were the same as those shown in
chapter 2.
Chemicals used in the analysis of substrate and control permeability data are shown in table 4.2.3
below. The equipment used for the analysis is summarised in table 4.2.4.
Chemical Descriptor
Product
Code Supplier
Acetonitrile HPLC Grade 10407440 Fisher Scientific, Loughborough, UK
Methanol LCMS Grade 10653963 Fisher Scientific, Loughborough, UK
Formic Acid 98% 10559570 Fisher Scientific, Loughborough, UK
Dimethyl Sulfoxide n/a 10080110 Fisher Scientific, Loughborough, UK
Scintillation fluid ScintiSafe 3 SC/9205/21 Fisher Scientific, Loughborough, UK
Table 4.2.3 Chemicals used in the analysis of compounds delivered to the IPML along with their supplier details.

70
Equipment Manufacturer Product Identifier
Solvent Degasser Thermo Finnigan SCM1000
Pump Thermo Finnigan P4000
Autosampler Thermo Finnigan AS3000
UV detector Thermo Finnigan UV2000
LC-MS/MS Thermo Finnigan LCQ Classic
HPLC Column Kromasil C18 3.5u 150 x 2.0 mm
Scintillation Counter Packard Tri-Carb 2900TR
Table 4.2.4 Equipment used in the analysis of compounds delivered to the IPML and the relevant manufacturer details.
Animals
Male pathogen-free FVB/Bl6 mice, which were bred on site as per chapter 3, were used throughout
the experiments. The breeding program produced two distinct groups of FVB/Bl6 mice, the first fully
expressed wild type levels of mdr1a and mdr1b (mdr1a/b (+/+)) and the second group were
knockouts, with no functional expression of these genes (mdr1a/b (-/-)). The mice were housed in
temperature and humidity controlled rooms (19-21 oC and 40-60 % humidity) with a 12 hour dark-
light cycle. All mice had access to food and water ad libitum and were acclimatised for at least 24
hours following transport from the breeding facility to the experimental laboratories. All animal
experiments were performed in adherence to the Animal (Scientific Procedures) Act 1986 and were
approved by Cardiff University and GSK, Stevenage.
4.2.2 Analytical Methods
Analytical methods – HPLC-MS/MS
In order to ascertain the absorption profiles of the substrates from the airways of the IPML analytical
methods were developed to determine the substrate concentrations within the perfusate reservoir.
All substrates, with the exception of digoxin, were analysed by high performance liquid
chromatography tandem mass spectrometry (HPLC-MS/MS).
Mass spectrometry is an analytical technique which enables the measurement of a molecules
mass/charge ratio (M/Z). This M/Z is utilised in many laboratory techniques to determine the mass

71
of particles and elucidate chemical structures and elemental and isotopic composition. Tandem mass
spectrometry (MS/MS) allows for a greater specificity than regular MS techniques. In MS/MS a
specific ion may be trapped utilising the ion trap and collided with helium (He) gas causing it to
fragment. As the spectra of the fragments formed are specific to the collision energy and parent
molecule they can provide further specificity and filtering over single MS techniques. In certain
techniques the fragments themselves can be trapped and collided once more with He gas allowing
multiple stages of fragmentation, this can be often be of diagnostic value in the structural
determination of complex molecules such as proteins.
A combination of both HPLC and LC-MS/MS techniques enabled the analysis of substrate
concentrations in the perfusate samples of the IPML model. Following the injection and subsequent
chromatographic separation on a C18 column, the mobile phase (and therefore substrate) is passed
through the ion source of the mass spectrometer. The mobile phase which is pumped through the
column before substrate elution is discarded due to the presence of large amounts of salt (which do
not adhere to the column and elute rapidly) which can damage the mass spectrometer. Following
ionisation of the substrate ions are separated according to their M/Z and either fragmented
(MS/MS) or passed straight to the detector. The extent of the signal produced by the collisions of the
substrate ion or fragment with the detector directly correlates to the amount of ion present; thus
allowing the comparison to a standard curve to determine the concentration present in the original
perfusate sample.
Before injection onto the C18 column it was necessary to remove the protein from the samples to
prevent column degradation. This was achieved by protein precipitation with organic solvent. In the
case of samples which would be run with acetonitrile (ACN) and water as the mobile phase ACN was
added to the sample at a 2:1 volume to volume ratio. This mixture was then vortexed and allowed to
rest for 1 minute. Subsequently the precipitated proteins were separated by centrifugation at 16,000
rcf for 10 mins at 4 oC. Substrates which were run with methanol (MeOH) as a mobile phase utilised
ice-cold MeOH in place of ACN to perform the precipitation in order to prevent changes in column
adherence during the chromatography.
In order to carry out the HPLC separation, 10 µL of protein precipitates sample was injected onto a
C18 HPLC column and the relevant mobile phase was pumped at 0.2 mL/min either as an isocratic
flow or as a gradient (table 4.2.5). The chromatic separation was performed with a column
temperature of 30 oC using the column oven to ensure the temperature remained constant

72
throughout the analyses. The elution time from the column was substrate specific but mobile phase
conditions were altered to ensure elution occurred at least 1 minute after the injection peaks.
Mobile phase from 30 seconds before the elution of a substrate to 1 minute after was directed to
the ion source of the mass spectrometer. Substrates which showed insufficient LLQ using LC-MS
analysis were analysed using LC-MS/MS which allowed for higher specificity and therefore sensitivity
in the analysis, as observed by increases in the peak areas produced by the mass spectrometer. The
MS/MS detector settings utilised in the analysis can be seen in table 4.2.6.
In order to obtain concentrations from the peak areas produced by the MS or MS/MS analysis
comparisons were made to standard curves. Standard curves for all substrates were prepared in
perfusate (3.25 to 200 ng/mL) and were run with a blank perfusate sample before and after; a blank
was also included between each animal’s samples. Standard curve samples were prepared by
protein precipitation in a manner consistent with the IPML samples. Standard curves were prepared
and analysed at the beginning of every experimental analysis run.
In order to test for ion suppression the 200 ng/mL standard was injected twice in succession and
differences in peak area between the two injections were recorded.

73
Mobile Phase Separation
Conditions
Parent
(M/Z)
Daughter
(M/Z)
Collision
Energy
(mV) A B
Acrivastine MeOH H20 + 0.1% FA 50-95% A, gradient 349
Chloroquine ACN H20 + 0.1% FA 5-95% A, gradient 320
Colchicine ACN H20 + 0.1% FA 5-95% A, gradient 400
Domperidone MeOH H20 + 0.1% FA 40% A, isochratic 426 175 35
Eletriptan ACN H20 + 0.1% FA 5-95% A, gradient 383
Erythromycin ACN H20 + 0.1% FA 60-95% A, gradient 734
GSK1 ACN H20 + 0.1% FA 5-95% A, gradient 572
GSK2 ACN H20 + 0.1% FA 5-95% A, gradient 496
GSK3 ACN H20 + 0.1% FA 5-95% A, gradient 467
Indacaterol ACN H20 + 0.1% FA 5-95% A, gradient 394
Mitoxantrone MeOH H20 + 0.1% FA 30-70% A, gradient 445 358 30
Monensin ACN H20 + 0.1% FA 70-100% A, gradient 694 675 30
Puromycin ACN H20 + 0.1% FA 5-95% A, gradient 472
Rh-123 ACN H20 + 0.1% FA 5-95% A, gradient 345
Salbutamol ACN H20 + 0.1% FA 5-95% A, gradient 240
Salmeterol ACN H20 + 0.1% FA 5-95% A, gradient 417
Saquinavir mesylate ACN H20 + 0.1% FA 5-95% A, gradient 670 416 30
Table 4.2.5 Substrate specific conditions used for the analysis by HPLC-MS/MS. A and B indicate the composition of the mobile phase utilised for HPLC. The separation conditions specify the concentrations of each component of the mobile phase used for separation. The parent (M/Z) indicates the isolated mass charge for each substrate during MS analysis. Compounds shown with a daughter M/Z indicate that MS/MS was used for their analysis and the parent was fragmented by the stated collision energy to produce a daughter fragment; this daughter fragment was then analysed to provide concentration data.

74
Detector Thermo Finnigan LCQ Classic
Mode MS or MSMS
Ion Source ESI (electrospray ionisation)
Ionisation positive
Source Temperature 450 oC
Table 4.2.6 MS/MS detector conditions used for all substrates
Analysis of radiolabelled compounds
Perfusate samples (200 µL) were added to translucent scintillation tubes. Scintillation cocktail was
added (3 mL) and the samples were measured in a Tri-Carb scintillation counter on dual-counting
mode. In the presence of decay the scintillation cocktail emits fluorescence which is detected by the
counter, in dual counting mode the fluorescence from both 3[H] and 14[C] decay are measured
simultaneously and an output of counts per minute (CPM) is produced. This is converted to
decompositions per minute and gives a measure of the total amount of each radiolabel present in
the sample. By comparing the DPM of the sample to that of the dose it is possible to calculate the %
of dose absorbed to the perfusate at each time point.
4.2.3 Absorption experiments
Absorption of substrates from the airways - dosing
In order to investigate the role of P-gp in the absorption of its substrates from the lung a panel of 18
substrates were administered to the lung. As described in chapter 2 reproducible dosing to the
peripheral airways was achieved using a 250 µL stop-lock Hamilton syringe with a 25 µL dose and a
250 µL bolus of air. The syringe was inserted into the trachea until 2 mm before the bifurcation. The
contents were then pressurised with the valve closed by depressing the syringe. Upon opening the
valve the dose was then ejected and the bolus of air deposited dose equally to all lobes and in to the
peripheral airways. See chapter 2 for a more thorough discussion.
All of the doses were administered as solutions in PBS (pH 7.4) containing 0.1 % DMSO. Drug stocks
of 10 mg/mL in DMSO were diluted in PBS to form solutions of 50 µM. The relevant amount of

75
DMSO was added during this dilution to ensure all doses contained 0.5 % DMSO. Table 4.2.7 shows
the final amounts of substrate stock, DMSO and PBS added to each dose.
MW
(Da)
Stock
Concentration
(mg/mL)
Stock
added to
dose (µL)
DMSO
added to
dose (µL)
PBS added
to dose (µL)
Acrivastine 348 10 1.74 3.26 995
Chloroquine 319 10 1.60 3.41 995
Colchicine 399 10 2.00 3.01 995
Digoxin 780 10 3.90 1.10 995
Domperidone 425 10 2.13 2.88 995
Eletriptan 382 10 1.91 3.09 995
Erythromycin 733 10 3.67 1.34 995
GSK1 571 10 2.85 2.15 995
GSK2 495 10 2.47 2.53 995
GSK3 466 10 2.33 2.67 995
Indacaterol 393 10 1.96 3.04 995
Mitoxantrone 444 10 2.22 2.78 995
Monensin 670 10 3.35 1.65 995
Puromycin 471 10 2.36 2.65 995
Rh-123 344 10 1.72 3.28 995
Salbutamol 239 10 1.20 3.81 995
Salmeterol 416 10 2.08 2.92 995
Saquinavir mesylate 670 10 3.35 1.65 995
Table 4.2.7 The composition of the doses delivered to the airways of the IPML, in all cases the final dose concentration is 50 µM in a solution of PBS containing 0.5% DMSO.
The dose concentration was chosen to match that previously used in investigations with rhodamine
123. In the case of rhodamine 123 a 25 µL dose (50 µM) contained 430 ng of substrate. Assuming a
low extent of bioavailability from the lung of 10% of the deposited dose absorbed 43 ng of
rhodamine 123 would be absorbed to the perfusate. As the perfusate volume is fixed at 10 mL this
level of absorption would result in rhodamine 123 perfusate concentrations of 4.3 ng/mL; this is
above the LLQ for rhodamine 123 of 3.25 ng/mL. After the addition of the 25 µL dose to the mouse
lungs it is estimated that the total fluid volume of the lungs (epithelial lining fluid (ELF) plus the dose)
will be increased to approximately 50 µL (120). This will result in initial rhodamine 123

76
concentrations within the lung of approximately 25 µM (8.6 µg/mL); a level consistent with studies
performed in the isolated rat lung (71,86) and around the reported P-gp Km for rhodamine 123
(75,121,122).
In order to ensure the integrity of the lung-blood barrier in each experiment was comparable 0.25
µCi of radiolabelled mannitol was included in each dose. For experiments analysed by HPLC-MS/MS
this was in the form of 25 pmol of 3[H]-mannitol. As the digoxin used in the IPML experiments was
also radiolabelled with 3[H] a different radiolabel was required for the control to distinguish between
the two during analysis. To this end 0.25 µCi of 14[C]-mannitol was used as the paracellular control in
the digoxin experiments (16.7 pmol). Both forms of radiolabelled mannitol were stored as solutions
in ethanol. To add this to the dose the relevant amount was removed and transferred to a pipette,
this was allowed to dry overnight in a fume cupboard. The substrate dose could then be added and
the mixture vortexed to dissolve the mannitol.
Absorption of substrates from the airways - IPML
To investigate the effect of P-gp upon the pulmonary absorption of a panel of substrates an IPML
model was utilised. Substrate doses (as described above) were delivered to the airways of the lungs
by forced instillation (as described in chapter 2) of both mdr1a/b (+/+) wild type and mdr1a/b (-/-)
knockout mice. The absorption profiles for both groups of mice were determined by changes in the
concentration of substrate in the perfusate reservoir throughout the experiment. To this end
perfusate samples were removed at 0, 1, 5, 10, 15, 20 and 30 min post dosing and replaced with
fresh perfusate at 37oC. Perfusate samples were analysed by either HPLC-MS/MS or scintillation
counting as described earlier.
The validation and use of the knockout mice was discussed in chapter 3, where it was shown that the
barrier properties of the two groups were not changed by P-gp knockout. Any change in the % of
deposited dose absorbed between the two groups presented here was therefore attributed to P-gp
expression alone. In all cases the paracellular marker, mannitol, was included in the dose as a
radiolabelled compound. The comparison of mannitol absorption profiles between experiments was
used to ensure consistent paracellular permeability and barrier integrity both within and between
experimental groups.

77
Absorption of substrates from the airways – power analysis
In order to determine the sample size (number of mice) necessary to provide sufficient statistical
power to the investigations a power analysis was carried out using the initial absorption data for
rhodamine 123. As is shown in figure 4.2.1 the calculated sample size required for sufficient
statistical power (0.95) at a 15 % increase in deposited dose absorbed is n = 6.
In order to reduce the number of mice needed for the study significance was tested at n=4 as
described in 4.2.2 Data analysis. If the difference in % deposited dose absorbed between the wild
type and knockout mice was significant, no further experiments were performed, if there was no
significant difference sample size was increased up to n = 6. If no significant difference was observed
between the experimental groups at n = 6 it was deemed that P-gp had no effect upon the
absorption of the substrate from the IPML.
Figure 4.2.1 The sample size required for a statistical power of 0.95 at a range of changes in the % of dose absorbed. Analysis was generated using the mean and variance data for rhodamine 123 absorption studies. The sample size required to generate sufficient power (0.95) to identify a change of 15 % dose absorbed is n = 6.

78
Data Analysis
In order to understand the effects of P-gp knockdown upon the rate and extent of absorption a
compartmental modelling approach was applied to the data. Using WinNonlin values for the rate of
absorption (ka) and the bioavailability (F) were calculated according to a single compartment model
by applying the following equation:
)
(Where dose can be set to 100%)
Graphs representing the visual fit of the same equation were produced using Graphpad Prism 5
software.
The absorption profiles of the two experimental groups were also compared in a non-
compartmental manner using area under the curve analysis (AUC). AUC analysis was performed on
the % deposited dose absorbed at all time points using Graphpad Prism 5 software.
To determine the significance of the differences in absorption between the wild type mdr1a/b (+/+)
and the knockout mdr1a/b (-/-) mice an independent T-test was performed upon the percentage of
deposited dose absorbed at 30 min and the AUC analyses. In all cases significance was accepted as
p< 0.05.
Correlations between datasets were performed using Microsoft Excel 2010 by calculating the
Pearson’s moment of correlation. Graphs representing these correlations were generated using
Graphpad Prism 5 software.

79
4.3 Results
4.3.1 HPLC-MS/MS Validation, Precision and Accuracy
The precision of the analysis for all molecules analysed using HPLC-MS/MS was investigated by
determining the coefficients of variation (% CV) for all molecules (n = 4) at opposing ends of the
concentration range for analysis, 3.25 and 200 ng/mL. Results are shown Table 4.3.1 and 2 and % Cv
values of less than 15 % were deemed acceptable for quantification with regards to precision (123).
Accuracy was calculated at the same concentrations by comparing calculated concentrations from
the analysis to the nominal concentration expected, an accuracy of ± 20% was deemed acceptable
for analysis (123). In all cases the analysis of every molecule was deemed acceptable between the
concentration range of 3.25 to 200 ng/mL.

80
3.25 ng/mL
Mean
(ng/mL)
Standard
Deviation
Coefficient
of
Variation
(% Cv)
Accuracy
Acrivastine 12.28 0.81 6.58 101.76
Erythromycin 13.36 1.34 10.04 93.59
GSK1 12.07 1.17 9.73 103.54
Mitoxantrone 12.87 0.99 7.68 97.16
Monensin 11.09 1.00 9.01 112.70
Puromycin 11.99 0.65 5.46 104.28
Saquinavir 13.17 1.22 9.30 94.89
Chloroquine 13.41 1.11 8.30 93.20
Colchicine 13.16 1.27 9.61 94.96
Domperidone 11.14 0.81 7.31 112.20
Eletriptan 12.57 0.46 3.63 99.45
GSK2 12.19 0.65 5.37 102.54
GSK3 12.27 0.87 7.06 101.91
Indacaterol 12.05 1.15 9.58 103.69
Rhodamine 123 12.86 0.46 3.57 97.22
Salbutamol 12.97 0.56 4.34 96.41
Salmeterol 13.47 0.32 2.39 92.82
Table 4.3.1 Coefficients of variation for precision of analysis at 3.25 ng/mL

81
200 ng/mL
Mean
(ng/mL)
Standard
Deviation
Coefficient
of
Variation
(% Cv)
Accuracy
Acrivastine 240.58 33.19 13.80 83.13
Erythromycin 206.46 15.99 7.74 96.87
GSK1 187.91 27.40 14.58 106.44
Mitoxantrone 203.37 13.65 6.71 98.35
Monensin 192.84 8.45 4.38 103.71
Puromycin 189.24 9.58 5.06 105.69
Saquinavir 187.22 11.10 5.93 106.83
Chloroquine 200.06 19.73 9.86 99.97
Colchicine 211.55 17.69 8.36 94.54
Domperidone 216.92 15.37 7.09 92.20
Eletriptan 187.56 11.65 6.21 106.63
GSK2 185.05 12.96 7.00 108.08
GSK3 199.65 19.65 9.84 100.17
Indacaterol 203.65 8.65 4.25 98.21
Rhodamine 123 223.91 25.00 11.16 89.32
Salbutamol 187.69 24.65 13.14 106.56
Salmeterol 223.33 21.49 9.62 89.56
Table 4.3.2 Coefficients of variation for precision of analysis at 200 ng/mL

82
4.3.2 Absorption experiments - IPML
The absorption profiles of 18 P-gp substrates were determined in both the wildtype mdr1a/b (+/+)
mice and the knockout mdr1a/b (-/-) mice following drug deposition to the airways of the IPML by
measuring accumulation in the perfusate reservoir.
As illustrated by figures 4.3.1 to 3, 10 of the 18 substrates tested show a significantly higher
percentage of the deposited dose absorbed (p < 0.05) when P-gp functionality is attenuated (i.e. in
the knockout mice), whilst 8 show no difference in absorption profile between the two experimental
groups. This would indicate that P-gp acted to attenuate the absorption of 10 substrates but had no
effect on the absorption of the remaining 8.

83
Figure 4.3.1 Absorption profiles from the airways of the IPML in to perfusate for both the wild-type
mdr1a/b (+/+) mice and the knockout mdr1a/b (-/-) mice for [A] acrivastine (n=4), [B] chloroquine
(n=4), [C] colchicine (n=4), [D] digoxin (n=6), [E] domperidone (n=4) and [F] eletriptan (n=4). In all
cases data is presented as the mean ± SD of the percentage of the lung deposited dose absorbed at
distinct time points, * indicates a significant difference between the wild-type and knockout mice at
that time point.

84
4.3.2.1 Pulmonary absorption of acrivastine
Following deposition of acrivastine in to the airways of wildtype FVB/B6 mice 12 % of the dose was
absorbed within 30 minutes as determined by the increasing perfusate concentrations. In
comparison the same experiments in the knockout mdr1a/b (-/-) mice showed a total of 13 % of the
dose absorbed over the same time frame. As illustrated in figure 4.3.1 and shown in table 4.3.3 this
increase in percentage dose absorbed in the knockout mice was not significant (p>0.05) at any time
with the absorption curves in both the wild type and knockout mice being similar. The lack of an
increase in absorption in the absence of functional P-gp suggests that the protein does not play a
role in the absorption of acrivastine from the lung in this model.
4.3.2.2 Pulmonary absorption of chloroquine
Following deposition of chloroquine in to the airways of wildtype FVB/B6 mice 46 % of the dose was
absorbed within 30 minutes as determined by the increasing perfusate concentrations. In
comparison the same experiments in the knockout mdr1a/b (-/-) mice showed a total of 65 % dose
absorbed over the same time frame. As illustrated in figure 4.3.1 and shown in table 4.3.3 this
increase in percentage dose absorbed in the knockout mice was significant (p<0.05) at the 15 and 30
minute time points. The increase in absorption in the absence of functional P-gp illustrates a role for
the protein in limiting pulmonary absorption of chloroquine.
4.3.2.3 Pulmonary absorption of colchicine
Following deposition of colchicine in to the airways of wildtype FVB/B6 mice 18 % of the dose was
absorbed within 30 minutes as determined by the increasing perfusate concentrations. In
comparison the same experiments in the knockout mdr1a/b (-/-) mice showed a total of 25 % dose
absorbed over the same time frame. As illustrated in figure 4.3.1 and shown in table 4.3.3 this
increase in percentage dose absorbed in the knockout mice was significant (p<0.05) at the 20 and 30
minute time points. The increase in absorption in the absence of functional P-gp illustrates a role for
the protein in limiting pulmonary absorption of colchicine.

85
4.3.2.4 Pulmonary absorption of digoxin
Following deposition of digoxin in to the airways of wildtype FVB/B6 mice 40 % of the dose was
absorbed within 30 minutes as determined by the increasing perfusate concentrations. In
comparison the same experiments in the knockout mdr1a/b (-/-) mice showed a total of 42 % of the
dose absorbed over the same time frame. As illustrated in figure 4.3.1 and shown in table 4.3.3 this
increase in percentage dose absorbed in the knockout mice was not significant (p>0.05) at any time
with the absorption curves in both the wild type and knockout mice being similar. The lack of an
increase in absorption in the absence of functional P-gp suggests that the protein does not play a
role in the absorption of digoxin from the lung in this model.
4.3.2.5 Pulmonary absorption of domperidone
Following deposition of domperidone in to the airways of wildtype FVB/B6 mice 28 % of the dose
was absorbed within 30 minutes as determined by the increasing perfusate concentrations. In
comparison the same experiments in the knockout mdr1a/b (-/-) mice showed a total of 44 % dose
absorbed over the same time frame. As illustrated in figure 4.3.1 and shown in table 4.3.3 this
increase in percentage dose absorbed in the knockout mice was significant (p<0.05) at time points
after and including 10 minutes. The increase in absorption in the absence of functional P-gp
illustrates a role for the protein in limiting pulmonary absorption of domperidone.
4.3.2.6 Pulmonary absorption of eletriptan
Following deposition of eletriptan in to the airways of wildtype FVB/B6 mice 18 % of the dose was
absorbed within 30 minutes as determined by the increasing perfusate concentrations. In
comparison the same experiments in the knockout mdr1a/b (-/-) mice showed a total of 27 % of the
dose absorbed over the same time frame. As illustrated in figure 4.3.1 and shown in table 4.3.3 this
increase in percentage dose absorbed in the knockout mice was significant (p<0.05) at the 30 minute
time point. The increase in absorption in the absence of functional P-gp illustrates a role for the
protein in limiting pulmonary absorption of eletriptan.

86
Figure 4.3.2 Absorption profiles from the airways of the IPML in to perfusate for both the wild-type mdr1a/b (+/+) mice and the knockout mdr1a/b (-/-) mice for [A] erythromycin (n=5), [B] GSK1 (n=5), [C] GSK2 (n=4), [D] GSK3 (2=6), [E] indacaterol (n=4) and [F] mitoxantrone (n=4). In all cases data is presented as the mean ± SD of the percentage of the lung deposited dose absorbed at distinct time points, * indicates a significant difference between the wild-type and knockout mice at that time point.

87
4.3.2.7 Pulmonary absorption of erythromycin
Following deposition of erythromycin in to the airways of wildtype FVB/B6 mice 55 % of the dose
was absorbed within 30 minutes as determined by the increasing perfusate concentrations. In
comparison the same experiments in the knockout mdr1a/b (-/-) mice showed a total of 54 % of the
dose absorbed over the same time frame. As illustrated in figure 4.3.2 and shown in table 4.3.3 this
increase in percentage dose absorbed in the knockout mice was not significant (p>0.05) at any time
with the absorption curves in both the wild type and knockout mice being similar. The lack of an
increase in absorption in the absence of functional P-gp suggests that the protein does not play a
role in the absorption of erythromycin from the lung in this model.
4.3.2.8 Pulmonary absorption of GSK1
Following deposition of GSK1 in to the airways of wildtype FVB/B6 mice 8 % of the dose was
absorbed within 30 minutes as determined by the increasing perfusate concentrations. In
comparison the same experiments in the knockout mdr1a/b (-/-) mice also showed 7 % of the dose
absorbed over the same time frame. As illustrated in figure 4.3.2 and shown in table 4.3.3 this
increase in percentage dose absorbed in the knockout mice was not significant (p>0.05) at any time
with the absorption curves in both the wild type and knockout mice being similar. The lack of an
increase in absorption in the absence of functional P-gp suggests that the protein does not play a
role in the absorption of GSK1 from the lung in this model.
4.3.2.9 Pulmonary absorption of GSK2
Following deposition of GSK2 in to the airways of wildtype FVB/B6 mice 26 % of the dose was
absorbed within 30 minutes as determined by the increasing perfusate concentrations. In
comparison the same experiments in the knockout mdr1a/b (-/-) mice showed a total of 42 % of the
dose absorbed over the same time frame. As illustrated in figure 4.3.2 and shown in table 4.3.3 this
increase in percentage dose absorbed in the knockout mice was significant (p<0.05) at all time
points. The increase in absorption in the absence of functional P-gp illustrates a role for the protein
in limiting pulmonary absorption of GSK2.

88
4.3.2.10 Pulmonary absorption of GSK3
Following deposition of GSK3 in to the airways of wildtype FVB/B6 mice 18 % of the dose was
absorbed within 30 minutes as determined by the increasing perfusate concentrations. In
comparison the same experiments in the knockout mdr1a/b (-/-) mice showed a total of 25 % of the
dose absorbed over the same time frame. As illustrated in figure 4.3.2 and shown in table 4.3.3 this
increase in percentage dose absorbed in the knockout mice was significant (p<0.05) at the 20 and 30
minute time points. The increase in absorption in the absence of functional P-gp illustrates a role for
the protein in limiting pulmonary absorption of GSK3.
4.3.2.11 Pulmonary absorption of indacaterol
Following deposition of indacaterol in to the airways of wildtype FVB/B6 mice 28 % of the dose was
absorbed within 30 minutes as determined by the increasing perfusate concentrations. In
comparison the same experiments in the knockout mdr1a/b (-/-) mice showed a total of 37 % of the
dose absorbed over the same time frame. As illustrated in figure 4.3.2 and shown in table 4.3.3 this
increase in percentage dose absorbed in the knockout mice was significant (p<0.05) at all of the time
points after and including 10 minutes. The increase in absorption in the absence of functional P-gp
illustrates a role for the protein in limiting pulmonary absorption of indacaterol.
4.3.2.12 Pulmonary absorption of mitoxantrone
Following deposition of saquinavir in to the airways of wildtype FVB/B6 mice 25 % of the dose was
absorbed within 30 minutes as determined by the increasing perfusate concentrations. In
comparison the same experiments in the knockout mdr1a/b (-/-) mice also showed 23 % of the dose
absorbed over the same time frame. As illustrated in figure 4.3.2 and shown in table 4.3.3 this
increase in percentage dose absorbed in the knockout mice was not significant (p>0.05) at any time
with the absorption curves in both the wild type and knockout mice being similar. The lack of an
increase in absorption in the absence of functional P-gp suggests that the protein does not play a
role in the absorption of mitoxantrone from the lung in this model.

89
Figure 4.3.3 Absorption profiles from the airways of the IPML in to perfusate for both the wild-type mdr1a/b (+/+) mice and the knockout mdr1a/b (-/-) mice in [A] monensin (n=6), [B] puromycin (n=6), [C] rhodamine 123 (n=6), [D] salbutamol (n=4), [E] salmeterol (n=4) and [F] saquinavir (n=5). In all cases data is presented as the mean ± SD of the percentage of the lung deposited dose absorbed at distinct time points, * indicates a significant difference between the wild-type and knockout mice at that time point.

90
4.3.2.13 Pulmonary absorption of monensin
Following deposition of monensin in to the airways of wildtype FVB/B6 mice 36 % of the dose was
absorbed within 30 minutes as determined by the increasing perfusate concentrations. In
comparison the same experiments in the knockout mdr1a/b (-/-) mice showed a total of 39 % dose
absorbed over the same time frame. As illustrated in figure 4.3.3 and shown in table 4.3.3 this
increase in percentage dose absorbed in the knockout mice was not significant (p>0.05) at any time
with the absorption curves in both the wild type and knockout mice being similar. The lack of an
increase in absorption in the absence of functional P-gp suggests that the protein does not play a
role in the absorption of monensin from the lung in this model.
4.3.2.14 Pulmonary absorption of puromycin
Following deposition of saquinavir in to the airways of wildtype FVB/B6 mice 47 % of the dose was
absorbed within 30 minutes as determined by the increasing perfusate concentrations. In
comparison the same experiments in the knockout mdr1a/b (-/-) mice also showed 49 % of the dose
absorbed over the same time frame. As illustrated in figure 4.3.4 and shown in table 4.3.3 this
increase in percentage of the dose absorbed in the knockout mice was not significant (p>0.05) at any
time with the absorption curves in both the wild type and knockout mice being similar. The lack of
an increase in absorption in the absence of functional P-gp suggests that the protein does not play a
role in the absorption of puromycin from the lung in this model.
4.3.2.15 Pulmonary absorption of rhodamine 123
Following deposition of rhodamine 123 in to the airways of wildtype FVB/B6 mice 21 % of the dose
was absorbed within 30 minutes as determined by the increasing perfusate concentrations. In
comparison the same experiments in the knockout mdr1a/b (-/-) mice showed a total of 33 % of the
dose absorbed over the same time frame. As illustrated in figure 4.3.1 and shown in table 4.3.3 this
increase in the percentage of the dose absorbed in the knockout mice was significant (p<0.05) at
time points after and including 10 minutes. The increased in absorption in the absence of functional
P-gp illustrates a role for the protein in limiting pulmonary absorption of rhodamine 123.

91
4.3.2.16 Pulmonary absorption of salbutamol
Following deposition of salbutamol in to the airways of wildtype FVB/B6 mice 24 % of the dose was
absorbed within 30 minutes as determined by the increasing perfusate concentrations. In
comparison the same experiments in the knockout mdr1a/b (-/-) mice showed a total of 31 % dose
of the absorbed over the same time frame. As illustrated in figure 4.3.1 and shown in table 4.3.3 this
increase in the percentage of the dose absorbed in the knockout mice was significant (p<0.05) at all
time points. The increase in absorption in the absence of functional P-gp illustrates a role for the
protein in limiting pulmonary absorption of salbutamol.
4.3.2.17 Pulmonary absorption of salmeterol
Following deposition of salmeterol in to the airways of wildtype FVB/B6 mice 37 % of the dose was
absorbed within 30 minutes as determined by the increasing perfusate concentrations. In
comparison the same experiments in the knockout mdr1a/b (-/-) mice showed a total of 49 % of the
dose absorbed over the same time frame. As illustrated in figure 4.3.2 and shown in table 4.3.3 this
increase in percentage of the dose absorbed in the knockout mice was significant (p<0.05) at the 15,
20 and 30 minute time points. The increase in absorption in the absence of functional P-gp illustrates
a role for the protein in limiting pulmonary absorption of salmeterol.
4.3.2.18 Pulmonary absorption of saquinavir
Following deposition of saquinavir in to the airways of wildtype FVB/B6 mice 20 % of the dose was
absorbed within 30 minutes as determined by the increasing perfusate concentrations. In
comparison the same experiments in the knockout mdr1a/b (-/-) mice also showed 20 % of the dose
absorbed over the same time frame. As illustrated in figure 4.3.3 and shown in table 4.3.3 this
increase in percentage dose absorbed in the knockout mice was not significant (p>0.05) at any time
with the absorption curves in both experiments being similar. The lack of an increase in absorption
in the absence of functional P-gp suggests that the protein does not play a role in the absorption of
saquinavir from the lung in this model.

92
Wildtype Knockout
P-value
% Dose
Absorbed
at 30
minutes
Standard
Deviation
% Dose
Absorbed
at 30
minutes
Standard
Deviation
Acrivastine 12.3 2.2 13.1 4.0 0.742
Digoxin 40.1 5.1 41.8 2.0 0.591
Erythromycin 61.5 14.8 54.1 12.0 0.876
GSK1 8.0 1.3 7.5 2.7 0.747
Mitoxantrone 25.1 4.7 23.3 3.8 0.516
Monensin 40.8 10.4 38.9 11.1 0.731
Puromycin 46.9 4.5 49.3 4.6 0.425
Saquinavir 21.8 8.5 19.9 2.1 0.838
Chloroquine 42.9 6.2 64.6 16.2 0.046
Colchicine 17.7 2.5 25.4 2.8 0.006
Domperidone 28.3 4.0 43.7 7.6 0.008
Eletriptan 17.9 2.2 26.6 3.6 0.006
GSK2 25.5 2.0 41.7 3.2 0.001
GSK3 17.7 2.5 25.4 2.8 0.006
Indacaterol 27.6 4.1 37.3 3.1 0.009
Rhodamine 123 20.7 8.1 33.2 3.4 0.013
Salbutamol 24.5 2.6 30.5 2.4 0.014
Salmeterol 36.7 4.8 48.7 3.4 0.007
Table 4.3.3 The percentage of the total lung deposited dose absorbed within 30 minutes for all 18 P-gp substrates delivered to the airways of the IPML in both wild-type mdr1a/b (+/+) knockout mdr1a/b (-/-) mice. Compounds are split in to those which show no difference in the total percentage of dose absorbed at 30 minutes (p> 0.05) and those which show a significant difference (p< 0.05). Data is presented as the mean and standard deviation and an unpaired T-test was used to test for differences between the two groups.

93
Figure 4.3.4 A representative plot of the absorption of [3H]-mannitol from the airways of the IPML in both the mdr1a/b positive and negative mice. At no time point is a significant difference in the absorption of mannitol observed (p> 0.05). Data is presented as mean ± SD, n=12 for both groups.
All 18 substrates were co-dosed with [3H]-mannitol (300 nM), a paracellular marker which is not a
substrate for P-gp. Mannitol absorption was utilised as an internal control to ensure that the
permeability of the lungs was comparable between the experimental groups. As can be seen in
figure 4.3.4 an average of 43 % of the deposited mannitol dose was absorbed within 30 minutes
(n=12), data from lungs which showed mannitol absorption within 32-44 % (i.e. one standard
deviation from the mean) were deemed acceptable for the study; data from lungs with mannitol
absorption outside this range were discarded.
It is the case that, for all 18 substrates, there is no difference in the absorption of the co-dosed
mannitol between the wild type mdr1a/b (+/+) mice and the knockout mdr1a/b (-/-) mice. This is
indicative of there being no difference in the permeability of the lungs of the wild type and knockout
mice except the presence of P-gp, it is therefore assumed that any differences observed in the
absorption profiles are as a result of P-gp attenuating the absorption of the substrates.

94
4.3.3 Pharmacokinetic Analysis
Substrate absorption profiles were analysed in WinNonlin, using a single compartment absorption
model (equation in methods) to calculate bioavailability (F) and rate of absorption (K) for each
profile (details in materials and methods). Data from the model can be seen in Appendix 1.1. It is
apparent the calculations of K proved unreliable for a number of substrates with a very large
variance evident in the results (Average % Cv= 52%), despite the model producing fits which,
visually, appear to describe the data well. Values for F proved more reliable for all substrates with
lower variance in the calculated values, however % covariance was still unacceptably high at an
average of 26%. Attempts made to improve the variability seen in values of K and F generated by the
model by applying either weighting or two-compartment modelling proved ineffective. Due to the
unreliable values of K and F, the model could not be used to describe the absorption of substrates
from the IPML.
As the single compartment model could not be used the absorption data was analysed using a non-
compartmental model with a focus upon area under the curve (AUC) analysis limited to the
timeframe of the experiment i.e. AUCt(0-30), in order to quantify the absorption profiles in regards to
the total % of dose absorbed during the 30 minute experiment. The data obtained from the AUC
calculations proved more consistent between experiments, with an average %Cv of 15% across all
mice, showing it as a more reliable evaluation of absorption profile than the compartmental model.
Table 4.3.4 shows the AUC data for the 18 P-glycoprotein substrates investigated in both sets of
mice. As is clear all 10 substrates which showed significant increases in the % dose absorbed at 30
minutes also showed significantly higher AUC values in the knockout mdr1a/b (-/-) mice.

95
Wildtype Knockout
P-value AUCt(0-30)
(%.min)
Standard
Deviation
AUCt(0-30)
(%.min)
Standard
Deviation
Acrivastine 218 49 252 73 0.448
Digoxin 761 128 910 242 0.436
Erythromycin 1020 242 964 89 0.668
GSK1 176 36 168 59 0.809
Mitoxantrone 558 134 543 126 0.865
Monensin 910 301 722 213 0.678
Puromycin 999 78 1004 115 0.939
Saquinavir 342 74 350 56 0.509
Chloroquine 1277 172 1906 541 0.027
Colchicine 398 75 571 53 0.010
Domperidone 613 127 1059 257 0.018
Eletriptan 460 78 638 79 0.019
GSK2 540 62 1043 104 0.001
GSK3 399 80 570 50 0.011
GSK4 605 79 826 60 0.004
Rhodamine 123 376 59 712 71 0.003
Salbutamol 523 64 744 77 0.004
Salmeterol 702 90 965 93 0.006
Table 4.3.4 AUCt(0-30) values for the absorption for all 18 P-glycoprotein substrates tested in the wild-type and knockout mice IPML model. Substrates are split in to those which do not show a difference between the two groups (p> 0.05) and those which have significantly higher AUC values in the knockout mice (p< 0.05). All AUC data shown is the mean of each individual mouse experiment, presented with SD. An unpaired T-test was used to test for difference between the two groups, p< 0.05 taken as significantly different.

96
Ranking based on pulmonary absorption kinetics
The absorption of substrates from the airways of the knockout mdr1a/b (-/-) mice will be
determined by the passive permeability of these molecules across the lung barrier, excluding
possible active uptake mechanisms. As illustrated by table 4.3.5 the knockout AUCt(0-30) of the 8
molecules which do not show attenuation of absorption by P-gp is lower (average AUCt(0-30) = 614)
than the 10 which were significantly affected (average AUCt(0-30) = 903) although this difference is not
significant (p= 0.11).
The lack of significance between the knockout AUCt(0-30) of the affected and unaffected is reflected in
the correlation between the knockout AUCt(0-30) and the ratio between the knockout and wild-type
AUCt(0-30). This ratio shows the net effect of P-gp attenuation on absorption by calculating the
percentage of the knockout AUCt(0-30) observed in the wild type animals; 100% indicates the two
experimental groups possess identical AUCt(0-30), higher values indicate increased AUCt(0-30) for the
knockout lungs in comparison to wild type. As illustrated in figure 4.3.4B the correlation between
this ratio and the passive absorption from the lung (observed as knockout AUCt(0-30)) is slightly
positive but weak (r = 0.36) indicative of no true relationship between the variables. In the presence
of P-gp (in the wild type mice) this weak correlation is completely abolished (r = -0.15).

97
Wild type
AUC
(%.min)
Knockout
AUC
(%.min)
Ratio of
knockout /
wild type
AUC (%)
Monensin 910 722 79
Erythromycin 1020 964 95
GSK1 176 168 95
Mitoxantrone 558 543 97
Puromycin 999 1004 100
Saquinavir 342 350 102
Acrivastine 218 252 116
Digoxin 761 910 120
GSK4 605 826 136
Salmeterol 702 965 138
Eletriptan 460 638 139
Salbutamol 523 744 142
GSK3 399 570 143
Colchicine 398 571 143
Chloroquine 1277 1906 149
Domperidone 613 1059 173
Rhodamine 123 376 712 189
GSK2 540 1043 193
Table 4.3.5 AUC values for the absorption profiles in the IPML in both the wild-type mdr1a/b (+/+) and knockout mdr1a/b (-/-) mice compared to the ratio of knockout to wild type AUC expressed as a percentage, substrates are ranked according to this ratio. AUC values are presented as means (SD is available in Table 4.3.4).

98
Figure 4.3.4 Correlations showing the relationships between [A] average AUC values from the IPML in the wild-type mdr1a/b (+/+) and knockout mdr1a/b (-/-) mice, [B] the average AUC in the knockout mdr1a/b (-/-) mice and the % change in AUC between the wild-type and knockout mice. All points represent average values with lines representing the line of best fit calculated by linear regression.

99
4.4. Discussion
P-glycoprotein (P-gp) has become one of the most intensely studied drug transporters since its
discovery nearly 40 years ago (124). The protein’s role in the PK/PD of a wide range of drugs is well
documented with a functional role established at a large number of barriers including, but not
exclusive to, the intestine, blood-brain barrier, kidney and liver. As described in detail in Chapter 3 it
is now generally accepted that P-gp is expressed within the respiratory system (5), and specifically
within the parenchyma of the lung. A number of immunohistochemical studies have been
undertaken to identify more specifically the expression profile of P-gp within the lung and staining
has been observed in both the bronchial and alveolar epithelium as well as in alveolar macrophages
and endothelial tissue (110)(112)(111)(113).
In addition to these studies of expression there are examples of a functional role for P-gp in the lung.
Using primary cell cultures form both human (115) and rat (110) lungs it has been shown that, at
least in an in vitro situation, pulmonary P-gp expression does result in the efflux of substrates from
cells expressed at the lung/blood barrier. In both studies polarised transport of known P-gp
substrates was abolished by the addition of a selective P-gp chemical inhibitor, providing
confirmation of the functional role of P-gp in these primary cell studies.
Despite the transporter being amongst the most well studied and characterised, there have been
few studies investigating the effects of P-gp in an intact lung. In 2003 a study by the group of
Kuhlmann et al investigated the accumulation of idarubicin in the lungs of rats after dosing via the
circulation (118). The study showed that accumulation of the known P-gp substrate from the
perfusate to the lung was increased with the addition of a P-gp inhibitor. This would imply that in the
lung P-gp acts as an efflux pump minimising drug uptake into the lung, i.e. serving as a barrier for
drug movement from blood to the lung tissue, , a finding which was supported by similar work in
rabbit lungs a year later by a separate group (73) using rhodamine 6G as the model P-gp substrate.
This finding has yet to be confirmed by another laboratory and is not supported by systemic
pharmacokinetic studies, if indeed P-gp was acting in the blood to lung direction it would follow that
we would observe reduced equilibrium partitioning in the lungs of P-gp deficient mice for P-gp
substrates, a number of studies have shown this is not the case (125). Indeed the majority of
literature evidence supports a role for P-gp acting basolaterally to apically in a large range of cell
types in a number of tissues including but not limited to; hepatocytes, kidney proximal tubules,
intestinal epithelial cells and the capillary endothelial cells of the blood-brain barrier (126)(111).

100
Within the lung itself P-gp has been localised to the apical surface of type I alveolar epithelial cells of
both human and rat (115)(110) and polarised transport of the P-gp substrate etoposide has been
shown in the basal to apical direction in isolated primary alveolar epithelial cells (110) as well as in
the pulmonary Calu-3 cell line (127).
Two substrates tested as part of this study, rhodamine 123 and digoxin, have previously been the
subject of studies to investigate the effect of pulmonary P-gp upon lung airway to blood absorption.
However, the data from these studies appears contradictory in terms of the conclusions drawn
about a role for pulmonary P-gp. Original work with rhodamine 123 utilised an isolated perfused rat
lung and chemical inhibition with GF120918, a potent and selective P-gp inhibitor. The work showed
a significant role for pulmonary efflux in the absorption of this well characterised substrate (22)
characterised by increases in the rate and extent of rhodamine 123 absorption from the lung in the
presence of the chemical inhibitor. Similar isolated perfused lung studies, however, have failed to
show P-gp to attenuate the pulmonary absorption of digoxin. Specifically, in the latter work with
digoxin it was observed that mice possessing a spontaneous deleterious mutation in mdr1a, i.e. CF1
mice only expressing mdr1b, showed no difference in the lung airway to circulation absorption
profile compared to that of wild type mdr1a/b (+/+) CF1 mice (23). This study comes with the caveat
that these spontaneous mutants still express mdr1b; which is expressed to a far greater extent,
relative to mdr1a, in the lung than at other barriers (5). It is possible that that the lack of effect
observed upon digoxin absorption could be due to residual mdr1b expression present in both
experimental groups of mice. However, a later study by the same group makes this explanation
unlikely; they performed a chemical inhibition study in rats, similar to that of the rhodamine 123
study, and again showed that inhibition of P-gp function did not alter the absorption of digoxin from
the lung (24).
To address the apparent anomaly in the literature, studies in chapter 2 looked at the effect of
chemical P-gp inhibition, utilising GF120918, on the absorption of both rhodamine 123 and digoxin
as part of a multi species study (71). The absorption of rhodamine 123 and digoxin was assessed by
chemical inhibition studies in both the isolated rat and mouse lung models. The results were similar
to those found in the disparate literature studies, i.e. P-gp appears to have a significant role in
attenuating the pulmonary absorption of rhodamine 123 but no effect on the absorption of digoxin.
The 2013 study expanded upon the P-gp substrates studied with an additional investigation of the
absorption of loperamide and saquinavir; the effect of P-gp upon the pulmonary absorption of these
two substrates had not previously been investigated in an intact lung model. The results show

101
similar discordance to rhodamine 123 and digoxin, i.e. loperamide absorption was more rapid and
extensive in the presence of GF120918 (i.e. affected by P-gp) whilst the absorption of erythromycin
was unaffected by the inhibitor, i.e. unaffected by P-gp function. This indicated that discordances in
the pulmonary effects of P-gp are seen across multiple, structurally diverse substrates.
It is possible that the apparent discrepancy seen between the absorption of substrates from the lung
in the chemical inhibition studies is due to a non-P-gp mediated effect of the inhibitor; for example,
if GF120918 was responsible for an off target effect, such as displacement of rhodamine 123 from
intraluminal binding sites. The chemical and structural differences between the GF120918 (a highly
lipophilic carboxamide) and rhodamine 123 and loperamide (both lipophilic amines) do, however,
make competition for binding sites unlikely. The data presented here confirms that the chemical
inhibitor is not the cause of discordance by utilising a genetic knockout and therefore removing the
need for co-administration of GF120918. After dosing of rhodamine 123 to the airways of both
mdr1a/b (+/+) and mdr1a/b (-/-) mice it is apparent that the absorption is attenuated in the wild-
type controls in comparison to the knockout mice, as observed by a lower percentage of the
deposited dose absorbed and a lower AUC (tables 4.3.3 and 4). This observation, similar to the
chemical inhibition studies discussed earlier, provides evidence of a functional role for P-gp in
attenuating the absorption of rhodamine 123.
Previous studies have shown the lack of mdr1a/b in mice to have no significant biological effect (93);
with the exception of increased levels of CYP3A proteins (128). If an increase in cytochrome levels
were resulting in a difference in absorption from the lung it would be predicted to decrease
absorption by increasing the rate of metabolism, an effect contrary to that observed here where an
increase in absorption from the knockout mice was observed. It is unlikely the increased absorption
of select P-gp substrates in lungs of the knockout mice is due to a general increase in the
permeability of the lungs as a result of the genetic knockout of mda1a/1b. The similarity in the
barrier permeability properties between the wild type and knockout mice is supported by
permeability data for the absorption of the paracellular probe, mannitol. This molecule is not a P-gp
substrate, and was included as a constituent of the dose in all studies reported in this thesis. It was
found that there was no difference in mannitol absorption between the wild type and knockout
mice. This is indicative of comparable physiologic permeability between the experimental mice
groups except for transport pathways involving a P-gp mechanism. It should also be re-emphasised
that the very fact that different P-gp substrates appear to be affected to a greater or lesser (inc. no
effect) extent with P-gp knockout implies involvement of a specific underlying mechanism. Further,

102
using the genetic knockout mice we show a lack of effect of P-gp functionality upon the absorption
of digoxin from the airways in the IPML model, a finding consistent with the previous literature
utilising chemical inhibition. The similarity between the absorption profiles of both the mdr1a/b
(+/+) wild type and mdr1a/b (-/-) knockouts provides additional evidence that the lungs of the P-gp
deficient mice do not show a generally increased permeability.
The above data on the discordance between the absorption of rhodamine 123 and digoxin using
both chemical and genetic inhibition in two separate species, confirmed the discrepancy seen in the
literature to be a real biological phenomenon. However, the mechanism underlying the difference
between the absorption of the two substrates is not clear. In order to gain an improved
understanding of the structure-activity relationship (SAR) involved we undertook studies with a
larger panel of substrates to identify how the physicochemical properties of the molecules may drive
differences in the absorption from the lung in comparison to the intestine.
The 18 substrates within the panel (including rhodamine 123 and digoxin) represent a diverse
spectrum of physicochemical properties. The panel included six inhaled drugs representing
molecules that have already gained approval for pulmonary delivery (i.e. salbutamol, salmeterol and
indacaterol) or were currently in development (GSK1 – 3) as respiratory therapeutics. Their inclusion
provides a close-to-practice context to the SAR profiling (129). The remainder of the 18 member
panel are non-inhaled P-gp substrates chosen for their diversity in physicochemical characteristics.
All molecules in the panel show P-gp mediated efflux from the intestine and cell culture models
(130,131)(GSK data, unpublished)
The absorption data for all IPML experiments were analysed initially using a single compartment
pharmacokinetic (PK) model to identify values for the bioavailability (F) and absorption rate constant
(K) (graphs showing the fit of the non-linear regression are in Appendix 1). This compartmental
modelling has been used previously in defining absorptive PK parameters in rat IPL experiments (22).
However, it is clear that for this current dataset in the IPML the calculations of K proved unreliable in
a number of substrates with very large and unacceptable variance in the results (average % Cv=
52.2%). This is due to both the large standard deviations in the early time points of some absorption
profiles where the drug levels in perfusate were below or around the limit of quantification, as well
as the sampling strategy which included too few early time points to adequately explain the initial
absorption phase. This is despite the compartmental model producing visually good fits to the data,
as can be seen in Appendix 1. The values for F proved more reliable due to the greater dependence

103
for this parameter on the later time points; however the percentage covariance at 25.6 % was still
too high to prove reliable for analysis. This was not improved by implementing various weighting
schemes (1/Cobs, 1/Cobs2 or the Cpredicted equivalents) or the use of a more complicated two
compartmental model. As the compartmental modelling approach could not be used to analyse the
IPML absorption data a non-compartmental approach was utilised using area under the curve (AUC)
analysis to describe the data. Due to the short duration of the experiments it is assumed that
metabolism and chemical degradation, and that other mechanisms of loss, e.g. binding to plastic
tubing are negligible. With these assumptions the AUC of the absorption profiles when limited to the
first 30 minutes of experiment will be dependent upon the rate at which drugs are absorbed from
the airways; note the perfusate reservoir is an accumulating ‘compartment’ solely. Indeed for the
substrates tested where reliable analysis of early time points was observed, the AUC data correlates
well with the absorption rate constant (K) calculated by compartmental models.
Of the six inhaled drugs only one, GSK1, showed no difference in absorption between the wild-type
and mdr1a/b (-/-), i.e. appears unaffected by P-gp, this substrate was also absorbed to the lowest
extent of any of the molecules tested (Tables 4.3.3-4), a finding consistent with data observed in
previous isolated rat lug models (GSK data, personal communication). The five remaining inhaled
drugs, including the three currently marketed beta-adrenoreceptor agonists, all showed increases in
absorption in the knockout mdr1a/b (-/-) mice in comparison to the wild-type; this is the first
evidence of P-gp acting to attenuate the absorption of these molecules from an intact lung, although
P-gp has been observed to attenuate the absorption of salbutamol following oral dosing (132). All
three beta-adrenoreceptor agonists have previously been identified as P-gp substrates: salbutamol
in the rat intestine study mentioned above and salmeterol by MDCK-MDR1 bidirectional assays (133)
in which polarised transport was abolished by co-dosing with verapamil (a known P-gp inhibitor);
data for the affinity of indacaterol to P-gp is from internal GSK studies (GSK data, personal
communication) and is reaffirmed again in this current work.
Previous studies in the literature have reported on the absorption of salbutamol following both
inhaled and oral dosing. In the intestine it has been observed that following oral dosing the
absorption of salbutamol is poor, with a low extent of bioavailability and peak plasma
concentrations at two to four hours post dosing (134). More recent work has identified the effect of
P-gp efflux to contribute to this poor intestinal absorption. A study by Valenzuela et al. showed that
the intestinal absorption of salbutamol was saturable and increased 2-3 fold by co-dosing with
verapamil (a molecule often used as a competitive P-gp inhibitor) (131,135). Although in this current

104
work we see attenuation of the pulmonary absorption of salbutamol by P-gp following inhaled
dosing, it would seem that the net effect of P-gp on the pharmacokinetics of salbutamol in the lung
is less pronounced than that observed by Valenzuela in the intestine. Indeed even in the presence of
P-gp lung absorption of salbutamol is shown to remain both rapid and high with peak plasma levels
observed as soon as 12 minutes after dosing (136).
It is unclear how these observed changes in the PK of inhaled drugs will affect, if at all, local
pulmonary PD. Current inhaled therapies are generally limited to molecules acting locally within the
lung (with the noted exception of inhaled anaesthetics) and therefore improvements in therapeutic
outcome are observed with increases in pulmonary bioavailability, i.e. the rate and extent at which
drugs reach the sites of action within the lung. Current improvements for local pulmonary
bioavailability are mainly due to improvements in the delivery device resulting in increased
deposition within the lungs as opposed to the oropharynx from where they are swallowed leading to
systemic exposure (137–139). Lung retention (and therefore pulmonary bioavailability) is also
improved by the use of drugs able to form lipid conjugates, such as corticosteroids with a hydroxyl
group in the 21 position (140). The lipid-drug conjugates are not active but also not absorbed from
the lung (141). As the ester bond formed in their creation is reversible this results in them acting as a
slow-release reservoir within the lung tissue (142). An example of this is the absorption of
budesonide, 20 minutes post inhalation 80% of the budesonide remaining in the lungs is conjugated,
increasing the lipophilicity of the drug up to 10,000 fold and therefore causing tissue retention (143).
It is possible that P-gp could be used in a similar manner to reduce the rate of absorption from the
lung and increase lung retention. For example, the attenuation of the absorption of ten substrates in
the panel (including the three inhaled beta-adrenoreceptor agonists) is most simply described by P-
gp efflux from the apical membrane of the alveolar epithelial cells in to the lumen of the airways.
The result of this is slower absorption rates across the epithelia following inhaled dosing and
therefore increased luminal residence time of the drug. For drugs with sites of action in the airways
of the lung (such as anti-infectives) this could result in improved drug exposure and increases in the
time spent above minimal effective concentrations following inhaled dosing. Currently, anti-
infectives for pulmonary infections are commonly dosed either orally or intravenously and the PK-PD
in relation to the clearance of lung infections has been well studied following these dosing strategies
(144–146). However, despite the lack of literature upon the PK and PD of anti-infectives following
inhaled dosing it would seem apparent that direct dosing of the lung via an inhaled dose would
result in increased local concentrations of drug within the lung, lower efficacious doses and reduced

105
systemic exposure and side-effects, in a manner consistent with that observed for the
corticosteroids. This being the case, P-gp efflux within the lung could be utilised to improve exposure
times by developing drugs which are also pulmonary P-gp substrates. This would likely have the
added bonus of reducing intestinal absorption and therefore reducing negative systemic effects
caused by absorption after swallowing.
For drugs with sites of action downstream of epithelial absorption (such as the beta-adrenoreceptor
agonists in the panel) P-gp appears to be acting to both slow and decrease the extent of exposure of
the drug to the binding sites, potentially limiting their efficacy. However, it must be said that
inferring PD relationships from measurements of drug perfusate concentrations may be poorly
predictive. It has been argued that the measurements of PK using systemic bioavailability markers
(such as plasma or blood levels) may not be predictive of PD for these locally acting lung molecules
(147). Considerations on why systemic drug concentrations may generally not be predictive for
pulmonary PK-PD of drugs with local sites of action include: plasma drug concentrations that will be
downstream of those in the lung tissue itself and potentially dependent upon multi-phasic
pulmonary absorption processes; drug disposition in the lung influenced by depot effects and non-
absorptive processes; local lung efficacy potentially driven by drug concentrations exclusively in the
lung, or by a combination of lung and plasma drug concentrations.
With effects of P-gp activity upon the PK of over half the substrates within the panel the question
arises as to why this discordance occurs – a question that will be repeatedly challenged throughout
this thesis, both experimentally and philosophically. The current understanding is that the efficiency
of the efflux for a given P-gp substrate is dependent not only upon the substrate’s affinity to the
transporter but also by its transmembrane movement rate. Molecules which show higher rates of
transmembrane movement tend to show a lower net effect of P-gp mediated efflux (130,148) This
has been observed in vivo in the intestine where substrates with high passive permeability (such as
verapamil) are not affected to a significant extent by P-gp, whereas the absorption of those (such as
digoxin) which show slower absorption rates are significantly attenuated by P-gp efflux. However,
this relationship does not appear to explain the differential impact of P-gp functionality for the
pulmonary absorption data of our panel.

106
FIGURE 4.4.1 A graph showing the inverse linear relationship observed between the intestinal permeability of the molecule (PappA.B) and the net effect of P-gp on intestinal transport (AQ). The substrates are split in to 3 categories in descending order of the effect of P-gp observed in in vitro studies, i.e. category 1 showed the highest effect of efflux. The graph is adapted from work by Varma et al. (130).
We found a positive correlation (Figure 4.3.4 B) between molecule absorption from the lungs of the
P-gp knockout mice (a measure of the molecules’ passive absorption) and the ratio of knockout to
wild type absorption (a measure of the attenuation by P-gp of pulmonary absorption), a finding
which contrasts to the negative relationship we would have predicted based upon intestinal data
from the literature. As is seen in figure 4.4.1 previous literature studies would suggest that in the
intestine we would expect to see less of an impact of P-gp for those molecules which show the
greater passive absorption capacity. This would corroborate discordant physiologic determinants
between P-gp attenuation of absorption in the lung and intestine and would evoke additional factors
in the lung not entirely explainable by a substrate’s transmembrane movement rate or membrane
residence time. The difference may instead be due to structural differences between the two
barriers such as the relative prevalence of the paracellular pathway in the lung in comparison to the
intestine (149), or differences in P-gp binding kinetics between the substrates and their interplay
with the different P-gp expression levels between the two barriers, both investigated more fully in
later chapters. Further, it is not explained by saturation of the P-gp transporter itself. For example
some of the substrates unaffected by P-gp in the lung, e.g. digoxin, were delivered as a radiolabelled

107
dose of only 16 pmol (i.e. 315 nM in the ELF based upon an ELF volume of 25µL) and therefore far
below the concentrations required for saturation; one of the molecules affected by P-gp in the lung,
for example rhodamine 123, would similarly be predicted to have achieved ELF levels of
approximately 25 µM. This is discussed further in chapter 5 where the binding kinetics of the
substrates is explored more fully.
Taken together the comparison in absorption profiles between the knockout and control mice for
the 18 substrate panel confirms the discordance seen in the earlier literature and expands upon the
observations across a diverse range of compounds. In total 10 of the substrates exhibited enhanced
absorption in the absence of P-gp, including five which are either currently marketed inhaled drugs
or in development, whilst eight were unaffected by its presence, including one inhaled drug
development candidate. This makes clear that the attenuation of pulmonary absorption by P-gp is a
necessary consideration during the development of inhaled drugs. However, as is shown by the
absorption of salbutamol the attenuation by P-gp is likely to be quantitatively less than that
observed in the intestine, and still allows for considerable absorption. The effect on the PK-PD of an
inhaled drug may be dependent upon its site of action and there is a potential for utilising efflux to
increase the exposure time of drugs acting locally in the airways.
Subsequent to the absorption studies it was discovered that the absorption of acrivastine was
influenced by active uptake processes in the intestine (150). The presence of an active component in
the uptake of acrivastine provides a route of uptake which avoids interaction with P-gp and
providing a possible explanation for the lack of pulmonary efflux seen with this substrate. Due to the
confounding nature of acrivastine absorption it was removed from the panel for future experiments.
The presence of eight substrates within the dataset which do not show P-gp mediated attenuated
absorption from the lung (despite previous literature suggesting they are effluxed in the intestine)
highlights the difference in the functional impact of P-gp at these two barriers. The 18 substrates
presented here can now form the backbone of a study of the mechanism of this discordance whilst
also providing the first evidence of an effect of P-gp upon the absorption of drugs which are
currently delivered to the lung.

108
Chapter 5
Ussing chamber permeability and P-gp binding kinetics

109
5.1 Introduction
5.1.1 Intestinal P-gp expression
Intestinal P-gp has been shown to affect the bioavailability of a wide range of P-gp substrates
following oral dosing. The prevalence of the oral route as a dosing strategy has meant intestinal P-gp
is one of the most important and extensively studied areas of research for the interplay between
transporter proteins and pharmacokinetics.
Spatial expression of P-gp within the intestine
There are many examples in the literature of P-gp substrates with observed oral bioavailabilities far
below those predicted by their passive permeability. The expression of P-gp has been localised to
the apical membranes of the columnar epithelial cells which constitute the majority of the surface
area of the intestine (151). The localisation of P-gp to the apical surface of the intestines was
achieved using a mouse monoclonal antibody (MRK16) in normal human tissue. The presence of P-
gp on the apical surface of epithelial cells is corroborated by a similar study in the in vitro Caco-2 cell
line. Using the same monoclonal antibody P-gp was observed on the apical membrane of the Caco-2
cells (152).
The localisation of P-gp on the apical surface of intestinal epithelia cells results in the expulsion of
substrates from the cells in to the lumen of the intestine and therefore explains the poor
bioavailability of many substrates following oral dosing. Attenuation of absorption by P-gp in the
intestines is not consistent throughout their length; there is a body of literature suggesting that P-gp
expression generally increases towards the distal end of the intestine.
Gene expression in the intestine
There is a body of evidence for an uneven intestinal P-gp expression generated by measuring the
concentration of mRNA in the segments of the guts of both rats and humans. In 1996, Fricker et al.
provided an early analysis of the intestinal expression of P-gp in three segments of human intestines
(i.e. stomach, jejunum and colon) (153). The results showed a general increase in P-gp expression
towards the distal intestines with levels in the colon>jejunum>stomach. The functional effect of this

110
trend in P-gp expression was assessed by its effect on the absorption of cyclosporine A. The inverse
correlation of the absorption of this P-gp substrate with the levels of P-gp expression is striking with
absorption in the stomach>jejunum>colon.
The increase in mRNA concentrations towards the distal intestine by the early studies has been
refined by a number of groups in both rat and human intestines, two species which appear to show
similar intestinal distributions of P-gp. The literature would suggest that the highest expression
levels of P-gp are found in the ileum, indeed in the study by Brady et al. the expression levels of
mdr1a in the rat ileum were the highest of all organs investigated, higher than those in the brain,
liver or kidneys (109). High levels have also been observed in the jejunum (in particular the distal
jejunum) and the colon with considerably lower expression in the duodenum (5,154–157). It appears
the pattern of P-gp expression is one where the expression levels are increased with proximity to the
ileum, i.e. ileum>jejunum/colon>duodenum.
Protein expression in the intestine
As well as the studies of mRNA levels within the segments of the small intestine there have been
several immunohistochemical (IHC) studies which investigate the spatial expression of P-gp within
the intestines of both rats and humans. All of the studies identified P-gp expression within the
intestines in a manner consistent with the distribution of P-gp mRNA.
In 2003 Mouly and Paine performed a Western blot analysis of a series of mucosal scrapings from
human intestine (158). They found P-gp expression generally increased from the proximal to distal
terminus of the small intestine in all 4 of the individual intestines studied, i.e.
ileum>jejunum>duodenum. Interestingly, the group also identified significant inter-individual
variation with regards to the extent of P-gp expression in the intestines highlighting the possible
importance of P-gp expression and its influence on the inter-individual variations observed in oral
bioavailability of a number of drugs in humans.
A similar study by the group of Berggren et al. provides further evidence for the distribution pattern
of P-gp protein observed by Mouly and Paine (155). The group identified an increase in protein
concentration by Western blot that correlated with proximity to the ileum, that is to say expression
levels in the ileum>colon>jejunum.

111
In an attempt to improve the resolution of the understanding of the spacial distribution of P-gp in
the intestines a more recent study investigated the levels of protein present throughout the entire
length of the intestine with smaller segments (159). The group of MacLean et al. divided the
intestine of rats into successive 3 cm segments along its entire length. The levels of P-gp present in
the homogenates of each of these was then analysed by Western blot analysis, figure 5.1.1. The
increased resolution afforded by the use of the many small successive segments clearly illustrates
the concentration of high levels of P-gp expression at the terminal jejunum and ileum with a
considerably lower expression in the duodenum, terminal jejunum and colon. Variability in the
location of the cuts used to divide the intestinal segments in the earlier analysis (for example if a
section of ileum was included in the colon segment or if the proximal jejunum was used instead of
the distal) may explain differences seen in the P-gp distribution patterns seen in the early
experiments
Figure 5.1.1 The expression levels of P-gp (mdr1a) across the entire length of the rat small intestine. Increased expression of P-gp was observed at the distal end of the jejunum. Figure adapted from MacLean et al. (159).
Functional evidence of the P-gp spatial distribution
The spatial distribution of P-gp identified in the genetic and protein investigations discussed above
has been shown to result in variance in the absorption of P-gp substrates in the different segments
of the intestine. For example, the absorption of tacrolimus from rat ileum segments is enhanced by
the addition of a P-gp inhibitor (160) suggesting that the absorption of tacrolimus from the ileum is
attenuated by P-gp. Conversely, the addition of the inhibitor to absorption studies in the jejunum
segments did not enhance tacrolimus absorption. The lack of significant P-gp efflux witnessed in the
jejunum can be explained by the lower levels the transporter protein present in this gut segment.

112
In a similar study Valenzuela et al. observed an active and saturable process which resulted in the
attenuation of salbutamol from an in situ perfused rat small intestine (161). The group investigated
the active process seen in the whole intestine by the separate isolation of the proximal, distal and
colon segments of the rat intestines. Absorption studies were conducted in the separate segments in
the presence and absence of verapamil (a known P-gp inhibitor). The addition of verapamil was
shown to have no influence on the absorption of salbutamol from the proximal (duodenum) and
colon segments but resulted in a significant increase in absorption in the proximal segment (jejunum
and ileum). The group then compared the results from the absorption experiments to mRNA levels
of P-gp in each of the segments and showed they correlated well with P-gp expression levels (132).
The functional implications of the P-gp distribution in the intestine have also been shown for the
absorption of rhodamine 123. In a manner consistent with the absorption experiments of
salbutamol and tacrolimus the absorption of rhodamine 123 has been shown to be attenuated in the
ileum. This is despite no efflux observed in the duodenum of the same animals (162).
5.1.2 Balancing intestinal P-gp efflux and passive permeability
There is now a large body of work in the literature confirming a role for P-gp in limiting the oral
absorption of a wide range of drugs. In spite of this there are a number of drugs which have been
shown to be uninfluenced by the transporter following oral dosing despite being highlighted as
substrates by various in vitro assays (163). It is apparent that the P-gp efflux mechanism and the
passive permeability of a substrate operate in an opposite direction to influence the overall
absorption and both influence overall bioavailability. This indicates that the permeability of
substrates across the intestine is determined by the passive influx rate minus the P-gp efflux rate.
Therefore it can be assumed that the lack of an effect of P-gp on the absorption of a subset of
substrates is the result of high passive permeability masking a relatively minimal efflux by P-gp.

113
Mechanism of the interplay between P-gp efflux and passive permeability
Substrates for P-gp tend to be amphipathic and hydrophobic in nature and therefore interact
extensively with membrane compartments. This results in a high concentration of substrate in the
outer leaflet of the epithelial membrane acting as a drug pool for absorption with a relatively low
concentration of substrate in the cytoplasm (164). Any substrate transported from the “pool” in the
extracellular membrane will be immediately replaced by free substrate from the intraluminal
medium.
Transmembrane movement of these hydrophobic substrate-type drugs has been shown to occur via
distinct flip-flop events and not by a gradual diffusion process across the lipid core (165). The
frequency of these flip-flop events is the rate limiting step in the transmembrane absorption of
these drugs with a wide range of frequencies observed. For example the transmembrane movement
of rhodamine 123 has been shown to occur by flip-flop events with an average frequency of 3
minutes, i.e. on average a rhodamine 123 molecule will inhabit the external membrane for 3
minutes before a flip-flop events results in absorption to the inner leaflet (166). Other molecules
(such as verapamil and doxorubicin) possess much faster flip-flop rates (165).
The result of these flip-flop events is a relatively high concentration in the inner membrane leaflet
and a concentration gradient to the cytoplasm. Due to the hydrophobic nature of the substrates the
absorption in to the cytoplasm is via the adsorption to molecular sinks such as anthracyclines. The
concentration present in these molecular sinks is in constant equilibrium with the inner membrane
leaflet.
The crystal structure of P-gp has shown that this drug transporter recruits substrates directly from
the inner leaflet (167). After association with a substrate P-gp functions as a flippase transferring the
molecule to the outer leaflet of the membrane (168).
If the rate of the flippase activity of P-gp transporting substrates from the inner leaflet to the
external is higher than the passive flip-flop rate of absorption then P-gp will function to exclude the
substrate from the cell. The result of this is a lower cytoplasmic concentration of substrate in P-gp
expressing cells and therefore a decreased rate of release from the basal membrane due to the
lower diffusion gradient.
Conversely, as the flip-flop rate of the substrates is increased the net effect of P-gp is decreased to a
negligible point as the absorption from the substrate pool in the outer leaflet becomes considerably
faster than P-gp mediated efflux. In this instance the effect of P-gp does not influence the
114
intracellular concentrations of substrate and therefore does not slow the absorption across the
intestinal barrier. P-gp substrates which show rapid flip-flop rates and whose absorption is
subsequently unaffected by P-gp, for example verapamil, have been shown to be good P-gp
inhibitors.
The importance of a substrate’s passive permeability upon the net effect of P-gp absorption stresses
the important of substrate characteristics which affect passive permeability. It is possible the
discordance seen in the effect of P-gp upon the absorption of the panel of substrates from the IPML
may not decrease the functional significance of P-gp within the lung. Rather it may be highlighting
the intricate relationship between the passive absorption of a molecules and P-gp efflux.
5.1.3 Experimental objectives
In chapter 4 the absorption of a panel of substrates was investigated in the IPML and discordance
was observed in the effect of P-gp upon their absorption. A subset of the molecules showed
enhanced absorption in the absence of functional P-gp whereas another showed no difference in
either its presence or absence. In the intestine there is a body of literature supporting a similar
discordance in relation to the passive permeability of a substrate.
This chapter aims to investigate the absorption of the panel of substrates from the intestines of wild
type and mdr1a/b (-/-) mice in order to draw comparisons between the effects of P-gp upon their
absorption at both barriers. This should provide evidence towards the underlying mechanism
responsible for the discordant effects of P-gp observed in the absorption of the panel from the lung.
Further the specific binding kinetics of the substrates within the panel to P-gp will be investigated.
This will allow the determination of whether the discordance seen in the lung is due to substrate
specific interactions with the transporter, i.e. saturation.

115
5.2 Materials and Methods
5.2.1 Ussing Chamber studies of intestinal absorption
Ussing chamber equipment
Tissue diffusion chambers; product 66-0036 (Harvard Apparatus, MA, USA)
Vertical diffusion chamber system with heating block and gas manifold; product 66-0048 (Harvard
Apparatus, MA, USA)
NaviCyte Ag/AgCl electrodes; product 66-0023 (Harvard Apparatus, MA, USA)
Epithelial voltage clamp; product EC-800 (Harvard Apparatus, MA, USA)
Physiological buffer – materials
D-glucose anhydrous; C6H12O6, (Fisher Scientific, Loughborough, UK, G/0450/60)
Potassium chloride; KCl, (Fisher Scientific, Loughborough, UK, Cat: P/4280/53)
Magnesium sulphate heptahydrate; MgSO4.7H2O, (Fisher Scientific, Loughborough, UK, Cat:
M/0600/53)
Sodium bicarbonate; NaHCO3, (Fisher Scientific, Loughborough, UK, Cat: S/4200/60)
Calcium chloride dihydrate; CaCl2.2H2O, (Fisher Scientific, Loughborough, UK, Cat: C/1500/50)
Sodium chloride; NaCl, (Fisher Scientific, Loughborough, UK, Cat: S/3105/63)
Potassium dihydrogen phosphate; KH2PO4, (Fisher Scientific, Loughborough, UK, Cat: P/4800/53)
Physiological buffer – method
The buffer used throughout the Ussing chamber experiments was a protein-free Krebs-Henseleit (pH
7.4) (KH), similar to that used in the IPRL experiments. The buffer was made by the same protocol as
that for the IPRL perfusate with the omission of bovine serum albumin. Buffer was made at least 12
hours before an experiment (overnight) and used no later than 48 hours after production.

116
Animals
Male pathogen-free FVB/Bl6 mice, which were bred on site as per chapter 3, were used throughout
the experiments. The breeding program produced two distinct groups of FVB/Bl6 mice, the first fully
expressed wild type levels of mdr1a and mdr1b (mdr1a/b (+/+)) and the second group were
knockouts, with no functional expression of these genes (mdr1a/b (-/-)). The mice were housed in
temperature and humidity controlled rooms (19-21 oC and 40-60 % humidity) with a 12 hour dark-
light cycle. All mice had access to food and water ad libitum and were acclimatised for at least 24
hours following transport from the breeding facility to the experimental laboratories. All animal
experiments were performed in adherence to the Animal (Scientific Procedures) Act 1986 and were
approved by Cardiff University and GSK, Stevenage.
Doses
The P-gp substrates used for dosing to the Ussing chapter studies are the same as those utilised in
the IPML model in chapter 4. Digoxin was delivered as a 3[H]-radiolabelled dose, all others were
administered as non-radiolabelled compound.
The final dose concentrations used in the Ussing chambers was chosen to match those used in the
IPML model (50 µM for non-radiolabelled substrates and 0.25 Ci and 16.7 pmol or 600 nM for
radiolabelled digoxin). As a 5-fold dilution of the dose occurred during the dosing of Ussing chamber
experiments initial doses were made at 250 µM for non-radiolabelled drugs and 3000 nM for 3[H]-
digoxin. Non-radiolabelled doses were prepared from 10 mg/mL stocks in DMSO by dilution in KH
buffer. The relevant volume of DMSO was added during the dilution to result in a final DMSO
concentration of 0.5 %.
Radiolabelled doses of digoxin were prepared by drying the relevant volume of 3[H]-digoxin (stored
as a solution in ethanol) overnight. After evaporation of the ethanol, KH and DMSO were added to
result in a final dose composition similar to that of the previous doses.
Preparation
Before surgery the circulating water bath attached to the diffusion chamber system is started in
order to equilibrate the system at 37 oC.

117
Surgery and experimental setup
In order to reduce the animal usage during the experiments intestinal segments were obtained from
the mice sacrificed for the IPML experiments. During the setup of the IPML there is an equilibration
period for the lungs during which the intestines are removed by sharp incision and bathed in ice cold
KH.
During the interval of the 5-10 minute time points of the IPML the intestinal segments are
suspended in the Ussing chambers. The entire length of the small intestine is held by tweezers and
the third (by length) nearest to the colon is removed by sharp incision. This distal third is then
flushed with cold KH to remove faeces. The cleaned intestinal segment is then cut in to 3 x 1 cm long
segments avoiding any visible Peyer’s patches.
The 1 cm segments are then opened longitudinally and fixed to the Navicyte diffusion chambers by
the four pins around the opening. The intestinal segments are fixed so the epithelial surface of the
intestine is facing the dosing compartment. The diffusion chambers are then assembled and secured
using the retaining ring before being inserted in to the heated diffusion chamber system. Five mL of
warmed KH (37 oC) was added to each side of the diffusion chambers in alternate 1 mL intervals. It
has been suggested that the addition of a large volume to one side of the chamber whilst the other
is empty may result in damage to the intestinal segment. The gas supply to the 3 diffusion chambers
is then attached and the intestinal segments allowed to equilibrate in the device for 10 minutes.
Following equilibration, a measurement of the transepithelial electrical resistance (TEER) was
recorded. To record TEER the gas supply was temporarily removed and the 2x voltage and 2x current
electrodes were placed in the chambers. The TEER of the intestinal segment was then determined
according to Ohm’s law using the epithelial voltage clamp. TEER measurements were taken hourly
during the experiment and also at the termination of the experiment to determine membrane
integrity throughout. After the measurements of TEER were conducted the gas supply was
reconnected to the chambers.
Dosing of the Ussing chambers was achieved by replacing 1 mL of KH in the dosing chamber with 1
mL of KH + dose (as described above). The solution in the dosing chamber was mixed by the action
of the gas supply, this creates a circulation of buffer in both the donor and receiver compartments.
At intervals the solution in the receiver compartment was sampled (sampling was performed at 0,
30, 60, 90, 120 and 180 min) by removing 1 mL of the buffer. The buffer was immediately replaced
with fresh KH (37 oC).

118
Buffer samples were then analysed by either HPLC-MS/MS or liquid scintillation as described in
chapter 4. The results of the 3 intestinal segments from each animal were averaged and a total of 4
wild type and 4 mdr1a/b (-/-) mice were used for each substrate in the panel.
In all experiments viability of the tissue throughout the experiment was assessed by the decrease in
TEER. A terminal TEER value of 80 % or more of that observed at the beginning of the experiment
was taken to indicate viability throughout the experiment in accordance with previous literature
(169).
The absorptive apparent permeability coefficients (Papp) for the transport across the intestinal
segments were then calculated according to Eq.1.
Papp= (dQ/dt)/(A*C0) (1)
Where dQ/dt is the rate of transport observed across the 180 minute experiment, A is the surface
area of the intestinal segment exposed in the experiment (0.12 cm2) and C0 is the initial donor
concentration of the drug.
5.2.2 In-vitro assessment of P-gp binding kinetics
Materials
Gentest ATPase Assay Kit; product 459006 (Corning, Germany)
Human P-gp membranes; product 453228 (Corning, Germany)
Murine mdr1a membranes; product 453252 (Corning, Germany)
Murine mdr1b membranes; product 453250 (Corning, Germany)
Method
The Corning ATPase assay kit was utilised to investigate the specific binding kinetics of the panel of
substrates to human and murine P-gp. The kit measures the accumulation of Pi produced in the
breakdown of ATP to ADP as a measure of P-gp activation.
The kit was used in accordance with the manufacturer’s protocol for the evaluation of Km and VMAX.
In summary, test compounds were serially diluted across a concentration range of 0-900 µM
(resulting in a final assay concentration of 0-300 µM) in assay buffer. The test compound

119
concentration range was added 4 rows of a 96-well plate (columns 3-12) (20 µL per well). Columns 1
and 2 contained a phosphate standard curve of 0-150 mM.
The first two rows of the test compounds were incubated with 20 µL of a P-gp membrane solution
(90 µL of 5 mg/ml membranes, 13.5 µL of H2O and 346.5 µL of assay buffer). The remaining two rows
were incubated with 20 µL of a similar solution but with the inclusion of the P-gp inhibitor sodium
orthovanadate (NaOV) (90 µL of 5 mg/ml membranes, 13.5 µL of NaOV and 346.5 µL of assay
buffer). The 96-well plate was incubated at 37oC for 5 minutes.
Figure 5.2.2 The summarised layout of the 96-well plates prior to the 30 minute incubation step. Layout is copied from the Quickstart guide for the assay kit.
After incubation, 20 µL of the ATP stock solution (10 mM) was added to each of the test compound
wells to initiate P-gp activity. The plate was then incubated with gentle shaking at 37 oC for 30
minutes.
After the secondary incubation, the assay was stopped by the addition of 30 µL of the Assay Stop
Solution (SDS) and the colorimetric reagent was added. A final 37 oC incubation of 20 minutes was
then performed to allow the colour change to occur. The assay was then analysed by quantifying the
colour change as the absorbance of each well on a spectrophotometer at 800 nm.
The absorbance of the two sets of duplicates was averaged and the absorbance of the NaOV control
was subtracted to measure the vanadate sensitive phosphate release. The corrected absorbance
readings were then compared to the Pi standard curve to determine the concentration of phosphate

120
in each well. As these had been corrected to account for non-P-gp related breakdown of ATP the
concentration of Pi in the well was a measure of P-gp activity.
Figure 5.2.3 A representative graph of the non-linear Michaelis-Menten fit applied to the ATPase data for rhodamine 123 for the calculation of Km and VMAX.
The amount of phosphate released at each test compound concentration was used to calculate the
enzyme binding kinetics. Graphs were generated in GraphPad Prism and analysed using Michaelis-
Menten kinetics to determine the Km and VMAX for each substrate in the panel. An example of the
Michaelis-Menten fit to the ATPase data is shown in figure 5.2.3.

121
5.3 Results
5.3.1 Ussing chamber studies of intestinal absorption
Tissue viability
In the Ussing chamber absorption experiments tissue viability was assessed using the transepithelial
electrical resistance (TEER) values of the intestinal segment. At the beginning of the experiments
initial TEER values averaged 82 ± 23 Ω.cm2, tissue segments which presented a TEER value lower
than 40 Ω.cm2 were considered poorly viable and discarded. This TEER value cut-off is in agreement
with previous Ussing studies in mouse intestines (170,171). In a similar manner any experiment
which showed a 15 % or greater decrease in TEER during the timeframe of the experiment was
discarded.
Using a 15 % decrease in TEER as a marker for loss of tissue viability early experiments showed that
tissue in the Ussing chambers was viable for a minimum of 3.5 hours after suspension of the
intestinal segment in the chamber. As absorption experiments were performed over a 3 hour time
frame no intestinal segment showed a 15 % drop in TEER during an absorption experiment.
General permeability – influence of P-gp knockout
In a manner consistent with that seen in the IPML model, the loss of functional P-gp in the mdr1a/b
(-/-) mice did not result in a change in the general barrier properties of the intestine as measured by
TEER. Across all experiments there was no significant difference in the TEER values observed in the
wild type or mdr1a/b (-/-) mice (TEER = 83 ± 21 and 79 ±19 Ω.cm2, respectively).
Intestinal absorption of the substrate panel – effect of P-gp knockout
In order to elucidate the role of P-gp in the intestinal absorption of the panel of substrates the
absorption of each was investigated in an Ussing chamber model. Comparative studies in the FVB/B6
wild type and mdr1a/b (-/-) mouse intestinal segments were conducted to define the extent of the
attenuation of absorption by P-gp in this model.

122
Wild type mice Mdr1a/b (-/-) mice
Fold-
difference P-value
1 acrivastine 91.67 ± 28.67 143.23 ± 28.84 1.56 0.044
2 digoxin 60.42 ± 14.63 209.38 ± 29.39 3.47 0.0001
3 erythromycin 30.21 ± 11.47 136.98 ± 45.37 4.53 0.004
4 GSK1 31.25 ± 12.50 105.73 ± 32.29 3.38 0.005
5 mitoxantrone 46.88 ± 10.55 136.98 ± 26.92 2.92 0.001
6 monensin 109.38 ± 17.80 190.63 ± 24.09 1.74 0.002
7 puromycin 58.33 ± 23.81 149.48 ± 23.28 2.56 0.002
8 saquinavir 15.63 ± 6.91 157.29 ± 35.21 10.07 0.0002
9 chloroquine 149.48 ± 23.28 233.85 ± 41.82 1.56 0.012
10 colchicine 69.27 ± 31.47 149.48 ± 31.84 2.16 0.012
11 domperidone 107.81 ± 17.71 254.17 ± 80.38 2.36 0.012
12 eletriptan 48.96 ± 25.09 110.42 ± 21.65 2.26 0.010
13 GSK2 81.77 ± 23.28 175.0 ± 29.1 7.59 0.002
14 GSK3 122.40 ± 22.53 153.13 ± 22.47 1.25 0.102
15 indacaterol 152.08 ± 27.85 292.19 ± 43.98 1.92 0.002
16 rh123 90.63 ± 18.12 225.52 ± 22.40 2.49 0.0001
17 salbutamol 105.73 ± 23.03 148.96 ± 21.62 1.41 0.034
18 salmeterol 158.33 ± 21.58 183.33 ± 23.75 1.16 0.170
Table 5.3.1 The apparent permeability of the panel of substrates (Papp) observed in the Ussing chamber model using intestinal segments of both the wild type and mdr1a/b (-/-) mice. Data are presented as mean ± S.D, n=4.

123
Permeability data from the Ussing chamber absorption experiments shows significantly increased
permeability in the mdr1a/b (-/-) intestines for 16 of the 18 substrates in the panel. The permeability
of salmeterol and GSK3 showed no significant difference between the two mice strains, table 5.3.1.
The data suggests that P-gp in the intestine attenuates the absorption of the panel of substrates
with the exception of salmeterol and GSK3. In all experiments the general permeability of the lung
was identical between the two groups of mice as evidenced by the measurements of TEER during
the experiments.
It is of note that the absorption of the two substrates which do not show P-gp mediated attenuation
of absorption in the intestine is affected in the lung, i.e. both salmeterol and GSK3 show increased
pulmonary absorption in the knockout mice.
Comparison of intestinal and lung permeability
In order to investigate the mechanism behind the discordance seen in the pulmonary absorption of
the panel of substrates their permeability in the lung and intestine was compared.
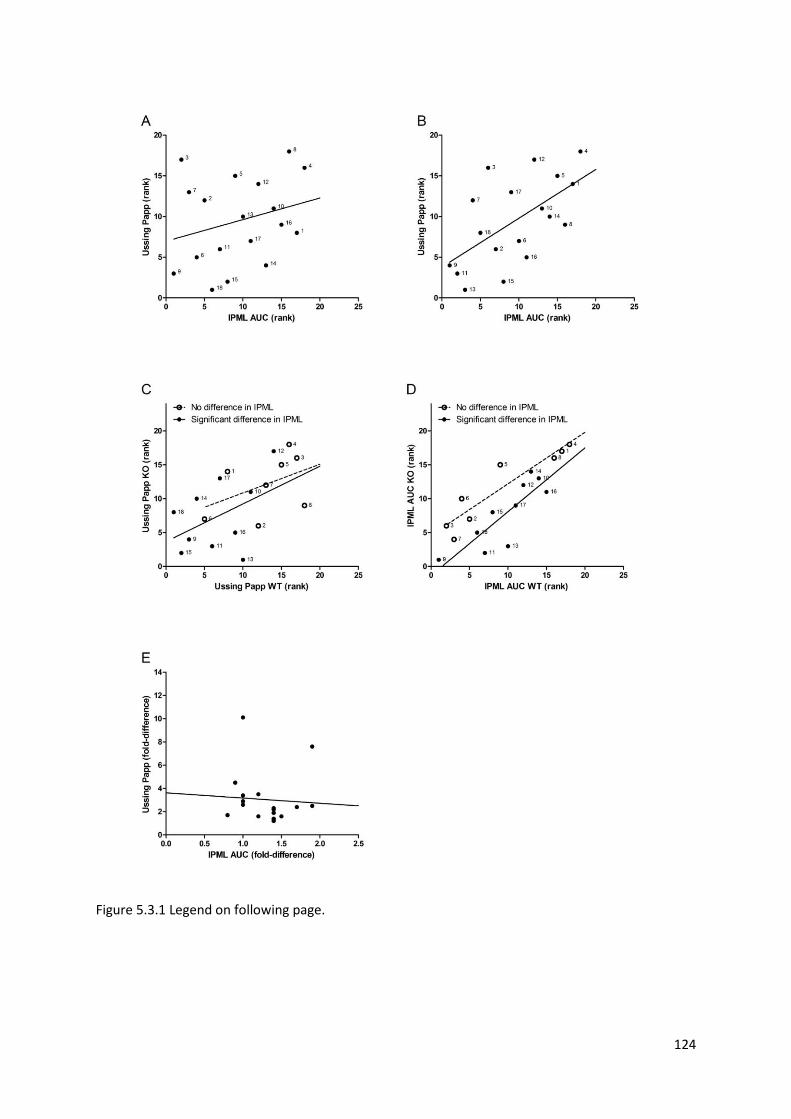
124
Figure 5.3.1 Legend on following page.

125
Correlations between the IPML model and the Ussing intestinal segments. Scatter plots illustrating correlations between IPML model and the Ussing intestinal absorption model in terms of the ranked absorption (A-D) or absolute absorption (E) parameters for the 18 molecules investigated. All correlations were undertaken using a linear regression model shown graphically by the solid or dashed lines. (A-B) Correlation between the ranked AUC data from the IPML model and the ranked Papp data from the Ussing intestinal model: (A) in wild type animals (P-glycoprotein positive) where linear regression shows a weak correlation (r2= 0.07, P= 0.29); (B) in mdr1a/b (-/-) (P-glycoprotein negative) animals where the correlation is stronger and significantly non-zero (r2= 0.36, P= 0.009). (C-D) Correlation between the ranked absorption parameters in wild type animals and the relevant mdr1a/b (-/-) knockouts with the substrates split in two groups based upon whether significant efflux was evident (solid line) or not evident (dashed line) in the IPML; (C) correlation in the ranks in the Ussing intestinal absorption model between wild type and knockout mice (r2= 0.19 P= 0.27 efflux evident in IPML ; r2= 0.20 P= 0.19 efflux not evident in IPML). (D) correlation in the ranks in the IPML absorption model between wildtype and knockout mice (r2= 0.86 P= 0.0009 efflux evident in IPML ; r2= 0.71 P= 0.002 efflux not evident in IPML). (E) Correlation between the fold-difference in absorption between the wild type and mdr1a/b (-/-) knockout mice in the IPML and Ussing intestinal absorption models (r2= 0.004, P= 0.80). Compound numbers used in the graph refer to the order of compounds in table 5.3.1.
It is apparent that in the absence of P-gp (in the knockout mice) the permeability of the substrates in
the lung and intestine is correlated and significantly non-zero (r2= 0.36, P= 0.009). In the presence of
P-gp this correlation in the permeability of the barriers is lost (r2= 0.07, P= 0.29) (figure 5.3.1A-B). If
P-gp affected the absorption of the panel to a similar extent at both barriers the correlation would
have been maintained in the wild type mice, its loss shows the discordant effect of P-gp upon the
absorption of the substrates at the two barriers.
This discordance is highlighted when the correlations are split in two groups based upon whether
significant efflux was observed in the IPML (figure 5.3.1C-D). In the comparison of the IPML
permeability in wild type and knockout lungs the split is expectedly clear and the two groups
distinct. When the same criteria are used to split the correlation of the permeability in the intestine
the distinction is lost. The effect of P-gp on the intestinal absorption of the substrates which showed
a significant efflux in the IPML is not distinct from those which were unaffected in the lung. This
suggests that increased P-gp efflux in the lung is not predictive of increased efflux in the intestine
and vice versa. Indeed there is no correlation between the magnitude of the effect of P-gp in the
lung and the intestine (figure 5.3.1D).

126
5.3.2 In vitro P-gp binding kinetics
As previously discussed, the net effect of P-gp upon the absorption of its substrates is dependent
upon the passive permeability of the substrate and its affinity to P-gp. An in vitro ATPase assay was
used to quantify the affinity of the substrate panel to P-gp and investigate the relationship between
P-gp binding kinetics and efflux in the lung and intestine and determine if differences in binding
kinetics explained the discordance seen in the IPML.
The binding kinetics of the substrates were investigated in human P-gp and both forms of mouse P-
gp (mdr1a and mdr1b). With the exception of digoxin the calculated Km values for both mdr1a and
mdr1b are similar to those obtained for human P-gp suggesting similar substrate affinity between
the different proteins. None of the 16 substrates showed more than a 3-fold positive or negative
change in Km between the human and mouse forms of P-gp. However, the Km for digoxin was
considerably lower for human P-gp than either mouse P-gp (there was a 17-fold increase in mdr1a
over human P-gp and a 13-fold increase in mdr1b). This suggests that digoxin possesses a higher
affinity for human P-gp than either of the mouse proteins.
When the panel is split in two groups dependent upon the effect of P-gp upon the absorption from
the IPML there is no significant difference in the P-gp binding kinetics of the two groups for any of
the three proteins (table 5.3.3).

127
Human (MDR1) Mouse (mdr1a) Mouse (mdr1b)
VMAX
(µM/min) Km (µM)
VMAX
(µM /min) Km (µM)
VMAX
(µM /min) Km (µM)
Digoxin 19.7 1.7 26.7 29.3 44.1 22.5
Erythromycin 19.3 116.1 28.4 64.2 48.5 78.7
GSK1 63.4 2.8 81.0 1.5 62.0 5.9
Mitoxantrone 32.2 4.6 27.5 9.1 35.0 6.4
Monensin 15.6 14.8 27.6 22.0 42.3 30.6
Puromycin 19.6 12.1 16.5 18.9 31.5 14.0
Saquinavir 41.3 24.9 39.5 31.7 47.1 32.0
Chloroquine 3.1 13.2 12.5 8.6 17.0 11.5
Colchicine 16.6 15.4 22.7 9.1 28.4 7.7
Domperidone 37.7 122.6 21.7 74.0 32.2 52.0
Eletriptan 42.2 91.5 32.6 45.6 76.1 58.1
GSK2 79.3 21.0 89.1 12.0 63.2 19.8
GSK3 19.2 34.3 15.3 45.1 22.7 31.5
GSK4 81.1 16.6 119.5 34.2 131.9 18.8
Rh123 36.3 2.2 35.2 6.0 29.7 2.2
Salbutamol 45.6 9.5 52.3 8.7 49.1 6.1
Salmeterol 24.4 15.3 27.5 12.7 38.2 14.8
Table 5.3.2 The enzyme binding kinetics obtained from the in vitro ATPase model using the Michaelis-Menten model. Substrates are split based upon whether efflux was observed in the IPML, the top seven molecules showed absorption from the IPML which was unaffected by P-gp, the lower ten showed increased pulmonary absorption in mdr1a/b (-/-) mice.
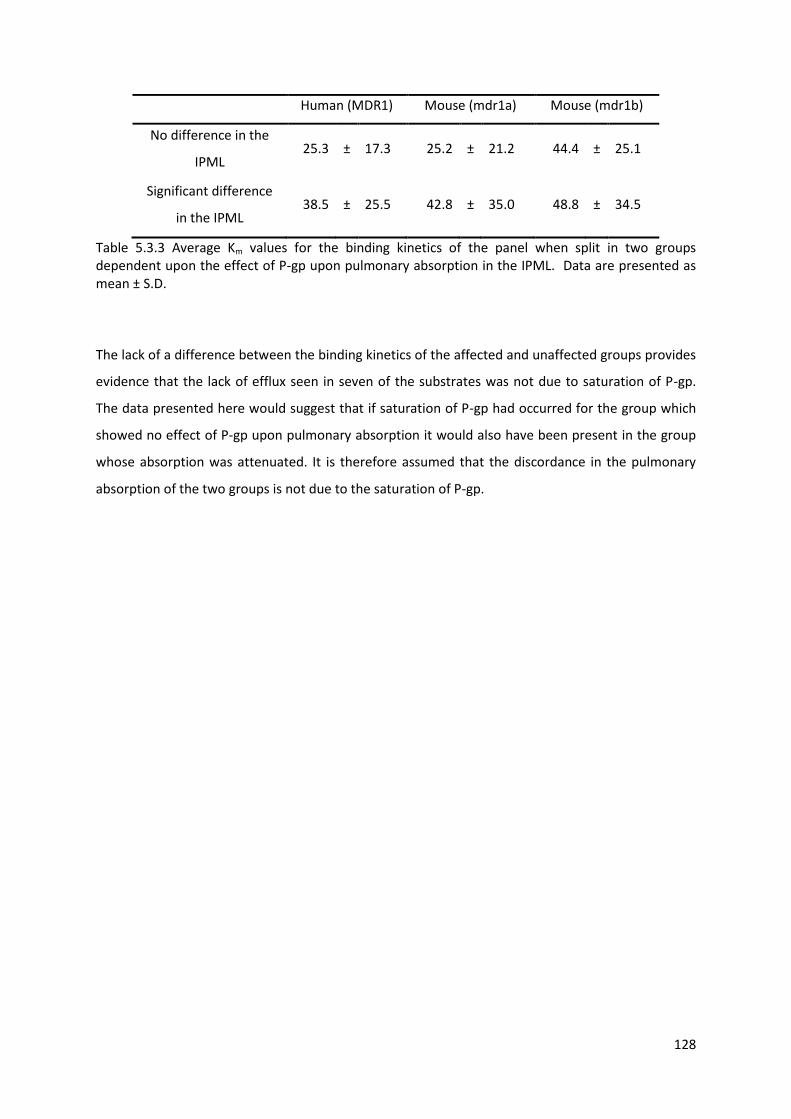
128
Human (MDR1) Mouse (mdr1a) Mouse (mdr1b)
No difference in the
IPML 25.3 ± 17.3 25.2 ± 21.2 44.4 ± 25.1
Significant difference
in the IPML 38.5 ± 25.5 42.8 ± 35.0 48.8 ± 34.5
Table 5.3.3 Average Km values for the binding kinetics of the panel when split in two groups dependent upon the effect of P-gp upon pulmonary absorption in the IPML. Data are presented as mean ± S.D.
The lack of a difference between the binding kinetics of the affected and unaffected groups provides
evidence that the lack of efflux seen in seven of the substrates was not due to saturation of P-gp.
The data presented here would suggest that if saturation of P-gp had occurred for the group which
showed no effect of P-gp upon pulmonary absorption it would also have been present in the group
whose absorption was attenuated. It is therefore assumed that the discordance in the pulmonary
absorption of the two groups is not due to the saturation of P-gp.

129
5.4 Discussion
The use of an Ussing chamber provides a powerful and well validated tool for the investigation of
intestinal absorption. The method was originally developed by Hans H. Ussing in the 1960’s to
measure the active transport of NaCl and has since been adapted and well utilised for the study of
active transport processes.
Although originally developed as a technique for measuring electrochemical processes and solute
transport the technique has now been well used for the study of the effects of P-gp on intestinal
absorption. In 2002 Stephens et al. used an Ussing chamber model to investigate the effects of P-gp
upon the absorption of digoxin, paclitaxel and etoposide from the ileum of mdr1a (-/-) mice (171).
The validation of the model for use with the P-gp deficient mice showed that the absence of P-gp did
not affect the permeability of the intestine. The absorption of the paracellular markers mannitol and
propranolol were unchanged between the knockout and wild type mice and the two strains also
showed indistinguishable TEER values throughout the experiments. This is a finding in agreement
with the observations here which also suggest the mdr1a/b (-/-) mice do not show altered barrier
properties. The group then compared the absorption of all three substrates in both A:B and B:A in
both strains of mice. The results for digoxin and paclitaxel showed that in the wild type mice the
absorption across the intestine was polarised (efflux ratios of 10 and 17, respectively) and the
polarisation was lost in the knockout mice. This is strong evidence to support both the role of P-gp in
the efflux of these substrates in the intestine and the suitability of the Ussing chamber model for
identifying efflux at this barrier. The results for etoposide showed reduced but not eliminated
polarised transport in the knockout mice. As the residual efflux of etoposide was subsequently
abolished by an inhibitor of MRP it was concluded that the molecule was effluxed by both
transporters in the intestine.
The Ussing model has also been used to identify the role of P-gp on intestinal absorption using
chemical inhibition. P-gp inhibition has been shown to increase the permeability of a range of
substrates in the intestine (170,172).
The model utilised here for the study of intestinal P-gp has been adapted from those utilised
previously in the literature. Many Ussing chamber preparations of intestine require the stripping of
the smooth muscle layer to identify absorption processes at the epithelia. For mouse intestines this
process requires specialised equipment and a highly skilled operator due to the size of the barrier

130
(169). The study discussed above which investigated intestinal absorption in P-gp deficient mice
utilised unstrapped intestinal segments. Data from this group provides evidence that the stripping is
not necessary for mouse intestines as it was shown that unstrapped mouse intestines produce
absorption data which is in agreement with data generated from stripped rat intestines (171). The
intestines utilised in this chapter were not stripped of the smooth muscle layer.
As discussed in the introduction, the expression of P-gp is not even throughout the small intestine,
rather it is concentrated around the distal jejunum and ileum. Therefore experiments conducted
here used intestinal segments from the distal third of the small intestines. Due to the necessity of
obtaining triplicate 1 cm intestinal segments from each mouse it was not possible to utilise only the
ileum in the experiments. By utilising the most distal third of the small intestine we attempted to
conduct our experiments with the intestinal region most relevant for P-gp efflux.
In order to investigate the discordance observed in the effects of P-gp upon the absorption of the
panel of substrates from the IPML it is important to establish whether this discordance is lung
specific. The substrates selected for the panel had all been shown to possess decreased oral
bioavailability in the presence of P-gp (130) and here we corroborate this by determining the effect
of intestinal P-gp on the absorption of the whole panel in a single experiment.
Permeability data from the Ussing chamber model implicated P-gp in the absorption of 15 of the 17
substrates in the panel. These 15 substrates all showed enhanced permeability in the knockout
mdr1a/b (-/-) mice in comparison to wild type. Conversely, the absorption of salmeterol and GSK3
showed no difference between the two mice strains suggesting that P-gp did not affect the intestinal
absorption of these substrates. It is of note that both salmeterol and GSK3 showed P-gp attenuated
absorption from the IPML.
It is clear that the discordant effects of P-gp observed in the IPML are not replicated at the intestinal
barrier. The 7 molecules which showed no attenuation of absorption by P-gp in the lung all showed
increased intestinal permeability in the mdr1a/b (-/-) mice.
In the absence of P-gp (i.e. in the knockout mice) a correlation is observed between the absorption
of the panel at both barriers, those molecules most highly absorbed from the IPML are more likely to
be highly absorbed in the intestine. This correlation is lost in the presence of P-gp. If the effects of
intestinal P-gp on the absorption of the panel mirrored those observed in pulmonary absorption we

131
would expect to have seen this correlation maintained. The loss of the correlation suggests that the
factors which determine the net effect of P-gp efflux in the intestine are distinct from those in the
lung.
This is corroborated by directly comparing the net effect of P-gp (measured as fold-difference in AUC
between wild type and knockout mice) at both barriers. If it was the case that the net effect of P-gp
was determined by the same parameters at both barriers, we would see a strong positive correlation
between the net effect of P-gp in the lung and in the intestine. Instead there is no correlation
observed (r2= 0.004) showing that a high extent of efflux from the intestine is not predictive of efflux
from the lung.
It is generally accepted that P-gp expression is lower in the lung than in the intestine (5,109) and it is
therefore possible that a concentration of substrate which allows efflux in the intestine could
saturate P-gp in the lung. It is therefore feasible that the subset of substrates from the panel which
show no efflux from the lung do so because they saturate pulmonary P-gp. The evaluation of the
binding kinetics of the panel of substrates with mdr1a and mdr1b could be seen to support this. The
dose delivered to the mouse lung for all substrates except digoxin would result in approximately 25
µM of the drug in the ELF, for many of the substrates presented here the calculated Km values are
below this concentration. However, saturation is unlikely to explain the discordance observed in the
pulmonary absorption of the panel. One of the molecules which showed no effect of P-gp upon its
pulmonary absorption (digoxin) was delivered as a radiolabelled dose at nanomolar concentrations,
approximately 100-fold lower than Km. Saturation cannot be responsible for the lack of efflux seen
with digoxin.
Saturation is also unlikely to explain the lack of pulmonary efflux in the remaining six molecules. It is
obvious that the 10 substrates which showed efflux in the IPML did not saturate P-gp. As the six
remaining un-effluxed substrates were dosed at the same concentrations as these ten, saturation
would only occur if they had higher affinity to P-gp. This is not observed in the enzyme binding
kinetics determined here. Here we show that there is no difference in the enzyme binding kinetics of
both groups of substrates (those which show pulmonary efflux and those which do not) in either
mdr1a or mdr1b.
As discussed in the introduction, the net effect of P-gp efflux upon the absorption of a substrate is a
complex process influenced by both the passive permeability of the substrate and the efficiency of P-

132
gp at excluding it from the cell. In the intestine this is shown to result in a situation where the oral
bioavailability of substrates which show moderate or low passive absorption across the intestine is
limited by P-gp. Conversely, there is a set of P-gp substrates which show high passive absorption and
decrease the effect of P-gp efflux to a negligible level. Due to the nature of P-gp substrates those
with high intestinal passive absorption tend to be molecules which show rapid absorption across
membranes, i.e. have a high transmembrane movement rate. The physicochemical factors which
predict high transmembrane movement rates are discussed more fully in chapter 6.
It seems feasible that the discordance between the effects of pulmonary and intestinal P-gp could be
due to differences in the passive permeability of the substrates at both barriers. In particular a
prominent difference between the two barriers is the permeability of the paracellular pathway
(149).
The paracellular pathway in the lung is generally accepted to be more permeable to the absorption
of a range of hydrophilic compounds than that of the intestine. Work compiling a number of in vivo
studies from the literature has shown that an inverse linear relationship between the MW and
clearance rate of a range of hydrophilic compounds form the lung (173). The fact that the clearance
rate from the lung is determined by the MW of a molecule implies that it is a passive diffusion
process.

133
Figure 5.4.1 A graph adapted from (174) showing the linear relationship between the observed rate of absorption from the airways (ka) and their MW. MW is expressed as 1/MW0.33, a numerator which describes the diffusion coefficients of the molecules according to the Stokes’ equation. Data are adapted from (173,175,176)
Similar studies have shown the same prevalence of the pulmonary paracellular pathway for the
absorption of a range of molecules. In all cases a linear relationship is observed between the rate of
absorption from the lung and the size of the molecule (figure 5.4.1) (174). The compilation of
literature data provides strong evidence for a restrictive diffusion process through an aqueous
matrix in the lung, i.e. evidence for paracellular permeability of a range of molecules. Indeed it has
been shown that the absorption of a range of cardiac glycosides from the lungs of rats was increased
with reductions in lipophilicity (177).
As the efficiency of P-gp mediated attenuation of absorption is dependent upon both the affinity of
a substrate to P-gp and the substrates passive permeability characteristics it would seem likely that
an increase in paracellular permeability could result in changes in the net effects of P-gp. It is
possible that the lack of effect of P-gp on the pulmonary absorption of a group of substrates within
the panel is due to the increased paracellular permeability of the lung. Here we have shown that the
0.120.100.080.060.040.020.00.00001
.0001
.001
.01
.1Rat
Dog
Rabbit
1/(MW)^0.33
Ob
se
rve
d k
a

134
absorption of these substrates across a barrier with more restrictive paracellular transport (the
intestine) is attenuated by P-gp.
In order to investigate the contribution of the paracellular pathway further the membrane binding
characteristics and physicochemical properties of the substrates in the panel will be investigated.
The data generated will enable the development of a hypothesis into the mechanism of the
discordance seen in the absorption of substrates from the lung and provide an insight in to why it
appears distinct from the intestinal effects of P-gp.

135
Chapter 6
Membrane binding affinity and physicochemical parameters

136
6.1 Introduction
The primary mechanism for the transmembrane movement of most low molecular weight drugs is
passive transport. As discussed in chapter 5, the first step in the transport of a drug across a lipid
membrane is interaction with the outer membrane leaflet. The affinity of a molecule to bind with
the lipid membrane therefore modulates the transmembrane movement rate. This initial binding
step of a drug with the lipid membrane is determined by the physicochemical properties of the
molecule. Due to the importance of membrane affinity in a wide range of pharmacological functions
there have been numerous approaches developed to investigate the relationship between a
molecule and membrane.
Figure 6.1.1 A schematic representation of the flip-flop absorption process of drug like compounds. Figure was adapted from (178)

137
6.1.1 Physicochemical characteristics for predicting membrane interaction
Physicochemical prediction of membrane binding
In its simplest form the interaction of a molecule with a lipid membrane is determined by the
physicochemical features determining its lipophilicity. Increases in lipophilicity and therefore
membrane interaction are associated with low H-bonding potential, PSA and an increase in rotatable
bond counts (179).
Molecules with the ability to form numerous hydrogen bonds have been shown to interact
preferably with water rather than the polar head groups of a lipid membrane, it is suggested this is
due to the abundance of water molecules present in this membrane region in comparison to lipid
molecules. The hydrogen bonds formed with water must be broken before these molecules can
interact with the lipid membrane. The result is a higher energy burden on interaction with the lipid
membrane and therefore a lower membrane affinity. Similar relationships between membrane and
affinity and PSA may be describing the same hydrogen bonding interactions, the two
physicochemical parameters are generally well correlated.
Simple measurements of hydrogen bond donor and acceptor counts do not fully explain the degree
of this interaction, as the strength of the interaction is not determined solely by the number of
hydrogen bonds but also by their strength. To account for differences in the strength of the
hydrogen bonds acidity and basicity can be determined according to the Abraham solvation model.
The Abraham solvation model which describes linear free energy relationship of solute partitioning
in condensed phase has been used previously to successfully predict the partition coefficients of a
range of molecules at the intestinal, skin and plasma-to-milk barriers (180,181)It is described by the
equation –
SP = c + e.E + s.S + a.A + b.B + v.V
Where SP is solute partitioning, E is the excess molar fraction, S refers to the polarisability, A and B
are measures of the hydrogen bond acidity and basicity and V is the McGowan volume. Upper case
letters refer to the descriptors of the solute, lower case letters refer to the descriptors of the barrier.

138
Although the solvation model is well utilised for prediction of solute partitioning it is also possible to
use it to work out the strength of hydrogen bond acidity / basicity and polarisability of a molecule.
This is achieved by calculating the solute partitioning coefficient experimentally in a range of
solvents with known Abraham descriptors. The Abraham descriptors of the solute can then be
determined.
6.1.2 Experimental methods for predicting membrane interaction
Octanol/water partitioning
One of the most common methods used to estimate the affinity of a molecule for a lipid membrane
is that of the octanol-water partition coefficient (LogP). Despite its abundant and frequent use, it has
been suggested that LogP is a poor descriptor of membrane interactions for many drugs. This is the
result of the lack of hydrogen-bonding in the octanol-water partitioning resuting in a poor model of
the amphitropic mammalian membranes. Predictions of membrane interactions involving polar or
charged molecules are particularly poor as LogP fails to take in to account the effect of electrostatic
interactions of the charged molecules due to the simplicity of the isotropic medium used in its
calculation (182).
A study by El Tayar et al. highlights the issues involved with utilising LogP as a measure of membrane
partitioning. The group showed a significant correlation between the micelle-water partition
coefficient (LogPMW) and the activity of a range of antiplatelet agents. However, the same study
showed no correlation between the LogPOCT values and activity of the agents in the same study.
The use of LogD attempts to expand upon the use of LogP by accounting for the presence of ionic
species in its calculation. As such LogD relies on the pH of the medium and pKa of the molecule to
account for the ionic species.
Historically, logP was determined experimentally by measuring the fractions of a drug present in
water and octanol following equilibrium of a shake-flask experiment (183). Recently, it is more
common for the parameter to be computationally determined using a fragment based additive
approach to generate a calculated or cLogP (184).

139
Reversed-phase chromatography
Reversed-phase chromatographic techniques such as HPLC and thin layer chromatography (TLC) are
frequently used to simulate octanol-water partitioning as measurements of lipophilicity. When
compared to the conventional methods of determining LogP they provide a more robust, high
throughput system which has been shown to produce more reproducible results. There is evidence
in the literature supporting the relationships between lipophilicity measurements generated in this
manner in comparison to octanol-water partitioning (185).
The lipophilicity measurement determined by these techniques is derived from the retention time of
the molecules in relation to the solvent front. It is described as Logk and can be compared to the
Logk of molecules with a known LogP in order to estimate the lipophilicity of the molecule as a linear
relationship exists between the two parameters. The standardisation of the chromatographic
conditions used in the production of Logk values have helped to establish good correlation with
values for LogP and LogD. Generally, the experiments utilise C18 columns as a stationary phase and
measure the retention time of substrates with a mobile phase of varying ratios of methanol or
acetonitrile in water.
Liposome partitioning
Unlike the isocratic systems described above, partitioning in to liposomes is considered a more
direct model of membrane interaction and may therefore prove more relevant to studies of drug-
membrane interaction. The liposomes themselves are generally composed of phospholipids,
frequently phosphatidylcholine, which spontaneously form lipid bilayers trapping small amounts of
media in the interior of the liposome. Liposome models have been described with a huge variation in
the number of bilayer sheets from simple vesicles with a single sheet to large multilamellar vesicles
with hundreds of layers (186).
Unlike octanol-water partitioning the surface of the liposomes possesses a dipole field determined
by the polar headgroups. The result of this is the increased partitioning of charged molecules to
liposomes in comparison to the isocratic techniques discussed above. This more closely mimics the
situation in vivo as electrostatic interactions at the membrane surface have been shown to be
important for binding and partitioning of charged molecules.
Determination of the liposome-water partition coefficient relies on the equilibration of a drug
solution with a suspension of liposomes. The liposomes must then be removed from the suspension

140
and the fraction present in the lipid phase calculated. The production of liposomes is associated with
difficulties in relation to their stability and reproducibility of formation. These difficulties have
resulted in limited use of liposome partitioning as an alternative to octanol partitioning although
there are examples of the successful use of the technique in the literature.
One such example utilised the liposome-water partition to examine the effect of the membrane
affinity of rhodamine dyes on their P-gp efflux (148). The study utilised liposomes composed of
phosphatidylcholine (PC) and phosphatidylglycerol (PG) to investigate the transmembrane
movement rate of seven rhodamine dyes. Due to the the generally lipophilic nature of all P-gp
substrates an equilibrium is reached rapidly between the outer membrane and the aqueous media
upon addition of rhodamine dyes to multilamellar vesicle (MLV) suspensions. Dye uptake to the
subsequent inner layers is then determined principally by the transmembrane movement rate of the
dye as it has to traverse the first membrane to reach the second. It is therefore assumed that with
the exception of the rapid initial binding to the outer membrane the amount of rhodamine dye
associated with the liposomes at a given time point (its binding rate) is determined solely by the
transmembrane movement rate of the molecule.
The study compared the data generated for the transmembrane movement rates of the rhodamine
dyes and their P-gp efflux ratios. It was found that, independent of the affinity to P-gp, the efflux
ratio was inversely proportional to the transmembrane movement rate of the dye. This was early
evidence of the effect of increasing passive permeability in order to reduce the effects of P-gp
mediated efflux.
Immobilised artificial membrane (IAM) chromatography
The frequent criticisms of the use of isocratic systems such as octanol-water partitioning as
measurements of membrane partitioning has led to the development of IAM chromatography. This
model attempts to combine the relevance of the more complex liposome partitioning experiments
with the ease of reverse phase chromatography (187,188). In IAM chromatography a stationary
phase of fixed PC is used to simulate the outer membrane leaflet. The mobile phase used is generally
either PBS to simulate physiologic conditions or for the elution of more strongly retained molecules
acetonitrile:water solutions. If solutions of acetonitrile are used multiple retention times in various
acetonitrile compositions (commonly 10, 20 and 30 %) are generated in order to extrapolate a
retention time in pure water. Mobile phases containing methanol should be avoided as there is
evidence of damage to the fixed PC in the presence of methanol.

141
Despite offering the same simplicity as the reverse phase HPLC techniques described previously,
studies have shown the IAM is capable of generating data which correlates well with liposome
absorption studies (189). A number of studies have shown improvements in membrane partitioning
prediction using IAM techniques as opposed to isotropic techniques such as octanol-water
partitioning. It has been shown that the antihaemolytic activity of a series of drugs was described
significantly better by LogK values determined using an IAM column as opposed to simple isotropic
techniques (190). Similarly, it has been shown that the IAM columns are better descriptors of
lipophilic and polar interactions for a series of dihydropyridines (191).
Studies utilising IAM chromatography have been able to correlate performance in the IAM with
measurable in vivo membrane transport processes such as brain penetration (192). The retention
factors for a set of 26 drugs for which literature brain penetration data was available were
determined using an IAM column. Correlations between the LogkIAM and brain penetration
highlighted the predictive capability of the model for the assessment of membrane transport.
Similarly, the prediction of oral absorption has been achieved for a set of 37 compounds from the
literature (193) with a strong coefficient of determination of 0.9. The IAM was shown to be a more
predictive tool than octanol-water partitioning in the same experiments.
6.1.3 Experimental Objectives
In previous chapters we have shown a discordant effect of P-gp upon the pulmonary absorption of a
panel of substrates in a manner that is distinct from that observed previously in the intestine.
Previous studies have shown that the net effect of P-gp upon absorption is due to a relationship
between the exclusion of the substrate from the cell by P-gp and its passive absorption rate.
Here we hypothesise that the differences seen in the effects of P-gp between the lung and intestine
are due to the increased permeability via the enhanced paracellular pathway of the lung. To
investigate this we measure the membrane binding and affinity of the substrate panel using both
IAM chromatography and liposome partitioning. The physicochemical parameters of the panel will
be established and used to explain the lack of pulmonary efflux seen in a subset of the panel as well
as make predictions about the prevalence of the predicted pulmonary P-gp efflux within the drugs
currently administered via inhalation.

142
6.2 Materials and Methods
6.2.1 IAM chromatography
Materials
Chemical Descriptor Product
Code Supplier
Acetonitrile HPLC Grade 10407440 Fisher Scientific, Loughborough, UK
Dimethyl Sulfoxide n/a 10080110 Fisher Scientific, Loughborough, UK
Table 6.2.1 Chemicals and solvents used in the analysis of compounds delivered to the IPML along with their supplier details.
Equipment Manufacturer Product Identifier
Solvent Degasser Thermo Finnigan SCM1000
Pump Thermo Finnigan P4000
Autosampler Thermo Finnigan AS3000
UV detector Thermo Finnigan UV2000
IAM Column Regis Technologies IAM.PC.DD2, 10cm x 4.6 mm ID
Table 4.2.4 Equipment used in the analysis of compounds delivered to the IPML and the relevant manufacturer details.
Method
Drug solutions of 100 µg/mL were prepared in 50:50 acetonitrile:water prior to chromatographic
separation. The analysis of the retention time of drugs on the IAM column was achieved by injecting
10 µL of the drug solution on to the column and eluting with mobile phase which was pumped
through the column at 1 mL/min as an isocratic gradient in all experiments. The retention time of all
substrates was calculated in three mobile phase compositions, 10 % acetonitrile in water, 20 %
acetonitrile in water and 30 % acetonitrile in water.
Using the multiple gradients of acetonitrile concentrations the retention times were extrapolated by
linear regression to determine the theoretical retention time in 100 % water. This was then used to
calculate LogKIAM according to the equation –
LogKIAM= log[(Tr-T0)/T0]
Where Tr and T0 are the retention time of the substrate in 100 % water and the retention time of an
unretained compound / the solvent front (75 seconds in all experiments).

143
6.2.2 Liposome partitioning
Liposome formation - Method
The formation of multi lamellar vesicles was performed as detailed by Eytan (148). Solutions of 8 mg
phosphatidylcholine and 2 mg phosphatidylglycerol in 10 mL chloroform were dried whilst rotating
under vacuum to produce a lipid film. Vacuum was maintained for an hour after all visible liquid had
evaporated to ensure no residual chloroform was present. Mutlilamellar vesicles (MLV) were then
formed by the addition of 1 mL of 25 mM HEPES-Tris buffer (pH 7.5) and gentle shaking for 4 hours.
The suspension was then centrifuged at 6000 rcf for 15 minutes to pellet the vesicles and the
supernatant was removed. The MLVs were then resuspended in 10 mL of PBS (pH 7.4) and stored at
4 oC under nitrogen gas overnight before partition experiments were performed.
Freeze drying of the resultant suspension showed average lipid yields of 46 ± 8 % in the MLV
formation, a value consistent with the Eytan study. This yield generates a MLV suspension containing
approximately 10 - 15 µM of phospholipid. This was consistent across all paritition experiments as
they were all performed on a single batch of MLVs.
Partition experiments
MLV suspensions were removed from 4 oC and diluted 1000-fold in PBS (pH 7.4). Aliquots of the
resultant suspension (1 mL) were transferred to microcentrifuge tubes. All substrates were tested in
triplicate with 3 microcentrifuge tubes per substrate. 10 µL of a 100 µg/mL dose was administered to
all liposome suspensions resulting in a drug concentration of 1 µg/mL in the aqueous compartment
at the beginning of the experiment.
Suspensions were then incubated at 37 oC with shaking for 4 hours to allow the equilibration of the
dose in the lipid and aqueous fractions. The liposomes were then pelleted and 100 µL of supernatant
removed for analysis.
The concentration of the dose present in the supernatant was determined by either LC-MS/MS or
liquid scintillation in the manner described in chapter 4. It was assumed that all dose not in solution
in the aqueous supernatant had partitioned in to the liposomes.

144
Partitioning in to the liposomes was determined according to the following equation –
Liposome partition co-efficient = (C0-CS) / C0
Where C0 is the drug concentration present at the beginning of the experiment (1 µg/mL) and Cs is
the concentration present in the supernatant at the end of equilibration.
6.2.3 Computer generated physicochemical properties
Determining primary physicochemical properties
Values for cLogP, cLogD, H-bond donors, H-bond acceptors, rotatable bond count, molecular volume
and molecular weight were determined using the online ACD/Labs software with the SMILES string
of each substrate as the input.
Connolly accessible surface area and polar surface area (PSA) were calculated in the ChemBio3D
Ultra 11.0 software (Cambridgesoft, UK) from the chemical structures of the substrates.
Determining Abraham solvation parameters
As mentioned in the introduction it is possible to determine the Abraham solvation parameters
experimentally by comparisons of a substrates partition coefficients in standard solvents. A more
high-throughput approach was utilised here by utilising a fragment based approach (GSK in house
software). This is achieved by the software breaking the chemical structure in to small simple
fragments. These are then screened against a large database containing the Abraham solvation
parameters for many such fragments. The solvation parameters of the fragments can then be used
to determine the solvation parameters of the parent molecule in a simple additive manner.
Calculation of Abraham descriptors in this was has been shown to produce good correlations with
values determined experimentally (194).

145
6.3 Results
6.3.1 IAM chromatography
In order to gain an insight in to the membrane interactions of the panel of substrates, a number of
studies were carried out in order to assess membrane affinity. The first of these utilised an HPLC
column with a PC stationary phase to assess the extent of the interactions of each drug with this
phospholipid. Drugs which interact less with PC showed a decreased retention time on the column
and therefore possess lower LogKIAM values.
IAM Aqueous
Retention
Time (secs)
Liposome
Partition
Coefficient
digoxin 0.9 0.3
erythromycin 0.9 0.46
GSK1 1.1 0.65
mitoxantrone 1.1 0.59
monensin 1.3 0.68
puromycin 1.3 0.62
saquinavir 1.2 0.45
chloroquine 1.4 0.95
colchicine 1.3 0.86
domperidone 1.3 0.92
eletriptan 1.5 0.94
GSK2 1.3 0.86
GSK3 1.4 0.97
GSK4 1.2 0.92
rh123 1.3 0.82
salbutamol 1.5 0.88
salmeterol 1.6 0.8
Table 6.3.1 Data showing the data for both the IAM and liposome membrane affinity experiments. Increases in either determinant are associated with increased membrane association. Data are split according to the observed effect of P-gp upon their pulmonary absorption, substrates in the upper section were unaffected by pulmonary P-gp and those in the lower showed significant P-gp efflux in the lung.

146
All of the substrates were retained on the IAM suggesting they are all capable of membrane
interaction. Compounds which are hydrophilic and do not interact with membranes (such as
sucrose) show no retention on IAM columns and are eluted with the solvent front.
There is a significant difference between the LogKIAM of the molecules affected by P-gp in the lung
and those which are not (mean= 1.39 and 1.22, respectively, p = 0.002). This suggests the strength of
the membrane interactions of these two groups is distinct with a higher affinity for membranes
observed in the P-gp effected group of substrates.
6.3.2 Liposome partitioning
Data for the partitioning of the substrates into liposomes acts to corroborate the difference
observed in the IAM model of membrane partitioning. The significantly increased membrane affinity
of the substrates effected by P-gp in the lung compared to those which are not is also observed in
the liposome partitioning coefficient (mean = 0.89 and 0.54, respectively, p = 2 x10⁻⁶).
A strong correlation is observed between the data generated by IAM chromatography and liposome
partitioning (r2 = 0.74). This is in agreement with the literature studies which have seen strong
predicitons of membrane interaction from the IAM column. The calculated basic physicochemical
parameters and Abraham descriptors are shown in tables 6.3.1 and 6.3.2, respectively. The table is
split in to two groups with the substrates in the upper section showing no effect of P-gp upon their
pulmonary absorption from the IPML whilst the absorption of those in the lower section was
significantly attenuated.
6.3.3 Physicochemical properties
When the physicochemical properties of the two groups were compared it was observed that they
formed two distinct physicochemical profiles. The group of substrates which was affected by P-gp
expression in the lung possessed significantly lower hydrogen bond acidity and basicity (as measure
by Abraham solvation parameters and simple H-bond counts) (p = 0.12 for Abraham acidity and 2.8
x10-5 for Abraham basicity). The polarisability and PSA of this group was also significantly lower (p =
0.02 and 5.5 x10⁻⁷, respectively)
As these are physicochemical properties which have been shown to influence membrane affinity it
suggests that the increase seen in the membrane affinity for this group is due to these
physicochemical distinctions. Indeed Abrahams acidity, basicity and polarisability all show strong
negative correlations to the liposome binding coefficient (r2= -0.73, -0.91 and -0.66, respectively).

147
cLo
gD (
7.4
)
cLo
gP
H b
on
d d
on
or
(aci
dit
y)
H b
on
d a
ccep
tor
(bas
icit
y)
H b
on
d t
ota
l
Ro
tata
ble
bo
nd
co
un
t
Po
lar
Surf
ace
Are
a
MW
Digoxin 0.90 0.90 6 14 20 13 203.00 780
Erythromycin 1.20 1.90 5 14 19 12 194.00 733
GSK1
3.75 10 3 13 7 130.48 571
Mitoxantrone 1.00 1.55 8 10 18 16 163.00 444
Monensin 0.96 4.01 4 11 15 13 153.00 670
Puromycin 0.97 1.30 5 12 17 11 164.00 471
Saquinavir mesylate 3.60 4.03 6 11 17 14 167.00 670
Chloroquine 1.59 4.41 1 3 4 8 28.00 319
Colchicine 1.07 1.07 1 7 8 5 87.00 399
Domperidone 2.93 4.05 2 7 9 5 79.00 425
Eletriptan 0.23 2.98 1 4 5 6 53.00 382
GSK2
3.28 7 2 9 6 99.50 495
GSK3
3.11 3 0 3 9 33.02 466
Indacaterol
-1.71 5 1 6 4 59.06 393
Rhodamine 123 4.01 4.01 4 5 9 5 90.00 344
Salbutamol -1.44 0.69 4 4 8 8 73.00 239
Salmeterol 1.15 3.07 4 5 9 19 82.00 416
Table 6.3.2 The calculated physicochemical parameters for the panel of P-gp substrates. The substrates are split in to two groups depending on the effect of P-gp on their pulmonary absorption, the upper section are unaffected and the lower are affected.

148
Ab
rah
am A
cid
ity
(>0
.75
)
Ab
rah
am B
asic
ity
(>3
)
Ab
rah
am V
olu
me
Ab
rhah
am
Po
lari
zab
ility
(>3
)
Ab
rah
am M
ola
r
Ref
ract
ive
Ind
ex
Digoxin 1.72 4.62 5.75 5.34 3.20
Erythromycin 1.02 4.71 5.77 3.55 1.97
GSK1 1.08 2.67 3.83 5.28 3.83
Mitoxantrone 0.52 2.88 3.29 2.06 3.31
Monensin 1.45 3.55 5.24 2.44 1.61
Puromycin 0.51 3.56 3.42 3.58 3.38
Saquinavir mesylate 1.61 4.68 5.89 6.30 4.25
Chloroquine 0.20 1.59 2.63 1.73 1.91
Colchicine 0.37 1.96 2.99 2.96 2.11
Domperidone 0.65 2.23 3.06 3.09 3.81
Eletriptan 0.00 1.84 2.93 3.17 2.74
GSK2 0.83 2.56 3.76 3.78 3.76
GSK3 0.00 0.80 3.88 2.36 3.88
Indacaterol 0.54 2.06 3.09 2.54 3.09
Rhodamine 123 0.50 1.21 2.56 2.90 3.27
Salbutamol 1.08 1.91 1.98 1.41 1.41
Salmeterol 1.08 2.11 3.49 2.11 2.07
Table 6.3.3 The calculated Abraham solvation parameters for the panel of P-gp substrates. The substrates are split in to two groups depending on the effect of P-gp on their pulmonary absorption, the upper section are unaffected and the lower are affected.
149
6. Discussion
The interaction of a molecule with a plasma membrane is determined by the physicochemical
properties of both the molecule and the membrane. It has been suggested that systems such as the
octanol-water coefficient are poorly predictive of this interaction due to the over simplicity of the
model (195). Models such as octanol-water partitioning do not possess the electrostatic interactions
present on the surface of phospholipid membranes due to the dipole charges of the phospho-
headgroups. These electrostatic interactions with the solute are important for determining the
energy cost involved with solute-membrane binding. The lack of the dipole charges in octanol-water
partition coefficient models significantly reduces their usefulness in the analysis of charged
compounds.
Here we present data from two models which have been shown to be predictive of membrane
binding in a biological situation, IAM chromatography and liposome binding. The data from these
two experiments clearly highlights discordance in the membrane affinity of the substrate panel. In
both membrane models the substrates which show a significant effect of P-gp efflux are shown to
possess higher membrane affinities. This is reflected in similar differences in the physicochemical
properties which have been shown to influence the process of membrane binding. That is to say that
the substrates which show positive efflux from the lung possess significantly decreased PSA, H-bond
acceptors, H-bond donors, MW, Abraham acidity, Abraham basicity and Abraham polarisability.
In order to validate the use of physicochemical descriptors as predictors of membrane interactions
the Abraham solvation parameters were correlated with the results of the liposome partitioning
experiments. The results show that increases in Abraham acidity, basicity and polarisability are all
well correlated with decreases in the membrane affinity of a molecule. This is shown by the strong
negative correlations obtained of r2= -0.73, -0.91 and -0.66, respectively. This is in agreement with
the literature where it has been shown that Abraham descriptors are good predictors of binding to
biological membranes (196)
For lipophilic drugs such as P-gp substrates it has been shown that their mechanism of transport
across a phospholipid bilayer is one of a distinct flip-flop type event, discussed in detail previously.
Whilst the rate limiting factor of a single molecule’s transport has been shown to be the flip-flop
itself (165) increases in membrane affinity will increase the concentration of drug present in the
outer leaflet of the membrane which acts as the donor compartment for this reaction.

150
It would therefore be predicted that increases in membrane affinity would result in increases in
passive permeability across the lung. By taking the pulmonary absorption of the substrate panel
from the IPML with the lungs of P-gp deficient mice as a measure for the passive permeability at this
barrier it is possible to compare the effect of membrane affinity on passive pulmonary absorption. In
the lungs there is no observed correlation between the two parameters (r2= 0.23). This is perhaps
indicative of the increased absorption of the lung to hydrophilic compounds due to the increased
prevalence of the paracellular pathway.
The relationship witnessed here between the membrane affinity of a substrate and the net effect of
efflux is not the same as those observed in the intestine (130). In the intestine enhancements in
membrane affinity have been shown to lead to decreases in P-gp efflux. The opposite relationship is
observed here where it is shown that the substrates which show significant efflux by P-gp are also
those which show the highest membrane affinity.
We propose this is reflective of the differences in the permeability of the two barriers via the
paracellular route. This hypothesis is explained in detail in the next chapter but simply, substrates
which show a lower membrane affinity will fraction less to the membrane compartment in the lung.
This will lead to a higher concentration of drug in the aqueous compartment. Free drug in the
aqueous compartment is available for passive absorption via the paracellular pathway and as this is
more prevalent in the lung we would expect a higher level of absorption via this pathway for these
substrates than that of the intestine. The absorption of an increased proportion of the low-
membrane bound drugs via the paracellular pathway results in their avoidance of P-gp efflux and a
lower net effect of pulmonary P-gp up in their absorption from the lung.

151
Chapter 7
General Discussion

152
7. General Discussion
Previously in the thesis (chapter 4) it was demonstrated that the absorption of a panel of known P-
gp substrates showed discordance in the effects of P-gp upon their pulmonary absorption. A subset
(ten) of the substrates showed significantly higher extents of absorption from the lung in the P-gp
knockout mice, suggesting pulmonary P-gp acted to attenuate the absorption of these molecules
from the IPML. The remaining molecules (seven) were absorbed to a similar extent in both the wild
type and knockout mice, suggesting pulmonary P-gp does not affect their absorption.
By investigating the P-gp binding kinetics of the panel it was shown that the discordance seen in the
effects of pulmonary P-gp are not explained by differences in P-gp affinity between the two groups.
Previous studies, mainly in the intestine, have highlighted the importance in the relationship
between passive permeability and P-gp efflux.
P-gp substrates are mainly lipophilic or amphipathic molecules (1) and their absorption through the
intestine is therefore mainly transcellular. This is due to the route of uptake of a drug across a
biological barrier being determined by its physicochemical properties. Molecules which exhibit a
lower polarity (and subsequent increased lipophilicity) show high transcellular permeability due to
increased membrane affinity (197). The extent of partitioning in to membranes (and subsequent
transcellular diffusion) of these substrates has been shown to decrease with increases in H-bonding
potential and polarity (198).
The extent of membrane binding and transmembrane movement rate is an important determinants
in the net effect of P-gp on substrate absorption. As discussed in detail earlier in the thesis
molecules which show high passive permeability have been shown to have a lower net effect of P-gp
efflux (the mechanism behind this is discussed in chapter 5). This effect has been observed in both in
vitro cell lines and in the oral bioavailability of a range of molecules.
An early study by Lentz utilised the Caco-2 cell line to compare the efflux ratio observed in this cell
line with a molecules passive permeability (199). The group showed that the substrates with high
passive permeability across the barrier showed no efflux by P-gp with absorptive and secretory
transport rates being equal. A similar effect is observed using oral bioavailability data to show the
effect of P-gp on the intestinal absorption of its substrates. A study by Varma et al compared the
effects of P-gp in limiting oral absorption of a large set of substrates to their passive transport rates.

153
The results confirm those seen in the in vitro studies with substrates which possess high passive
absorption overcoming the effects of P-gp and showing no measurable efflux in the intestine.
In order to investigate whether a similar effect can describe the discordance seen within the
pulmonary effects of P-gp in the panel of substrates tested in the IPML we conducted investigations
in to the membrane affinity of these substrates. In order to accurately predict the affinity of the
substrates to a biological membrane we investigated the affinity of the substrates to multi lamellar
vesicles (MLVs) and an IAM column. As discussed in the introduction there is literature support that
both of these models predict plasma membrane interactions in a biological situation. As both models
measure the affinity of a molecule to phosphatidylcholine (an abundant phospholipid in
membranes) it is perhaps unsurprising that the data generated by both models is remarkably similar.
Both models show that when the membrane binding affinity of the substrate panel is compared, a
significant difference is observed between the membrane affinity of the substrates which show
pulmonary efflux and those which do not; the set of substrates which show positive efflux from the
lung show significantly higher membrane affinity in both the IAM and MLV experiments.
This data seems at odds with the previous literature where an increase in membrane affinity is
observed to decrease P-gp efflux. It is proposed that this difference in the relationship between P-gp
and passive permeability between the two barriers is due to differences in their physical properties,
and in particular the prevalence of the paracellular pathway in the lung which has been shown to be
more permeable than that of the intestine (173). As the membrane affinity of a molecule decreases
the fraction remaining in the aqueous absorption compartment will increase. This will in turn lead to
a greater availability of the molecule to absorption via the paracellular pathway, a route which
avoids P-gp mediated efflux.

154
Figure 6.4.1 Graphical representations of the effect of polarity upon the net effect of P-gp efflux observed at the intestinal and pulmonary barrier. [A] The currently accepted hypothesis with an increase in polarity leading to increased efflux. [B] The hypothesis suggested by the IPML absorption data where both extremes of polarity result in decreased efflux. The dashed line indicates an arbitrary level below which efflux is below the limit of quantification.
The hypothesis proposed here is represented in Figure 6.4.1B. We suggest that at low polarity (and
therefore high membrane affinity) the passive permeability of a molecule is almost exclusively by the
transcellular route. The substrate is therefore absorbed by a pathway that exposes it to P-gp. During
this process it is suggested the relationship between the passive permeability of a substrate and the
net effect of P-gp efflux is as described in the literature.
In addition to the current model it is now hypothesised that as polarity increases past a set point
(and membrane affinity decreases) the portion of the drug absorbed via the paracellular pathway
increases. As this pathway results in absorption of the drug without exposure to P-gp the result is a
decrease in the net effect of observable efflux.
In the intestine this process may be unimportant as the paracellular pathway is much tighter than
that of the lung. This will mean the polarity required for a significant fraction of the drug to be
absorbed via the paracellular route, and bypass P-gp, will be higher. This is likely to exclude P-gp
substrates from absorption via this route as they tend to be lipophilic molecules as discussed
previously.

155
The result of this prediction is a set of molecules with decreased membrane affinity which escape P-
gp efflux in the lung, the hatched area of figure 6.4.1B. We hypothesise that the substrates which
showed no effect of P-gp upon their pulmonary absorption lie in this chemical space.
The possible contribution of pulmonary P-gp to the absorption of substrates in the lung appears to
be defined by a more complicated physicochemical relationship than that observed in the intestine.
As a result P-gp is likely to attenuate the pulmonary absorption of only a subset of intestinal P-gp
substrates.
To quantify this the Abraham descriptors for the panel of substrates were established and showed
that the membrane binding differences are explained by significant differences in the hydrogen
bond acidity and basicity as well as the polarisability of the substrates. Using these descriptors we
challenged a database of the physicochemical properties of 131 known P-gp substrates. Of the 131
substrates 98 (75 %) were seen to possess the physicochemical properties which we have shown to
predict pulmonary efflux. If the same analysis is performed on only the currently approved inhaled
drugs (129) we show that 70% (7 of 10) would be predicted to show pulmonary efflux, this includes
salbutamol, salmeterol and indacaterol for which pulmonary efflux was shown experimentally earlier
in the thesis.

156
Chapter 8
Appendix

157
4.3.3 PK Analysis – F and K As illustrated in table 4.3.1 the absorption data for all IPML experiments was analysed using a single compartment model to identify values for the bioavailability (F) and rate of absorption (K). These pharmacokinetic parameters were then compared between wildtype and knockout mouse groups using an unpaired t-test to test for significant differences attributable to P-gp knockout. In all cases where the percentage absorbed at individual time points showed a significant difference a significant difference (p <0.05) was also observed in the calculation of bioavailability. The converse is also true with the substrates showing no difference in percentage absorbed at each time point also showing no significant difference in bioavailability. The same relationship is not reflected in the rates of absorption (K) with only one substrate, salbutamol, showing a significantly (p <0.05) increased absorption in the knockout mice. All other substrates show no significant difference in absorption rates despite an overall trend for higher rates in the knockout animals (on average molecules were absorbed 130% more rapidly from knockout mouse lungs). The lack of significance in the rates appears to be due to high variability in the early time points and in some instances the complete lack of early time points due to the concentrations present in the perfusate being below the level of detection for analysis.

158
Figure 8.1.1 Absorption profiles from the airways of the IPML in to perfusate for both the wild-type mdr1a/b (+/+) mice and the knockout mdr1a/b (-/-) mice for [A] acrivastine (n=4), [B] chloroquine (n=4), [C] colchicine (n=4), [D] digoxin (n=6), [E] domperidone (n=4) and [F] eletriptan (n=4). In all cases data is presented as the mean ± SD of the percentage of the lung deposited dose absorbed at distinct time points, * indicates a significant difference between the wild-type and knockout mice at that time point. Non-linear regression is performed using the equation described in chapter 4.

159
Figure 4.3.2 Absorption profiles from the airways of the IPML in to perfusate for both the wild-type mdr1a/b (+/+) mice and the knockout mdr1a/b (-/-) mice for [A] erythromycin (n=5), [B] GSK1 (n=5), [C] GSK2 (n=4), [D] GSK3 (2=6), [E] indacaterol (n=4) and [F] mitoxantrone (n=4). In all cases data is presented as the mean ± SD of the percentage of the lung deposited dose absorbed at distinct time points, * indicates a significant difference between the wild-type and knockout mice at that time point. Non-linear regression is performed using the equation described in chapter 4.

160
Figure 4.3.3 Absorption profiles from the airways of the IPML in to perfusate for both the wild-type mdr1a/b (+/+) mice and the knockout mdr1a/b (-/-) mice in [A] monensin (n=6), [B] puromycin (n=6), [C] rhodamine 123 (n=6), [D] salbutamol (n=4), [E] salmeterol (n=4) and [F] saquinavir (n=5). In all cases data is presented as the mean ± SD of the percentage of the lung deposited dose absorbed at distinct time points, * indicates a significant difference between the wild-type and knockout mice at that time point. Non-linear regression is performed using the equation described in chapter 4.

161
References

162
1. Aller SG, Yu J, Ward A, Weng Y, Chittaboina S, Zhuo R, et al. Structure of P-glycoprotein reveals a molecular basis for poly-specific drug binding. Science (80- ) [Internet]. 2009/03/28 ed. 2009;323(5922):1718–22.
2. Raub TJ. P-glycoprotein recognition of substrates and circumvention through rational drug design. Mol Pharm [Internet]. 2006;3(1):3–25.
3. Stouch TR, Gudmundsson O. Progress in understanding the structure-activity relationships of P-glycoprotein. Adv Drug Deliv Rev [Internet]. 2002/03/30 ed. 2002;54(3):315–28.
4. Pajeva IK, Wiese M. Pharmacophore model of drugs involved in P-glycoprotein multidrug resistance: explanation of structural variety (hypothesis). J Med Chem [Internet]. 2002/12/13 ed. 2002;45(26):5671–86.
5. Bleasby K, Castle JC, Roberts CJ, Cheng C, Bailey WJ, Sina JF, et al. Expression profiles of 50 xenobiotic transporter genes in humans and pre-clinical species: a resource for investigations into drug disposition. Xenobiotica [Internet]. 2006/11/23 ed. 2006;36(10-11):963–88.
6. Sakamoto A, Matsumaru T, Yamamura N, Uchida Y, Tachikawa M, Ohtsuki S, et al. Quantitative expression of human drug transporter proteins in lung tissues: analysis of regional, gender, and interindividual differences by liquid chromatography-tandem mass spectrometry. J Pharm Sci [Internet]. 2013;102:3395–406.
7. Sakamoto A, Matsumaru T, Yamamura N, Suzuki S, Uchida Y, Tachikawa M, et al. Drug Transporter Protein Quantification of Immortalized Human Lung Cell Lines Derived from Tracheobronchial Epithelial Cells (Calu-3 and BEAS2-B), Bronchiolar-Alveolar Cells (NCI-H292 and NCI-H441), and Alveolar Type II-like Cells (A549) by Liquid Chromat. J Pharm Sci [Internet]. 2015
8. Endter S, Francombe D, Ehrhardt C, Gumbleton M. RT-PCR analysis of ABC, SLC and SLCO drug transporters in human lung epithelial cell models. J Pharm Pharmacol [Internet]. 2009/05/02 ed. 2009;61(5):583–91.
9. Fetsch PA, Abati A, Litman T, Morisaki K, Honjo Y, Mittal K, et al. Localization of the ABCG2 mitoxantrone resistance-associated protein in normal tissues. Cancer Lett [Internet]. 2005/07/02 ed. 2006;235(1):84–92.
10. Scheffer GL, Pijnenborg a CLM, Smit EF, Müller M, Postma DS, Timens W, et al. Multidrug resistance related molecules in human and murine lung. J Clin Pathol [Internet]. 2002 May;55(5):332–9.
11. Langmann T, Mauerer R, Zahn A, Moehle C, Probst M, Stremmel W, et al. Real-Time Reverse Transcription-PCR Expression Profiling of the Complete Human ATP-Binding Cassette Transporter Superfamily in Various Tissues. 2003;238:230–8.
12. Flens MJ, Zaman GJ, van der Valk P, Izquierdo MA, Schroeijers AB, Scheffer GL, et al. Tissue distribution of the multidrug resistance protein. Am J Pathol [Internet]. 1996/04/01 ed. 1996;148(4):1237–47.

163
13. Brechot JM, Hurbain I, Fajac A, Daty N, Bernaudin JF. Different pattern of MRP localization in ciliated and basal cells from human bronchial epithelium. J Histochem Cytochem [Internet]. 1998/05/09 ed. 1998;46(4):513–7.
14. Lehmann T, Kohler C, Weidauer E, Taege C, Foth H. Expression of MRP1 and related transporters in human lung cells in culture. Toxicology [Internet]. 2001/09/15 ed. 2001;167(1):59–72.
15. Lips K, Volk C, Schmitt B, Pfeil U, Arndt P, Miska D, et al. Polyspecific cation transporters mediate luminal release of acetylcholine from bronchial epithelium. Am J Respir Cell Mol Biol. 2005;33:79–88.
16. Lips K, Luhrmann A, Tschernig T, Stoeger T, Alessandrini F, Grau V, et al. Down-regulation of the nonneuronal acetylcholine synthesis and release machinery in acute allergic airway inflammation of rat and mouse. Life Sci. 2007;80:2263–9.
17. Tamai I, Ohashi R, Nezu JI, Sai Y, Kobayashi D, Oku a, et al. Molecular and functional characterization of organic cation/carnitine transporter family in mice. J Biol Chem [Internet]. 2000 Dec 22 [cited 2012 Mar 16];275(51):40064–72.
18. Horvath G, Schmid N, Fragoso MA, Schmid A, Conner GE, Salathe M, et al. Epithelial organic cation transporters ensure pH-dependent drug absorption in the airway. Am J Respir Cell Mol Biol [Internet]. 2006/08/19 ed. 2007;36(1):53–60.
19. Kummer W, Wiegand S, Akinci S, Schinkel AH, Wess J, Koepsell H, et al. Role of acetylcholine and muscarinic receptors in serotonin-induced bronchoconstriction in the mouse. J Mol Neurosci [Internet]. 2006/12/29 ed. 2006;30(1-2):67–8.
20. Bosquillon C. Drug transporters in the lung--do they play a role in the biopharmaceutics of inhaled drugs? J Pharm Sci [Internet]. 2009/12/02 ed. 2010;99(5):2240–55.
21. Tamai I, Nezu J, Uchino H, Sai Y, Oku a, Shimane M, et al. Molecular identification and characterization of novel members of the human organic anion transporter (OATP) family. Biochem Biophys Res Commun [Internet]. 2000 Jun 24;273(1):251–60.
22. Francombe D, Taylor G, Taylor S, Somers G, Edwards C, Gumbleton M. Functional role of P-gp efflux in limiting pulmonary drug absorption within an intact lung: application of an isolated perfused rat lung model. Proc Resp Drug Deliv 2008. 2008:461–4.
23. Manford F, Riffo-Vasquez Y, Spina D, Page CP, Hutt AJ, Moore V, et al. Lack of difference in pulmonary absorption of digoxin, a P-glycoprotein substrate, in mdr1a-deficient and mdr1a-competent mice. J Pharm Pharmacol [Internet]. 2008/09/25 ed. 2008;60(10):1305–10.
24. Madlova M, Bosquillon C, Asker D, Dolezal P, Forbes B. In-vitro respiratory drug absorption models possess nominal functional P-glycoprotein activity. J Pharm Pharmacol [Internet]. 2009/02/19 ed. 2009;61(3):293–301.
25. Gumbleton M, Al-Jayyoussi G, Crandon-Lewis A, Francombe D, Kreitmeyr K, Morris CJ, et al. Spatial expression and functionality of drug transporters in the intact lung: objectives for further research. Adv Drug Deliv Rev [Internet]. 2010/09/28 ed. 2011;63(1-2):110–8.

164
26. Eytan GD. Mechanism of multidrug resistance in relation to passive membrane permeation. Biomed Pharmacother [Internet]. 2005/03/30 ed. 2005;59(3):90–7.
27. Knowlton FP, Starling E. The influence of variations in temperature and bloodpressure on the performance of the isolated mammalian heart. J Physiol. 1912;44(3):206–19.
28. Newell M. The Direct Influence of Gradual Variations of Temperature upon the Rate of Beat of the Dog’s Heart. Philos Trans R Soc London. 1883;174.
29. Delaunois A. Improvements in an isolated perfused lung technique. Arch Int Pharmacodyn Ther. 1956;107(1):90–2.
30. Ryrfeldt A, Nilsson E. Uptake and biotransformation of ibuterol and terbutaline in isolated perfused rat and guinea pig lungs. Biochem Pharmacol [Internet]. 1978 Feb 1;27(3):301–5.
31. Ryrfeldt A, Persson G, Nilsson E. Pulmonary disposition of the potent glucocorticoid budesonide, evaluated in an isolated perfused rat lung model. Biochem Pharmacol. 1989;38(1):17–22.
32. Byron PR, Niven RW. A novel dosing method for drug administration to the airways of the isolated perfused rat lung. J Pharm Sci. 1988;77(8):693–5.
33. Byron PR, Roberts NS, Clark AR. An isolated perfused rat lung preparation for the study of aerosolized drug deposition and absorption. J Pharm Sci. 1986;75(2):168–71.
34. Niven RW, Byron PR. Solute absorption from the airways of the isolated rat lung. I. The use of absorption data to quantify drug dissolution or release in the respiratory tract. Pharm Res. 1988;5(9):574–9.
35. Byron PR. Solute absorption from the airways of the isolated rat lung. IV. Mechanisms of absorption of fluorophore-labeled poly-alpha,beta-[N(2-hydroxyethyl)-DLaspartamide]. Pharm Res. 1994;11(2):221–5.
36. Byron PR. Solute absorption from the airways of the isolated rat lung. II. Effect of surfactants on absorption of fluorescein. Pharm Res. 1990;7(1):8–13.
37. Niven R, Rypacek F, Byron PR. Solute absorption from the airways of the isolated rat lung. III. Absorption of several peptidase-resistant, synthetic polypeptides: poly-(2- hydroxyethyl)-aspartamides. Pharm Res. 1990;7(10):990–4.
38. Tronde A, Norden B, Jeppsson AB, Brunmark P, Nilsson E, Lennernas H, et al. Drug absorption from the isolated perfused rat lung--correlations with drug physicochemical properties and epithelial permeability. J Drug Target [Internet]. 2003/07/11 ed. 2003;11(1):61–74.
39. Keserü B, Barbosa-Sicard E, Popp R, Fisslthaler B, Dietrich A, Gudermann T, et al. Epoxyeicosatrienoic acids and the soluble epoxide hydrolase are determinants of pulmonary artery pressure and the acute hypoxic pulmonary vasoconstrictor response. FASEB J. 2008;22(12):4306–15.
40. Fuchs B, Rupp M, Ghofrani HA, Schermuly RT, Seeger W, Grimminger F, et al. Diacylglycerol regulates acute hypoxic pulmonary vasoconstriction via TRPC6. Respir Res. 2011;12:20.

165
41. Yoo HY, Zeifman A, Ko EA, Smith KA, Chen J, Machado RF, et al. Optimization of isolated perfused/ventilated mouse lung to study hypoxic pulmonary vasoconstriction. Pulm Circ [Internet]. 2013;3:396–405.
42. Roth M, Rupp M, Hofmann S, Mittal M, Fuchs B, Sommer N, et al. Heme oxygenase-2 and large-conductance Ca2+-activated K + channels: Lung vascular effects of hypoxia. Am J Respir Crit Care Med. 2009;180(4):353–64.
43. Bernal PJ, Leelavanichkul K, Bauer E, Cao R, Wilson A, Wasserloos KJ, et al. Nitric Oxide-Mediated Zinc release Contributes to Hypoxic regulation of pulmonary vascular tone. Circ Res. 2008;102(12):1575–83.
44. Patton JS, Byron PR. Inhaling medicines: delivering drugs to the body through the lungs. Nat Rev Drug Discov [Internet]. 2007 Jan [cited 2012 Mar 16];6(1):67–74.
45. Empey DW. Diseases of the respiratory system. Introduction: structure and function of the lungs. Br Med J. 1978;1(6113):631–3.
46. Stone KC, Mercer RR, Gehr P, Stockstill B, Crapo JD. Allometric relationships of cell numbers and size in the mammalian lung. Am J Respir Cell Mol Biol [Internet]. 1992 Feb;6(2):235–43.
47. Plopper CG. Structure and function of the lung. In: Respiratory system. Jones TC, Dungworth, D. L., and Mohr, U. E, editors. Berlin, Sprinter Verlag; 1996. 135-150.
48. Patton S. Mechanisms of macromolecule absorption by the lungs. Adv Drug Deliv Rev. 1996;19(95):3–36.
49. Crapo JD, Barry BE, Gehr P, Bachofen M, Weibel ER. Cell number and cell characteristics of the normal human lung. Am Rev Respir Dis [Internet]. 1982/08/01 ed. 1982;126(2):332–7.
50. Hedrich H. The Laboratory Mouse (Handbook of Experimental Animals). Hedrich H, editor. Elsevier Academic Press, New York; 2012.
51. James F, Stephen W B, Muriel T D, Newcomer CE, Quimby FW, Smith AL, editors. The Mouse in Biomedical Research, Volume III: Normative Biology, Husbandry, and Models. Second. American College of Laboratory Animal Medicine; 2007.
52. Harkness JE, Turner P V, VandeWoude S, Wheler CL, editors. Biology and Medicine of Rabbits and Rodents. Wiley-Blackwell; 2010.
53. VERLOOP MC. On the arteriae bronchiales and their anastomosing with the arteria pulmonalis in some rodents; a micro-anatomical study. Acta Anat (Basel). 1949;7(1-2):1–32.
54. Staub NC. Basic Respiratory Physiology. Staub NC, editor. Churchill Livingstone Inc, New York; 1991.
55. Chediak AD, Wanner A. The circulation of the airways: anatomy, physiology and potential role in drug delivery to the respiratory tract. Adv Drug Deliv Rev. 1990;5(1-2):11–8.
56. Kröll F, Karlsson JA, Persson CG. Tracheobronchial microvessels perfused via the pulmonary artery in guinea-pig isolated lungs. Acta Physiol Scand. 1987;129(3):445–6.

166
57. Hartley CJ, Michael LH, Entman ML. Noninvasive measurement of ascending aortic blood velocity in mice. Am J Physiol. 1995;268(1 Pt 2):H499–505.
58. Mehendale HM, Angevine LS, Ohmiya Y. The isolated perfused lung--a critical evaluation. Toxicology. 1981;21(1):1–36.
59. Tronde A. The Isolated Perfused Lung for Drug Absorption Studies. 2007. Thesis.
60. Joucher F, Mazmanian G-M, German-Fattal M. Endothelial cell early activation induced by allogeneic lymphocytes in isolated perfused mouse lung. Transplantation. 2002;74(10):1461–9.
61. Joucher F, Mazmanian G-M, German-Fattal M. E-selectin early overexpression induced by allogeneic activation in isolated mouse lung. Transplantation. 2004;78(9):1283–9.
62. Von Bethmann AN, Brasch F, Nusing R, Vogt K, Volk HD, Muller KM, et al. Hyperventilation induces release of cytokines from perfused mouse lung. Am J Respir Crit Care Med [Internet]. 1998/01/28 ed. 1998;157(1):263–72.
63. Held HD, Uhlig S. Mechanisms of endotoxin-induced airway and pulmonary vascular hyperreactivity in mice. Am J Respir Crit Care Med. 2000;162(4 I):1547–52.
64. Sabbagh F, Lecerf F, Maurois P, Bac P, German-Fattal M. Allogeneic activation is attenuated in a model of mouse lung perfused with magnesium-deficient blood. Transpl Immunol. 2006;16(3-4):200–7.
65. Zhao M, Fernandez LG, Doctor A, Sharma AK, Zarbock A, Tribble CG, et al. Alveolar macrophage activation is a key initiation signal for acute lung ischemia-reperfusion injury. Am J Physiol Lung Cell Mol Physiol. 2006;291(5):L1018–26.
66. Institutional Animal Care and Use Committee: Biomethodology of the rat. University of Iowa;
67. Kanekal S, Plopper C, Morin D, Buckpitt A. Metabolism and cytotoxicity of naphthalene oxide in the isolated perfused mouse lung. J Pharmacol Exp Ther [Internet]. 1991 Jan; 256(1):391–401.
68. Sakagami M, Byron PR, Venitz J, Rypacek F. Solute disposition in the rat lung in vivo and in vitro: determining regional absorption kinetics in the presence of mucociliary escalator. J Pharm Sci [Internet]. 2002 Feb;91(2):594–604.
69. Cryan S-A, Sivadas N, Garcia-Contreras L. In vivo animal models for drug delivery across the lung mucosal barrier. Adv Drug Deliv Rev. 2007;59(11):1133–51.
70. Ravnic DJ, Konerding MA, Pratt JP, Wolloscheck T, Huss HT, Mentzer SJ. The murine bronchopulmonary microcirculation in hapten-induced inflammation. J Thorac Cardiovasc Surg. 2007;133(1):97–103.
71. Al-jayyoussi G, Price DF, Francombe D, Taylor G, Smith MW, Morris C, et al. Selectivity in the Impact of P-Glycoprotein Upon Pulmonary Absorption of Airway-Dosed Substrates : A Study in Ex Vivo Lung Models Using Chemical Inhibition and Genetic Knockout. 2013;1–13.

167
72. Francombe D, Taylor G, Taylor S SG, Edwards C GM. Functional role of P-gp efflux in limiting pulmonary drug absorption within an intact lung: Application of an isolated perfused rat lung model. Proc Resp Drug Deliv. 2008;2:461–4.
73. Roerig DL, Audi SH, Ahlf SB. Kinetic characterization of P-glycoprotein-mediated efflux of rhodamine 6G in the intact rabbit lung. Drug Metab Dispos [Internet]. 2004/08/21 ed. 2004;32(9):953–8.
74. Ejendal KF, Hrycyna CA. Differential sensitivities of the human ATP-binding cassette transporters ABCG2 and P-glycoprotein to cyclosporin A. Mol Pharmacol [Internet]. 2004/12/16 ed. 2005;67(3):902–11.
75. Annaert PP, Turncliff RZ, Booth CL, Thakker DR, Brouwer KL. P-glycoprotein-mediated in vitro biliary excretion in sandwich-cultured rat hepatocytes. Drug Metab Dispos [Internet]. 2001/09/19 ed. 2001;29(10):1277–83.
76. Mistry P, Stewart AJ, Dangerfield W, Okiji S, Liddle C, Bootle D, et al. In vitro and in vivo reversal of P-glycoprotein-mediated multidrug resistance by a novel potent modulator, XR9576. Cancer Res [Internet]. 2001/02/24 ed. 2001;61(2):749–58.
77. Huisman MT, Smit JW, Wiltshire HR, Beijnen JH, Schinkel AH. Assessing safety and efficacy of directed P-glycoprotein inhibition to improve the pharmacokinetic properties of saquinavir coadministered with ritonavir. J Pharmacol Exp Ther [Internet]. 2003/01/23 ed. 2003;304(2):596–602.
78. Letrent SP, Pollack GM, Brouwer KR, Brouwer KL. Effects of a potent and specific P-glycoprotein inhibitor on the blood-brain barrier distribution and antinociceptive effect of morphine in the rat. Drug Metab Dispos [Internet]. 1999/06/29 ed. 1999;27(7):827–34.
79. Kemper EM, van Zandbergen AE, Cleypool C, Mos HA, Boogerd W, Beijnen JH, et al. Increased penetration of paclitaxel into the brain by inhibition of P-Glycoprotein. Clin Cancer Res [Internet]. 2003/07/12 ed. 2003;9(7):2849–55.
80. Pichler A, Prior JL, Piwnica-Worms D. Imaging reversal of multidrug resistance in living mice with bioluminescence: MDR1 P-glycoprotein transports coelenterazine. Proc Natl Acad Sci U S A [Internet]. 2004/02/03 ed. 2004;101(6):1702–7.
81. Rautio J, Humphreys JE, Webster LO, Balakrishnan A, Keogh JP, Kunta JR, et al. In vitro p-glycoprotein inhibition assays for assessment of clinical drug interaction potential of new drug candidates: a recommendation for probe substrates. Drug Metab Dispos [Internet]. 2006/02/04 ed. 2006;34(5):786–92.
82. Rao V V, Dahlheimer JL, Bardgett ME, Snyder AZ, Finch RA, Sartorelli AC, et al. Choroid plexus epithelial expression of MDR1 P glycoprotein and multidrug resistance-associated protein contribute to the blood-cerebrospinal-fluid drug-permeability barrier. Proc Natl Acad Sci U S A [Internet]. 1999/03/31 ed. 1999;96(7):3900–5.
83. Tannergren C, Petri N, Knutson L, Hedeland M, Bondesson U, Lennernas H. Multiple transport mechanisms involved in the intestinal absorption and first-pass extraction of fexofenadine. Clin Pharmacol Ther [Internet]. 2003/10/31 ed. 2003;74(5):423–36.

168
84. Williams GC, Liu A, Knipp G, Sinko PJ. Direct evidence that saquinavir is transported by multidrug resistance-associated protein (MRP1) and canalicular multispecific organic anion transporter (MRP2). Antimicrob Agents Chemother [Internet]. 2002/10/18 ed. 2002;46(11):3456–62.
85. Polli JW, Jarrett JL, Studenberg SD, Humphreys JE, Dennis SW, Brouwer KR, et al. Role of P-glycoprotein on the CNS disposition of amprenavir (141W94), an HIV protease inhibitor. Pharm Res [Internet]. 1999/09/01 ed. 1999;16(8):1206–12.
86. Francombe D, Hons BS. Examining the Functional Role of Transporters in Modulating Drug Absorption across Lung Epithelium . 2011;(June).
87. Patton JS, Fishburn CS, Weers JG. The lungs as a portal of entry for systemic drug delivery. Proc Am Thorac Soc [Internet]. 2004 Jan [cited 2012 Jul 23];1(4):338–44.
88. Fisher A. The Isolated Perfused Lung, in Handbook of experimental pharmacology. Witschi H., editor. Springer Berlin / Heidelberg; 1985. 149-179.
89. Czartolomna J, Voelkel NF, Chang SW. Permeability characteristics of isolated perfused rat lungs. J Appl Physiol. 1991;70(4):1854–60.
90. Sakagami M, Byron PR, Rypacek F. Biochemical evidence for transcytotic absorption of polyaspartamide from the rat lung: Effects of temperature and metabolic inhibitors. J Pharm Sci. 2002;91(9):1958–68.
91. Ingbar A. Measurement of Lung Water, in Pulmonary Edema (Lung Biology in Health and Disease). Informa Healthcare; 1998. 638.
92. Reinoso RF, Telfer BA, Rowland M. Tissue water content in rats measured by desiccation. J Pharmacol Toxicol Methods. 1997;38(2):87–92.
93. Schinkel AH, Mayer U, Wagenaar E, Mol CA, van Deemter L, Smit JJ, et al. Normal viability and altered pharmacokinetics in mice lacking mdr1-type (drug-transporting) P-glycoproteins. Proc Natl Acad Sci U S A [Internet]. 1997/04/15 ed. 1997;94(8):4028–33. 94. Lankas GR, Cartwright ME, Umbenhauer D. P-glycoprotein deficiency in a subpopulation of CF-1 mice enhances avermectin-induced neurotoxicity. Toxicol Appl Pharmacol [Internet]. 1997/04/01 ed. 1997;143(2):357–65.
95. Umbenhauer DR, Lankas GR, Pippert TR, Wise LD, Cartwright ME, Hall SJ, et al. Identification of a P-glycoprotein-deficient subpopulation in the CF-1 mouse strain using a restriction fragment length polymorphism. Toxicol Appl Pharmacol [Internet]. 1997/09/23 ed. 1997;146(1):88–94.
96. Schinkel AH, Smit JJ, van Tellingen O, Beijnen JH, Wagenaar E, van Deemter L, et al. Disruption of the mouse mdr1a P-glycoprotein gene leads to a deficiency in the blood-brain barrier and to increased sensitivity to drugs. Cell [Internet]. 1994/05/20 ed. 1994;77(4):491–502.
97. Kwei GY, Alvaro RF, Chen Q, Jenkins HJ, Hop CE, Keohane CA, et al. Disposition of ivermectin and cyclosporin A in CF-1 mice deficient in mdr1a P-glycoprotein. Drug Metab Dispos [Internet]. 1999/04/30 ed. 1999;27(5):581–7.

169
98. Van Asperen J, Schinkel AH, Beijnen JH, Nooijen WJ, Borst P, van Tellingen O. Altered pharmacokinetics of vinblastine in Mdr1a P-glycoprotein-deficient Mice. J Natl Cancer Inst [Internet]. 1996/07/17 ed. 1996;88(14):994–9.
99. Lagas JS, Sparidans RW, van Waterschoot RA, Wagenaar E, Beijnen JH, Schinkel AH. P-glycoprotein limits oral availability, brain penetration, and toxicity of an anionic drug, the antibiotic salinomycin. Antimicrob Agents Chemother [Internet]. 2008/01/16 ed. 2008;52(3):1034–9.
100. Huisman MT, Smit JW, Wiltshire HR, Hoetelmans RM, Beijnen JH, Schinkel AH. P-glycoprotein limits oral availability, brain, and fetal penetration of saquinavir even with high doses of ritonavir. Mol Pharmacol [Internet]. 2001/03/22 ed. 2001;59(4):806–13.
101. Mayer U, Wagenaar E, Beijnen JH, Smit JW, Meijer DK, van Asperen J, et al. Substantial excretion of digoxin via the intestinal mucosa and prevention of long-term digoxin accumulation in the brain by the mdr 1a P-glycoprotein. Br J Pharmacol [Internet]. 1996/11/01 ed. 1996;119(5):1038–44.
102. De Lange EC, de Bock G, Schinkel AH, de Boer AG, Breimer DD. BBB transport and P-glycoprotein functionality using MDR1A (-/-) and wild-type mice. Total brain versus microdialysis concentration profiles of rhodamine-123. Pharm Res [Internet]. 1998/12/02 ed. 1998;15(11):1657–65.
103. Jonker JW, Wagenaar E, van Deemter L, Gottschlich R, Bender HM, Dasenbrock J, et al. Role of blood-brain barrier P-glycoprotein in limiting brain accumulation and sedative side-effects of asimadoline, a peripherally acting analgaesic drug. Br J Pharmacol [Internet]. 1999/06/16 ed. 1999;127(1):43–50.
104. Van Asperen J, van Tellingen O, Tijssen F, Schinkel AH, Beijnen JH. Increased accumulation of doxorubicin and doxorubicinol in cardiac tissue of mice lacking mdr1a P-glycoprotein. Br J Cancer [Internet]. 1999/07/17 ed. 1999;79(1):108–13.
105. Sparreboom A, van Asperen J, Mayer U, Schinkel AH, Smit JW, Meijer DK, et al. Limited oral bioavailability and active epithelial excretion of paclitaxel (Taxol) caused by P-glycoprotein in the intestine. Proc Natl Acad Sci U S A [Internet]. 1997/03/04 ed. 1997;94(5):2031–5.
106. Smit JJ, Schinkel AH, Oude Elferink RP, Groen AK, Wagenaar E, van Deemter L, et al. Homozygous disruption of the murine mdr2 P-glycoprotein gene leads to a complete absence of phospholipid from bile and to liver disease. Cell [Internet]. 1993/11/05 ed. 1993;75(3):451–62.
107. OligoCalc [Internet]. Northwestern University Feinberg. 2013.
108. Fromm MF, Kim RB, Stein CM, Wilkinson GR, Roden DM. Inhibition of P-glycoprotein-mediated drug transport: A unifying mechanism to explain the interaction between digoxin and quinidine [seecomments]. Circulation [Internet]. 1999/02/02 ed. 1999;99(4):552–7.
109. Brady JM, Cherrington NJ, Hartley DP, Buist SC, Li N, Klaassen CD. Tissue distribution and chemical induction of multiple drug resistance genes in rats. Drug Metab Dispos [Internet]. 2002/06/18 ed. 2002;30(7):838–44.

170
110. Campbell L, Abulrob AN, Kandalaft LE, Plummer S, Hollins AJ, Gibbs A, et al. Constitutive expression of p-glycoprotein in normal lung alveolar epithelium and functionality in primary alveolar epithelial cultures. J Pharmacol Exp Ther [Internet]. 2002/12/20 ed. 2003;304(1):441–52.
111. Cordon-Cardo C, O’Brien JP, Boccia J, Casals D, Bertino JR, Melamed MR. Expression of the multidrug resistance gene product (P-glycoprotein) in human normal and tumor tissues. J Histochem Cytochem [Internet]. 1990/09/01 ed. 1990;38(9):1277–87.
112. Valk P Van Der, Kalken CK Van, Ketelaars H, Broxterman HJ, Scheffer G, Kuiper CM, et al. Distribution of multi-drug resistance-associated P-glycoprotein in normal and neoplastic human tissues Analysis with 3 monoclonal antibodies recognizing different epitopes of the P-glycoprotein molecule. 1990;56–64.
113. Lechapt-Zalcman E, Hurbain I, Lacave R, Commo F, Urban T, Antoine M, et al. MDR1-Pgp 170 expression in human bronchus. Eur Respir J [Internet]. 1997/08/01 ed. 1997;10(8):1837–43.
114. Scheffer GL, Pijnenborg AC, Smit EF, Muller M, Postma DS, Timens W, et al. Multidrug resistance related molecules in human and murine lung. J Clin Pathol [Internet]. 2002/05/03 ed. 2002;55(5):332–9.
115. Endter S, Becker U, Daum N, Huwer H, Lehr CM, Gumbleton M, et al. P-glycoprotein (MDR1) functional activity in human alveolar epithelial cell monolayers. Cell Tissue Res [Internet]. 2006/12/14 ed. 2007;328(1):77–84.
116. Brillault J, De Castro W V, Harnois T, Kitzis A, Olivier JC, Couet W. P-glycoprotein-mediated transport of moxifloxacin in a Calu-3 lung epithelial cell model. Antimicrob Agents Chemother [Internet]. 2009/02/04 ed. 2009;53(4):1457–62.
117. Ehrhardt C, Kneuer C, Laue M, Schaefer UF, Kim KJ, Lehr CM. 16HBE14o- human bronchial epithelial cell layers express P-glycoprotein, lung resistance-related protein, and caveolin-1. Pharm Res [Internet]. 2003/05/13 ed. 2003;20(4):545–51.
118. Kuhlmann O, Hofmann HS, Muller SP, Weiss M. Pharmacokinetics of idarubicin in the isolated perfused rat lung: effect of cinchonine and rutin. Anticancer Drugs [Internet]. 2003/07/11 ed. 2003;14(6):411–6.
119. Sakagami M. In vivo, in vitro and ex vivo models to assess pulmonary absorption and disposition of inhaled therapeutics for systemic delivery. Adv Drug Deliv Rev [Internet]. 2006 Oct 31 [cited 2013 Apr 6];58(9-10):1030–60.
120. Icard P, Saumon G. Alveolar sodium and liquid transport in mice. Am J Physiol [Internet]. 1999 Dec;277(6 Pt 1):L1232–8.
121. Loetchutinat C, Saengkhae C, Marbeuf-Gueye C, Garnier-Suillerot A. New insights into the P-glycoprotein-mediated effluxes of rhodamines. Eur J Biochem [Internet]. 2003/01/25 ed. 2003;270(3):476–85.
122. Shapiro AB, Ling V. Positively cooperative sites for drug transport by P-glycoprotein with distinct drug specificities. Eur J Biochem [Internet]. 1998/02/07 ed. 1997;250(1):130–7.

171
123. Research, F.a.D.A.C.f.D.E.a. Guidance for Industry: Bioanalytical Method Validation. Drug Inf Branch Rockville, MD. :25.
124. Juliano RL, Ling V. A surface glycoprotein modulating drug permeability in Chinese hamster ovary cell mutants. Biochim Biophys Acta [Internet]. 1976/11/11 ed. 1976;455(1):152–62.
125. Schinkel AH, Wagenaar E, van Deemter L, Mol CA, Borst P. Absence of the mdr1a P-Glycoprotein in mice affects tissue distribution and pharmacokinetics of dexamethasone, digoxin, and cyclosporin A. J Clin Invest [Internet]. 1995/10/01 ed. 1995;96(4):1698–705.
126. Thiebaut F, Tsuruo T, Hamada H, Gottesman MM, Pastan I, Willingham MC. Immunohistochemical localization in normal tissues of different epitopes in the multidrug transport protein P170: evidence for localization in brain capillaries and crossreactivity of one antibody with a muscle protein. J Histochem Cytochem [Internet]. 1989/02/01 ed. 1989;37(2):159–64.
127. Hamilton KO, Topp E, Makagiansar I, Siahaan T, Yazdanian M, Audus KL. Multidrug resistance-associated protein-1 functional activity in Calu-3 cells. J Pharmacol Exp Ther [Internet]. 2001/08/16 ed. 2001;298(3):1199–205.
128. Schuetz EG, Umbenhauer DR, Yasuda K, Brimer C, Nguyen L, Relling M V, et al. Altered expression of hepatic cytochromes P-450 in mice deficient in one or more mdr1 genes. Mol Pharmacol [Internet]. 2000/01/05 ed. 2000;57(1):188–97.
129. Committee JF. British National Formulary. BMJ Gr Pharm Press. 2008;
130. Varma M V, Sateesh K, Panchagnula R. Functional role of P-glycoprotein in limiting intestinal absorption of drugs: contribution of passive permeability to P-glycoprotein mediated efflux transport. Mol Pharm [Internet]. 2005/04/05 ed. 2005;2(1):12–21.
131. Valenzuela B, Nácher A, Casabó VG, Martín-Villodre A. The influence of active secretion processes on intestinal absorption of salbutamol in the rat. Eur J Pharm Biopharm [Internet]. 2001 Jul [cited 2012 Dec 4];52(1):31–7.
132. Valenzuela B, Nacher A, Ruiz-Carretero P, Martin-Villodre A, Lopez-Carballo G, Barettino D. Profile of P-glycoprotein distribution in the rat and its possible influence on the salbutamol intestinal absorption process. J Pharm Sci [Internet]. 2004/05/05 ed. 2004;93(6):1641–8.
133. Chang C, Bahadduri PM, Polli JE, Swaan PW, Ekins S. Rapid identification of P-glycoprotein substrates and inhibitors. Drug Metab Dispos [Internet]. 2006/09/26 ed. 2006;34(12):1976–84.
134. Hochhaus G, Möllmann H. Pharmacokinetic/pharmacodynamic characteristics of the beta-2-agonists terbutaline, salbutamol and fenoterol. Int J Clin Pharmacol Ther Toxicol. 1992;30(9):342–62.
135. Valenzuela B, Lopez-Pintor E, Perez-Ruixo JJ, Nacher A, Martin-Villodre A, Casabo VG. Modelling intestinal absorption of salbutamol sulphate in rats. Int J Pharm [Internet]. 2006/04/01 ed. 2006;314(1):21–30.

172
136. Anderson PJ, Zhou X, Breen P, Gann L, Logsdon TW, Compadre CM, et al. Pharmacokinetics of (R,S)-albuterol after aerosol inhalation in healthy adult volunteers. J Pharm Sci. 1998;87(7):841–4.
137. Borgström L. The pharmacokinetics of inhaled hydrofluoroalkane formulations. J Allergy Clin Immunol. 1999;104(6):S246–9.
138. Nolting A, Sista S, Abramowitz W. Single-dose study to compare the pharmacokinetics of HFA flunisolide and CFC flunisolide. J Pharm Sci. 2002;91(2):424–32.
139. Crim C, Pierre LN, Daley-Yates PT. A review of the pharmacology and pharmacokinetics of inhaled fluticasone propionate and mometasone furoate. Clinical Therapeutics. 2001. p. 1339–54.
140. Winkler J, Hochhaus G, Derendorf H. How the lung handles drugs: pharmacokinetics and pharmacodynamics of inhaled corticosteroids. Proc Am Thorac Soc [Internet]. 2004 Jan [cited 2012 Apr 27];1(4):356–63.
141. Miller-Larsson A, Mattsson H, Hjertberg E, Dahlbäck M, Tunek A, Brattsand R. Reversible fatty acid conjugation of budesonide: Novel mechanism for prolonged retention of topically applied steroid in airway tissue. Drug Metab Dispos. 1998;26(7):623–30.
142. Allen DB, Bielory L, Derendorf H, Dluhy R, Colice GL, Szefler SJ. Inhaled corticosteroids: past lessons and future issues. J Allergy Clin Immunol. 2003;112(3 Suppl):S1–40.
143. Wieslander E, Delander EL, Järkelid L, Hjertberg E, Tunek A, Brattsand R. Pharmacologic importance of the reversible fatty acid conjugation of budesonide studied in a rat cell line in vitro. Am J Respir Cell Mol Biol. 1998;19(3):477–84.
144. Andes D, Craig W a. Pharmacodynamics of a new streptogramin, XRP 2868, in murine thigh and lung infection models. Antimicrob Agents Chemother. 2006;50(1):243–9.
145. Dudhani R V., Turnidge JD, Coulthard K, Milne RW, Rayner CR, Li J, et al. Elucidation of the pharmacokinetic/pharmacodynamic determinant of colistin activity against Pseudomonas aeruginosa in murine thigh and lung infection models. Antimicrob Agents Chemother. 2010;54(3):1117–24.
146. Wiederhold NP, Tam VH, Chi J, Prince RA, Kontoyiannis DP, Lewis RE. Pharmacodynamic activity of amphotericin B deoxycholate is associated with peak plasma concentrations in a neutropenic murine model of invasive pulmonary aspergillosis. Antimicrob Agents Chemother. 2006;50(2):469–73.
147. Schmidt EW. Pharmacokinetics of beta2-sympathomimetics at the example of fenoterol and conclusion for the administration. Wiadomosci lekarskie (Warsaw, Poland : 1960). 1998.
148. Eytan GD, Regev R, Oren G, Hurwitz CD, Assaraf YG. Efficiency of P-glycoprotein-mediated exclusion of rhodamine dyes from multidrug-resistant cells is determined by their passive transmembrane movement rate. Eur J Biochem [Internet]. 1997/08/15 ed. 1997;248(1):104–12.

173
149. Yamamoto A, Iseki T, Ochi-sugiyama M, Okada N, Fujita T, Muranishi S. Absorption of water-soluble compounds with different molecular weights and [ Asu 1 . 7 ] -eel calcitonin from various mucosal administration sites. 2001;76:363–74.
150. Varma M V, Panchagnula R. Prediction of in vivo intestinal absorption enhancement on P-glycoprotein inhibition, from rat in situ permeability. J Pharm Sci [Internet]. 2005/06/30 ed. 2005;94(8):1694–704.
151. Thiebaut F, Tsuruo T, Hamada H, Gottesman MM, Pastan I, Willingham M. Cellular localization of the multidrug-resistance gene product P-glycoprotein in normal human tissues. Proc Natl Acad Sci U S A. 1987;84:7735–8.
152. Hunter J, Jepson MA, Tsuruo T, Simmons NL, Hirst BH. Functional expression of P-glycoprotein in apical membranes of human intestinal Caco-2 cells. Kinetics of vinblastine secretion and interaction with modulators. J Biol Chem [Internet]. 1993/07/15 ed. 1993;268(20):14991–7. Available from: http://www.ncbi.nlm.nih.gov/entrez/query.fcgi?cmd=Retrieve&db=PubMed&dopt=Citation&list_uids=8100817
153. Fricker G, Drewe J, Huwyler J, Gutmann H, Beglinger C. Relevance of p-glycoprotein for the enteral absorption of cyclosporin A: in vitro-in vivo correlation. Br J Pharmacol [Internet]. 1996/08/01 ed. 1996;118(7):1841–7.
154. Englund G, Rorsman F, Rönnblom A, Karlbom U, Lazorova L, Gråsjö J, et al. Regional levels of drug transporters along the human intestinal tract: Co-expression of ABC and SLC transporters and comparison with Caco-2 cells. Eur J Pharm Sci. 2006;29(3-4 SPEC. ISS.):269–77.
155. Berggren S, Gall C, Wollnitz N, Ekelund M, Karlbom U, Hoogstraate J, et al. Gene and protein expression of P-glycoprotein, MRP1, MRP2, and CYP3A4 in the small and large human intestine. Mol Pharm [Internet]. 2007/02/01 ed. 2007;4(2):252–7.
156. Zimmermann C, Gutmann H, Hruz P, Gutzwiller JP, Beglinger C, Drewe J. Mapping of multidrug resistance gene 1 and multidrug resistance-associated protein isoform 1 to 5 mRNA expression along the human intestinal tract. Drug Metab Dispos [Internet]. 2004/11/04 ed. 2005;33(2):219–24.
157. Taipalensuu J, Tornblom H, Lindberg G, Einarsson C, Sjoqvist F, Melhus H, et al. Correlation of gene expression of ten drug efflux proteins of the ATP-binding cassette transporter family in normal human jejunum and in human intestinal epithelial Caco-2 cell monolayers. J Pharmacol Exp Ther [Internet]. 2001/09/19 ed. 2001;299(1):164–70.
158. Mouly S, Paine MF. P-glycoprotein increases from proximal to distal regions of human small intestine. Pharm Res [Internet]. 2003/11/19 ed. 2003;20(10):1595–9.
159. MacLean C, Moenning U, Reichel A, Fricker G. Closing the gaps: A full scan of the intestinal expression of P-glycoprotein, breast cancer resistance protein, and multidrug resistance-associated protein 2 in male and female rats. Drug Metab Dispos. 2008;36(7):1249–54.

174
160. Tamura S, Tokunaga Y, Ibuki R, Amidon GL, Sezaki H, Yamashita S. The site-specific transport and metabolism of tacrolimus in rat small intestine. J Pharmacol Exp Ther [Internet]. 2003/04/05 ed. 2003;306(1):310–6.
161. Valenzuela B, Nacher A, Casabo VG, Martin-Villodre A. The influence of active secretion processes on intestinal absorption of salbutamol in the rat. Eur J Pharm Biopharm [Internet]. 2001/07/05 ed. 2001;52(1):31–7.
162. Yumoto R, Murakami T, Sanemasa M, Nasu R, Nagai J, Takano M. Pharmacokinetic interaction of cytochrome P450 3A-related compounds with rhodamine 123, a P-glycoprotein substrate, in rats pretreated with dexamethasone. Drug Metab Dispos [Internet]. 2001/02/13 ed. 2001;29(2):145–51.
163. Chiou WL, Chung SM, Wu TC, Ma C. A comprehensive account on the role of efflux transporters in the gastrointestinal absorption of 13 commonly used substrate drugs in humans. Int J Clin Pharmacol Ther [Internet]. 2001/06/09 ed. 2001;39(3):93–101.
164. Gallois L, Fiallo M, Laigle A, Priebe W, Garnier-Suillerot A. The overall partitioning of anthracyclines into phosphatidyl-containing model membranes depends neither on the drug charge nor the presence of anionic phospholipids. Eur J Biochem. 1996;241(3):879–87.
165. Regev R, Eytan GD. Flip-flop of doxorubicin across erythrocyte and lipid membranes. Biochem Pharmacol [Internet]. 1998/02/17 ed. 1997;54(10):1151–8.
166. Eytan GD, Regev R, Oren G, Assaraf YG. The role of passive transbilayer drug movement in multidrug resistance and its modulation. J Biol Chem [Internet]. 1996/05/31 ed. 1996;271(22):12897–902.
167. Aller SG, Yu J, Ward A, Weng Y, Chittaboina S, Zhuo R, et al. Structure of P-glycoprotein reveals a molecular basis for poly-specific drug binding. Science [Internet]. 2009 Mar 27 [cited 2013 Jan 29];323(5922):1718–22.
168. Schinkel AH. P-Glycoprotein, a gatekeeper in the blood-brain barrier. Adv Drug Deliv Rev [Internet]. 2000/06/06 ed. 1999;36(2-3):179–94.
169. Clarke LL. A guide to Ussing chamber studies of mouse intestine. Am J Physiol Gastrointest Liver Physiol [Internet]. 2009 Jun [cited 2013 Aug 12];296(6):G1151–66.
170. Fortuna A, Alves G, Falcão A, Soares-da-Silva P. Evaluation of the permeability and P-glycoprotein efflux of carbamazepine and several derivatives across mouse small intestine by the Ussing chamber technique. Epilepsia [Internet]. 2012 Mar [cited 2013 Sep 16];53(3):529–38.
171. Stephens RH, Neill CAO, Bennett J, Humphrey M, Henry B, Rowland M, et al. Resolution of P-glycoprotein and non-P-glycoprotein e € ects on drug permeability using intestinal tissues from mdr1a ( 7 / 7 ) mice. 2002;2038–46.
172. Collett A, Stephens RH, Harwood MD, Humphrey M, Dallman L, Bennett J, et al. Investigation of regional mechanisms responsible for poor oral absorption in humans of a modified release preparation of the alpha-adrenoreceptor antagonist, 4-amino-6,7-dimethoxy-2-(5-

175
methanesulfonamido-1,2,3,4 tetrahydroisoquinol-2-yl)-5-(2-pyridyl)quin. Drug Metab Dispos [Internet]. 2007/10/13 ed. 2008;36(1):87–94.
173. Effros RM, Mason GR. Measurements of pulmonary epithelial permeability in vivo. Am Rev Respir Dis. 1983;127(5 Pt 2):S59–65.
174. Gumbleton M, Hollins AJ, Omidi Y, Campbell L, Taylor G. Targeting caveolae for vesicular drug transport. Journal of Controlled Release. 2003. p. 139–51.
175. Taylor G, Colthorpe P, Farr S. Pulmonary absorption of proteins, influence of deposition site and competitive elimination processes. Proc Resp Drug Deliv. 1994;IV:25–37.
176. Cabral-Marques, H.M Hadgraft J, Kellaway I., Taylor G. Studies of cyclodextrin inclusion complexes IV The pulmonary absorption of salbutamol from a complex with 2-hydroxy-propyl b-cyclodextrin in rabbits. Int J Pharm. 1991;(77):303–7.
177. Lanman RC, Gillilan RM, Schanker LS. Absorption of cardiac glycosides from the rat respiratory tract. J Pharmacol Exp Ther [Internet]. 1973/10/01 ed. 1973;187(1):105–11.
178. Krämer SD, Lombardi D, Primorac A, Thomae A V, Wunderli-Allenspach H. Lipid-bilayer permeation of drug-like compounds. Chem Biodivers [Internet]. 2009 Nov;6(11):1900–16.
179. Veber DF, Johnson SR, Cheng H-Y, Smith BR, Ward KW, Kopple KD. Molecular properties that influence the oral bioavailability of drug candidates. J Med Chem [Internet]. 2002 Jun
180. Acree WE, Grubbs LM, Abraham MH. Prediction of Partition Coefficients and Permeability of Drug Molecules in Biological Systems with Abraham Model Solute Descriptors Derived from Measured Solubilities and Water-to-Organic Solvent Partition Coefficients. 2008;
181. Abraham MH. The Permeation of Neutral Molecules , Ions , and Ionic Species Through Membranes : Brain Permeation as an Example. 2011;100(5):1690–701.
182. Ribeiro MMB, Melo MN, Serrano ID, Santos NC, Castanho MARB. Drug-lipid interaction evaluation: Why a 19th century solution? Trends Pharmacol Sci. 2010;31(10):449–54.
183. J S. Octanol-water partition coefficients. New York, NY: John Wiley and Sons; 1997.
184. Leo A. Calculating logPoct from structures. Chem Rev. 1993;93:1281–306.
185. Braumann T. Determination of hydrophobic parameters by reversed-phase liquid chromatography: theory, experimental techniques, and application in studies on quantitative structure-activity relationships. J Chromatogr. 1986;373(2):191–225.
186. Hauser H, Pascher I, Pearson RH, Sundell S. Preferred conformation and molecular packing of phosphatidylethanolamine and phosphatidylcholine. Biochim Biophys Acta. 1981;650(1):21–51.
187. Pidgeon C, Ong S, Liu H, Qiu X, Pidgeon M, Dantzig AH, et al. IAM chromatography: an in vitro screen for predicting drug membrane permeability. J Med Chem. 1995;38(4):590–4.

176
188. Ong S, Liu H, Pidgeon C. Immobilized-artificial-membrane chromatography: Measurements of membrane partition coefficient and predicting drug membrane permeability. Journal of Chromatography A. 1996. p. 113–28.
189. Ottiger C, H. W-A. Immobilized artificial membrane (IAM)-HPLC for partition studies of neutral and ionized acids and bases in comparison with the liposomal partition system. Pharm Res. 1999;16:643–50.
190. Kaliszan R, Nasal R, Bucinski A. Chromatographic hydrophobicity parameter deterimed on an immobilized aritificial membrane column: relationships to standard measures of hydrophobicity and bioactivity. Eur J Med Chem. 1994;29:163–70.
191. Barbato F, La Rotonda M, Quaglia F. Chromatographic indices determined on an immobilised artificial membrane (IAM) column as descriptors of lipophilic and polar interactions of 4-phenyldihydropyridine calcium-channel blockers with biomembranes. Eur J Med Chem. 1996;31:311–8.
192. Salminen T, Pulli a, Taskinen J. Relationship between immobilised artificial membrane chromatographic retention and the brain penetration of structurally diverse drugs. J Pharm Biomed Anal [Internet]. 1997 Jan;15(4):469–77.
193. Kotecha J, Shah S, Rathod I, Subbaiah G. Prediction of oral absorption in humans by experimental immobilized artificial membrane chromatography indices and physicochemical descriptors. Int J Pharm [Internet]. 2008 Aug [cited 2013 Jun 25];360(1-2):96–106.
194. Platts JA, Butina D, Abraham MH, Hersey A. Estimation of Molecular Linear Free Energy Relation Descriptors Using a Group Contribution Approach. 1999;835–45.
195. Giaginis C, Tsantili-kakoulidou A. Alternative Measures of Lipophilicity : From Octanol – Water Partitioning to IAM Retention. 2008;97(8):2984–3004.
196. Mintz C. Predicting Chemical and Biochemical Properties Using the Abraham General Solvation Model. 2009;
197. Thomas L. Lemke DAW, Wilkins LW&, editors. Foye’s Principles of Medicinal Chemistry. 7th ed. Wolters Kluwer; 2012.
198. Dressman JB, Amidon GL, Fleisher D. Absorption potential: estimating the fraction absorbed for orally administered compounds. J Pharm Sci. 1985;74(5):588–9.
199. Lentz KA, Polli JW, Wring SA, Humphreys JE, Polli JE. Influence of passive permeability on apparent P-glycoprotein kinetics. Pharm Res [Internet]. 2001/04/17 ed. 2000;17(12):1456–60.