examples of range-changes between sabap1 and sabap2
TRANSCRIPT

SABAP2Southern African Bird Atlas
Project 2
Range changes of selected speciesLes Underhill, Doug Harebottle and
Michael Brooks Animal Demography UnitDepartment of ZoologyUniversity of Cape Townhttp://sabap2.adu.org.za

SABAP2 is a partnership between the Animal Demography Unit at the University of Cape Town, BirdLife South Africa and the South African National Biodiversity Institute (SANBI)

• These seven species are a tiny sample of those which show range changes between the first and second bird atlas projects
• SABAP1 data collection took place mainly between 1987 and 1991
• SABAP2 started in July 2007 and is ongoing

Read this first!• The blocks on the maps are quarter degree grid cells (QDGC)• RED = seen in SABAP1 but not in SABAP2 = maybe it’s gone
extinct in QDGC• ORANGE = recorded less frequently in SABAP2 than SABAP1
= maybe it’s becoming less common in QDGC• YELLOW = same frequency of records in both projects• GREEN = recorded more frequently in SABAP2 than SABAP1
= maybe it’s becoming more common in QDGC• BLUE = seen in SABAP2 but not in SABAP1 = maybe it’s
colonized the QDGC• PINK = the species occurred here in SABAP1, but there is not
yet SABAP2 data for this QDGC• Everything is couched in MAYBEs. These are not the
definitive, authoritative analyses. These are being done. But so far, these results are all standing up to scrutiny


The map is mostly RED and ORANGE. Black Storks are being recorded far less frequently in SABAP2 than in SABAP1. The reason is unclear. This was a change that no one suspected until this range-change map was produced


The map is mostly ORANGE. There seem to be fewer Hamerkops during SABAP2 than there were in SABAP1. Once again, the reason is unclear. This was also a change that no one suspected until this range-change map was produced
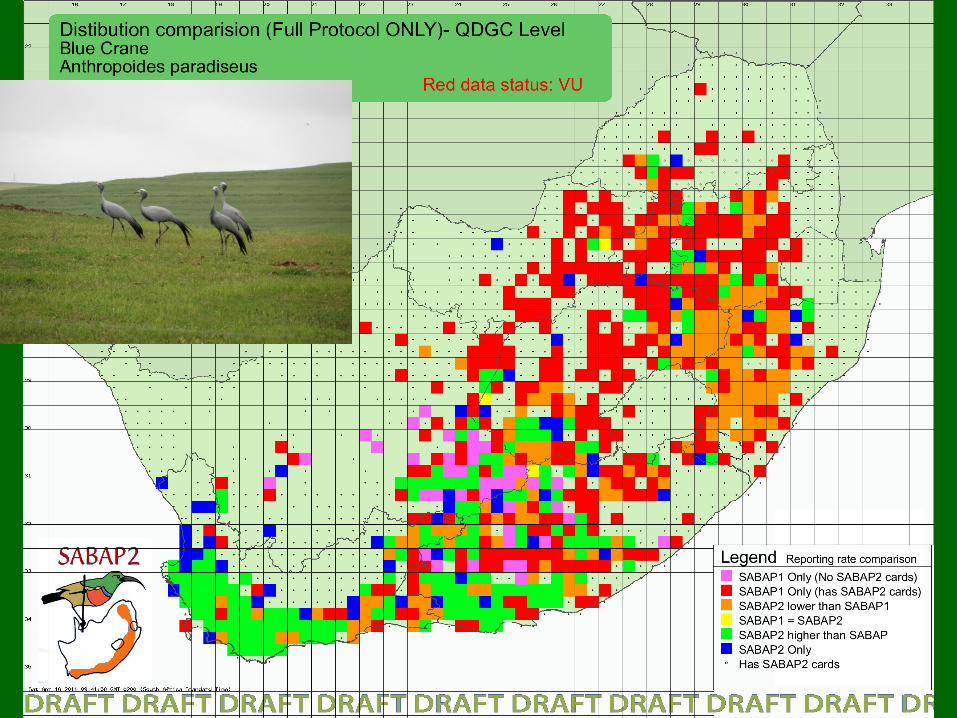

This is an unusual range change map. In the northeast it is mostly RED aand ORANGE. It seems to get increasingly GREENER towards the Western Cape, and there seems to be a bit of range expansion northwards in the NW corner of the Western Cape. The grasslands of the Highveld were the former range of the Blue Crane, and from this it seems to be disappearing. But the new core of the distribution is in the wheat-growing regions of the Swartland and Overberg in the Western Cape. It is critically dependent on the current agricultural regime in these regions


The map is mostly GREEN! Although there has not been much range expansion, there has been a big increase in the abundance of Egyptian Geese over the SABAP2 region since SABAP1. This is probably because this species has adapted to agriculture and to living in towns and cities. There are also lots more Egyptian Geese on the shoreline than in former times


The map is has lots of RED and ORANGE, but also some GREEN and BLUE. But the overall consensus is that the Secretarybird is not doing well at present. It is being recorded less frequently in SABAP2 than it was during SABAP1. The reasons are unclear. This was a change that no one really suspected until this range-change map was produced


The map is mostly RED and ORANGE, especially in the Western Cape. Ground Woodpeckers are being recorded far less frequently in SABAP2 than in SABAP1. This was a change that was not suspected until this range-change map was produced. Potentially, this is a climate change impact, because there have been no human-induced changes of its mountainous habitat


The map is mostly BLUE and GREEN. Common Mynas have expanded their range massively since SABAP1. But it is a surprise that they now appear to be less common in KwaZulu-Natal than during SABAP1. This ORANGE region was the core of their range at that time. The range of this species in expanding rapidly, and the ongoing SABAP2 project is keeping track of this in a remarkable way. It is even expanding into the Kruger National Park

• There are lots more examples like these• SABAP2 has made a huge contribution to
the “broad brush” monitoring of all bird species
• It is important that this project continue
• If you can help to sponsor SABAP2, please contact Les Underhill [email protected]
• Or you can do an EFT:– UCT donations account, Standard Bank, Rondebosch– Branch 025009, Account 071522387 (SWIFT code is
SBZAZAJJ)– Beneficiary reference: Fund 231454 (this is the ADU’s
donations “fund” and tells the University where to transfer the money to)
– Please send an email to Sue Kuyper [email protected] and tell her that you want the donation to be allocated to SABAP2
– This email also enables UCT to send a Section 18A tax donation certificate
UCT does not charge any "levy" on donations; the entire amount comes to the ADU. There is a levy on formal contracts, but the multiple services we get for the amount we pay are pretty good – the ADU projects could not be run cheaper off campus – one of the most important benefits is the fantastic high quality access we get onto the global internet highways!