examples of using time to identify turning points in the...
TRANSCRIPT

Article published in The Australia Technical Analysts AssociationNewsletter in July 1995
EXAMPLES OF USING TIME TO IDENTIFYTURNING POINTS IN THE MARKETS
(For Beginners Part one)By Chris Christidis
Cycles"Everything in nature moves incycles... our solar systemmoves in a cycle around thecentre of the MilkyWay galaxy...the planets move in precise andpredictable cycles around thesun... the cycle of the tilt of theearth causes the cycle of theseasons... the rotation of theearth produces the cycle ofnight and day...the full moonoccurs with predictableregularity as do the rise and fallof the tides....These are allcycles we can understand andaccept because we have anunderstanding of the underlyingcauses of these cycles." WalterBressert
So do cycles also exist in thestock market?
So what if they do you mightsay! The fact that they exist is oflittle more than a passinginterest for an analyst, so whyuse them?
Natural Cycles (Seasonals)
The seasonal cycles of our planet Earth, arenatural cycles. They are the direct result of the
mechanical movements between the Earth,Moon and the Sun. Seasonal tendencies help
form cyclic patterns in most markets.
Important Natural cycle dates to be aware ofare-
( Southern Hemisphere)
The Autumnal Equinox 20,21,22 MarchThe Vernal Equinox 21,22,23 SeptemberThe Winter Solstice 21,22,23 JuneThe Summer Solstice 21,22,23 DecemberThe Apogee 3,4 July and Perigee 2,3 JanuaryThe lunar cycle- new moon and full moon andSolar Eclipses
If major time cycles coincide with an Equinox,Solstice, Apogee, Perigee or a Solar Eclipsethey can combine to create powerful turningpoints in markets. A good example was the1987 high in the Allords where on the 21stSeptember 1987 (Equinox), a Solar Eclipseoccurred. (Keep in mind the 21st September1995.)

Cycles are a very powerfulanalytical tool for identifyingtrends and trend reversals. Thefact that an analyst is aware of amajor bottom in a dominantcycle, can add confidence to thedecision making process.Cycles and their turning pointsare used by short term tradersand investors in thestockmarket.
You’ve probably heard the sameold adage "trade with the trend",if the trend is up, buy the dips; ifthe trend is down, sell therallies. Each dip or peak is ashort term cycle within a longterm cycle, each could beequated as a single wheelrotating within the confines of alarger wheel, ie wheels workingwithin wheels. As long as thelarger wheel is rolling, the trendcontinues.
This article is aimed at thebeginner and try’s to show byway of simple examples thatcycles exist in our localstockmarket in their variousforms.
I hope that these few exampleswill arouse some curiosity andat least prompt you toinvestigate further. There aremany books available on thetopic, consult your localtechnical book shop or theStock Exchange book shop inyour capital city.
Chart 1 - Daily Allords 1987 Crash

Degrees from the circle of one yearGANN
Each year the Earth passes throughone orbit around the sun. Each orbitcan be divided into 360 degrees asopposed to 365.25 days. Because thepath of the Earth takes in its Orbitaround the Sun is not a perfect circlebut in fact an ellipse (an oval), thepassage of time in degrees is notconstant with the calendar days.
For example each 90 degree segmentof the 360 degree circle is not regular indays by direct proportion as 1/4 of365.25 = 91.3 days. Depending uponthe seasonal time of the year, 90degrees on the Solar Circle could take89 days, 93 days or somewhere inbetween.
W.D.GANN, a legendary stock andcommodity trader in the USA in the firsthalf of this century, used precisemathematical and geometricrelationships in terms of both time andprice to amass a reputed $50 millionfrom the markets. Gann’s methodologycontained elements of intricatemathematical ratios, simplistic naturalgeometry, and aspects of financialastrology.
Mathematics, he believed was the onlyexact science. There are threeimportant points that can be provedwith mathematics or geometry : TheCircle, Square, Triangle.
There are 360 degrees in a circle, nomatter how large or how small the circlemay be. Gann used divisions of thecircle in time (degrees and calendar) toascertain turning points in stocks andmarkets. He divided the circle intoeighth’s i.e. 1/8 ,2/8 , 3/8, etc andapplied these divisions to time. ( eg3/8ths of 360=135, 5/8ths of 360=225degrees. Note 225 = .618 of a calendaryear)
Gann also used multiples(squares) of90 and 144, i.e.(90,180,270, etc and144,288,576,720) I have found thesemultiples to be very important in thelocal market.(See Chart 7 of CRA)
Important trend changes can occur atintervals of 90,120,180,225,240 and360 and 720 degrees (twice around thecircle) from highs or lows, althoughminor trend changes can occur every30 degrees. (See Chart 2 of SPI below)
Some traders make decisions to enteror exit a market or stock purely basedon time alone. For example, if a cyclehas bottomed, traders positionthemselves on the long side and staylong for say a period of 30 degrees (ordays), then they exit their positions,hopefully at a profit, purely on the factthat the cycle has fallen due, waitingthen to re-enter the market.

Chart 2 - Daily SPI Futures
Fibonacci Number SequenceLeonardo Fibonacci, an Italianmathematician of the 13th century,visited Egypt and on his returndisclosed a number sequence nowbearing his name, as a solution to amathematical problem involving thereproduction of rabbits. This amazingsequence of numbers is as follows -1,2,3,5,8,13,21,34,55,89,144,233,377,etc all the way to infinity.
For those not familiar with the Fibonacciseries, the series of numbers begins atone and generates new numbers in theseries with an increase ofapproximately 61.8%.Fibonacci numbers can be found in thespirals of sunflowers, the spirals onpine cones, and the ancient Greek andEgyptian’s applied the numbers (theGolden Mean 1.618) to such diverse
I must admit that I was looking at 288calendar days at the time, only to seethe market slide further. The Allordsrallied but the main trend still remaineddown.
A final price low was made on the 9-2-.95, but the retest of the low made on15-2-95 was 377 days from the top, andnaturally 233 days from the low in June94. (144+233=377 ; 377 x .618 =233)
Retest of the low
In some cases a time cycle mightbottom after the price low. What I meanby this is that the retest of the low orhigh fails to break into new priceterritory, but a time cycle is due,therefore creating a higher bottom orlower top.

areas as music, art, and even thebuilding of the Parthenon and the GreatPyramid of Gizeh.
Leonardo didn’t really know thesenumbers had a connection to naturalobjects, and neither did anyone else forover 700 years. It’s only been about 50years since they’ve come to be knownas one of the most important sets ofnumbers in the universe.
Guess where else they appear? That’sright in the Stock market. I have foundtime after time the use of the numbersin the sequence to be very powerful.
In their book "The Elliott WavePrinciple" Frost and Prechter state that"It is sufficient to state that thestockmarket has a propensity todemonstrate a form which can bealigned with the form present in theFibonacci sequence"
Fibonacci and the Allords -Charts3&4
As you can see from the charts on thenext page, Fibonacci time was presentat some of the major turning points overthe last 12 months or so.
The first chart shows that the Allordsmade a bottom 144 calendar days fromthe top of 3-2-94. A rally occurred onlyto see the main trend continue down.
The next bottom occurred 287 degrees(2x144=288) not days from the top (theuse of degrees was explained in theprevious section.)
This is a very important point to keep inmind as many cycles can be missed bynot being aware of the retest.Conversely, that doesn’t mean youignore the price bottom just because aprior cycle bottoms latter in time but notprice, as we shall see in chart no.4.
There they are again (Chart 4), thoseFibonacci numbers stand out. Since theAllords bottomed on 9-2-95 it rallied 89calender days to the 9-5-95. Themarket came back did a 50%retracement in price from the bottom on15-6-95 (which was 120 calendar daysfrom the retest low 15-2-95) then tookoff. A pullback then occurred on 3-7-95(the Apogee) 144 calendar days fromthe price bottom 9-2-95. (89 up & 55across), the market then continued itsupward trend.
Fibonacci and Stocks -Charts 5,6,7
Fibonacci time can also be applied onstocks. Look at chart number 5 of CRA.You can see the clustering of timesfrom previous short term tops andbottoms. Even inside the wedge that Ihave shown had 5,8,13,21 daysbetween the minor swings. One shouldalso be aware of Fibonnaci times indegrees (explained previous section).See chart 6 of CRA.
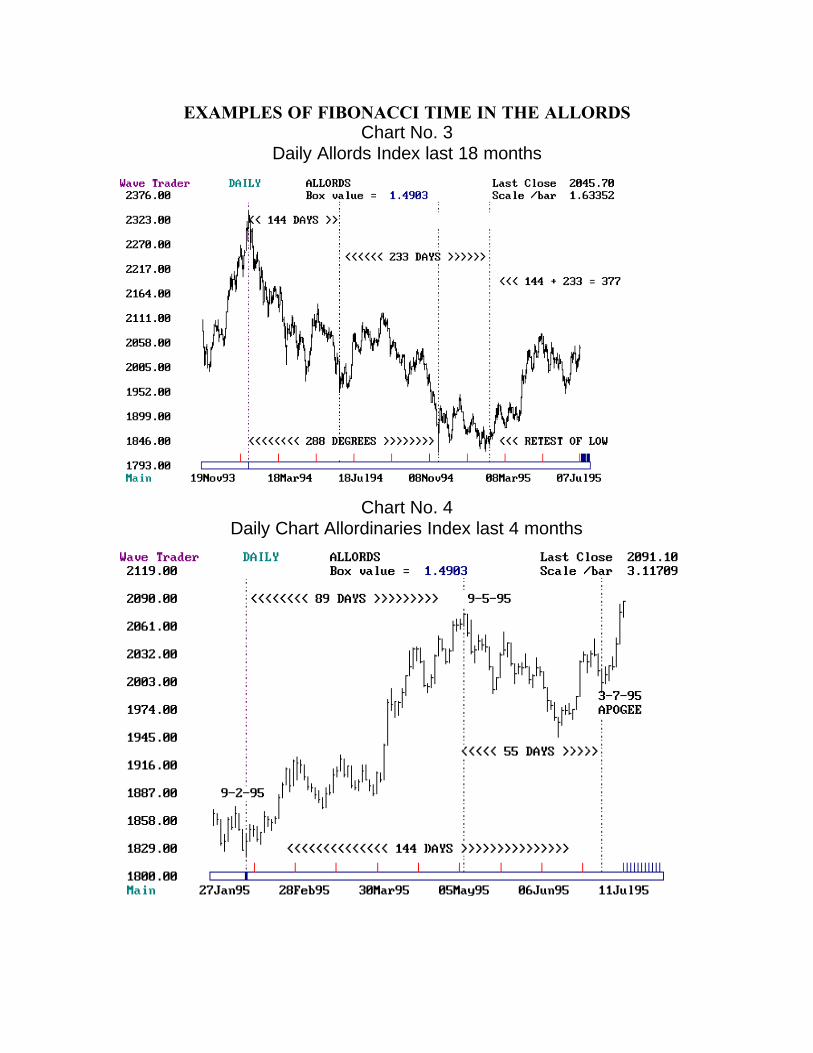
EXAMPLES OF FIBONACCI TIME IN THE ALLORDSChart No. 3
Daily Allords Index last 18 months
Chart No. 4Daily Chart Allordinaries Index last 4 months

Chart 5CRA daily from 9-2-95
Chart 6 below

Chart 7 - CRA Daily from 1993
TIME CYCLE RATIOSGann once said "There isnothing new under the Sun,the past will continue torepeat itself time and timeagain."
Gann theory uses avibrational technique formeasuring relationshipsbetween waves of similardegree. Conventional Ganntechnique relies on squarenumbers i.e., .25, .333, .50,.666, .75, .875, 1.00, 1.5,2.00, 4.00 , etc
Earlier I mentioned that Gannsaid, Mathematics, was theonly exact science and thatthree important points thatcan be proved withmathematics or geometrywere the Circle, Square,Triangle.
Each trend of similar degree is the direct effect ofan underlying cause. The cause is the constantvibration of the numerous cycles at work in anyparticular complex. Therefore the use of Timecycle Ratios can help identify the relationshipsbetween these trends of similar degree.
What are Time Cycle Ratios?
A time cycle ratio is the projection of a previousmarket trend or a series of market trends (timecycle) projected into the future, using the ratiosmentioned previously. A time cycle is the lengthof time of a previous trend, be it a bear or bulltrend.
For example you may take the time cycle of a bulltrend (from bottom to top - number of days,degrees) and project it forward by Geometric orHarmonic or Arithmetic Ratios.
As markets move along, each confirmed minor,intermediate and primary degree top or bottomshould be noted and used to compare future tops

Bryce Gilmore in his book"Geometry of Markets " hasapplied ancient geometry tothe markets and states thatthe basic underlying theorythat one needs to appreciate,for the successful use ofphilosophical geometriccharting, is that all waves ofsimilar degree will relatemathematically.
He believes that Squareratios are only one third of thetools required for acomprehensive analysis oftime cycles.
The other two thirds of thetools are made up ofGEOMETRIC andHARMONIC ratios.
The Elliott Wave Principleprimarily uses Geometricratios, i.e 0.382, 0.618, 1.618,1.902, 2.618, 4.236, etc as itsmathematical base.
Harmonic ratios are anintegral part of the wholeconcept i.e .293, 0.3535,0.414, 0.586, 0.707, 1.414,1.732, 2.236, etc
I shall explore the theory anduse of Geometric andHarmonic Ratios in my nextarticle.
Most cycles are dynamic -not static
All markets work to their owndynamic system. Dynamicmeans they are interactive,
and bottoms to see if they relate to each other.This can be done manually (kept in a file) orstored on computer in some way.
I use CycleTrader/WaveTrader, a softwarepackage produced by Bryce Gilmore, of Australiawhich stores these tops and bottoms in a fact filewhich can be accessed for rapid analysis ofcurrent tops or bottoms for any relationship topast turning points.
(See chart below and Chart 8 next page)
Allords Fact File(Swing Points) from 1931

i.e. they expand and contractover time.
Market cycles are directlyrelated to the behaviourpatterns of individuals actingon masse. Markets vibrate inprice and time from highs tolows and lows to highs inminor trends, intermediatetrends and primary trends.
CHART 8Allords Fact File (Swing Points)
Showing Time Cycle 1980 high - 1989 high
The above fact file shows the Allords from 1931 to the present. A Time Cyclefrom the 1980 high to the 1989 high has given strong turning points in the past. Ifyou take the range in calendar days and project it forward 25%, you get the 1991high, 50% of the range projected forward picked the high in February 1994 andrecently 61.8% of the range picked the retest of the low on 9-2-95. (i.e 15-2-95).Now 66.6%(2/3rds) of the range projected into the future produces dates aroundthe 17-19th July 1995. These are quality time cycle ratios.
There are many other examples of time cycles in our market, both minor andmajor. I have tried to show by way of simple examples some of them. Whenanalysing the markets or stocks, time should be considered in conjuction withother factors such as pattern, position of indicators, etc.

I have included a worksheet (APPENDIX 1.) that I prepared on the 4th July forthe Allords that I keep on file, which helps me answer questions that are alwaysasked such as where is support,resistance, where’s the market going, etc.
In conclusion Pythagoras once said, It is impossible for anyone to learnanything until he has experienced its truth for himself