excel review and introduction to qualtrics review and introduction to qualtrics ... surf price 5.40...
TRANSCRIPT

Excel Review and Introduction to Qualtrics

Excel Review and Introduction to Qualtrics
Outline
Marketing Engineering Installation
Excel Analysis ToolPak
Excel Review
Introduction to Qualtrics

Excel Review and Introduction to Qualtrics
Liquid Laundry Exercise
Verify that there are 52 households, 348 purchase occasions, and
a total of 1392 observations.
Compute the average price across all four brands and across all
1392 observations and the percentage of time that all four brands
were featured or on display. [Hint: Use the AVERAGE function.]
What’s the market share of each brand in this data set? [Hint: Use
the AVERAGEIF function. Alternatively, use Pivot Table under the
INSERT tab, based on the variables set and choice. Use set as the
row variable and choice in the value area. Use the Average of
choice in Value Field Settings.]
Compute the average price and the percentage of time a brand
was featured or on display, separately for each brand. What’s the
most inexpensive brand on average and what’s the most
expensive. What’s the most heavily promoted brand in terms of
feature and display? How do these figures relate to the market
shares of the four brands? [Hint: See question c.]

Excel Review and Introduction to Qualtrics
Liquid Laundry Exercise
Graph the number of purchases for each week across the entire
year. Are there certain times during the year when people are more
likely to buy liquid laundry detergent? [Hint: Use Pivot Table based
on the variables week and choice, with Sum in the Value Field
Settings for choice. Then do a chart of number of purchases
against week. The chart tools are under the INSERT tab.]
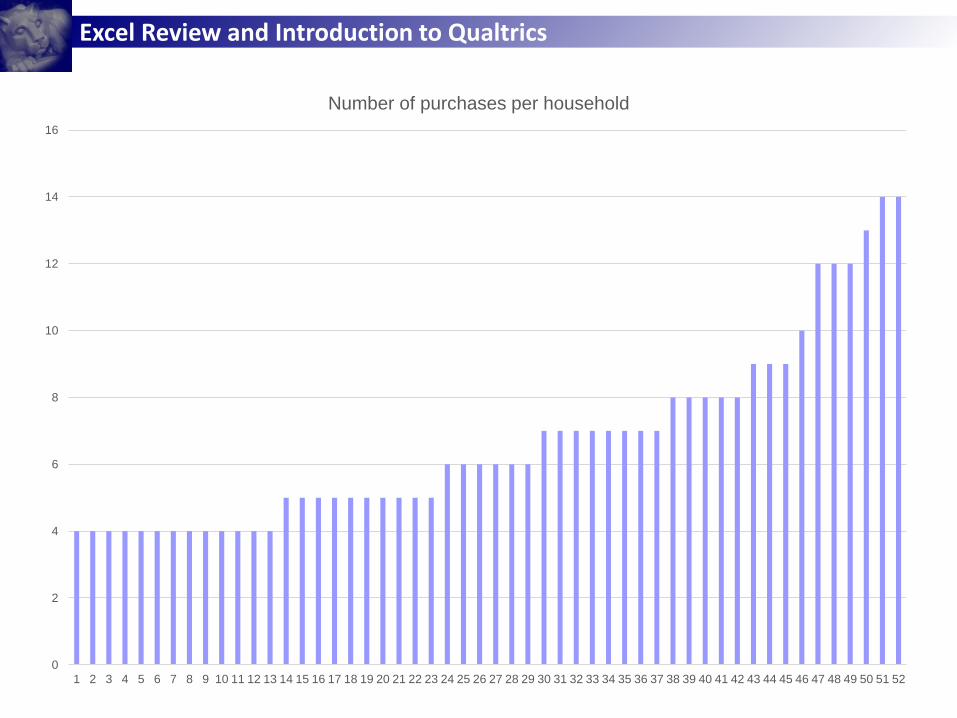
Are some households heavier consumers of liquid laundry
detergent than others? Which households are the lightest
consumers and which are the heaviest consumers? [Hint: Use
Pivot Table based on household and choice, with Sum in Value
Field Settings for choice.]
Do lower prices increase the likelihood of purchase? Suggest ways
in which this question could be answered using these data.
Come up with an interesting marketing question that could be
answered with these data and explain how you would use the data
to answer this question.

Excel Review and Introduction to Qualtrics
Liquid Laundry: Questions b, c and d
Overall mean
Mean for Tide
Mean for Wisk
Mean for Era
Mean for Surf
Price 5.40 5.86 4.65 5.96 5.15
Feature 0.06 0.06 0.10 0.03 0.06
Display 0.10 0.14 0.18 0.03 0.04
Market share 1.00 0.24 0.51 0.12 0.13

Excel Review and Introduction to Qualtrics
0
2
4
6
8
10
12
14
16
18
20
0 10 20 30 40 50 60
Num
ber
of
purc
hases
Week
Number of purchases of liquid laundry detergent per week
Excel Review and Introduction to Qualtrics
0
2
4
6
8
10
12
14
16
1 2 3 4 5 6 7 8 9 10 11 12 13 14 15 16 17 18 19 20 21 22 23 24 25 26 27 28 29 30 31 32 33 34 35 36 37 38 39 40 41 42 43 44 45 46 47 48 49 50 51 52
Number of purchases per household

Excel Review and Introduction to Qualtrics
0
0.1
0.2
0.3
0.4
0.5
0.6
0.7
3.5 4 4.5 5 5.5 6 6.5 7
Choice probability by rounded price

Excel Review and Introduction to Qualtrics
Introduction to Qualtrics
Log on to: https://www.qualtrics.com/login/
Create Project
Design your survey
Preview survey
Distribute Survey
Download and analyze the data
Excel Review and Introduction to Qualtrics
Next time
Introduction to Marketing Analytics
Download the overheads (Introduction.pdf)
Assignments:
□ Chapter 1 in LRB
□ Allegro exercise

Excel Review and Introduction to Qualtrics
Regression output:
Average purchase probability as a function of price
SUMMARY
OUTPUT
Regression Statistics
Multiple R 0.44
R Square 0.19
Adjusted R Square 0.18
Standard Error 0.27
Observations 65
ANOVA
Df SS MS F
Significance
F
Regression 1 1.11 1.11 14.85 0.00
Residual 63 4.69 0.07
Total 64 5.80
Coefficients Standard Error t Stat P-value Lower 95% Upper 95%
Intercept 1.01 0.20 5.12 0.00 0.62 1.41
Price -0.15 0.04 -3.85 0.00 -0.22 -0.07