excellent rebound with sales and pro1 above fy19 …
TRANSCRIPT
- 1 -
FY21 Full-year Sales and Results Press release - Paris, 1 September 2021
EXCELLENT REBOUND WITH SALES AND PRO1 ABOVE FY19 LEVELS2 AND STRONG
GROWTH MOMENTUM +10% ORGANIC SALES GROWTH (+4% REPORTED)
+18% ORGANIC GROWTH IN PRO (+7% REPORTED)
RECURRING FREE CASH FLOW OF €1,745M, AT HISTORICAL HIGH
SALES
Sales for FY21 totalled €8,824m, with organic growth of +9.7%. Reported Sales growth was +4.5% due to a significant adverse FX impact resulting from USD and Emerging market currency depreciation vs. Euro.
FY21 Sales grew in all regions:
• Americas: +14%, excellent broad-based growth with the USA, Canada and South America offsetting decline in Travel Retail
• Asia-RoW: +11%, very strong growth mainly driven by China, Korea and Turkey, and to a lesser extent India
• Europe: +4%, dynamic rebound with the UK, Germany and Eastern Europe offsetting declines in Spain, Ireland and Travel Retail.
By category:
• Strategic International Brands: +11%, very strong rebound, primarily driven by Martell in China and Jameson in the USA
• Strategic Local Brands: +7%, driven by recovery of Seagram’s Indian whiskies, Kalhua, Passport and Ramazzotti
• Specialty Brands: +28%, continued very strong growth of Lillet, Aberlour, Malfy, American whiskeys, Avion and Redbreast
• Strategic Wines: stable, with Campo Viejo growth offset by decline of Jacob’s Creek and Kenwood.
Innovation grew +22%.
Price/mix was +4% on Strategic brands.
Q4 Sales were €1,883m, +56.5% organic growth, on a low basis of comparison.
FY21 saw very strong and diversified growth driven by domestic Must-wins with the USA and China reaching record Sales above $2bn and €1bn. Premiumisation was strong, thanks to growth of Strategic International Brands and Specialty Brands. Pernod Ricard gained market share in most key markets.
Business transformation momentum is strong, with significant investments behind priority brands and markets, strong progress in digital transformation, strong e-commerce growth (+63%) and acceleration of the sustainability roadmap.
1 PRO: Profit from Recurring Operations 2 At constant FX

- 2 -
FY21 Full-year Sales and Results Press release - Paris, 1 September 2021
RESULTS
FY21 PRO was €2,423m, an organic growth of +18.3% (+7.2% reported) with a very strong organic operating margin expansion of +213bps:
• Gross margin expanding +64bps driven by:
✓ Stable pricing with fewer price increases in Covid context
✓ Better fixed cost absorption from volume growth and operational excellence savings
• A&P ratio at c. 16%, resulting from purpose-based investment, with quick response to channel shifts and strong reinvestment in markets and categories returning to growth
• Structure costs: +136bps, reflecting very strict discipline and FY20 reorganisations. A strong increase is expected in FY22 to support future growth
• PRO includes +€28m from USA drawback
• Significant FX impact on PRO -€255m due to USD and Emerging market currency depreciation vs. Euro.
The FY21 corporate income tax rate on recurring items was 24.3%, in line with that of FY20, with geographical mix offsetting the positive effect of the French tax rate reduction.
Group share of Net PRO was €1,612m, +12% reported vs. FY20.
Group share of Net profit was €1,305m, +297% reported, a significant increase due mainly to non-recurring items in FY20, in particular a €1bn impairment charge.
CASH FLOW AND DEBT
Cash performance was outstanding, with Recurring Free Cash Flow at €1,745m, its historical high.
The average cost of debt stood at 2.8% vs. 3.6% in FY20, thanks to successful bond refinancing.
Net debt decreased by €972m vs. 30 June 2020 to €7,452m driven primarily by a very significant Free Cash Flow improvement linked to business recovery. The Net Debt/EBITDA ratio at average rates1 was 2.6x at 30 June 2021.
The return to stakeholders is significant:
• A dividend of €3.12 is proposed for the Annual General Meeting of 10 November 2021, back to the historical high of FY19
• The remaining c. €0.5bn Share buyback programme will resume in FY22
• A second employee ownership programme will take place in FY222.
1 Based on average EUR/USD rates: 1.19 in FY21 2 Subject to AMF approval (and to AGM of 10 November 2021 if launched after that date)
- 3 -
FY21 Full-year Sales and Results Press release - Paris, 1 September 2021
WINNING STRATEGY
The Transform & Accelerate strategy launched in 2018 has driven significant achievements. The fundamental consumer insights driving the strategy are now more compelling than ever. As a result, Pernod Ricard will continue its transformational journey to become The Conviviality Platform. This strategy seeks to maximise long-term value creation, with the following medium-term ambition (in a normalised context):
Embed dynamic growth and deliver operating leverage
• +4 to +7% topline growth, leveraging key competitive advantages and consistent investment behind key priorities
• Focus on pricing and building new operational excellence initiatives
• Significant A&P investment, maintained at c.16% of Sales, with strong arbitration to support must-win brands and markets while stimulating innovation
• Discipline on Structure costs, investing in priorities while maintaining agile organisation, with growth below topline growth rates
• Operating leverage of c.50-60 bps pa, provided topline within +4 to +7% bracket
Financial policy priorities, while retaining Investment grade ratings:
1. Investment in future organic growth, in particular through strategic inventories and capex
2. Continued active portfolio management, including value-creating M&A
3. Dividend distribution at c.50% of Net profit from Recurring Operations
4. Share buy-back programme (to resume in FY22)
A comprehensive strategic update will be provided during a capital market day in FY22.
Alexandre Ricard, Chairman and Chief Executive Officer, stated,
“The business rebounded very strongly during FY21 to exceed FY19 levels. We expect this good Sales momentum to continue in FY22 with, in particular, a very dynamic Q1. I would like to take this opportunity to praise the exceptional commitment of our teams during this difficult time and express my support to those who have been or continue to be impacted by this pandemic.
We will stay the strategic course, accelerating our digital transformation and our ambitious Sustainability & Responsibility roadmap. Thanks to our solid fundamentals, our teams and our brand portfolio, we are emerging from this crisis stronger.”
- 4 -
FY21 Full-year Sales and Results Press release - Paris, 1 September 2021
All growth data specified in this press release refers to organic growth (at constant FX and Group structure), unless otherwise stated. Data may be subject to rounding. A detailed presentation of FY21 Sales and Results can be downloaded from our website: www.pernod-ricard.com Audit procedures have been carried out on the financial statements. The Statutory Auditors’ report will be issued after examination of the management report and completion of procedures required for the filing of the Universal registration document.”
Definitions and reconciliation of non-IFRS measures to IFRS measures Pernod Ricard’s management process is based on the following non-IFRS measures which are chosen for planning and reporting. The Group’s management believes these measures provide valuable additional information for users of the financial statements in understanding the Group’s performance. These non-IFRS measures should be considered as complementary to the comparable IFRS measures and reported movements therein. Organic growth Organic growth is calculated after excluding the impacts of exchange rate movements and acquisitions and disposals. Exchange rates impact is calculated by translating the current year results at the prior year’s exchange rates. For acquisitions in the current year, the post-acquisition results are excluded from the organic movement calculations. For acquisitions in the prior year, post-acquisition results are included in the prior year but are included in the organic movement calculation from the anniversary of the acquisition date in the current year. Where a business, brand, brand distribution right or agency agreement was disposed of, or terminated, in the prior year, the Group, in the organic movement calculations, excludes the results for that business from the prior year. For disposals or terminations in the current year, the Group excludes the results for that business from the prior year from the date of the disposal or termination. This measure enables to focus on the performance of the business which is common to both years and which represents those measures that local managers are most directly able to influence. Profit from recurring operations Profit from recurring operations corresponds to the operating profit excluding other non-current operating income and expenses.
About Pernod Ricard Pernod Ricard is the No.2 worldwide producer of wines and spirits with consolidated sales of €8,824 million in FY21. Created in 1975 by the merger of Ricard and Pernod, the Group has developed through organic growth and acquisitions: Seagram (2001), Allied Domecq (2005) and Vin&Sprit (2008). Pernod Ricard, which owns 16 of the Top 100 Spirits Brands, holds one of the most prestigious and comprehensive brand portfolios in the industry, including: Absolut Vodka, Ricard pastis, Ballantine’s, Chivas Regal, Royal Salute, and The Glenlivet Scotch whiskies, Jameson Irish whiskey, Martell cognac, Havana Club rum, Beefeater gin, Malibu liqueur, Mumm and Perrier-Jouët champagnes, as well Jacob’s Creek, Brancott Estate, Campo Viejo, and Kenwood wines. Pernod Ricard’s brands are distributed across 160+ markets and by its own salesforce in 73 markets. The Group’s decentralised organisation empowers its 19,000 employees to be true on-the-ground ambassadors of its vision of “Créateurs de Convivialité.” As reaffirmed by the Group’s strategic plan, “Transform and Accelerate,” deployed in 2018, Pernod Ricard’s strategy focuses on investing in long-term, profitable growth for all stakeholders. The Group remains true to its three founding values: entrepreneurial spirit, mutual trust, and a strong sense of ethics, as illustrated by the 2030 Sustainability and Responsibility roadmap supporting the United Nations Sustainable Development Goals (SDGs), “Good times from a good place.” In recognition of Pernod Ricard’s strong commitment to sustainable development and responsible consumption, it has received a Gold rating from Ecovadis. Pernod Ricard is also a United Nation’s Global Compact LEAD company. Pernod Ricard is listed on Euronext (Ticker: RI; ISIN Code: FR0000120693) and is part of the CAC 40 and Eurostoxx 50 indices.
Contacts Julia Massies / VP, Financial Communications & Investor Relations +33 (0) 1 70 93 17 03 Charly Montet / Investor Relations Manager +33 (0) 1 70 93 17 13 Emmanuel Vouin / Head of External Engagement +33 (0) 1 70 93 16 34
- 5 -
FY21 Full-year Sales and Results Press release - Paris, 1 September 2021
Appendices
Emerging Markets
Asia-Rest of World Americas Europe
Algeria Malaysia Argentina Albania
Angola Mongolia Bolivia Armenia
Cambodia Morocco Brazil Azerbaijan
Cameroon Mozambique Caribbean Belarus
China Namibia Chile Bosnia
Congo Nigeria Colombia Bulgaria
Egypt Persian Gulf Costa Rica Croatia
Ethiopia Philippines Cuba Georgia
Gabon Senegal Dominican Republic Hungary
Ghana South Africa Ecuador Kazakhstan
India Sri Lanka Guatemala Kosovo
Indonesia Syria Honduras Latvia
Iraq Tanzania Mexico Lithuania
Ivory Coast Thailand Panama Macedonia
Jordan Tunisia Paraguay Moldova
Kenya Turkey Peru Montenegro
Laos Uganda Puerto Rico Poland
Lebanon Vietnam Uruguay Romania
Madagascar Zambia Venezuela Russia
Serbia
Ukraine
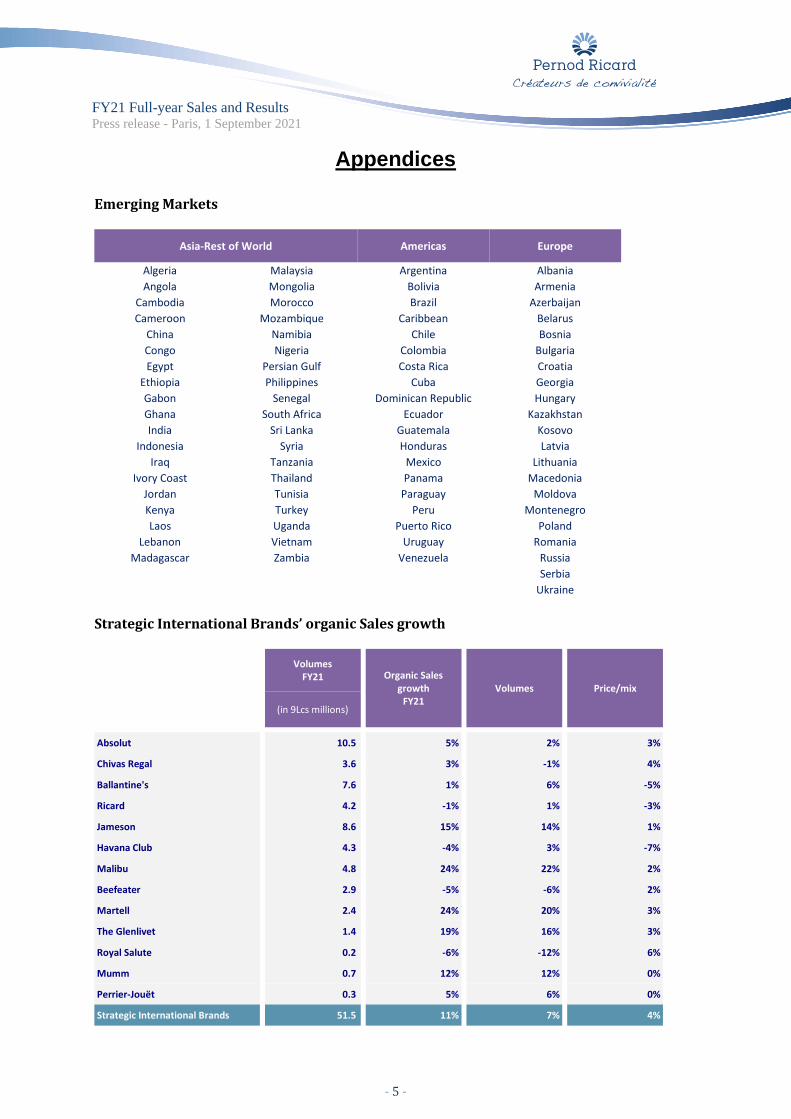
Strategic International Brands’ organic Sales growth
Volumes FY21
Organic Sales growth
FY21
Volumes
Price/mix
(in 9Lcs millions)
Absolut 10.5 5% 2% 3%
Chivas Regal 3.6 3% -1% 4%
Ballantine's 7.6 1% 6% -5%
Ricard 4.2 -1% 1% -3%
Jameson 8.6 15% 14% 1%
Havana Club 4.3 -4% 3% -7%
Malibu 4.8 24% 22% 2%
Beefeater 2.9 -5% -6% 2%
Martell 2.4 24% 20% 3%
The Glenlivet 1.4 19% 16% 3%
Royal Salute 0.2 -6% -12% 6%
Mumm 0.7 12% 12% 0%
Perrier-Jouët 0.3 5% 6% 0%
Strategic International Brands 51.5 11% 7% 4%

- 6 -
FY21 Full-year Sales and Results Press release - Paris, 1 September 2021
Sales Analysis by Period and Region
Net Sales (€ millions)
FY20 FY21 Change Organic Growth Group Structure Forex impact
Americas 2,449 29.0% 2,627 29.8% 178 7% 336 14% 85 3% (244) -10%
Asia / Rest of World 3,467 41.0% 3,640 41.2% 173 5% 372 11% 1 0% (201) -6%
Europe 2,532 30.0% 2,557 29.0% 26 1% 101 4% (11) 0% (64) -3%
World 8,448 100.0% 8,824 100.0% 376 4% 810 10% 75 1% (508) -6%
Net Sales (€ millions)
Q4 FY20 Q4 FY21 Change Organic Growth Group Structure Forex impact
Americas 411 33.2% 633 33.6% 222 54% 255 64% 17 4% (50) -12%
Asia / Rest of World 368 29.8% 635 33.7% 266 72% 278 76% 1 0% (12) -3%
Europe 458 37.0% 616 32.7% 157 34% 158 35% (1) 0% 0 0%
World 1,238 100.0% 1,883 100.0% 646 52% 691 57% 16 1% (62) -5%
Net Sales (€ millions)
H2 FY20 H2 FY21 Change Organic Growth Group Structure Forex impact
Americas 988 33.2% 1,225 31.9% 237 24% 315 33% 38 4% (116) -12%
Asia / Rest of World 1,052 35.4% 1,513 39.4% 461 44% 521 50% 0 0% (61) -6%
Europe 934 31.4% 1,101 28.7% 168 18% 184 20% (4) 0% (12) -1%
World 2,974 100.0% 3,839 100.0% 865 29% 1,019 35% 35 1% (189) -6%
Summary Consolidated Income Statement
(€ millions) FY20 FY21 Change
Net sales 8,448 8,824 4%
Gross Margin after logistics costs 5,086 5,293 4%
Advertising and promotion expenses (1,327) (1,393) 5%
Contribution after A&P expenditure 3,759 3,900 4%
Structure costs (1,499) (1,477) -1%
Profit from recurring operations 2,260 2,423 7%
Financial income/(expense) from recurring operations (328) (262) -20%
Corporate income tax on items from recurring operations (468) (526) 12%
Net profit from discontinued operations, non-controlling interests and share of net income from associates
(25) (24) -4%
Group share of net profit from recurring operations 1,439 1,612 12%
Other operating income & expenses (1,283) (62) NA
Financial income/(expense) from non-recurring operations (38) (109) NA
Corporate income tax on items from non recurring operations 210 (142) NA
Non controlling interests (non-recurring) 6 NA
Group share of net profit 329 1,305 NA
Non-controlling interests 21 13 -37%
Net profit 350 1,318 NA
- 7 -
FY21 Full-year Sales and Results Press release - Paris, 1 September 2021
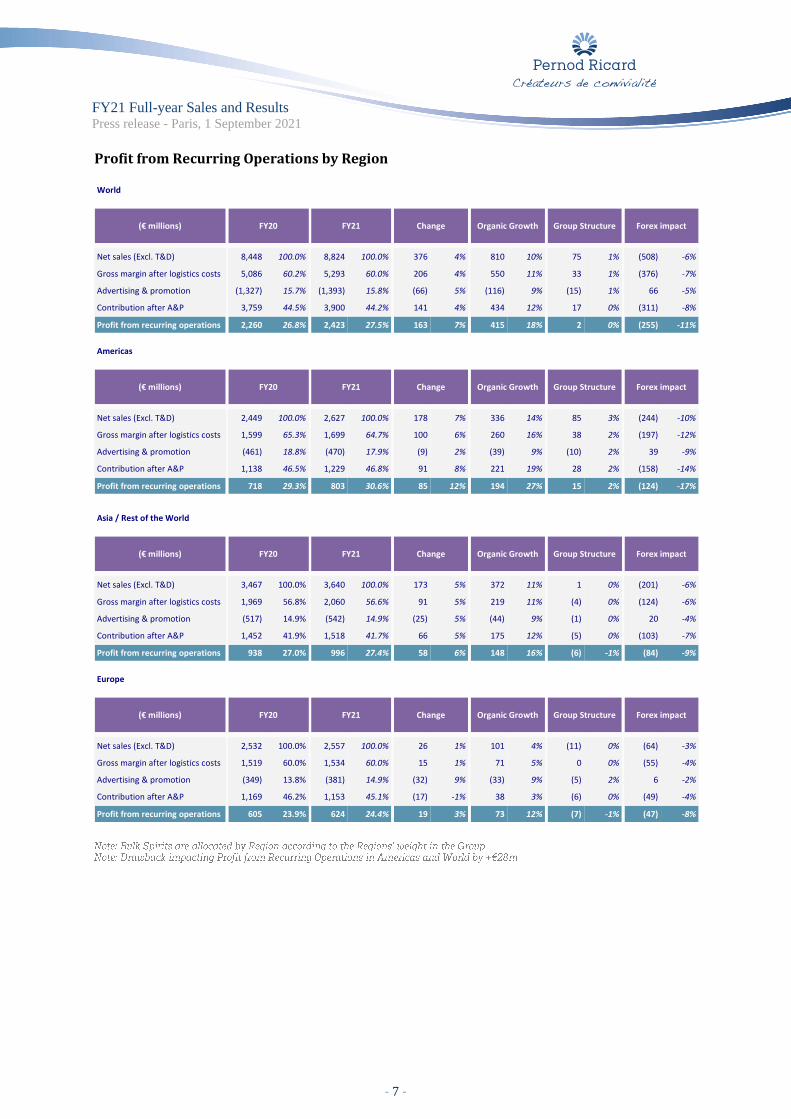
Profit from Recurring Operations by Region World
(€ millions) FY20 FY21 Change Organic Growth Group Structure Forex impact
Net sales (Excl. T&D) 8,448 100.0% 8,824 100.0% 376 4% 810 10% 75 1% (508) -6%
Gross margin after logistics costs 5,086 60.2% 5,293 60.0% 206 4% 550 11% 33 1% (376) -7%
Advertising & promotion (1,327) 15.7% (1,393) 15.8% (66) 5% (116) 9% (15) 1% 66 -5%
Contribution after A&P 3,759 44.5% 3,900 44.2% 141 4% 434 12% 17 0% (311) -8%
Profit from recurring operations 2,260 26.8% 2,423 27.5% 163 7% 415 18% 2 0% (255) -11%
Americas
(€ millions) FY20 FY21 Change Organic Growth Group Structure Forex impact
Net sales (Excl. T&D) 2,449 100.0% 2,627 100.0% 178 7% 336 14% 85 3% (244) -10%
Gross margin after logistics costs 1,599 65.3% 1,699 64.7% 100 6% 260 16% 38 2% (197) -12%
Advertising & promotion (461) 18.8% (470) 17.9% (9) 2% (39) 9% (10) 2% 39 -9%
Contribution after A&P 1,138 46.5% 1,229 46.8% 91 8% 221 19% 28 2% (158) -14%
Profit from recurring operations 718 29.3% 803 30.6% 85 12% 194 27% 15 2% (124) -17%
Asia / Rest of the World
(€ millions) FY20 FY21 Change Organic Growth Group Structure Forex impact
Net sales (Excl. T&D) 3,467 100.0% 3,640 100.0% 173 5% 372 11% 1 0% (201) -6%
Gross margin after logistics costs 1,969 56.8% 2,060 56.6% 91 5% 219 11% (4) 0% (124) -6%
Advertising & promotion (517) 14.9% (542) 14.9% (25) 5% (44) 9% (1) 0% 20 -4%
Contribution after A&P 1,452 41.9% 1,518 41.7% 66 5% 175 12% (5) 0% (103) -7%
Profit from recurring operations 938 27.0% 996 27.4% 58 6% 148 16% (6) -1% (84) -9%
Europe
(€ millions) FY20 FY21 Change Organic Growth Group Structure Forex impact
Net sales (Excl. T&D) 2,532 100.0% 2,557 100.0% 26 1% 101 4% (11) 0% (64) -3%
Gross margin after logistics costs 1,519 60.0% 1,534 60.0% 15 1% 71 5% 0 0% (55) -4%
Advertising & promotion (349) 13.8% (381) 14.9% (32) 9% (33) 9% (5) 2% 6 -2%
Contribution after A&P 1,169 46.2% 1,153 45.1% (17) -1% 38 3% (6) 0% (49) -4%
Profit from recurring operations 605 23.9% 624 24.4% 19 3% 73 12% (7) -1% (47) -8%
- 8 -
FY21 Full-year Sales and Results Press release - Paris, 1 September 2021
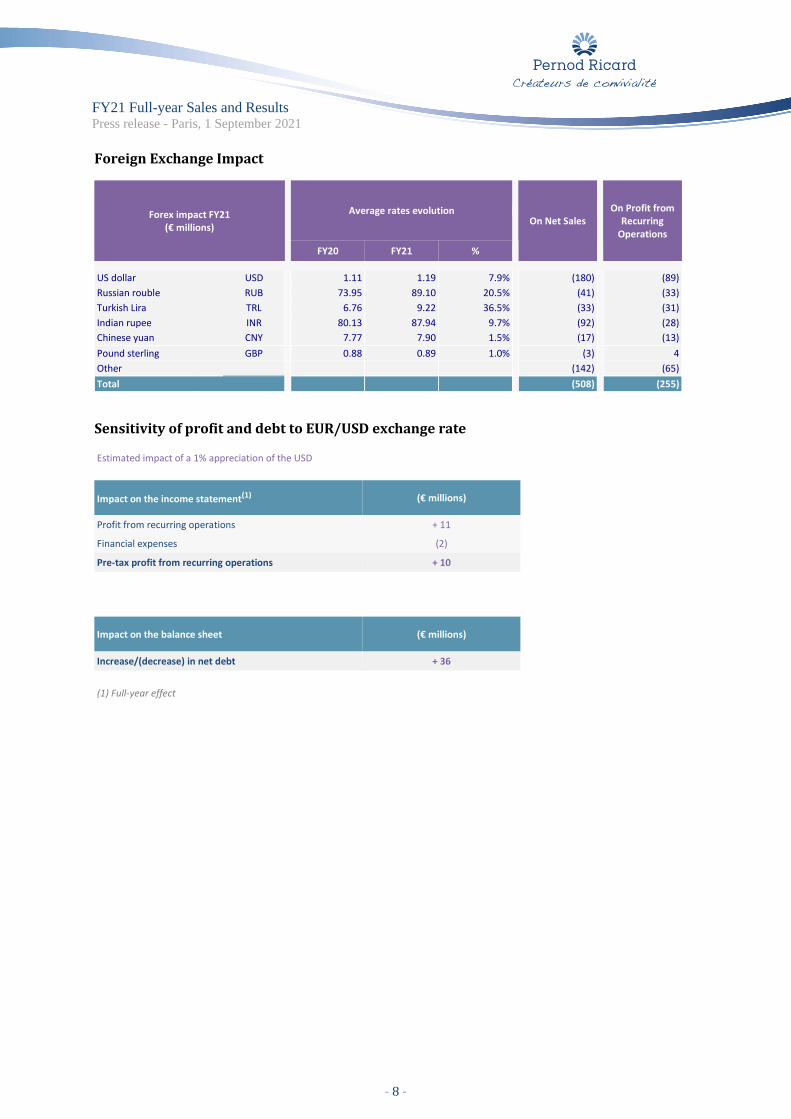
Foreign Exchange Impact
Forex impact FY21 (€ millions)
Average rates evolution On Net Sales
On Profit from Recurring
Operations
FY20 FY21 %
US dollar USD 1.11 1.19 7.9% (180) (89)
Russian rouble RUB 73.95 89.10 20.5% (41) (33)
Turkish Lira TRL 6.76 9.22 36.5% (33) (31)
Indian rupee INR 80.13 87.94 9.7% (92) (28)
Chinese yuan CNY 7.77 7.90 1.5% (17) (13)
Pound sterling GBP 0.88 0.89 1.0% (3) 4
Other (142) (65)
Total (508) (255)
Sensitivity of profit and debt to EUR/USD exchange rate Estimated impact of a 1% appreciation of the USD
Impact on the income statement(1) (€ millions)
Profit from recurring operations + 11
Financial expenses (2)
Pre-tax profit from recurring operations + 10
Impact on the balance sheet (€ millions)
Increase/(decrease) in net debt + 36
(1) Full-year effect

- 9 -
FY21 Full-year Sales and Results Press release - Paris, 1 September 2021
Balance Sheet
Assets 30/06/2020 30/06/2021
(€ millions)
(Net book value)
Non-current assets
Intangible assets and goodwill 16,576 16,230
Tangible assets and other assets 3,699 3,963
Deferred tax assets 1,678 1,623
Total non-current assets 21,953 21,816
Current assets
Inventories 6,167 6,555
aged work-in-progress 5,084 5,373
non-aged work-in-progress 76 84
other inventories 1,006 1,098
Receivables (*) 906 1,126
Trade receivables 862 1,080
Other trade receivables 44 46
Other current assets 323 413
Other operating current assets 317 408
Tangible/intangible current assets 6 6
Tax receivable 142 141
Cash and cash equivalents and current derivatives 1,947 2,086
Total current assets 9,485 10,321
Assets held for sale 87 11
Total assets 31,525 32,147
(*) after disposals of receivables of: 513 592
Liabilities and shareholders’ equity 30/06/2020 30/06/2021
(€ millions)
Group Shareholders’ equity 13,968 14,829
Non-controlling interests 243 246
of which profit attributable to non-controlling interests 21 13
Total Shareholders’ equity 14,211 15,075
Non-current provisions and deferred tax liabilities 3,511 3,555
Bonds non-current 8,599 8,787
Lease liabilities - non current 433 405
Non-current financial liabilities and derivative instruments 192 108
Total non-current liabilities 12,735 12,854
Current provisions 222 163
Operating payables 1,877 2,337
Other operating payables 1,016 1,134
of which other operating payables 633 724
of which tangible/intangible current payables 383 410
Tax payable 232 282
Bonds - current 723 70
Lease liabilities - current 88 103
Current financial liabilities and derivatives 404 128
Total current liabilities 4,563 4,218
Liabilities held for sale 16 -
Total liabilities and shareholders' equity 31,525 32,147
- 10 -
FY21 Full-year Sales and Results Press release - Paris, 1 September 2021
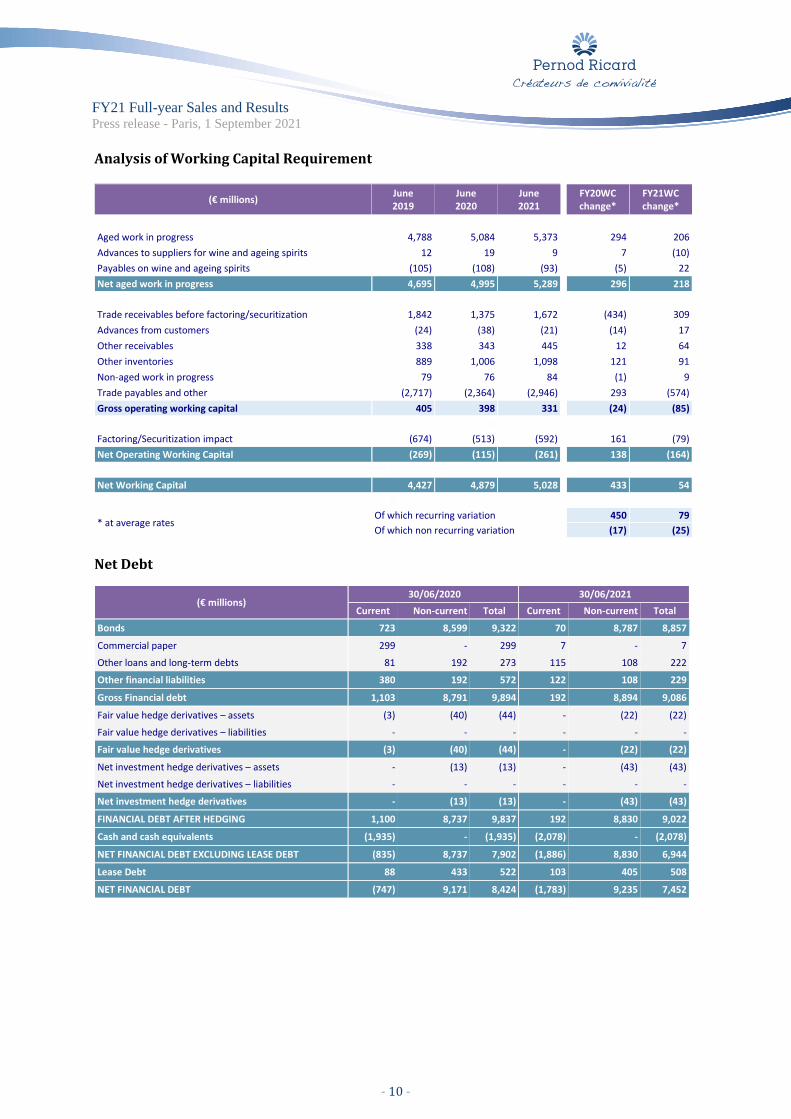
Analysis of Working Capital Requirement
(€ millions) June 2019
June 2020
June 2021
FY20WC change*
FY21WC change*
Aged work in progress 4,788 5,084 5,373 294 206
Advances to suppliers for wine and ageing spirits 12 19 9 7 (10)
Payables on wine and ageing spirits (105) (108) (93) (5) 22
Net aged work in progress 4,695 4,995 5,289 296 218
Trade receivables before factoring/securitization 1,842 1,375 1,672 (434) 309
Advances from customers (24) (38) (21) (14) 17
Other receivables 338 343 445 12 64
Other inventories 889 1,006 1,098 121 91
Non-aged work in progress 79 76 84 (1) 9
Trade payables and other (2,717) (2,364) (2,946) 293 (574)
Gross operating working capital 405 398 331 (24) (85)
0
Factoring/Securitization impact (674) (513) (592) 161 (79)
Net Operating Working Capital (269) (115) (261) 138 (164)
0
Net Working Capital 4,427 4,879 5,028 433 54
0
* at average rates Of which recurring variation 450 79
Of which non recurring variation (17) (25)
Net Debt
(€ millions) 30/06/2020 30/06/2021
Current Non-current Total Current Non-current Total
Bonds 723 8,599 9,322 70 8,787 8,857
Commercial paper 299 - 299 7 - 7
Other loans and long-term debts 81 192 273 115 108 222
Other financial liabilities 380 192 572 122 108 229
Gross Financial debt 1,103 8,791 9,894 192 8,894 9,086
Fair value hedge derivatives – assets (3) (40) (44) - (22) (22)
Fair value hedge derivatives – liabilities - - - - - -
Fair value hedge derivatives (3) (40) (44) - (22) (22)
Net investment hedge derivatives – assets - (13) (13) - (43) (43)
Net investment hedge derivatives – liabilities - - - - - -
Net investment hedge derivatives - (13) (13) - (43) (43)
FINANCIAL DEBT AFTER HEDGING 1,100 8,737 9,837 192 8,830 9,022
Cash and cash equivalents (1,935) - (1,935) (2,078) - (2,078)
NET FINANCIAL DEBT EXCLUDING LEASE DEBT (835) 8,737 7,902 (1,886) 8,830 6,944
Lease Debt 88 433 522 103 405 508
NET FINANCIAL DEBT (747) 9,171 8,424 (1,783) 9,235 7,452

- 11 -
FY21 Full-year Sales and Results Press release - Paris, 1 September 2021
Change in Net Debt
(€ millions) 30/06/2020 30/06/2021
Operating profit 978 2,361
Depreciation and amortisation 350 367
Net change in impairment of goodwill, PPE and intangible assets 1,007 78
Net change in provisions 97 (80)
Changes in fair value on commercial derivatives and biological assets (3) 1
Net (gain)/loss on disposal of assets (27) (16)
Share-based payments 23 28
Self-financing capacity before interest and tax 2,423 2,738
Decrease / (increase) in working capital requirements (433) (54)
Net interest and tax payments (809) (686)
Net acquisitions of non financial assets and others (352) (370)
Free Cash Flow 830 1,628
of which recurring Free Cash Flow 1,003 1,745
Net acquitions of financial assets and activities and others (587) (116)
Dividends paid (849) (704)
(Acquisition) / Disposal of treasury shares and others (526) (20)
Decrease / (increase) in net debt (before currency translation adjustments) (1,132) 788
Foreign currency translation adjustment (69) 265
Non cash impact on lease liabilities (603) (81)
Decrease / (increase) in net debt (after currency translation adjustments and IFRS 16 non cash impacts)
(1,804) 972
Initial net debt (6,620) (8,424)
Final net debt (8,424) (7,452)
Net Debt Maturity at 30 June 2021 € billions
0.7
1.0
1.7
1.11.0 1.0
0.8
0.5
0.7
0.4
0.2
- - - - -
-2.1
0.0
-2.1
-1.6
-1.1
-0.6
-0.1
0.4
0.9
1.4
20/21 21/22 22/23 23/24 24/25 25/26 26/27 27/28 28/29 29/30 30/31 31/32 … 41/42 … 50/51
Cash Other debts Commercial paper Bonds Syndicated credit
- 12 -
FY21 Full-year Sales and Results Press release - Paris, 1 September 2021
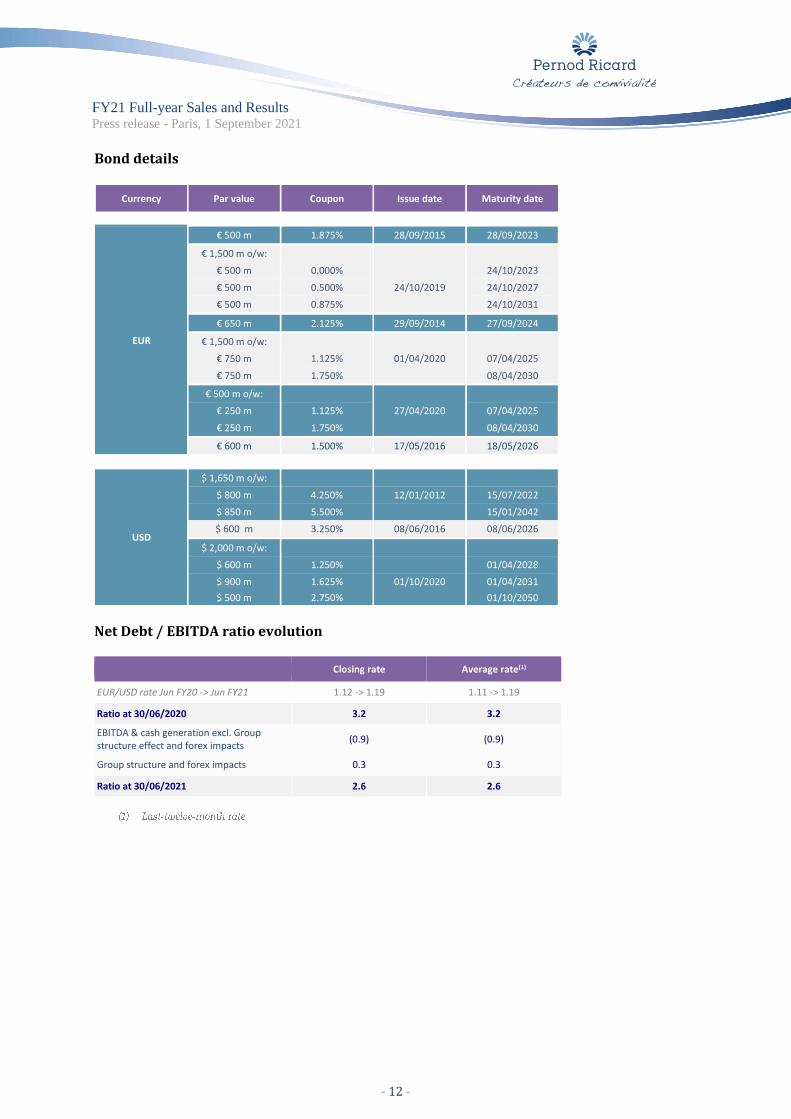
Bond details
Currency Par value Coupon Issue date Maturity date
EUR
€ 500 m 1.875% 28/09/2015 28/09/2023
€ 1,500 m o/w:
€ 500 m 0.000%
24/10/2019
24/10/2023
€ 500 m 0.500% 24/10/2027
€ 500 m 0.875% 24/10/2031
€ 650 m 2.125% 29/09/2014 27/09/2024
€ 1,500 m o/w:
01/04/2020
€ 750 m 1.125% 07/04/2025
€ 750 m 1.750% 08/04/2030
€ 500 m o/w:
27/04/2020
€ 250 m 1.125% 07/04/2025
€ 250 m 1.750% 08/04/2030
€ 600 m 1.500% 17/05/2016 18/05/2026
USD
$ 1,650 m o/w:
$ 800 m 4.250% 12/01/2012 15/07/2022
$ 850 m 5.500% 15/01/2042
$ 600 m 3.250% 08/06/2016 08/06/2026
$ 2,000 m o/w:
$ 600 m 1.250% 01/04/2028
$ 900 m 1.625% 01/10/2020 01/04/2031
$ 500 m 2.750% 01/10/2050
Net Debt / EBITDA ratio evolution
Closing rate Average rate(1)
EUR/USD rate Jun FY20 -> Jun FY21 1.12 -> 1.19 1.11 -> 1.19
Ratio at 30/06/2020 3.2 3.2
EBITDA & cash generation excl. Group structure effect and forex impacts
(0.9) (0.9)
Group structure and forex impacts 0.3 0.3
Ratio at 30/06/2021 2.6 2.6

- 13 -
FY21 Full-year Sales and Results Press release - Paris, 1 September 2021
Diluted EPS calculation
(x 1,000) FY20 FY21
Number of shares in issue at end of period 265,422 261,877
Weighted average number of shares in issue (pro rata temporis) 265,422 262,143
Weighted average number of treasury shares (pro rata temporis) (2,564) (1,347)
Dilutive impact of stock options and performance shares 1,179 718
Number of shares used in diluted EPS calculation 264,037 261,514
(€ millions and €/share) FY20 FY21 reported
Group share of net profit from recurring operations 1,439 1,612 12.0%
Diluted net earnings per share from recurring operations 5.45 6.16 13.1%
Upcoming Communications