excess air control in boiler - sameeekshasameeeksha.org/pdf/dpr/pal_txt5.pdf · bee, 2010 detailed...
TRANSCRIPT

DETAILED PROJECT REPORT ON
INSTALLATION OF SYSTEM FOR CONTROL OF EXCESS AIR IN BOILER
(PALI TEXTILE CLUSTER)
Reviewed By Prepared by
Bureau of Energy Efficiency

INSTALLATION OF SYSTEM FOR CONTROL OF EXCESS AIR IN
BOILER
PALI TEXTILE CLUSTER

BEE, 2010
Detailed Project Report on Installation of System for Control of Excess Air In Boiler
Textile SME Cluster, Pali, Rajasthan (India)
New Delhi: Bureau of Energy Efficiency;
Detail Project Report No.: PAL/TXT/EAC/05
For more information Telephone +91-11-26179699
Bureau of Energy Efficiency (BEE) Fax+91-11-26178352
(Ministry of Power, Government of India) Websites: www.bee-india.nic.in
4th Floor,Sewa Bhawan Email: [email protected]/
R. K. Puram, New Delhi – 110066 [email protected]

Acknowledgement
We sincerely appreciate the efforts of industry, energy auditors, equipment manufacturers,
technology providers, consultants and other experts in the area of energy conservation for
joining hands with Bureau of Energy Efficiency (BEE), Ministry of Power, Government of
India for preparing the Detailed Project Report (DPR) under BEE SME Program in SMEs
clusters. We appreciate the support of suppliers/vendors for providing the adoptable energy
efficient equipments/technical details to the SMEs.
We have received very encouraging feedback for the BEE SME Program in various SME
Clusters. Therefore, it was decided to bring out the DPR for the benefits of SMEs. We
sincerely thank the officials of BEE, Executing Agencies and ISTSL for all the support and
cooperation extended for preparation of the DPR. We gracefully acknowledge the diligent
efforts and commitments of all those who have contributed in preparation of the DPR.

CONTENTS
List of Annexures…………………………………………………………………………...……….vii
List of Figures…………………………………………………………………………………..…...vii
List of Tables…………………………………………………………………………...……….......viii
List of abbreviations………………..……………………..………………...…..…....……………viii
Executive summary………….…………..……..………………….......…...…….………………..ix
About Bee’s SME Program…………………..…...……………..……………………. ………….xi
1.0 INTRODUCTION ...................................................................................................... 1
1.1 Brief Introduction about Cluster ................................................................................. 1
1.1.1 Energy usages pattern .............................................................................................. 2
1.1.2 Classification of Units ............................................................................................... 3
1.1.3 Production process of Textile dyeing and finishing.................................................... 3
1.2 Energy performance in existing situation .................................................................. 8
1.2.1 Average production ................................................................................................... 8
1.2.2 Fuel consumption ..................................................................................................... 8
1.2.3 Specific Energy Consumption (SEC) ........................................................................ 8
1.3 Identification of technology/equipment .....................................................................10
1.3.1 Description of technology/ equipment ......................................................................10
1.3.2 Role in process ........................................................................................................12
1.3.3 Energy audit methodology .......................................................................................14
1.3.4 Design and operating parameters specification .......................................................15
1.3.5 Operating efficiency analysis ...................................................................................17
1.4 Barriers in adoption of proposed technology/equipment ..........................................17
1.4.1 Technological Barrier ...............................................................................................18
1.4.2 Financial Barrier ......................................................................................................18
1.4.3 Skilled manpower ....................................................................................................19
1.4.4 Other barrier (If any) ................................................................................................19
2.0 PROPOSED EQUIPMENT ......................................................................................20
2.1 Detailed description of technology proposed............................................................20
2.1.1 Equipment specification ...........................................................................................22
2.1.2 Suitability over existing equipment ...........................................................................22
2.1.3 Superiority over existing equipment .........................................................................22
2.1.4 Availability of equipment ..........................................................................................22
2.1.5 Source of equipment ................................................................................................22
2.1.6 Technical specification of equipment .......................................................................22
2.1.7 Terms and conditions in sales of equipment ............................................................22
2.1.8 Process down time during implementation ...............................................................22
2.2 Life cycle assessment and risks analysis .................................................................23
2.3 Suitable Unit for Implementation of Proposed Technology .......................................23
3.0 ECONOMIC BENEFITS FROM PROPOSED EQUIPMENT ....................................24
3.1 Technical benefit .....................................................................................................24
3.1.1 Fuel saving ..............................................................................................................24
3.1.2 Electricity saving ......................................................................................................24
3.1.3 Improvement in product quality ................................................................................24
3.1.4 Increase in production .............................................................................................24
3.1.5 Reduction in raw material ........................................................................................24
3.1.6 Reduction in other losses.........................................................................................24
3.2 Monetary benefits ....................................................................................................24
3.3 Social benefits .........................................................................................................24
3.3.1 Improvement in working environment in the plant ....................................................24
3.3.2 Improvement in workers skill ....................................................................................24
3.4 Environmental benefits ............................................................................................25
3.4.1 Reduction in effluent generation ..............................................................................25
3.4.2 Reduction in GHG emission .....................................................................................25
3.4.3 Reduction in other emissions like SOX .....................................................................25
4.0 INSTALLATION OF PROPOSED EQUIPMENT .....................................................26
4.1 Cost of equipment implementation ...........................................................................26
4.1.1 Equipments cost ......................................................................................................26
4.1.2 Erection, commissioning and other misc. cost .........................................................26
4.2 Arrangements of funds ............................................................................................26
4.2.1 Entrepreneur’s contribution ......................................................................................26
4.2.2 Loan amount. ...........................................................................................................26
4.2.3 Terms & conditions of loan ......................................................................................26
4.3 Financial indicators ..................................................................................................26
4.3.1 Cash flow analysis ...................................................................................................26
4.3.2 Simple payback period ............................................................................................27
4.3.3 Net Present Value (NPV) .........................................................................................27
4.3.4 Internal rate of return (IRR) ......................................................................................27
4.3.5 Return on investment (ROI) .....................................................................................27
4.4 Sensitivity analysis ...................................................................................................28
4.5 Procurement and Implementation Schedule ............................................................28

vii
List of Annexures
Annexure -1: Information Brochure of equipment ..............................................................29
Annexure -2: Detailed financial analysis ............................................................................31
Annexure -3: Details of procurement and implementation .................................................35
Annexure 4: Detailed equipment assessment report ........................................................36
Annexure -5: Details of equipment service providers .........................................................38
Annexure - 6Typical arrangement drawings for proposed system .......................................39
Annexure – 7 Quotation for Proposed Technology ..............................................................42
List of Figures
Fig. 1.1 – Pali – Geographical Map ....................................................................................... 1
Fig. 1.2 – Process Flow Diagram of Cotton Dyeing and Printing ........................................... 4
Fig. 1.3 – Process Flow Diagram of Polyester Cotton Dyeing and Finishing .......................... 5
Fig. 1.4 – Process Flow Diagram of Polyester Printing and Finishing .................................... 6
Fig. 1.5 – Process Flow Diagram of Polyester Cotton Dyeing and Finishing .......................... 7
Fig. 1.7 – Schematic of air flow in stenter ............................................................................ 10
Fig. 1.6 – Typical Arrangement for steam generation and distribution in process heating .... 10
Fig. 1.7 – Typical Arrangement of tubes in Boiler ................................................................ 11
Fig. 1.8 – Combustion and heat transfer to water tubes in a multi pass boiler ..................... 11
Fig. 1.9 – Typical Arrangement of tubes in Boiler ................................................................ 12
Fig. 1.10 Sankey Diagram for a typical boiler ...................................................................... 14
Fig. 1.11 Energy Audit methodologies ................................................................................. 15

viii
List of Tables
Table1.1 Details of annual energy consumption scenario at Pali Textile Cluster .................. 2
Table 1.2 Annual productions from a typical unit .................................................................. 8
Table 1.3 Annual energy consumption ................................................................................. 8
Table 1.4 Specific Energy Consumption Values ................................................................... 8
Table 1.5 Specific energy consumption ................................................................................ 9
Table 1.5 Relation between Stack temperature and oxygen concentrations ........................16
Table 4.1 Details of proposed equipment installation cost ...................................................26
Table 4.2 Financial indicators of proposed technology ........................................................27
Table 4.3 Sensitivity analysis in different scenario ...............................................................28
List of Abbreviations
� BEE - Bureau of Energy Efficiency
� DPR - Detailed Project Report
� DSCR - Debt Service Coverage Ratio
� FD - Forced Draft
� GHG - Green House Gases
� HP - Horse Power
� IRR - Internal Rate of Return
� MoP - Ministry of Power
� MSME - Micro Small and Medium Enterprises
� NPV - Net Present Value
� ROI - Return On Investment
� SME - Small and Medium Enterprises
� WHR - Waste Heat Recovery
� CERs - Certified Emission Reduction

ix
EXECUTIVE SUMMARY
Pali has evolved as one of the most important production centers in the Textile Dyeing and
Finishing sector despite there being nothing favorable for proliferation of a cluster. The place
lacks all possible resources, from raw materials to fuels, Dyes & Chemicals and above all
water which is the most important for processing of textiles. Today there are over 350 units
in Pali alone and the production of all of these combined together crosses 5.5 million meter
per day mark.
All the Industries in Pali cluster are in SME sector. These Industries process Manmade
Fiber, Natural Fiber and blends. The units mainly process lower value clothes and the
quality of fabric used is less than 100gm per RM. Few units have their own brand. Most of
the units do job work for traders and the job works are also done process wise. Thus there
are different units specializing in a particular process.
The process adopted by the units can be divided into three major classes –
a. Pre treatment
b. Dyeing and Printing
c. Finishing
The majority of units mainly do hand processing and a few (less than 20%) units do power
processing. However, the output of the power process units far exceeds those of hand
processing units.
Energy forms a major chunk of the processing cost with over 30% weightage in the cost
basket. As per the preliminary and detailed energy audit findings, there exists potential of
saving over 20% electricity and 30% fuel in the applications in power process industries with
over all general pay back period of less than one year. Hand process industries are very
less energy intensive, though, there also exists a saving potential of over 20%. The payback
period in these industries is higher due to their working schedule and lower utilization of
facilities.
The units in Pali cluster use disperse dyes for coloration of Polyester fabric or polyester
contained in blends. Heat setting is necessary in these textiles and also finishing after
Dyeing – Washing or Printing – Dye Fixation – Washing processes. Stenter is used for the
two processes and this is very energy intensive process. Going by connected load and also
by the absolute electricity consumption in textile dyeing and processing units, stenter
happens to have a share upwards of 50%.

x
During Energy Audit, none of the boilers except one were found to be equipped with Auto
Excess Air Control System. Even, awareness about the Excess Air control System was very
low. Installation of proposed technology would save about 98.06 MT RPC per year.
This DPR highlights the details of the study conducted for assessing the potential for
installation Automatic excess air control system in boiler, possible Energy saving, and its
monetary benefit, availability of the technologies/design, local service providers, technical
features & proposed equipment specifications, various barriers in implementation,
environmental aspects, estimated GHG reductions, capital cost, financial analysis, and
schedule of Project Implementation.
Total investment required and financial indicators calculated such as monetary saving, IRR,
NPV, DSCR and ROI etc for proposed technology is furnished in Table below:
S.No Particular Unit Value
1 Project cost ` (in Lakh) 3.0
2 Fuel Saving (RPC) MT/year 98.06
3 Monetary benefit ` (in Lakh) 7.35
4 Debit equity ratio Ratio 3:1
5 Simple payback period Months 5
6 NPV ` (in Lakh) 24.92
7 IRR % age 217.50
8 ROI % age 29.51
9 DSCR ratio 10.24
10 CO2 saving MT 243
11 Process down time Days 6
The projected profitability and cash flow statements indicate that the project implementation
will be financially viable and technically feasible.

xi
ABOUT BEE’S SME PROGRAM
Bureau of Energy Efficiency (BEE) is implementing a BEE-SME Programme to improve the
energy performance in 25 selected SMEs clusters. Pali Textile Cluster is one of them. The
BEE’s SME Programme intends to enhance the energy efficiency awareness by
funding/subsidizing need based studies in SME clusters and giving energy conservation
recommendations. For addressing the specific problems of these SMEs and enhancing
energy efficiency in the clusters, BEE will be focusing on energy efficiency, energy
conservation and technology up gradation through studies and pilot projects in these SMEs
clusters.
Major activities in the BEE -SME program are furnished below:
Activity 1: Energy Use and Technology Audit
The energy use technology studies would provide information on technology status, best
operating practices, gaps in skills and knowledge on energy conservation opportunities,
energy saving potential and new energy efficient technologies, etc for each of the sub sector
in SMEs.
Activity 2: Capacity Building of Stake Holders in Cluster on Energy Efficiency
In most of the cases SME entrepreneurs are dependent on the locally available
technologies, service providers for various reasons. To address this issue BEE has also
undertaken capacity building of local service providers and entrepreneurs/ managers of
SMEs on energy efficiency improvement in their units as well as clusters. The local service
providers will be trained in order to be able to provide the local services in setting of energy
efficiency projects in the clusters
Activity 3: Implementation of Energy Efficiency Measures
To implement the technology up gradation projects in clusters, BEE has proposed to
prepare the technology based detailed project reports (DPRs) for a minimum of five
technologies in three capacities for each technology.
Activity 4: Facilitation of Innovative Financing Mechanisms for Implementation of
Energy Efficiency Projects
The objective of this activity is to facilitate the uptake of energy efficiency measures through
innovative financing mechanisms without creating market distortion.

Installation of Automatic Excess Air control system (Oxygen Trim) in Boiler
1
1.0 INTRODUCTION
1.1 Brief Introduction about Cluster
Pali is the District Head Quarter of the Pali District situated at a distance of approx. 300 KMs
from Jaipur and 70 KMs from Jodhpur. Pali can also be reached from Ahmedabad via Abu
Road and has direct train connectivity to Ahmedabad and Mumbai. The nearest airport
having commercial flights plying is at Jodhpur. The map depicting Pali district and its
distances from various towns is produced below in fig. 1.
Fig. 1.1 – Pali – Geographical Map
Pali District is rich in minerals and the abundance of limestone deposits has made it home
for 5 cement companies. There are several other SME units producing various lime based
products. Despite there being non availability of requisite resources like raw material and
consumables locally, a dense population of textiles dyeing and processing units has sprung
up at Pali.
The Pali textile cluster is one of the biggest SME textile clusters in India having over 350
industries. The units in the cluster are mainly located in two Industrial Areas namely
Industrial Area Phase I & Phase II and Mandia Road Industrial Area. Some of the units
hitherto functioning in residential colonies are in the process of shifting to a new Industrial
Area named Punayata Road Induatrial Area. Over 150 industries are in the process of
setting up their facilities in the Punayata Road Industrial area.

Installation of Automatic Excess Air control system (Oxygen Trim) in Boiler
2
Balotra, Jodhpur and Bhilwara are other textile clusters in Rajasthan. These clusters work
on more or less similar processes and use same machines, though their output differs.
Details of energy consumption scenario at Pali textile cluster are furnished in Table 1.1
below:
Table1.1 Details of annual energy consumption scenario at Pali Textile Cluster
1.1.1 Energy usages pattern
Electrical energy Usage
The Cluster has two types of units – Hand Process and Power Process. Hand Process units
mainly process cotton and consume very less electricity. These units consume electricity in
the range of 4000 kWh to 5000 kWh per month. The hand process units outsource the
finishing to other power process units. Power process units are energy intensive units and
consume electricity in the range of 100000 kWh to 300000 kWh per month. Various
Electricity consuming equipments in the hand process units are Fans, Tube Lights, and
Computers etc. Power Process units have Stenter, Jet Dyeing Machine, Loop Agers, Boiler
and Thermopac auxiliaries, Flat Bed Printing Machines etc. Stenter happens to be the
biggest Electricity guzzler.
Thermal Energy Usage
Hand process units in the cluster are mainly involved in Table Printing, Kier Boiling and Jig
dyeing. Heat for the process is obtained from direct burning of wood. Some units also have
open type stenter wherein heating is done by directly burning wood beneath the clothes.
Power Process units mainly use Thermal Energy Stenters, Kiers, Jet Dyeing Machines,
Sanforizers, Loop Agers, Mercerisers, Scouring, Reduction and Clearance etc. These units
use Residual Pet Coke, Lignite, Coal and Wood in Boilers and Thermopacs to make heat
usable in machines. Typical Power Process Units use 100 MT to 300 MT RPC (85 MTOE to
256 MTOE) per month. The hand process units use 3 MT to 15 MT wood per month.
S. No Type of Fuel Unit Value % contribution (KLOE)
1 Electricity MWh /year 51.3 16.6
2 Firewood MT/year 27161 25.6
3 Steam Coke Tonne/year 2967 5
4 Lignite MT/year 16635 15.7
5 Diesel Klitre/year 89.6 0.3
6 Residual Pet coke Mt/Yr 11820 36.6

Installation of Automatic Excess Air control system (Oxygen Trim) in Boiler
3
1.1.2 Classification of Units
The Textile units in the Pali Cluster can be categorized into two types based on availability
of machinery in the units –
� Hand Process Units and
� Power Process Units
Pali Textile Cluster mainly consists of hand process units and over 250 out of a total
population of 350 units are hand process units. These units are mainly owned by artisans or
traditional colormen (Rangrej).
On the basis of type of cloth processed, the units can be classified as
� Cotton (Natural fiber) Processing Units
� Synthetic clothes (Manmade fibers) Processing Units
Based on output, the units can be classified as
� Dyeing Units
� Printing units
� Finishing Units
Scale of Operation
Most of the units in the Pali textile cluster are micro units. All the units are in Micro, Small or
Medium sector with none of the units being in large scale sector.
Products Manufactured
Different types of products manufactured in Pali Textile Cluster. The marketed products are:
� Sarees (Lower Price Range)
� Rubia Blouse Clothes
� Lungies
� Turbans
� African Prints
1.1.3 Production process of Textile dyeing and finishing
The process adopted in Textile Dyeing and Finishing depends upon the fabric processed.
The processes are different for Cotton, Polyester and Blended fabrics. The process flow

Installation of Automatic Excess Air control system (Oxygen Trim) in Boiler
4
chart for different processes depending upon fabric processed with location of steam
requirement in the process are drawn below –
Fig. 1.2 – Process Flow Diagram of Cotton Dyeing and Printing
Stenter Drying
Printing
Sillicating
Washing
Resin Finishing (Stenter)
Felt Finishing
Packing & Despatch
Grey (Cotton)
Mercerizing
Kier Boiling
Singeing / Desizing
Washing
Scouring / Bleaching
Dyeing
Steam Ager / Decatising

Installation of Automatic Excess Air control system (Oxygen Trim) in Boiler
5
Fig. 1.3 – Process Flow Diagram of Polyester Cotton Dyeing and Finishing
Grey (Polyester Cotton)
Mercerising
Kier Boiling
Scouring / Bleaching
Drying
Polyester Dyeing (Jet Dyeing)
Cotton Dyeing (Jigger)
Heat Setting
Drying
Washing
Finishing
Packing / Despatch

Installation of Automatic Excess Air control system (Oxygen Trim) in Boiler
6
Fig. 1.4 – Process Flow Diagram of Polyester Printing and Finishing
Grey (Polyester)
Jet Dyeing
Washing
Hydro Extractor
Heat Setting (Stenter)
Colour Fixation (Loop Ager)
Washing (Reduction - Clearance)
Printing
Resin Finishing Stenter
Hydro Extraction
Felt Finishing
Packing / Despatch
Cluster Manual - Pali Textile Cluster

Installation of Automatic Excess Air control system (Oxygen Trim) in Boiler
7
Fig. 1.5 – Process Flow Diagram of Polyester Cotton Dyeing and Finishing
Grey (Polyester)
Mercerising
Kier Boiling
Bleaching
Drying
Polyester Dyeing (Jet Dyeing)
Heat Setting
Drying
Hydro Extraction
Finishing
Packing / Despatch

Installation of Automatic Excess Air control system (Oxygen Trim) in Boiler
8
1.2 Energy performance in existing situation
1.2.1 Average production
A typical unit works 5 days a week and the daily production of these units are in the
following Table 1.2 below:
Table 1.2 Annual productions from a typical unit
1.2.2 Fuel consumption
Energy consumption both electrical and thermal by a typical textile dyeing and processing
unit in Pali cluster is given in table 1.3 below:
Table 1.3 Annual energy consumption
1.2.3 Specific Energy Consumption (SEC)
The benchmark available for different processes in textile dyeing and processing industry in
UK is given in Table 1.4 below:
Table 1.4 Specific Energy Consumption Values
S.No. Machine Process Energy Required (GJ/Te)
1 Desizing Unit Desizing 1.0-3.5
2 Kier Scouring/Bleaching 6.0-7.5
3 J-Box Scouring 6.5-10.0
4 Open Width range Scouring/Bleaching 3.0-7.0
5 Low Energy Steam Purge Scouring/Bleaching 1.5-5.0
6 Jig / Winch Scouring 5.0-7.0
Type of product Production (RM/Day)
Scale of Unit Micro Small Medium
Finished Fabric 10000 30000 100000
Energy Electricity
(kWh per year)
Thermal Energy
(MTOE per year)
Scale of Unit Micro Small Medium Micro Small Medium
Consumption 48000 360000 2400000 30 100 300

Installation of Automatic Excess Air control system (Oxygen Trim) in Boiler
9
S.No. Machine Process Energy Required
(GJ/Te)
7 Jig / Winch Bleaching 3.0-6.5
8 Jig Dyeing 1.5-7.0
9 Winch Dyeing 6.0-17.0
10 Jet Dyeing 3.5-16.0
11 Beam Dyeing 7.5-12.5
12 Pad / batch Dyeing 1.5-4.5
13 Continuous / Thermosol Dyeing 7.0-20.0
14 Rotary Screen Printing 2.5-8.5
15 Steam Cylinders Drying 2.5-4.5
16 Stenter Drying 2.5-7.5
17 Stenter Heat Setting 4.0-9.0
18 Package / Yarn Preparation / Dyeing (Cotton) 5.0-18.0
19 Continuous Hank Scouring 3.0-5.0
20 Hank Dyeing 10-16.0
21 Hank Drying 4.5-6.5
SOURCE – CARBONTRUST UK
SEC in Pali Cluster
For the units involved in Processing of Polyester and printing it to make Saree, the Specific
Energy Consumption was observed and furnished in Table 1.5 below:
Table 1.5 Specific energy consumption
S.No Particulars SEC
1 Average Specific Electricity Consumption 1.2 kWh/kg
(Best Observed Value – 0.95 kWh/kg)
2 Average Specific Thermal Energy Consumption 15000 kCal/kg
(Best Observed Value – 10932 kCal/kg)

Installation of Automatic Excess Air control system (Oxygen Trim) in Boiler
10
1.3 Identification of technology/equipment
1.3.1 Description of technology/ equipment
Process of Fabric Dyeing and Processing has been shown in Fig. 1.2 to 1.5. As is obvious,
low temperature heating (Sub 100°C) is required in Scouring, Mercerising, bleaching, Jigger
Dyeing for cotton, Reduction and Clearance. Also, higher temperatures are required in Jet
Dyeing, Dye fixation and calendaring / Felt finishing. These processes heating are
accomplished with steam and hence Boilers are an integral part of any process house. Units
in Pali Textile Cluster have boilers of capacities 1 TPH to 4 TPH. Most of these boilers are
package boilers having water wall at the back of the boiler serving as economizer.
Most of the Boilers in the Pali Textile Cluster were designed to operate on pulverized lignite
or lump steam coal. Due to ban on Lignite supply from Gujarat, the units have shifted to
RPC (Residual Pet Coke) supplied by Reliance industries Ltd.
For the purpose of fuel switching, the combustion was converted to bubbling fluidized bed
and the lime bed was created to take care of high Sulphur content in the fuel. However, the
conversion was done without engineering the system eroding combustion efficiency to lower
levels.
Typical Steam Production and Distribution system is depicted in following sketch:-
Fig. 1.7 – Schematic of air flow in stenter
Fig. 1.6 – Typical Arrangement for steam generation and distribution in process
heating
Installation of Automatic Excess Air control system (Oxygen Trim) in Boiler
11
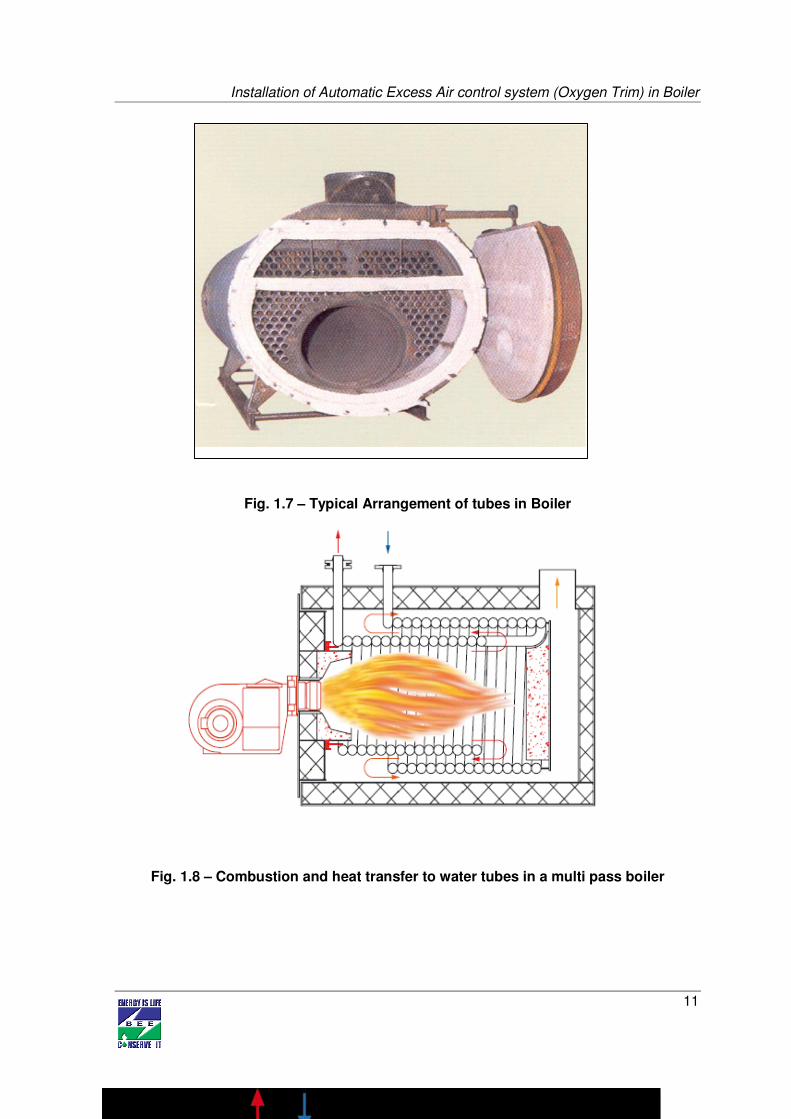
Fig. 1.7 – Typical Arrangement of tubes in Boiler
Fig. 1.8 – Combustion and heat transfer to water tubes in a multi pass boiler

Installation of Automatic Excess Air control system (Oxygen Trim) in Boiler
12
Fig. 1.9 – Typical Arrangement of tubes in Boiler
The typical specification is attached as Annexure 6.
1.3.2 Role in process
Steam is used as heating medium in all processes other than stenter drying / finishing
process. Processes requiring steam in a textile process house are Jigger Dyeing, Jet
Dyeing, Scouring, Mercerising, Bleaching, Reduction and Clearance, Washing and
shrinkage / Sanforizing.
Typically, boilers in Pali Cluster raise steam to a pressure of 6kg/Cm2 to 10kg/Cm2 and then
used in the process.
Energy Consumption details:
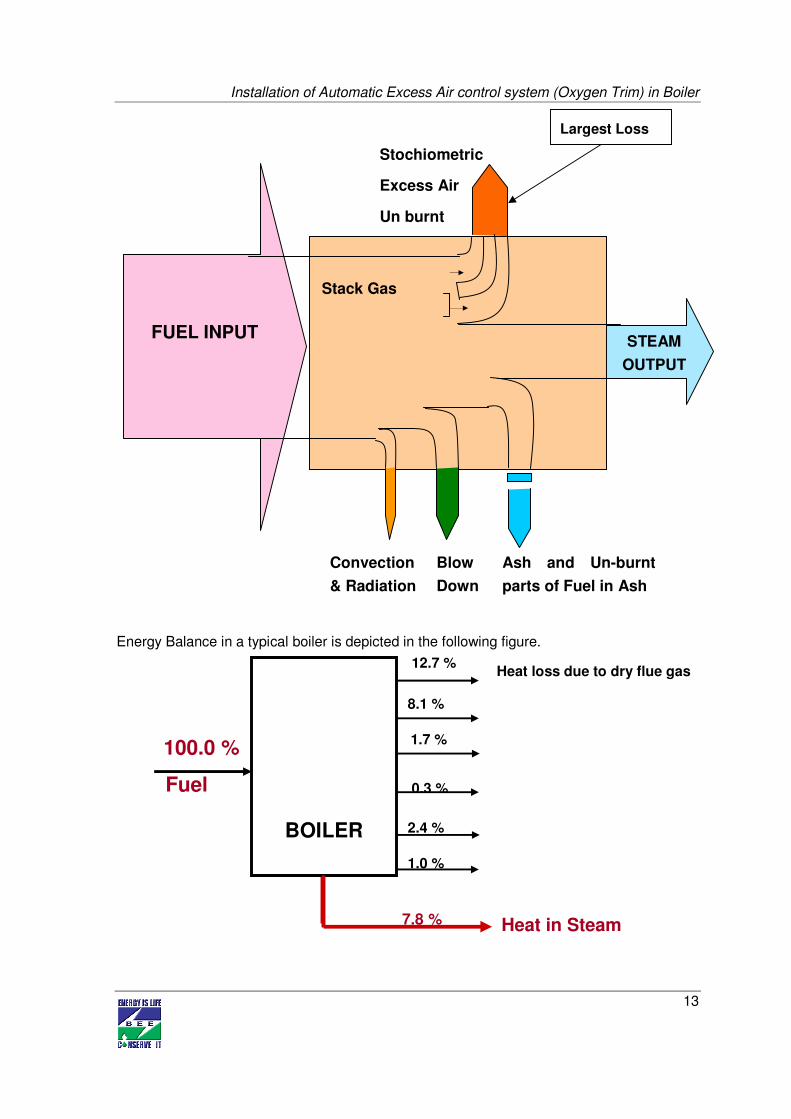
Energy flow diagram for a boiler is as below:-
Installation of Automatic Excess Air control system (Oxygen Trim) in Boiler
13
Energy Balance in a typical boiler is depicted in the following figure.
Stochiometric
Excess Air
Un burnt
FUEL INPUT STEAM
OUTPUT
Stack Gas
Ash and Un-burnt
parts of Fuel in Ash
Blow
Down
Convection
& Radiation
Largest Loss
Heat in Steam
0.3 %
100.0 %
BOILER
Heat loss due to dry flue gas 12.7 %
8.1 % 1.7 %
2.4 % 1.0 %
Fuel
7.8 %

Installation of Automatic Excess Air control system (Oxygen Trim) in Boiler
14
The Sankey Diagram for a typical boiler is shown in the following figure.
Fig. 1.10 Sankey Diagram for a typical boiler
The above figures show that loss of Energy through Flue Gas is the largest Energy Loss
Stream. Obviously, Energy can be saved by reducing losses by way of sensible heat carried
away by flue gases.
1.3.3 Energy audit methodology
The following methodology was adopted to evaluate the performance of boiler:-

Installation of Automatic Excess Air control system (Oxygen Trim) in Boiler
15
Measurement of steam quantity and
enthalpy of steam raised
Calculation of Fuel consumed
Calculation of Direct Efficiency of Boilers
Measurement of Flue Gas composition
(O2, CO and CO2 content)
Finding out ultimate analysis of fuel
Empirical Calculation of Boiler Efficiency,
losses in Flue Gas
Fig. 1.11 Energy Audit methodologies
1.3.4 Design and operating parameters specification
Operating the boiler with an optimum amount of excess air will minimize heat loss up the
stack and improve combustion efficiency. Combustion efficiency is a measure of how
effectively the heat content of a fuel is transferred into usable heat. The stack temperature
and flue gas oxygen (or carbon dioxide) concentrations are primary indicators of combustion
efficiency which is shown in Table 1.5 below:

Installation of Automatic Excess Air control system (Oxygen Trim) in Boiler
16
Table 1.5 Relation between Stack temperature and oxygen concentrations
Combustion Efficiency (% age)
Excess % age Net Stack Temperature1) (oF)
Air Oxygen 200 300 400 500 600
9.5 2.0 85.4 83.1 80.8 78.4 76.0
15 3.0 85.2 82.8 80.4 77.9 75.4
28.1 5.0 84.7 82.1 79.5 76.7 74.0
44.9 7.0 84.1 81.2 78.2 75.2 72.1
81.6 10.0 82.8 79.3 75.6 71.9 68.2
Given complete mixing, a precise or stoichiometric amount of air is required to completely
react with a given quantity of fuel. In practice, combustion conditions are never ideal, and
additional or “excess” air must be supplied to completely burn the fuel.
The correct amount of excess air is determined from analyzing flue gas oxygen or carbon
dioxide concentrations. Inadequate excess air results in unburned combustibles (fuel, soot,
smoke, and carbon monoxide) while too much results in heat lost due to the increased flue
gas flow—thus lowering the overall boiler fuel-to-steam efficiency. On well-designed natural
gas-fired systems, an excess air level of 10% is attainable. An often stated rule of thumb is
that boiler efficiency can be increased by 1% for each 15% reduction in excess air or 40°F
reduction in stack gas temperature.

Installation of Automatic Excess Air control system (Oxygen Trim) in Boiler
17
1.3.5 Operating efficiency analysis
The units in Pali cluster are not really aware of the ill effects of excess air in combustion.
Most of the places excess Oxygen was found to be in the range of 15% to 17% making
excess air to be in the range of 250 to 425% when the Excess air can be reduced to 65% for
combustion of RPC globules. One of the units in Pali has installed the proposed system and
has been reaping very good rewards.
1.4 Barriers in adoption of proposed technology/equipment
BEE promoted SME programme has the unique distinction of addressing all the identifiable
barriers in adoption of Energy Efficiency Improvement technologies in SME sectors.
Following actions have been taken in Pali Textile Cluster to remove the barriers:-
• Kick off Seminar to create awareness
• Energy Audit (Detailed and Preliminary) in over 78 units
• Capability building and involvement of institutional financers, local service
providers and also domestic equipment manufacturers.
• Design and distribution of dissemination material containing most of the
measures.

Installation of Automatic Excess Air control system (Oxygen Trim) in Boiler
18
• Design and distribution of Cluster Manual containing technology gap assessment
and cost benefit analysis of proposed Energy Conservation measures.
• Involvement of Industry Association, Department of Industries and local
administration.
However, for the sake of identifying possible barriers to adoption of the proposed
technologies, the following may be considered.
1.4.1 Technological Barrier
• The proposed technology is already installed in the cluster and is available readily.
• Non-availability of technology or aversion to adoption for any other reason does not
seem to be the case for non replication. The system is being offered by one of the
supplier having local agent. It is only lack of knowledge and comfort of proven
guaranteed results that has been keeping the entrepreneurs away from adopting this
technology.
• All major Boiler Manufacturers offer the proposed system as optional fitment to the
system.
• There is a severe paucity of quality technical consultants in the cluster. This also
inhibits adoption of technology as there is nobody to convince the entrepreneurs.
• Non availability of local after sales service provider for the equipments is a major
obstacle to adoption of any new and modern technology involving electronics.
• The majority of the textile unit owners / entrepreneurs do not have in-depth
technical expertise nor do they have technically qualified manpower. This is a major
barrier in acquiring knowledge about any innovation in the sector.
• The entrepreneurs in the MSME sector are averse to investment risks and tend to
invest in proven technology only. Adoption of technology is higher in bigger units and
these bigger units also become agents for demonstration and hence replication. Lack
of any bigger unit in the cluster also is an impediment to adoption of newer
technology.
1.4.2 Financial Barrier
• The applicability of the proposition is in power process units only. These units have
very healthy financial position. Lack of finances is not the reason for non adoption of
the proposed technology. However, availability of easy finances and also financial
incentives would trigger and also accelerate adoption of the technology.

Installation of Automatic Excess Air control system (Oxygen Trim) in Boiler
19
• Implementation of the proposed project activity requires approx. ` 3 lakh investment
and availability of easy finances would help replication of the system.
• The investment decisions normally favour creation of additional facility and
investment for Energy Efficiency Improvement features last in the priority of
entrepreneurs. Consequently, interventions like the one undertaken by BEE are
necessary for promoting adoption of technologies.
• The subjective approach of the banks in deciding on grant of loans to entrepreneurs
and also lack of pre declared formalities required for availing loan is the biggest
impediment. On adherence to a time bound dispensation of the loan application is
also an obstacle as the a new document is asked for ever time the entrepreneur
visits the bank and the bank would refuse in the last moment citing untenable reason
leaving the entrepreneur in the lurch. Facilitating delivery of finances is more
important than packaging the finances.
• Most of the units in Pali textile cluster are debt free enterprises and the situation is
ideal for any bank or financial institution to do advances. With end to economic slow
down within sight, the demands are likely to pick up and the units would require
scaling up their operations and also perking up their facility to meet enhanced
demand. The inherent benefit of increase in profitability by precise process control is
also up for taking.
1.4.3 Skilled manpower
The cluster very badly needs skilled manpower. There is no trained Dye Master, no trained
electrician, no trained boiler operator or no trained maintenance man. The existing
manpower has grown by on the job learning and has learnt the traditional methods of dyeing
and processing. Propagation of learning of new technology is absolutely necessary.
1.4.4 Other barrier (If any)
Creation of Energy Champions is necessary to trigger large-scale adoption of proposed
technologies. This is possible by sponsoring adoption of such technologies through financial
help and also mitigation of investment risks through a mechanism that guarantees the
savings. An ESCO can as well be involved in the process.
Installation of Automatic Excess Air control system (Oxygen Trim) in Boiler
20
2.0 PROPOSED EQUIPMENT
2.1 Detailed description of technology proposed
All combustion requires the correct measure of oxygen; too much or too little can cause
undesirable effects. However, the error is almost always intentionally on the high-side (too
much oxygen) because the main effect on the high side is low efficiency. Too little air results
in carbon monoxide formation, sooting and even explosion if accumulated soot and other
non-combusted suddenly get enough oxygen to rapidly burn.
When boiler burners are manually tuned on a periodic basis, they are typically adjusted to
about 3% excess oxygen which is about 15% excess air. This is because there are many
ambient and atmospheric conditions that can affect oxygen/air supply. For example, colder
air is denser and contains more oxygen than warm air; wind speed affects every
chimney/flue/stack differently; and barometric pressure further affects draft. Therefore, an
excess oxygen/air setting at the time of tuning assumes there will still be enough oxygen
available for complete combustion when conditions worsen.
From an efficiency standpoint, the excess O2 means there is more air in the combustion
stream than there needs to be. That air also contains moisture, and it all is heated and then
lost up the stack. The amount of excess O2 is about directly proportional to the efficiency
lost; that is, 3% excess O2 means 3% efficiency drop.
Although it may be possible to monitor and adjust the burner on a daily basis, it is not
practical. Automatic O2 systems continuously monitor the flue gases and adjust the burner
air supply. They are generically called 'O2 Trim Systems'.
Components of the proposed system
An electronic sensor is inserted into the boiler flue, near the boiler, ahead of any dampers or
other sources of air leakage into the boiler or flue. The sensor is connected to a control
panel that measures oxygen and sends a signal to a control damper on the burner air
supply.
The Oxygen Trim System contains the Zirconium probe, PLC controller cum display and
preset mechanism integrated with VFD to modulate speed of FD fan. The unit also consists
of a self calibration mechanism to ensure accuracy of less than 2%.
There are other advantages of the installation of an O2 Trim package in addition to fuel
savings. They include:

Installation of Automatic Excess Air control system (Oxygen Trim) in Boiler
21
Flue gas temperature monitoring and alarms, alerts when the boiler tubes are fouled (A 40
degree temperature rise above design results in a 1% fuel increase.) and shut down due to
high flue gas temperature.
� O2 monitoring and alarm due to low excess air or combustibles.
� There are two types of approaches for O2 trim.
� Single point (jackshaft) positioning with a trim actuator.
� Parallel positioning (metering), separate actuators for the fuel valve(s) and FD
damper.
The most common method today is parallel positioning. The components include:
� Controller: It accepts inputs from the fuel and air actuators, O2 analyzer, optional flue
gas temperature sensor and either a master-loading signal for a plant master or lead
lag sequencer or a header pressure or temperature sensor. The controller will
interface with the burner management system for purge, low fire, fuel select and
other functions.
� Boiler pressure or temperature sensor, mounted in the header.
� O2 analyzer that includes field repairable in-situ probe and electronics.
� Fuel valve actuator(s) (servomotors). One servomotor per valve. In some cases FGR
is controlled and a servomotor is supplied for that function.
� Air damper actuator (servomotor).
When a measurement of oxygen in the flue gas is available, the combustion control
Mechanism can be vastly improved (since the percentage of oxygen in flue is closely related
to the amount of excess air) by adding an oxygen trim control module, allowing

Installation of Automatic Excess Air control system (Oxygen Trim) in Boiler
22
� Tighter control of excess air to oxygen set point for better efficiency
� faster return to set point following disturbances
� Tighter control over flue emissions
� compliance with emission standards
� Easy incorporation of carbon monoxide or capacity override.
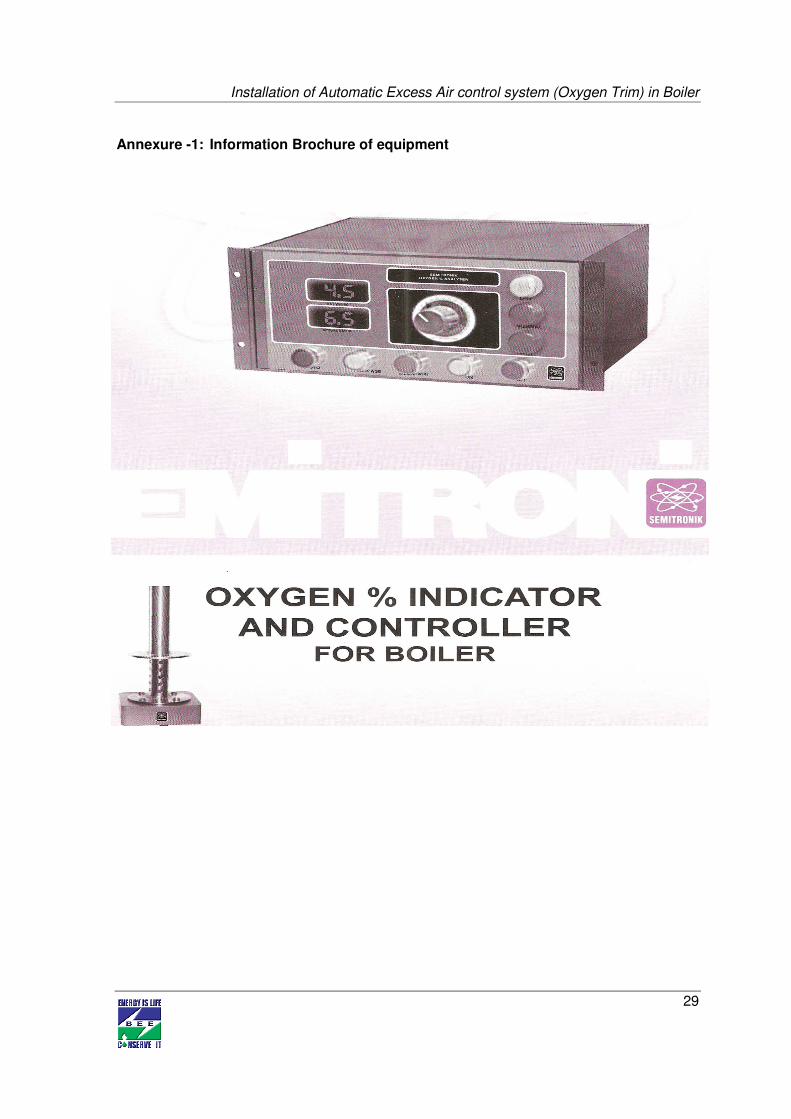
2.1.1 Equipment specification
A complete brochure of the equipment is placed at Annexure 1.
2.1.2 Suitability over existing equipment
The proposed system can be retrofitted to existing boiler with minimal modification to
existing boiler and would need shut down of approximately one week.
2.1.3 Superiority over existing equipment
The system would improve precision of control on the existing process and hence would
yield better results on productivity as well as quality fronts.
2.1.4 Availability of equipment
The system can be delivered within 3 to 4 weeks of placement of order through
manufacturers in Ahmedabad.
2.1.5 Source of equipment
This technology has already been implemented in one of the textile process house at Pali
and the results have been as per projections. Brochure from the same vendor has been
enclosed. The equipment is readily available indigenously without any complications related
to patent or copyright
2.1.6 Technical specification of equipment
Technical specification of proposed technology is attached at Annexure 7.
2.1.7 Terms and conditions in sales of equipment
No specific terms and conditions are attached to sale of the equipment.
2.1.8 Process down time during implementation
Process down time required in fitting of proposed technology in boiler is about 1 week and
break up for process down time is given in Annexure 4.

Installation of Automatic Excess Air control system (Oxygen Trim) in Boiler
23
2.2 Life cycle assessment and risks analysis
The unit consists of Sensors, VFD, PLCs, connections, contactors etc. There are no moving
parts and hence deterioration is not a problem. However, bad power quality may lead to
failure of the system. Being an electronic device, no problem is anticipated and the unit
would go on working perpetually if better ambient is made available.
2.3 Suitable Unit for Implementation of Proposed Technology
The proposed system can be implemented in over 30 no boilers in Pali. Total potential for
energy saving would be 3827.1 MT RPC (3269 MTOE) per year if the proposition is
implemented in all the machines.

Installation of Automatic Excess Air control system (Oxygen Trim) in Boiler
24
3.0 ECONOMIC BENEFITS FROM PROPOSED EQUIPMENT
3.1 Technical benefit
3.1.1 Fuel saving
The proposition would help save 98.06 MT RPC fuel in every boiler. Details of fuel saving is
given in Annexure 4.
3.1.2 Electricity saving
Installation of proposed technology will lead to some amount of electricity saving due better
control of motor speed but not taken into account since cannot be predicted exactly.
3.1.3 Improvement in product quality
None
3.1.4 Increase in production
None
3.1.5 Reduction in raw material
Raw material consumption is same even after the implementation of proposed technology.
3.1.6 Reduction in other losses
None
3.2 Monetary benefits
The monetary saving arising out of implementation of proposed technology in one Boiler
would be ` 7.35 lakh per year. Detail of saving calculation is given in Annexure 4.
3.3 Social benefits
3.3.1 Improvement in working environment in the plant
Proposed equipment reduces the GHG emission by reducing electricity and fuel
consumption.
3.3.2 Improvement in workers skill
Not contributing to any improvement in skill sets of workers. However, the automation would
eliminate human intervention in precision control of process thereby reducing workload of
the frontline workers. No retrenchment of labor is envisaged because of implementation of
the proposed system.
Installation of Automatic Excess Air control system (Oxygen Trim) in Boiler
25
3.4 Environmental benefits
3.4.1 Reduction in effluent generation
The fuel saving will have equivalent mitigation in terms of SPM and other pollutants
otherwise likely to be released in the atmosphere.
3.4.2 Reduction in GHG emission
The equivalent saving in GHG emission for every Stenter would be 243 MT per year as per
UNEP GHG Calculator.
3.4.3 Reduction in other emissions like SOX
NIL

Installation of Automatic Excess Air control system (Oxygen Trim) in Boiler
26
4.0 INSTALLATION OF PROPOSED EQUIPMENT
4.1 Cost of equipment implementation
4.1.1 Equipments cost
Cost of the project is about ` 2.79 Lakh (2.4 Lakh + 10.3% Excise+2% CST+ 3.5% Freight)
as per the quotation from M/s SEMITRONICS attached as Annexure 7. The basic cost
includes ` 45000/- as cost of one VFD to be installed in FD Fan.
4.1.2 Erection, commissioning and other misc. cost
Erection & commissioning cost is about ` 0.21 lakh. A detail of project installation cost is
given in Table 4.1 below:
Table 4.1 Details of proposed equipment installation cost
S.No Particular Unit cost
1 Equipment cost ` (in Lakh) 2.79
2 Erection & Commissioning cost ` (in Lakh) 0.21
3 Other misc. cost ` (in Lakh) Nil
4 Total cost ` (in Lakh) 3.00
4.2 Arrangements of funds
4.2.1 Entrepreneur’s contribution
Entrepreneur will contribute 25% of the total project cost which is ` 0.75 lakh.
4.2.2 Loan amount.
Remaining 75% cost of the proposed project will be taken from the bank which is ` 2.25
Lakh.
4.2.3 Terms & conditions of loan
The interest rate is considered at 10% which is SIDBI’s rate of interest for energy efficient
projects. The loan tenure is 5 years excluding initial moratorium period is 6 months from the
date of first disbursement of loan.
4.3 Financial indicators
4.3.1 Cash flow analysis
Profitability and cash flow statements have been worked out for a period of 8 years. The
financials have been worked out on the basis of certain reasonable assumptions, which are

Installation of Automatic Excess Air control system (Oxygen Trim) in Boiler
27
outlined below. The cost of equipment considered is inclusive of hot water storage tanks
also.
The project is expected to achieve monetary savings of ` 7.35 lakh per annum.
• The Operation and Maintenance cost is estimated at 4% of cost of total project with
5% increase in every year as escalations.
• Interest on term loan is estimated at 10%.
• Depreciation is provided as per the rates provided in the companies act.
Based on the above assumptions, profitability and cash flow statements have been
prepared and calculated in Annexure-3.
4.3.2 Simple payback period
The total project cost of the proposed technology is ` 3.00 lakh and monetary savings due to
reduction in Electricity & Fuel consumption is ` 7.35 lakh hence, the simple payback period
works out to be around 5 months.
4.3.3 Net Present Value (NPV)
The Net present value of the investment at 10% works out to be ` 23.51 Lakh.
4.3.4 Internal rate of return (IRR)
The after tax Internal Rate of Return of the project works out to be 180.44%. Thus the
project is financially viable.
4.3.5 Return on investment (ROI)
The average return on investment of the project activity works out at 31.60%.
Details of financials indicators are furnished in Table 4.2 below:
Table 4.2 Financial indicators of proposed technology
S.No. Particular Unit Value
1 Simple payback period Months 5
2 NPV ` (in lakh) 23.51
3 IRR % age 180.44
4 ROI % age 31.60
5 DSCR ratio 9.74

Installation of Automatic Excess Air control system (Oxygen Trim) in Boiler
28
4.4 Sensitivity analysis
A sensitivity analysis has been carried out to ascertain how the project financials would
behave in different situations like when there is an increase in fuel savings or decrease in
fuel savings. For the purpose of sensitive analysis, two following scenarios has been
considered
• Optimistic scenario (Increase in fuel savings by 5%)
• Pessimistic scenario (Decrease in fuel savings by 5%)
In each scenario, other inputs are assumed as a constant. The financial indicators in each of
the above situation are indicated along with standard indicators.
Table 4.3 Sensitivity analysis in different scenario
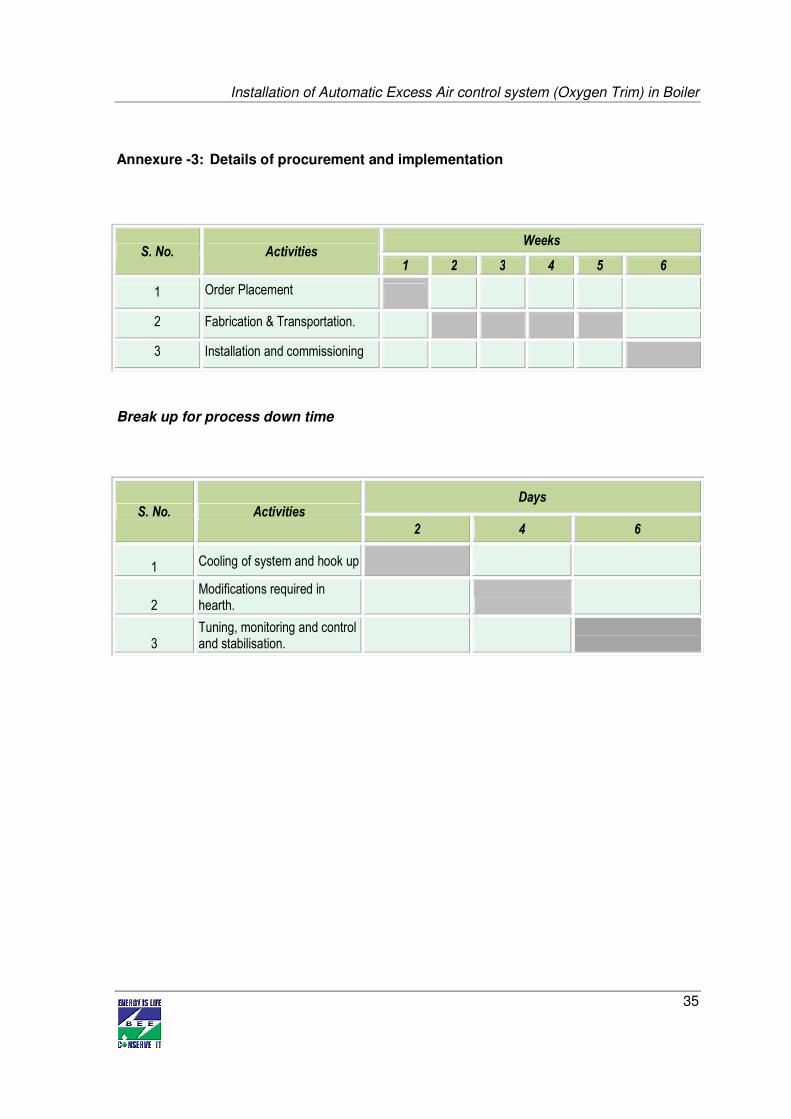
4.5 Procurement and Implementation Schedule
Total time period required for implementation of this technology is about 6 weeks and their
details are given in Annexure 3.
Scenario IRR
(% age) NPV
(`̀̀̀ in lakh) ROI
(% age) DSCR
Pessimistic 172.21 22.24 31.49 9.27
Realistic 180.44 23.51 31.60 9.74
Optimistic 188.65 24.77 31.69 10.20
Installation of Automatic Excess Air control system (Oxygen Trim) in Boiler
29
Annexure -1: Information Brochure of equipment

Installation of Automatic Excess Air control system (Oxygen Trim) in Boiler
30

Installation of Automatic Excess Air control system (Oxygen Trim) in Boiler
31
Annexure -2: Detailed financial analysis
Assumption
Name of the Technology Automatic Excess Air control system
Details Unit Value Basis
Installed Capacity No of working days Days 300 Feasibility Study
No of Shifts per day Shifts 3 Feasibility Study
Capacity Utilization Factor %age Proposed Investment
Equipment cost ` in lakh 2.79
Erection and commissioning ` in lakh 0.21
Investment without IDC ` in lakh 3.00
EPC cost ` in lakh 0.00
Total investment ` in lakh 3.00
Financing pattern
Own Funds (Equity) ` in lakh 0.75
Loan Funds (Term Loan) ` in lakh 2.25
Loan Tenure yr 5 Assumed
Moratorium Period Months 6 Assumed
Repayment Period Months 66 Assumed
Interest Rate %/yr 10 SIDBI Lending rate
Estimation of Costs
O & M Costs % on Plant & Equip 4 Feasibility Study
Annual Escalation % age 5 Feasibility Study
Estimation of Revenue
Fuel saving (RPC) Tonne 98.06
Cost of fuel `/tonne 7500
St. line Depn. % age 5.28%
Indian Companies Act
IT Depreciation % age 80.00%
Income Tax Rules
Income Tax % age 33.99%
Income Tax

Installation of Automatic Excess Air control system (Oxygen Trim) in Boiler
32
Estimation of Interest on Term Loan `̀̀̀ (in lakh)
Years Opening Balance Repayment Closing Balance Interest
1 2.25 0.12 2.13 0.26
2 2.13 0.24 1.89 0.20
3 1.89 0.48 1.41 0.17
4 1.41 0.50 0.91 0.12
5 0.91 0.60 0.31 0.06
6 0.31 0.31 0.00 0.60
2.25
WDV Depreciation `̀̀̀ (in lakh)
Particulars / years 1 2
Plant and Machinery Cost 3.00 0.60
Depreciation 2.40 0.48
WDV 0.60 0.12
Projected Profitability `̀̀̀ (in lakh) Particulars / Years 1 2 3 4 5 6 7 8
Fuel savings 7.35 7.35 7.35 7.35 7.35 7.35 7.35 7.35
Total Revenue (A) 7.35 7.35 7.35 7.35 7.35 7.35 7.35 7.35
Expenses
O & M Expenses 0.12 0.13 0.13 0.14 0.15 0.15 0.16 0.17
Total Expenses (B) 0.12 0.13 0.13 0.14 0.15 0.15 0.16 0.17
PBDIT (A)-(B) 7.23 7.23 7.22 7.22 7.21 7.20 7.19 7.19
Interest 0.26 0.20 0.17 0.12 0.06 - - -
PBDT 6.97 7.03 7.06 7.09 7.14 7.20 7.19 7.19
Depreciation 0.16 0.16 0.16 0.16 0.16 0.16 0.16 0.16
PBT 6.82 6.87 6.90 6.94 6.99 7.04 7.04 7.03
Income tax - 2.23 2.40 2.41 2.43 2.45 2.45 2.44
Profit after tax (PAT) 6.82 4.64 4.50 4.52 4.56 4.60 4.59 4.58
Computation of Tax
`̀̀̀ (in lakh)
Particulars / Years 1 2 3 4 5 6 7 8
rofit before tax 6.82 6.87 6.90 6.94 6.99 7.04 7.04 7.03
Add: Book depreciation 0.16 0.16 0.16 0.16 0.16 0.16 0.16 0.16
Less: WDV depreciation 2.40 0.48 - - - - - -
Taxable profit 4.57 6.55 7.06 7.09 7.14 7.20 7.19 7.19
Income Tax - 2.23 2.40 2.41 2.43 2.45 2.45 2.44

Installation of Automatic Excess Air control system (Oxygen Trim) in Boiler
33
Projected Balance Sheet `̀̀̀ (in lakh)
Particulars / Years 1 2 3 4 5 6 7 8
Liabilities
Share Capital (D) 0.75 0.75 0.75 0.75 0.75 0.75 0.75 0.75
Reserves & Surplus (E) 6.82 11.46 15.96 20.48 25.04 29.63 34.22 38.81
Term Loans (F) 2.13 1.89 1.41 0.91 0.31 0.00 0.00 0.00
Total Liabilities (D)+(E)+(F) 9.70 14.10 18.12 22.14 26.10 30.38 34.97 39.56
Assets 1 2 3 4 5 6 7 8
Gross Fixed Assets 3.00 3.00 3.00 3.00 3.00 3.00 3.00 3.00
Less Accm. Depreciation 0.16 0.32 0.48 0.63 0.79 0.95 1.11 1.27
Net Fixed Assets 2.84 2.68 2.52 2.37 2.21 2.05 1.89 1.73
Cash & Bank Balance 6.85 11.42 15.59 19.78 23.89 26.39 31.14 35.89
TOTAL ASSETS 9.70 14.10 18.12 22.14 26.10 28.44 33.03 37.62
Net Worth 7.57 12.21 16.71 21.23 25.79 30.38 34.97 39.56
Debt Equity Ratio 2.84 2.52 1.88 1.21 0.41 0.00 0.00 0.00
Projected Cash Flow
`̀̀̀ (in lakh)
Particulars / Years 0 1 2 3 4 5 6 7 8
Sources
Share Capital 0.75 - - - - - - - -
Term Loan 2.25
Profit After tax 6.82 4.64 4.50 4.52 4.56 4.60 4.59 4.58
Depreciation 0.16 0.16 0.16 0.16 0.16 0.16 0.16 0.16
Total Sources 3.00 6.97 4.80 4.66 4.68 4.72 4.75 4.75 4.74
Application
Capital Expenditure 3.00
Repayment Of Loan - 0.12 0.24 0.48 0.50 0.60 2.25 - -
Total Application 3.00 0.12 0.24 0.48 0.50 0.60 2.25 - -
Net Surplus - 6.85 4.56 4.18 4.18 4.12 2.50 4.75 4.74
Add: Opening Balance - - 6.85 11.42 15.59 19.78 23.89 26.39 31.14
Closing Balance - 6.85 11.42 15.59 19.78 23.89 26.39 31.14 35.89
IRR `̀̀̀ (in lakh)
Particulars / months 0 1 2 3 4 5 6 7 8
Profit after Tax 6.82 4.64 4.50 4.52 4.56 4.60 4.59 4.58
Depreciation 0.16 0.16 0.16 0.16 0.16 0.16 0.16 0.16
Interest on Term Loan 0.26 0.20 0.17 0.12 0.06 - - -
Cash outflow (3.00) - - - - - - - -
Net Cash flow (3.00) 7.23 5.00 4.82 4.80 4.78 4.75 4.75 4.74
IRR 217.05%
NPV 24.92

Installation of Automatic Excess Air control system (Oxygen Trim) in Boiler
34
Break Even Point `̀̀̀ (in lakh)
Particulars / Years 1 2 3 4 5 6 7 8
Variable Expenses
Oper. & Maintenance Exp (75%) 0.09 0.09 0.10 0.10 0.11 0.11 0.12 0.13
Sub Total(G) 0.09 0.09 0.10 0.10 0.11 0.11 0.12 0.13
Fixed Expenses
Oper. & Maintenance Exp (25%) 0.03 0.03 0.03 0.03 0.04 0.04 0.04 0.04
Interest on Term Loan 0.26 0.20 0.17 0.12 0.06 0.00 0.00 0.00
Depreciation (H) 0.16 0.16 0.16 0.16 0.16 0.16 0.16 0.16
Sub Total (I) 0.45 0.39 0.36 0.31 0.26 0.20 0.20 0.20
Sales (J) 7.35 7.35 7.35 7.35 7.35 7.35 7.35 7.35
Contribution (K) 7.26 7.26 7.26 7.25 7.25 7.24 7.23 7.23
Break Even Point (L= G/I) 6.18% 5.40% 4.94% 4.33% 3.58% 2.72% 2.75% 2.78%
Cash Break Even {(I)-(H)} 4.00% 3.22% 2.76% 2.15% 1.40% 0.53% 0.56% 0.58%
Break Even Sales (J)*(L) 0.45 0.40 0.36 0.32 0.26 0.20 0.20 0.20
Return on Investment
`̀̀̀ (in lakh)
Particulars / Years 1 2 3 4 5 6 7 8 Total
Net Profit Before Taxes 6.82 3.00 3.02 3.06 3.12 3.17 3.17 3.16 24.64
Net Worth 7.57 5.80 7.74 9.71 11.71 13.74 15.78 17.81 86.01
29.51%
Debt Service Coverage Ratio
` ` ` ` (in lakh)
Particulars / Years 1 2 3 4 5 6 7 8 Total
Cash Inflow
Profit after Tax 6.82 4.64 4.50 4.52 4.56 4.60 4.59 4.58 29.63
Depreciation 0.16 0.16 0.16 0.16 0.16 0.16 0.16 0.16 0.95
Interest on Term Loan 0.26 0.20 0.17 0.12 0.06 0.00 0.00 0.00 0.82
Total (M) 7.23 5.00 4.82 4.80 4.78 4.75 4.75 4.74 31.40
DEBT Interest on Term Loan 0.26 0.20 0.17 0.12 0.06 0.00 0.00 0.00 0.82
Repayment of Term Loan 0.12 0.24 0.48 0.50 0.60 0.31 0.00 0.00 2.25
Total (N) 0.38 0.44 0.65 0.62 0.66 0.31 0.00 0.00 3.07
19.00 11.32 7.45 7.74 7.19 15.33 - - 10.24
Average DSCR (M/N) 10.24
Installation of Automatic Excess Air control system (Oxygen Trim) in Boiler
35
Annexure -3: Details of procurement and implementation
Break up for process down time
S. No. Activities Weeks
1 2 3 4 5 6
1 Order Placement
2 Fabrication & Transportation.
3 Installation and commissioning
S. No. Activities Days
2 4 6
1 Cooling of system and hook up
2 Modifications required in hearth.
3 Tuning, monitoring and control and stabilisation.

Installation of Automatic Excess Air control system (Oxygen Trim) in Boiler
36
Annexure 4: Detailed equipment assessment report
Calculation of Energy Saving Potential from installation of automatic excess air control in
Boiler
Ultimate analysis of fuel C % H2 % S % O2 % N2 % Ash % Moisture%
80.9 3.57 7.5 0 0.95 0.01 7
S. No Particular Unit Value
1 Present O2 level % age 15
2 Theoretical air requirement kg of air/kg of fuel 10.80
3 Excess air supply at present condition % age 250
4 Actual mass of air supplied at present condition kg of air/kg of fuel 37.81
5 Heat loss at exist excess air level kCal/kg of fuel 1494.5
6 Proposed O2 level required % age 8
7 Excess air supply after implementation of technology % age 61.54
8 Proposed Actual mass of air supplied kg of air/kg of fuel 17.44
9 Heat loss after implementation of technology due to excess air
kCal/kg of fuel 719.76
10 Reduction in sensible heat loss kCal/kg of fuel 744.79
11 Fuel firing rate kg/hr 150
12 Reduction in sensible heat loss kCal/hr 111718.5
13 GCV of fuel kCal/kg 8200
14 Fuel saving per hour kg/hr 13.62
15 Yearly fuel saving MT 98.06
14 Cost of fuel (RPC) ` / MT 7500
15 Total monetary saving per year ` in lakh 7.35
16 Total Investment ` in lakh 3.0
17 General Payback Period Months 5
Any electricity saving not considered. However, savings would be –

Installation of Automatic Excess Air control system (Oxygen Trim) in Boiler
37
Savings of Electricity in FD and ID Fan by reducing air handled
% Excess Air handled by FD & ID Fan 250.00
% Excess Air proposed to be handled 61.54
Ratio of actual Excess Air to Proposed Excess Air 4.0625
Power drawn by FD Fan, kW 12
Power Drawn by ID Fan, kW 10
Saving in Power of FD & ID Fan per year based on Affinity Law, kW/Yr 121362.5
Monetary equivalent @ ` 4.5 per kWh 546131.2
Investment in Oxygen Trim + VFD in FD & ID Fan (`) 500000

Installation of Automatic Excess Air control system (Oxygen Trim) in Boiler
38
Annexure -5: Details of equipment service providers
S.No. Technology Name of Service Provider
Address Contact Person and No.
1. Installation of Residual Moisture Control System
M/s SEMITRONICS 17 CD, Archana Industrial Estate, Rakhial Road, Ahmedabad
079-22741011
Mr. Parthav Shah
2 Installation of Residual Moisture Control System
M/s Montforts Germany through agent M/s ATE India Ltd.
Delhi Ofice
3 Installation of
Residual
Moisture Control
System
M/s PLEVA PLEVA GmbH Rudolf-Diesel-Strasse 2 D-72186 Empfingen-Germany Tel.: (+49) (0) 74 85 10 04 Fax: (+49) (0) 74 85 10 09 E-mail: [email protected] www.pleva-controls.de

Installation of Automatic Excess Air control system (Oxygen Trim) in Boiler
39
Annexure - 6Typical arrangement drawings for proposed system

Installation of Automatic Excess Air control system (Oxygen Trim) in Boiler
40
Combined Fuel as well as Air Control System

Installation of Automatic Excess Air control system (Oxygen Trim) in Boiler
41
Typical sketch of boiler and auxiliaries
Typical Specification of a Solid Fuel Fired Boiler

Installation of Automatic Excess Air control system (Oxygen Trim) in Boiler
42
Annexure – 7 Quotation for Proposed Technology

Installation of Automatic Excess Air control system (Oxygen Trim) in Boiler
43

Petroleum conservation Research Association
(Under Ministry of Petroleum and Natural Gas)
Sanrakshan Bhawan, 10 Bhikaji Cama Place, New Delhi-66 Ph. : +91-11- 26198856, Fax : +91-11-26109668 Website: www.pcra.org
India SME Technology Services Ltd DFC Building, Plot No.37-38, D-Block, Pankha Road, Institutional Area, Janakpuri, New Delhi-110058 Tel: +91-11-28525534, Fax: +91-11-28525535
Website: www.techsmall.com
Bureau of Energy Efficiency (BEE) (Ministry of Power, Government of India) 4th Floor, Sewa Bhawan, R. K. Puram, New Delhi – 110066 Ph.: +91 – 11 – 26179699 (5 Lines), Fax: +91 – 11 – 26178352
Websites: www.bee-india.nic.in, www.energymanagertraining.com