exchange rates and economic growth in kenya: an ...pdf.usaid.gov/pdf_docs/pnack375.pdfexchange rates...
TRANSCRIPT

Exchange Rates and Economic Growth in Kenya:An Econometric Analysis
African Economic PolicyDiscussion Paper Number 56
July 2000
Malcolm F. McPherson and Tzvetana RakovskiBelfer Center for Science & International Affairs
John F. Kennedy School of Government
Funded byUnited States Agency for International Development
Bureau for AfricaOffice of Sustainable Development
Washington, DC 20523-4600
The views and interpretations in this paper are those of the author(s)and not necessarily of the affiliated institutions.
Equity and Growth through Economic Research
EAGER supports economic and social science policy analysis in Sub-Saharan Africa. Its primary goal is to increasethe availability and the use of policy analysis by both public and private sector decision-makers. In addition to the goalof achieving policy reform, EAGER seeks to improve the capacity of African researchers and research organizationsto contribute to policy debates in their countries. In support of this goal, EAGER sponsors collaboration amongAmerican and African researchers and research organizations.
EAGER is implemented through two cooperative agreements and a communications logistics contract financed by theUnited States Agency for International Development (USAID), Strategic Analysis Division, The Office of SustainableDevelopment, Bureau for Africa. A consortium led by the Harvard Institute for International Development (HIID)holds the cooperative agreement for Public Strategies for Growth and Equity. Associates for International Resourcesand Development (AIRD) leads the group that holds the cooperative agreement for Trade Regimes and Growth. TheCommunications Logistics Contract (CLC) is held by a consortium led by BHM International, Inc. (BHM). Othercapacity-building support provides for policy analysis by African institutions including the African Economic ResearchConsortium, Réseau sur Les Politiques Industrielles (Network on Industrial Policy), Programme Troisième CycleInteruniversitaire en Economie, and the International Center for Economic Growth. Clients for EAGER researchactivities include African governments and private organizations, USAID country missions and USAID/Washington,and other donors.
For information contact:
Yoon Lee, Project OfficerUSAID
AFR/SD/SA (4.06-115)Washington, D.C. 20523
Tel: 202-712-4281 Fax: 202-216-3373E-mail: [email protected]
J. Dirck Stryker, Chief of PartyAssociates for International
Resources and Development (AIRD)185 Alewife Brook Parkway
Cambridge, MA 02138Tel: 617-864-7770 Fax: 617-864-5386
E-mail: [email protected] AOT-0546-A-00-5073-00
Lisa M. Matt, Senior Advisor
BHM InternationalP.O. Box 3415
Alexandria, VA 22302Tel: 703-299-0650 Fax: 703-299-0651
E-mail: [email protected] AOT-0546-Q-00-5271-00
Sarah Van Norden, Project AdministratorBelfer Center for Science & International Affairs
John F. Kennedy School of Government 79 John F. Kennedy Street
Cambridge, MA 02138 USA Phone: 617-496-0112 Fax: 617-496-2911 E-mail: [email protected]
Contract AOT-0546-A-00-5133-00

Abstract
The current work expands on an earlier paper which had discussed the relationshipbetween economic growth and exchange rate in Kenya. Based on data for the period 1970to 1996, we analyze the possible direct and indirect relationship between the real andnominal exchange rates and GDP growth. We derive these relationships in three ways:within the context of a fully specified (but small) macroeconomic model, as a single-equation instrumental variable estimation, and as a vector-autoregression model. Theestimation results from the three different settings show that there is no evidence of astrong direct relationship between changes in the exchange rate and GDP growth. Rather,Kenya’s rate of economic growth has been directly affected by fiscal and monetarypolicies, the availability of foreign aid and other economic variables, particularly thegrowth of exports. Together, these factors have tended to sustain a pattern of realexchange rate over-valuation, which has been unfavorable for growth. Our conclusion isthat improvements in exchange rate management alone are not adequate for the revival ofgrowth in Kenya, but have to be part of a broader program of economic reform.
Keywords: Exchange Rate, Inflation, Economic Growth, Prices, Kenya
JEL Codes: F, F3, F31
Authors:
Malcolm F. McPherson [[email protected]], Fellow, is currently senioradvisor on the Equity and Growth through Economic Research (EAGER) Project andprincipal investigator for the study "Restarting and Sustaining Growth and Developmentin Africa." He holds a Ph.D. in economics from Harvard University.
Tzvetana Rakovski is working as a research assistant on the Equity and Growth throughEconomic Research (EAGER) Project. She holds an M.A. degree in Economics fromNortheastern University, Boston and a M.Sc. degree in Mathematics from SofiaUniversity, Bulgaria. Her research interests are in the fields of International Developmentand Applied Econometrics. Her prior working experience includes a position as aresearcher at the Agency for Economic Analysis and Forecasting (AEAF), Sofia,Bulgaria.

TABLE OF CONTENTS
I. INTRODUCTION .................................................................................................... 1
II. EXCHANGE RATES AND ECONOMIC GROWTH .......................................... 1
III. CHARACTERISTICS OF KENYA’S ECONOMY............................................. 2
IV. EMPIRICAL ANALYSIS AND RESULTS.......................................................... 4
V. CONCLUSIONS.................................................................................................... 11
REFERENCES............................................................................................................ 14
I. INTRODUCTION
A recent Development Discussion Paper1 examined the role of the exchange rate inKenya’s economic growth. The paper established that the over-valued real exchange ratehad impeded growth but that other factors were the principal causes of Kenya’sunsatisfactory economic performance. Such factors included foreign aid dependence, alarge and inefficient public sector, low rates of saving and investment, persistent andrelatively large budget deficits and inconsistent macroeconomic policy. The basicconclusion was that improvements in exchange rate management could make a differenceto Kenya’s growth prospects but only within the context of a broader program ofadjustment and reform.
In this paper we provide empirical support for the above conclusion. We use a number ofapproaches that include the following: single equation regressions, a system ofsimultaneous equations, and a VAR model test. Our intention is to provide a broad rangeof estimates of the direct and indirect relations between the exchange rate and growth,and highlight the importance of other economic factors affecting their interaction.
The paper is arranged as follows. Section II discusses the theoretical relationship betweenthe exchange rate and economic growth. Section III describes the basic characteristics ofthe Kenyan economy. The empirical analysis is presented and results are discussed inSection IV. Section V has concluding comments.
II. EXCHANGE RATES AND ECONOMIC GROWTH
A difficulty in determining the impact of exchange rates on the rate of economic growthis that most of the important macroeconomic effects are indirect. The interaction amongthe exchange rate (the local price of foreign exchange), inflation (the change in domesticprices), and economic growth (the change in real income) are especially important. Atypical problem is created by high and rising inflation (due, most often, to wideningbudget deficits) within the context of a sluggishly adjusting nominal exchange rate,which is being "managed" by the central bank in order to "maintain price stability". Theresulting real over-valuation of the exchange rate impedes export growth and createsuncertainty about potential future movements in the exchange rate.
In both theory and practice, there is a close relationship between movements in theexchange rate and the rate of inflation.2 The Purchasing Power Parity theory of exchangerate determination, which is based on the law of one price, expresses the change in theexchange rate as a function of the difference between the (appropriately weighted)change in "world" prices and the change in domestic prices.3 The monetary theory of thebalance of payments, which relates movements in international reserves (if exchangerates are fixed) or the exchange rate (if it is floating) to shifts in the relative demand forand supply of money, yields a similar functional relationship.4
Because it is so visible, the nominal exchange rate is a sensitive policy indicator. Yet, forpurposes of growth analysis, economic managers need to focus on trends in the real

2
exchange rate, i.e. the ratio of the price of tradables and the price of non-tradables5. Anovervalued real exchange rate represents a persistent misalignment of prices between aparticular country and the rest of the world6. Such misalignment has an impact on thepattern and level of production, the allocation and level of expenditure; the distributionand level of factor payments; the composition and size of trade flows; the levels ofinternational reserves and external debt; and (in more extreme cases) the emergence ofparallel foreign exchange markets, currency substitution and capital flight. Persistent realovervaluation also seriously erodes business and consumer confidence, thereby loweringthe rate of savings and investment. The outcome is a decline in growth.
III. CHARACTERISTICS OF KENYA’S ECONOMY
With its nominal exchange rate7 managed for a larger part of the period under review(Fig. 1 and Fig. 3 in Appendix A), Kenya provides a case study of the adverse effects of a“controlled” exchange rate in the context of imprudent fiscal and monetary policies. Theconsequences are evident in the macroeconomic data in Table 1.
Over the period 1985 to 1990 real GDP grew at an average rate of approximately 5.5%.However, from 1990 to 1996 the average growth rate was only 2.3%, implying that realper capita income declined significantly in the first half of the 1990s (see also Fig. 5).8
There were a number of factors associated with this unsatisfactory performance. Inflationwas relatively high and erratic (Fig. 6 in Appendix A). The real exchange rate (Fig. 2 andFig. 3) has been unstable over the last ten years. Its biggest devaluation is in the period1990-1994, and it is mirrored by a jump in the parallel market premium (Fig. 7 and Fig.8). The real interest rate, while mostly positive, was relatively low until recent years.Exports lacked dynamism, leading to a chronic balance of payments deficit. This wasreflected in the rapid growth of external debt.
Perhaps the most significant growth-detracting element was the chronic fiscal deficit.This created widespread financial uncertainty, which is reflected in the declining rates ofsaving and investment. During the analyzed period, Kenya received large inflows offoreign assistance. This, however, was inadequate to offset the negative impact of thefactors noted above. The result was a significant decline in the rate of economic growth.
Viewed in broader terms, Kenya’s economy has not performed at anywhere near itspotential. The exchange rate had some effect, but, as these data show, other factors weremore important.

3
Table 1: Kenya: Basic macroeconomic indicators, 1985-96
1985 1986 1987 1988 1989 1990 1991 1992 1993 1994 1995 1996
GDP at market prices(mill. USD) 1
6131 7241 7972 8519 8341 8572 8152 8209 5753 7399 9095 9272
GDP 1990 Prices(mill. USD) 2
7387 8488 9080 9372 8734 8572 7838 7679 5244 6595 7909 7911
Real GDP Growth(annual %) 3
4.2 6.9 5.8 6.0 4.6 4.1 1.4 -0.8 0.4 2.6 4.3 4.1
Inflation Rate(% change CPI, 1990=100)
12.4 4.6 7.4 10.6 12.2 14.5 18.1 25.9 37.7 25.5 0.8 8.4
Exchange Rate(Shillings per USD) 4
16.4 16.2 16.5 17.7 20.6 22.9 27.5 32.2 58.0 56.1 51.4 57.1
Real Ex. Rate (1990=100)(Shillings per USD) 5
22.2 21.3 20.8 21.0 22.6 22.9 23.9 22.3 28.3 21.8 20.4 21.4
Real Interest Rate(in %, period average) 6
1.5 8.6 5.5 2.9 1.7 0.3 -1.5 -9.4 12.1 -2.2 17.5 13.8
Change in Money Supply(M2, annual %) 7
6.2 28.3 10.6 7.7 12.2 18.3 17.9 32.9 24.7 27.3 15.2 23.2
Export of Goods&NF Serv.(mill. USD) 8
1553 1870 1701 1864 1923 2234 2200 2151 2326 2644 2967 3038
Import of Goods&NF Serv.(mill. USD) 8
1615 1857 2108 2315 2540 2679 2302 2143 2051 2420 3503 3417
Export of Goods&NF Serv.(% of GDP)
28.1 29.7 24.1 24.1 24.4 26.2 25.5 22.7 30.2 25.0 24.5 24.6
Import of Goods&NF Serv.(% of GDP)
29.2 29.5 29.8 29.9 32.2 31.4 26.7 22.6 26.6 22.9 28.9 27.7
External Debt(mill. USD) 9
4178 4589 5755 5781 5862 7056 7455 6907 7118 7160 7381 ..
Foreign Aid(mill. USD) 10 430 445 560 836 1064 1187 921 886 911 677 732 ..
Current Account Balance(% of GDP) 11 -1.9 -0.6 -6.3 -5.5 -7.1 -6.1 -2.6 -2.2 1.2 1.3 -4.4 -0.6
Fiscal Balance w/o Grants(% of GDP) 12
-6.4 -4.6 -7.5 -5.6 -8.9 -5.7 -4.9 -3.3 -6.2 -6.2 -2.2a -2.8a
Gross Domestic Savings(% of GDP) 13 24.9 21.9 19.2 19.7 17.3 19.0 19.7 16.4 22.5 21.3 12.9 18.5
bGross Dom. Investment(% of GDP) 13 26.0 21.8 24.3 25.0 24.7 24.2 21.0 16.9 17.6 18.6 19.2 21.1
Notes:
1 African Development Indicators, 1997, World Bank.2 Calculated from 1 using the US GDP deflator (1990=100).3 Calculated from GDP 1990 Prices, IFS, IMF, 1997.4 Principal rate (period average), IFS, IMF, 1997.5 Calculated as ratio of US to Kenyan CPI times the nominal exchange rate, IFS, IMF, 1997.6 Calculated as [(1+i)/(1+π)]-1, where i is Kenya’s Treasury Bill Rate (percent per annum) and π is theinflation rate based on the CPI, IFS, IMF, 1997.7 Percentage change over previous year of Money plus Quasi-Money, IFS, IMF, 1997.8 Converted to US Dollars using the Principal exchange rate (period average), IFS, IMF, 1997.9 World Development Indicators, World Bank, 1997.10 African Development Indicators, World Bank, 1997.11 World Development Indicators, World Bank, 1997.12 Government deficit minus Grants received as a fraction of GDP, IFS, IMF, 1997.13 World Development Indicators, World Bank, 1997.a From HIID. Notes on Kenya’s Economic Situation, April 1997, Table 1.b From Central Bank of Kenya, Monthly Economic Review, March 1997.

4
IV. EMPIRICAL ANALYSIS AND RESULTS
For the purpose of our analysis, we treat Kenya as a small open developing economywhich is affected by world market fluctuations. We analyze the relationship between thegrowth rate of GDP and the exchange rate in three different settings. First, we estimatesingle equation regressions of the real output growth and the real exchange rate. We thenpresent a structural macroeconomic model of the Kenyan economy. And finally, weconsider a VAR model test of the real exchange rate and real income.
We use annual data covering the period 1970-96. A list of all variables and theirdefinitions and source appears in the Appendix B. We could have used quarterly data butthey cover a much shorter period. The principal results of the paper, however, can beillustrated just as well using annual data.
As a working definition of the real exchange rate, in this paper, we use the nominalexchange rate (in terms of units of Kenyan Shillings per British Pound) adjusted with theratio of the foreign price level (United Kingdom CPI, as a proxy for the price oftradables) and the domestic price level (Kenyan CPI, as a proxy for the price of non-tradable good).9 This definition follows the purchasing power parity condition, which,tested for the period 1970-96, gives the following result:
Dependent Variable: Exchange Rate
Variable Coefficient Std. Error t-Statistics Constant 2.760 0.205 13.474
pt 1.129 0.073 15.450pf
t -0.970 0.113 -8.610
R2=0.96
where pt is the domestic price level, pft is the foreign price level and t indicates the time period.
All estimations in the next two sections are made using first differences (with theexception of the interest rates and the interest rate spread) in order to remove thedominance of the trend (or the long term movement) in the series. We consider a possiblelong-run relation between real exchange rate and real income in the section c.
Readers will note that we only present one version of each equation. Several coefficientsare relatively insignificant. Our intention has been to highlight the relation between thegrowth of income and changes in exchange rates within a theoretically plausiblestatistical relation. We leave it to others to refine the relationships in ways that raise thesignificance of other variables.

5
a. Single Equation Estimations
1. The estimated equation for the real income growth follows the standard monetarytheory for an open economy. It investigates the effect of the money supply, inflation, andthe exchange rate on the real output growth (a small letter denotes logarithm of thevariable, e.g., e = Log(E)):
∆∆yrt = f [ ∆∆mt, ∆∆mt-1, ∆∆yrt-1, ∆∆pt, ∆∆pt-1, ∆∆ert , ∆∆ert-1 ],
where ∆∆yrt is the real output growth rate at time t, ∆∆mt is the change in nominal moneysupply (defined as M2), ∆∆pt is the domestic inflation rate based on the consumer priceindex, ∆∆ert is the change in real exchange rate, and ∆∆yrt-1, ∆∆mt-1, ∆∆pt-1, ∆∆ert-1 are theirlagged values.
The estimated parameters along with the standard errors and the t-statistics are:
Dependent variable: Real Income Growth
Variable Coefficient Std. Error t-Statistics Constant 0.034 0.021 1.638
∆∆ert 0.012 0.066 0.178∆∆mt 0.067 0.057 1.178∆∆pt -0.200 0.093 -2.143∆∆yrt-1 0.280 0.236 1.185∆∆ert-1 0.054 0.070 0.774∆∆mt-1 0.097 0.070 1.382∆∆pt-1 -0.028 0.088 -0.316
R2=0.52 D.W.=1.76
The most statistically significant variable in the regression is the rate of inflation. Itscontemporaneous and lagged values have a negative effect on real income growth. Therelation between real money growth and real income growth is positive. These results areconsistent with the theory. The coefficient, however, is not statistically significant.
2. The theoretical basis of the regression equations for the exchange rate is a set of wellknown economic relationships: the purchasing power parity (PPP), based on the law ofone price: P=E.Pf, the money market equilibrium condition: MD=(P.Y)/V(i)=MS, and theinterest arbitrage condition: i-if=∆∆E. Considered together, they motivate the followingmodel of the changes in the real exchange rate:
∆∆ert = f [ ∆∆yrt, ∆∆mrt, irt, ∆∆ert-1, ∆∆yrt-1, ∆∆mrt-1, irt-1 ],
where irt is the domestic real interest rate based on the 3-month Treasury bill rate. Theestimation results are as follows:
6
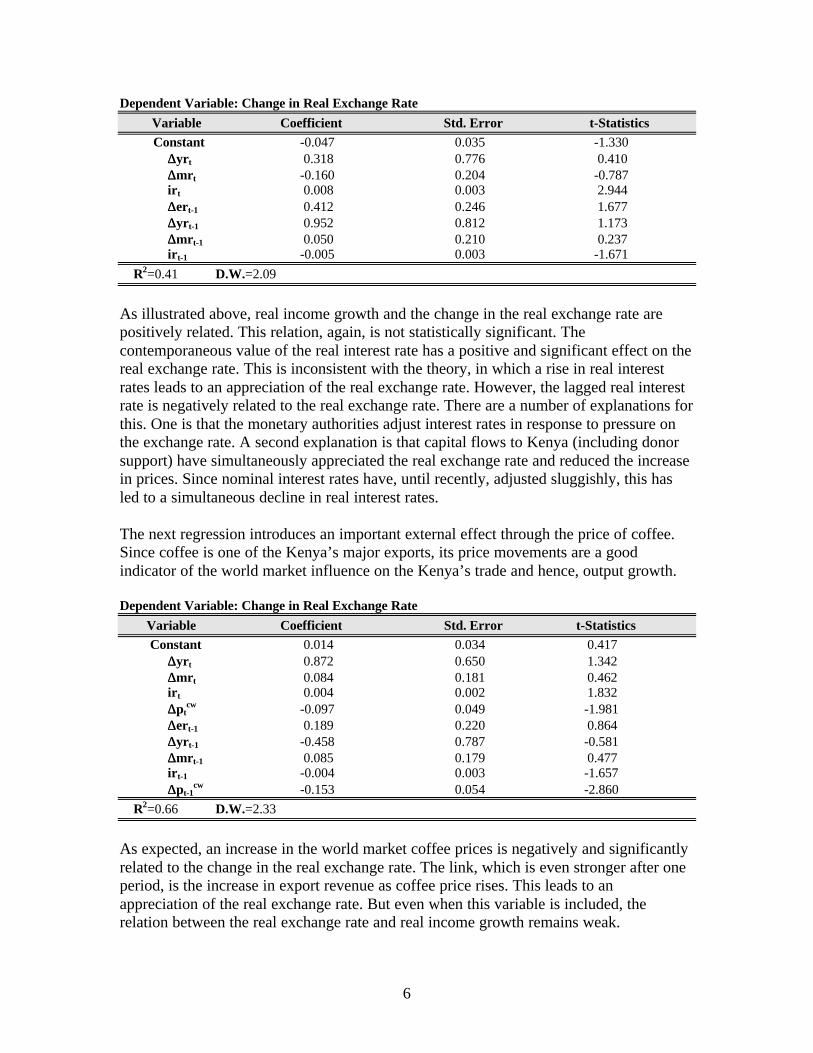
Dependent Variable: Change in Real Exchange Rate
Variable Coefficient Std. Error t-Statistics Constant -0.047 0.035 -1.330
∆∆yrt 0.318 0.776 0.410∆∆mrt -0.160 0.204 -0.787irt 0.008 0.003 2.944∆∆ert-1 0.412 0.246 1.677∆∆yrt-1 0.952 0.812 1.173∆∆mrt-1 0.050 0.210 0.237 irt-1 -0.005 0.003 -1.671
R2=0.41 D.W.=2.09
As illustrated above, real income growth and the change in the real exchange rate arepositively related. This relation, again, is not statistically significant. Thecontemporaneous value of the real interest rate has a positive and significant effect on thereal exchange rate. This is inconsistent with the theory, in which a rise in real interestrates leads to an appreciation of the real exchange rate. However, the lagged real interestrate is negatively related to the real exchange rate. There are a number of explanations forthis. One is that the monetary authorities adjust interest rates in response to pressure onthe exchange rate. A second explanation is that capital flows to Kenya (including donorsupport) have simultaneously appreciated the real exchange rate and reduced the increasein prices. Since nominal interest rates have, until recently, adjusted sluggishly, this hasled to a simultaneous decline in real interest rates.
The next regression introduces an important external effect through the price of coffee.Since coffee is one of the Kenya’s major exports, its price movements are a goodindicator of the world market influence on the Kenya’s trade and hence, output growth.
Dependent Variable: Change in Real Exchange Rate
Variable Coefficient Std. Error t-Statistics Constant 0.014 0.034 0.417
∆∆yrt 0.872 0.650 1.342∆∆mrt 0.084 0.181 0.462irt 0.004 0.002 1.832∆∆pt
cw -0.097 0.049 -1.981∆∆ert-1 0.189 0.220 0.864∆∆yrt-1 -0.458 0.787 -0.581∆∆mrt-1 0.085 0.179 0.477irt-1 -0.004 0.003 -1.657∆∆pt-1
cw -0.153 0.054 -2.860
R2=0.66 D.W.=2.33
As expected, an increase in the world market coffee prices is negatively and significantlyrelated to the change in the real exchange rate. The link, which is even stronger after oneperiod, is the increase in export revenue as coffee price rises. This leads to anappreciation of the real exchange rate. But even when this variable is included, therelation between the real exchange rate and real income growth remains weak.
7
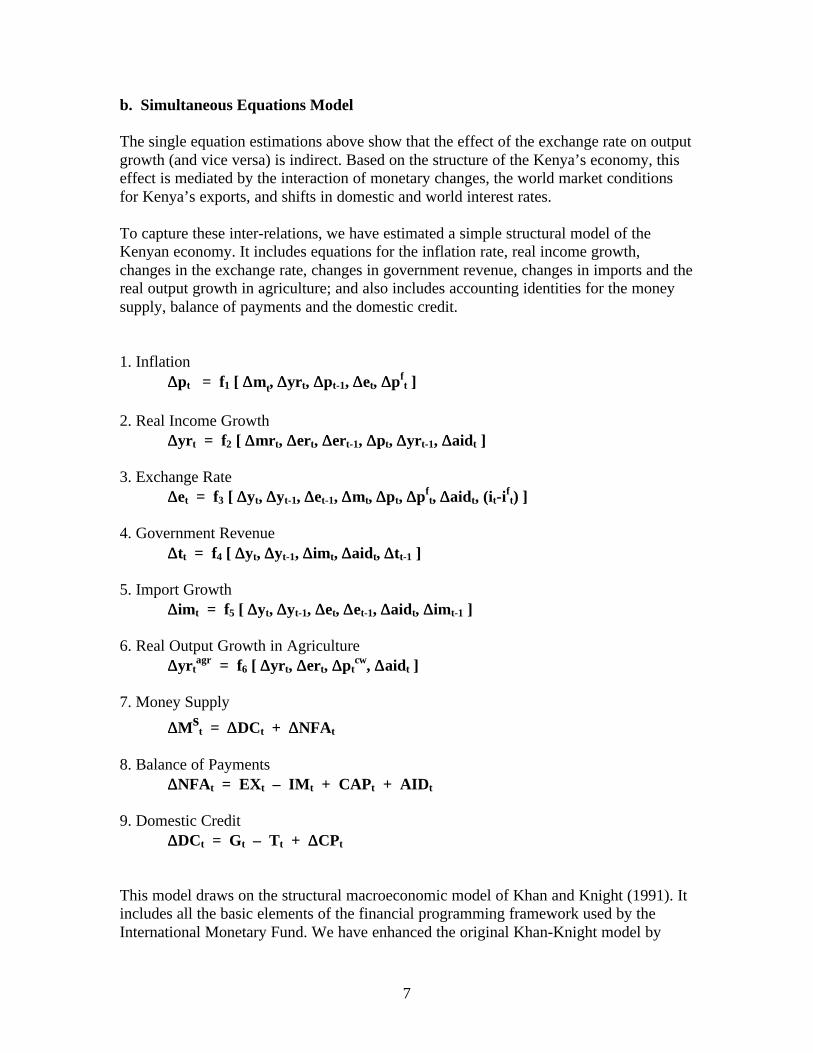
b. Simultaneous Equations Model
The single equation estimations above show that the effect of the exchange rate on outputgrowth (and vice versa) is indirect. Based on the structure of the Kenya’s economy, thiseffect is mediated by the interaction of monetary changes, the world market conditionsfor Kenya’s exports, and shifts in domestic and world interest rates.
To capture these inter-relations, we have estimated a simple structural model of theKenyan economy. It includes equations for the inflation rate, real income growth,changes in the exchange rate, changes in government revenue, changes in imports and thereal output growth in agriculture; and also includes accounting identities for the moneysupply, balance of payments and the domestic credit.
1. Inflation∆∆pt = f1 [ ∆∆mt, ∆∆yrt, ∆∆pt-1, ∆∆et, ∆∆pf
t ]
2. Real Income Growth∆∆yrt = f2 [ ∆∆mrt, ∆∆ert, ∆∆ert-1, ∆∆pt, ∆∆yrt-1, ∆∆aidt ]
3. Exchange Rate∆∆et = f3 [ ∆∆yt, ∆∆yt-1, ∆∆et-1, ∆∆mt, ∆∆pt, ∆∆pf
t, ∆∆aidt, (it-ift) ]
4. Government Revenue∆∆tt = f4 [ ∆∆yt, ∆∆yt-1, ∆∆imt, ∆∆aidt, ∆∆tt-1 ]
5. Import Growth∆∆imt = f5 [ ∆∆yt, ∆∆yt-1, ∆∆et, ∆∆et-1, ∆∆aidt, ∆∆imt-1 ]
6. Real Output Growth in Agriculture∆∆yrt
agr = f6 [ ∆∆yrt, ∆∆ert, ∆∆ptcw, ∆∆aidt ]
7. Money Supply
∆∆Mst = ∆∆DCt + ∆∆NFAt
8. Balance of Payments∆∆NFAt = EXt – IMt + CAPt + AIDt
9. Domestic Credit∆∆DCt = Gt – Tt + ∆∆CPt
This model draws on the structural macroeconomic model of Khan and Knight (1991). Itincludes all the basic elements of the financial programming framework used by theInternational Monetary Fund. We have enhanced the original Khan-Knight model by
8
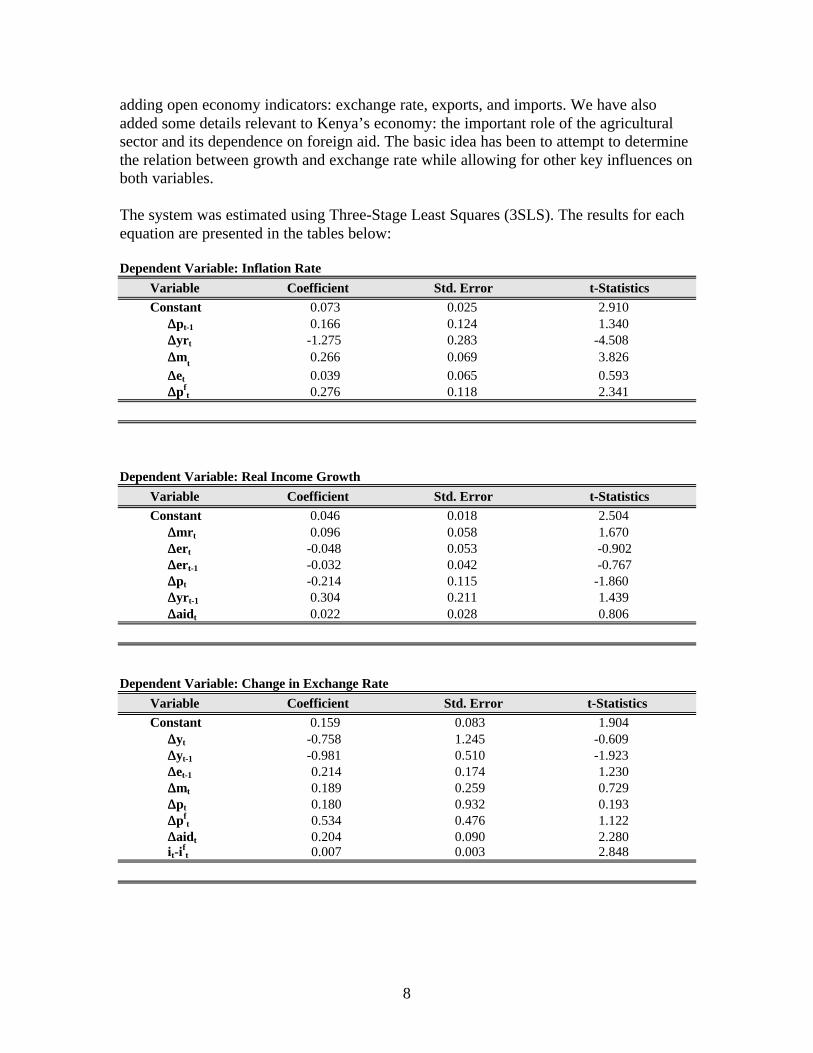
adding open economy indicators: exchange rate, exports, and imports. We have alsoadded some details relevant to Kenya’s economy: the important role of the agriculturalsector and its dependence on foreign aid. The basic idea has been to attempt to determinethe relation between growth and exchange rate while allowing for other key influences onboth variables.
The system was estimated using Three-Stage Least Squares (3SLS). The results for eachequation are presented in the tables below:
Dependent Variable: Inflation Rate
Variable Coefficient Std. Error t-Statistics Constant 0.073 0.025 2.910
∆∆pt-1 0.166 0.124 1.340∆∆yrt -1.275 0.283 -4.508∆∆mt 0.266 0.069 3.826∆∆et 0.039 0.065 0.593∆∆pf
t 0.276 0.118 2.341
Dependent Variable: Real Income Growth
Variable Coefficient Std. Error t-Statistics Constant 0.046 0.018 2.504
∆∆mrt 0.096 0.058 1.670∆∆ert -0.048 0.053 -0.902∆∆ert-1 -0.032 0.042 -0.767∆∆pt -0.214 0.115 -1.860∆∆yrt-1 0.304 0.211 1.439∆∆aidt 0.022 0.028 0.806
Dependent Variable: Change in Exchange Rate
Variable Coefficient Std. Error t-Statistics Constant 0.159 0.083 1.904
∆∆yt -0.758 1.245 -0.609∆∆yt-1 -0.981 0.510 -1.923∆∆et-1 0.214 0.174 1.230∆∆mt 0.189 0.259 0.729∆∆pt 0.180 0.932 0.193∆∆pf
t 0.534 0.476 1.122∆∆aidt 0.204 0.090 2.280it-i
ft 0.007 0.003 2.848
9
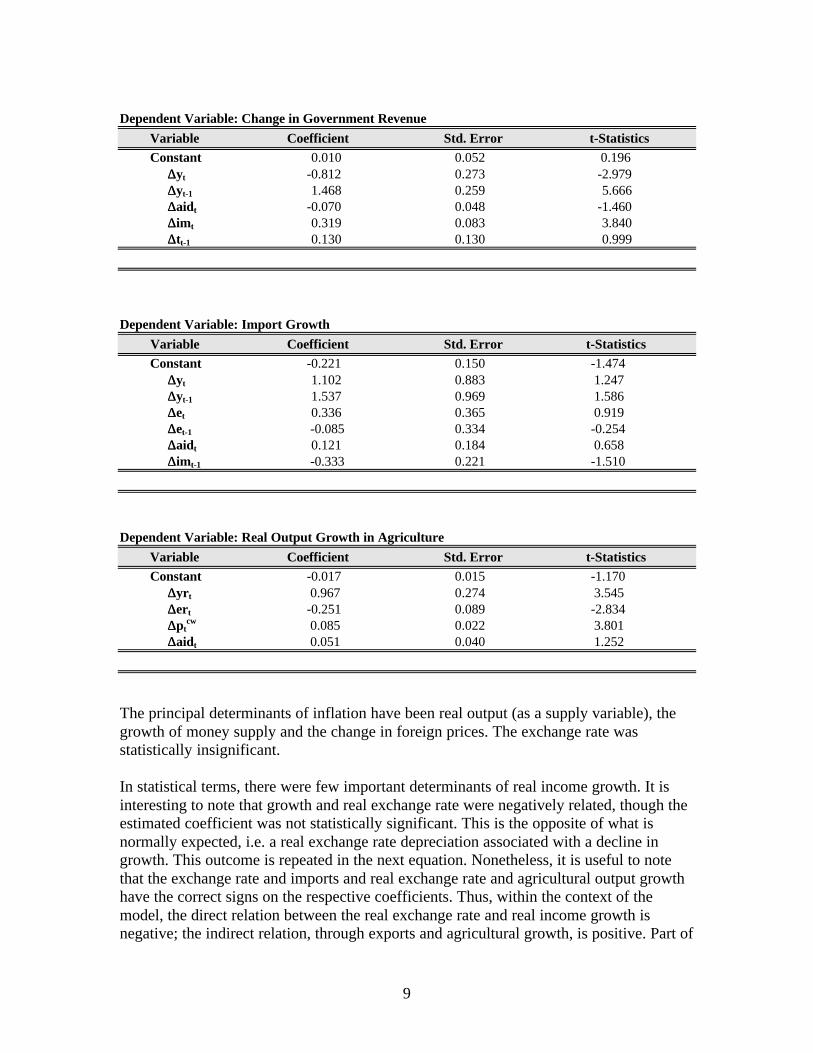
Dependent Variable: Change in Government Revenue
Variable Coefficient Std. Error t-Statistics Constant 0.010 0.052 0.196
∆∆yt -0.812 0.273 -2.979∆∆yt-1 1.468 0.259 5.666∆∆aidt -0.070 0.048 -1.460∆∆imt 0.319 0.083 3.840 ∆∆tt-1 0.130 0.130 0.999
Dependent Variable: Import Growth
Variable Coefficient Std. Error t-Statistics Constant -0.221 0.150 -1.474
∆∆yt 1.102 0.883 1.247∆∆yt-1 1.537 0.969 1.586∆∆et 0.336 0.365 0.919∆∆et-1 -0.085 0.334 -0.254∆∆aidt 0.121 0.184 0.658∆∆imt-1 -0.333 0.221 -1.510
Dependent Variable: Real Output Growth in Agriculture
Variable Coefficient Std. Error t-Statistics Constant -0.017 0.015 -1.170
∆∆yrt 0.967 0.274 3.545∆∆ert -0.251 0.089 -2.834∆∆pt
cw 0.085 0.022 3.801∆∆aidt 0.051 0.040 1.252
The principal determinants of inflation have been real output (as a supply variable), thegrowth of money supply and the change in foreign prices. The exchange rate wasstatistically insignificant.
In statistical terms, there were few important determinants of real income growth. It isinteresting to note that growth and real exchange rate were negatively related, though theestimated coefficient was not statistically significant. This is the opposite of what isnormally expected, i.e. a real exchange rate depreciation associated with a decline ingrowth. This outcome is repeated in the next equation. Nonetheless, it is useful to notethat the exchange rate and imports and real exchange rate and agricultural output growthhave the correct signs on the respective coefficients. Thus, within the context of themodel, the direct relation between the real exchange rate and real income growth isnegative; the indirect relation, through exports and agricultural growth, is positive. Part of

10
the negative association may be attributed to the role of foreign aid. In the model, aidshows up with a positive effect on real income growth (though the estimated coefficientis relatively insignificant). Aid, however, had a highly significant positive impact on theexchange rate. One explanation is that slower income growth has put pressure on theexchange rate leading to an increase in aid. An alternative explanation stems from thenegative relation between aid and government revenue. An increase in aid reducesgovernment revenue and raises the growth of money supply to cover the budget deficit.This raises the rate of inflation, depreciates the shilling, and lowers the rate of growth.
c. VAR Model and Cointegration Test Results
The single equation estimates and the simultaneous equations model results provide someindication of the direct and indirect links between exchange rate movements and growth.They expressed the short run dynamics of the real exchange rate--real income growthrelationship. These results, and the basic conclusions of this paper, do not concern thequestion of whether the two variables are related in a long run.
However, we address this issue by running a Johansen cointegration test based on a VARmodel of the real income and the real exchange rate. Since there is no direct theoreticalconnection between these two variables, the structure of the VAR model we use has to beseen as a statistical relationship only.
Estimating VAR models of the real exchange rate and real income with different numberof lags (from 1 to 4) and comparing the value of the Akaike Information Criteria (AIC)statistics suggest that the optimal VAR structure has one lag for each variable:
yrt = c1 + β11 yrt-1 + β12ert-1 + u1
ert = c2 + β21 yrt-1 + β22 ert-2 + u2,
We then use the Johansen method for the VAR model with one lag to test forcointegration. The likelihood ratio test finds no cointegration in this case10.
These results are consistent with our earlier findings. The real exchange rate and the realincome are not significantly related. At most, there is a weak long-run relationshipbetween the two variables.
11
V. CONCLUSIONS
This paper has provided empirical estimates of the relation between exchange rates andeconomic growth in Kenya. The results show that there is not a statistically significantdirect relationship between the two variables. They, however, are indirectly linkedthrough several channels, including money, imports, agricultural production, and foreignaid. The vector autoregression results show that the real exchange rate and the realincome are not significantly cointegrated. In the long run, the exchange rate and incomemay not drift apart, but in the short run their relationship is weak and indirect. Together,these results provide statistical confirmation of our earlier conclusion: improvement inexchange rate management in Kenya can influence the rate of income growth, but only inthe context of a broad-based structural adjustment and reform.

12
APPENDIX A
DEFINITION OF VARIABLES
∆∆pt - rate of inflation (P is the Kenyan Consumer Price Index, 1990=100)∆∆pt-1 - a proxy for the expected inflation rate at time t∆∆yt - growth rate of nominal GDP (market prices)∆∆yrt - growth rate of real GDP (market prices, 1990=100)∆∆yrt
agr - growth rate of real output in agricultural sector (market prices, 1990=100)∆∆pf
t - foreign rate of inflation (Pf is the U.K. Consumer Price Index, 1990=100)et - nominal exchange rate in units of domestic currency per British Poundert - real exchange rate (nominal exchange rate adjusted for domestic and foreignprices)mt - nominal stock of money (Money plus Quasi-Money)mrt - real money balancesit - nominal domestic interest rateif
t - nominal foreign interest rateit-i
ft - interest rate spread
pcwt - world market coffee price
imt - imports of goods and servicesext - export of goods and servicesgt - nominal government expenditurett - nominal government revenuesCAPt - a proxy for capital flowsaidt - aid flowsNFAt - net foreign assetsDCt - domestic creditCPt - claims of the banking system on the domestic private sector and otherfinancial institutions
Note: Lower-case letter denotes the logarithm of the upper-case variable.
13
DATA SOURCES
From International Financial Statistics, IMF
National Accounts
Y - Gross Domestic Product at market prices, in millions of Kenyan Shillings.Yr - Real GDP (at 1990 market prices), in millions of Kenyan Shillings.IM - Imports of Goods and Non-Factor Services, in millions of Kenyan Shillings.EX - Export of Goods and Non-Factor Services, in millions of Kenyan Shillings.
Prices
P - Consumer Price Index (1990=100).Pf - Consumer Price Index of the U.K. (1990=100).E - Official Exchange Rate (period average), in Kenyan Shillings per British Pound.Er - Real Exchange Rate (Kenyan Shillings per British Pound), calculated as Er = E*(Pf/P).Pcw - Coffee Price (US cents/pound) of Other Milds (New York), converted into Kenyan Shillings/poundusing the Official Exchange Rate (period average).
Monetary Survey
M - Broad Money (Money plus Quasi-Money), in millions of Kenyan Shillings.Mr - Real Money Balances calculated as M/P, in millions of Kenyan Shillings.NFA - Net Foreign Assets, in millions of Kenyan Shillings.DC - Domestic Credit, in millions of Kenyan Shillings.CP - Claims on Private Sector plus Claims on Other Financial Institutions, in millions of KenyanShillings.
Interest Rates
i - 3-Month Treasury bill Rate (percent per annum).if - 3-Month Treasury bill Rate (percent per annum) of the U.K.ir - Real Interest Rate, calculated as ir = [(1+i)/(1+π)]-1, where π = ∆logP is the inflation rate.
Government Finance
G - Government Expenditure, in millions of Kenyan Shillings.T - Government Revenue, in millions of Kenyan Shillings.
From World Tables, World Bank
Yagr - Real Output in Agriculture, as a percent of GDP, recalculated in millions of Kenyan Shillings andcalculated in real terms using the GDP deflator (1990=100).
Note: The numbers for 1993-96 are IMF Staff estimates.
AID - Foreign Aid, calculated using Foreign Aid per capita (in US Dollars) and Population (total) seriesfrom WDI and the Official Exchange Rate (period average) series from IFS, IMF.
14
REFERENCES
Br@@utigam, Deborah, “Governance, Economy and Foreign Aid,” Studies inComparative International Development, v.27, n.2, 1992.
Cuthbertson, K., Stephen G. Hall and Mark P. Taylor, Applied EconometricTechniques, Philip Allan, Great Britain, 1992.
Dickey, D. A. and W. A. Fuller, “Distribution of the Estimators for AutoregerssiveTime Series with a Unit Root,” Journal of the American Statistical Association, v.10,1982.
Edwards, S., “Exchange Rate Misalignment in Developing Countries,” World BankOccasional Papers, n.2, New Series, 1989.
Frenkel, J. A. and M. L. Mussa, "Asset Markets, Exchange Rates and the Balance ofPayments" in R. W. Jones and P. B. Kenen eds., Handbook of International Economics,v.II, New York: Elsevier Science Publishers, 1985.
Goodhart, C. A. E., Money, Information and Uncertainty, 2nd ed., Cambridge: The MITPress, 1989.
Hallwood, P. and R. MacDonald, International Monetary Theory, Evidence andInstitutions, Oxford: Basic Blackwell, 1986.
Helmers, F.L.C.H., "Real Exchange-Rate Indexes" Annex C in Dornbusch and Helmersop. cit., 1988.
Johnson, H. G., "The Monetary Approach to Balance of Payments Theory," Ch.9 inH.G. Johnson, Further Essays in Monetary Economics, Cambridge: Harvard UniversityPress, 1973.
Khan, M. S. and Malcolm D. Knight, “Stabilization Programs in Developing Countries:A Formal Framework” in Mohsin S. Khan, Peter J. Monteil and Nadeem U. Haque, ed.,Macroeconomic Models for Adjustment in Developing Countries, International MonetaryFund, Washington, D.C., 1991.
MacDonald, R., Floating Exchange Rates: Theories and Evidence, Boston: UnwinHyman, 1988.
Maciejewski, E. B., "`Real' Effective Exchange Rate Indices: A Re-Examination of theMajor Conceptual and Methodological Issues," IMF Staff Papers, v.30, n.3, September1983.
15
McPherson, M. F., “Exchange Rates and Growth in Kenya,” Development DiscussionPaper No.607, Harvard Institute for International Development, October 1997.
Meier, G. M., Leading Issues in Economic Development, 5th Edition New York: OxfordUniversity Press, 1989.
Roemer, M. and J. J. Stern, Cases in Economic Development: Projects, Policies andStrategies, London: Butterworths, 1981.
Rogoff, K., "The Purchasing Power Parity Puzzle," Journal of Economic Literature,v.34, n.2, 1996.
Sachs, J. and F. Larrain, Macroeconomics in the Global Economy, Englewood Cliffs:Prentice Hall, 1993.
Stock, J., “Asymptotic Properties of Least Squares Estimators of Cointegrating Vectors,”Econometrica, 55, 1987.
16
NOTES 1. Malcolm F. McPherson, “Exchange Rates and Economic Growth in Kenya,” Development DiscussionPaper No. 607, October 1997, HIID.
2. There is a large literature on this relationship--Niehans (1978: Ch. 11), Frenkel and Mussa (1985),Hallwood and MacDonald (1986) MacDonald (1988), Goodhart (1989:Ch. 8), Edwards (1989), and Sachsand Larrain (1993: Chs. 10, 11).
3. Sachs and Larrain (1993: pp.297-300).
4. The demand for money can be written as domestic prices multiplied by a function of real income andinterest rates. For a fixed exchange rate, any excess demand for (supply of) money will be reflected as theaccumulation (depletion) of international reserves. For a floating exchange rate, any excess demand for(supply of) money will lead to an appreciation (depreciation) of the exchange rate. These portfolio changesdirectly influence domestic prices. Under a fixed exchange rate, excess demand for (supply of) moneyreduces domestic demand thereby reducing (increasing) the rate of inflation. These changes in prices will,respectively, under-value (over-value) the real exchange rate. With a floating exchange rate, the domesticprice changes will lead to movements in the exchange rate. Due to the existence of lags, uncertainty as tothe permanence of policy changes, credibility effects, and so on, the above adjustments will not occursmoothly in practice. The above effects, however, are relatively consistent over the medium terms (Johnson1973: Ch.9; Sachs and Larrain 1993:299-301; and Rogoff 1996).
5. Maciejewski (1983); Helmers, (1988).
6. Prices are typically misaligned in two ways. In static terms, the comparative costs of production anddistribution at the existing real exchange rate are "too high" in that the underlying economic "absorption"generates a balance of payments deficit, which cannot be financed. In dynamic terms, some behavioremerges (such as persistent deficit financing), which tends to raise the rate of overall domestic inflationabove the corresponding rates in the country's main trading partners. In the former case, the real over-valuation can be corrected by a devaluation, which leads to "expenditure-switching" and "demand-reduction." In the latter case, the real over-valuation requires a change in the behavior that leads to excessmoney creation combined with a floating exchange rate, or a pre-determined, credible "tablita" whichregularly offsets the effects of the higher rate of domestic inflation.
7. Here, and throughout the paper, the exchange rate Et is defined as units of Kenyan Shillings per BritishPound. Thus, an increase in Et will correspond to depreciation of the domestic currency price.
8. The average population growth rate for the period 1990-96 was 2.7%.
9. The choice of the United Kingdom as a representative for the World in this open economy model forKenya is consistent with the fact that the U.K. is Kenya’s major trading partner.
10. In a two lag setting: yrt = c1 + β11 yrt-1 + β12 yrt-2 + β13ert-1 + β14ert-2 + u1
ert = c2 + β21 yrt-1 + β22 yrt-2 + β23ert-1 + β24ert-2 + u2,
the Johansen test shows that there is a cointegration relationship between the two series at 5% significancelevel. The normalized cointegrating coefficients are: er yr c 1.00 -0.72 5.12
(0.14)
To Order EAGER Publications
EAGER Publications/BHMP.O. Box 3415
Alexandria, Virginia 22302Tel: (703) 299-0650 Fax: (703) 299-0651
e-mail: [email protected]
EAGER Publications can be downloaded from www.eagerproject.comor through USAID’s website at http://cdie.usaid.gov/library/
Policy Briefs based on EAGER researchfunded by the U.S. Agency for International Development:
1. Can Mali Increase Red Meat Exports? Metzel, Jeffrey, Abou Doumbia, Lamissa Diakite, and N’Thio AlphaDiarra. Prospects for Developing Malian Livestock Exports. Cambridge, MA: Associates for International Resourcesand Development, 1997. Available in French.
2. The Livestock Sector in Mali - Potential for the Future. Metzel, Jeffrey, Abou Doumbia, Lamissa Diakite, andN’Thio Alpha Diarra. Prospects for Developing Malian Livestock Exports. Cambridge, MA: Associates forInternational Resources and Development, 1997. Available in French.
3. Mali’s Manufacturing Sector: Policy Reform for Success. Cockburn, John, Eckhard Siggel, Massaoly Coulibaly,and Sylvain Vézina. Manufacturing Competitiveness and the Structure of Incentives in Mali. Cambridge, MA:Associates for International Resources and Development, 1997. Available in French.
4. Growth and Equity: Gemstone and Gold Mining in Tanzania. Phillips, Lucie Colvin, Rogers Sezinga, HajiSemboja, and Godius Kahyarara. Gemstone and Gold Marketing for Small-Scale Mining in Tanzania. Arlington, VA:International Business Initiatives, 1997. Available in French.
5. Financial Services and Poverty in Senegal. Ndour, Hamet, and Aziz Wané. Financial Intermediation for thePoor. Cambridge, MA: Harvard Institute for International Development, 1997. Available in French.
6. Need to Promote Exports of Malian Rice. Barry, Abdoul W., Salif B. Diarra, and Daouda Diarra. Promotion ofthe Regional Export of Malian Rice. Cambridge, MA: Associates for International Resources and Development, 1997. Available in French.
7. Trade Policy Reform: A Success? Metzel, Jeffrey, and Lucie C. Phillips. Bringing Down Barriers to Trade: TheExperience of Trade Policy Reform. Cambridge, MA: Associates for International Resources and Development, 1997. Available in French.
8. Excise Taxes: A Greater Role in Sub-Saharan Africa? Bolnick, Bruce, and Jonathan Haughton. Tax Policy inSub-Saharan Africa: Reexamining the Role of Excise Taxation. Cambridge, MA: Harvard Institute for InternationalDevelopment, 1997. Available in French.
9. Status of Financial Intermediation for the Poor in Africa. Nelson, Eric. Financial Intermediation for the Poor:Survey of the State of the Art. Bethesda, MD: Development Alternatives Incorporated, 1997. Available in French.
10. Foreign Direct Investment and Institutions. Wilhelms, Saskia K.S. Foreign Direct Investment and ItsDeterminants in Emerging Economies. Cambridge, MA: Associates for International Resources and Development,1997. Available in French.
11. Strong Institutions Support Market-Oriented Policies. Goldsmith, Arthur. Institutions and Economic Growthin Africa. Cambridge, MA: Harvard Institute for International Development, 1997. Available in French.
12. Reducing Tax Evasion. Wadhawan, Satish, and Clive Gray. Enhancing Transparency in Tax Administration: ASurvey. Cambridge, MA: Harvard Institute for International Development, 1997. Available in French.
13. Can Africa Take Lessons from the U.S. Approach to Tax Evasion? Gray, Clive. Enhancing Transparency inTax Administration: United States Practice in Estimating and Publicizing Tax Evasion. Cambridge, MA: HarvardInstitute for International Development, 1997. Available in French.
14. Estimating Tax Buoyancy, Elasticity and Stability. Haughton, Jonathan. Estimating Tax Buoyancy, Elasticity,and Stability. Cambridge, MA: Harvard Institute for International Development, 1997. Available in French.
15. Estimating Demand Curves for Goods Subject to Excise Taxes. Jonathan Haughton. Estimating DemandCurves for Goods Subject to Excise Taxes. Cambridge, MA: Harvard Institute for International Development, 1997. Available in French.
16. Fixed or Floating Exchange Rates? Amvouna, Anatolie Marie. Determinants of Trade and Growth Performancein Africa: A Cross-Country Analysis of Fixed Versus Floating Exchange Rate Regimes. Cambridge, MA: Associatesfor International Resources and Development, 1997. Available in French.
17. Trade and Development in Africa. Stryker, J. Dirck. Trade and Development in Africa. Cambridge, MA:Associates for International Resources and Development, 1997. Available in French.
18. Increasing Demand for Labor in South Africa. Stryker, J. Dirck, Fuad Cassim, Balakanapathy Rajaratnam,Haroon Bhorat, and Murray Leibbrandt. Increasing Demand for Labor in South Africa. Cambridge, MA: Associatesfor International Resources and Development, 1998.
19. Structural Adjustment: Implications for Trade. Barry, Abdoul W., B. Lynn Salinger, and Selina Pandolfi.Sahelian West Africa: Impact of Structural Adjustment Programs on Agricultural Competitiveness and RegionalTrade. Cambridge, MA: Associates for International Resources and Development, 1998. Available in French.
20. The Uruguay Round: Impact on Africa. Hertel, Thomas W., William A. Masters, and Aziz Elbehri. TheUruguay Round and Africa: A Global, General Equilibrium Analysis. Cambridge, MA: Associates for InternationalResources and Development, 1998. Available in French.
21. Are Formal Trade Agreements the Right Strategy? Radelet, Steven. Regional Integration and Cooperation inSub-Saharan Africa: Are Formal Trade Agreements the Right Strategy? Cambridge, MA: Harvard Institute forInternational Development, 1997.
22. Textiles in South Africa. Flaherty, Diane P., and B. Lynn Salinger. Learning to Compete: Innovation and Genderin the South African Clothing Industry. Cambridge, MA: Associates for International Resources and Development,1998. Available in French.
23. Barriers to Business Expansion in a New Environment: The Case of Senegal. Beltchika-St. Juste, Ndaya,Mabousso Thiam, J. Dirck Stryker, with assistance from Pape Ibrahima Sow. Barriers to Business Expansion in a NewEnvironment: The Case of Senegal. Cambridge, MA: Associates for International Resources and Development, 1999.Available in French.
24. Government and Bureaucracy. Goldsmith, Arthur. Africa’s Overgrown State Reconsidered: Bureaucracy andEconomic Growth. Cambridge, MA: Harvard Institute for International Development, 1998.
25. What Can We Do To Stop Smuggling in Tanzania? Phillips, Lucie Colvin, Rogers Sezinga, and Haji Semboja. Based on EAGER research in Tanzania on gold and gems marketing. Arlington, VA: International Business Initiatives,1997.
26. Financial Programming in East and Southern Africa. Workshop held in Lilongwe, Malawi. June, 1999.
27. Restarting and Sustaining Growth and Development in Africa: A Framework for Action. Duesenberry,James S., Arthur A. Goldsmith, and Malcolm F. McPherson. Restarting and Sustaining Growth and Development inAfrica. Cambridge, MA: Harvard Institute for International Development, 2000.
28. Restarting and Sustaining Growth and Development in Africa: Enhancing Productivity. Duesenberry,James S., Arthur A. Goldsmith, and Malcolm F. McPherson. Restarting and Sustaining Growth and Development inAfrica. Cambridge, MA: Harvard Institute for International Development, 2000.
29. A Pragmatic Approach to Policy Change. Duesenberry, James S., and Malcolm F. McPherson. Restarting andSustaining Growth and Development in Africa: The Role of Macroeconomic Management. Cambridge, MA: HarvardInstitute for International Development, forthcoming in 2000.
30. Finance Capital and Real Resources. Duesenberry, James S., and Malcolm F. McPherson. Restarting andSustaining Growth and Development in Africa: The Role of Macroeconomic Management. Cambridge, MA: HarvardInstitute for International Development, forthcoming in 2000.
31. The Role of Central Bank Independence in Improved Macroeconomic Management. Duesenberry, James S.,and Malcolm F. McPherson. Restarting and Sustaining Growth and Development in Africa: The Role ofMacroeconomic Management. Cambridge, MA: Harvard Institute for International Development, forthcoming in 2000.
32. Governance and Macroeconomic Management. Duesenberry, James S., and Malcolm F. McPherson. Restartingand Sustaining Growth and Development in Africa: The Role of Improved Macroeconomic Management. Cambridge,MA: Harvard Institute for International Development, 2000.
33. The Benefits and Costs of Seignorage. McPherson, Malcolm F. Seignorage in Highly Indebted DevelopingCountries. Cambridge, MA: Harvard Institute for International Development, 2000.
35. Global Trade Analysis for Southern Africa. Masters, William A. Based on EAGER research in Southern Africa.West Lafayette, IN: Purdue University, 2000.
36. Modeling Long-Term Capacity Expansion Options for the Southern African Power Pool (SAPP). Sparrow,F. T., Brian H. Bowen, and Zuwei Yu. Modeling Long-Term Capacity Expansion Options for the Southern AfricanPower Pool (SAPP). West Lafayette, IN: Purdue University, 1999.
38. Africa’s Opportunities in the New Global Trading Scene. Salinger, B. Lynn, Anatolie Marie Amvouna, andDeirdre Murphy Savarese. New Trade Opportunities for Africa. Cambridge, MA: Associates for InternationalResources and Development, 1998. Available in French.
39. Implications for Africa of Initiatives by WTO, EU and US. Plunkett, Daniel. Implications for Africa ofInitiatives by WTO, EU and US. Cambridge, MA: Associates for International Resources and Development, 1999.
40. Domestic Vanilla Marketing in Madagascar. Metzel, Jeffrey, Emilienne Raparson, Eric Thosun Mandrara. TheCase of Vanilla in Madagascar. Cambridge, MA: Associates for International Resources and Development, 1999.
41. The Transformation of Microfinance in Kenya. Rosengard, Jay, Ashok S. Rai, Aleke Dondo, and Henry O.Oketch. Microfinance Development in Kenya: Transforming K-Rep’s Microenterprise Credit Program into aCommercial Bank. Cambridge, MA: Harvard Institute for International Development, 1999.
42. Africans Trading with Africans: Cross-Border Trade – The Case of Ghana. Morris, Gayle A., and John Dadson. Ghana: Cross Border Trade Issues. Arlington, Virginia: International Business Initiatives, 2000.
43. Trade Liberalization and Growth in Kenya. Glenday, Graham, and T. C. I. Ryan. Based on EAGER Research.Cambridge, MA: Belfer Center for Science & International Affairs, 2000.
46. Labor Demand and Labor Productivity in Ghana. Gyan-Baffour, George, and Charles Betsey, in collaborationwith Kwadwo Tutu and Kwabia Boateng. Increasing Labor Demand and Labor Productivity in Ghana. Cambridge,MA: Belfer Center for Science & International Affairs, 2000.
African Economic Policy Discussion Papers
1. Kähkönen, S., and P. Meagher. July 1998. Contract Enforcement and Economic Performance. Available inFrench.
2. Bolnick, B., and J. Haughton. July 1998. Tax Policy in Sub-Saharan Africa: Examining the Role of ExciseTaxation. Available in French.
3. Wadhawan, S. C., and C. Gray. July 1998. Enhancing Transparency in Tax Administration: A Survey. Available inFrench.
4. Phillips, L. C. July 1998. The Political Economy of Policy Making in Africa. 5. Metzel, J., and L. C. Phillips. July 1998. Bringing Down Barriers to Trade: The Experience of Trade PolicyReform. Available in French.
6. Salinger, B. L., A. M. Amvouna, and D. M. Savarese. July 1998. New Trade Opportunities for Africa. Available inFrench.
7. Goldsmith, Arthur. July 1998. Institutions and Economic Growth in Africa. Available in French.
8. Flaherty, D. P., and B. L. Salinger. July 1998. Learning to Compete: Innovation and Gender in the South AfricanClothing Industry.
9. Wilhelms, S. K. S. July 1998. Foreign Direct Investment and Its Determinants in Emerging Economies. Availablein French.
10. Nelson, E. R. August 1998. Financial Intermediation for the Poor: Survey of the State of the Art. Available inFrench.
11. Haughton, J. August 1998. Estimating Tax Buoyancy, Elasticity, and Stability.
12. Haughton, J. August 1998. Estimating Demand Curves for Goods Subject to Excise Taxes.
13. Haughton, J. August 1998. Calculating the Revenue-Maximizing Excise Tax.
14. Haughton, J. August 1998. Measuring the Compliance Cost of Excise Taxation.
15. Gray, C. August 1998. United States Practice in Estimating and Publicizing Tax Evasion.
16. Cockburn, J., E. Siggel, M. Coulibaly, and S. Vézina. August 1998. Measuring Competitiveness and its Sources:The Case of Mali’s Manufacturing Sector. Available in French.
17. Barry, A. W., S. B. Diarra, and D. Diarra. April 1999. Promotion of Regional Exports of Malian Rice. Available inFrench.
18. Amvouna, A. M. July 1998. Determinants of Trade and Growth Performance in Africa: A Cross-CountryAnalysis of Fixed verus Floating Exchange Rate Regimes. Available in French.
19. Stryker, J. D. June 1999. Dollarization and Its Implications in Ghana. Available in French.
20. Radelet, S. July 1999. Regional Integration and Cooperation in Sub-Saharan Africa: Are Formal TradeAgreements the Right Strategy?
21. Plunkett, D. September 1999. Implications for Africa of Initiatives by the WTO, EU and US.
22. Morris, G. A. and J. Dadson. March 2000. Ghana: Cross-Border Trade Issues.
23. Musinguzi, P., with M. Obwona and J. D. Stryker. April 2000. Monetary and Exchange Rate Policy in Uganda.
24. Siggel, E., and G. Ssemogerere. June 2000. Uganda’s Policy Reforms, Industry Competitiveness and RegionalIntegration: A comparison with Kenya.
25. Siggel, E., G. Ikiara, and B. Nganda. June 2000. Policy Reforms, Competitiveness and Prospects of Kenya’sManufacturing Industries: 1984-1997 and Comparisons with Uganda.
26. McPherson, M. F. July 2000. Strategic Issues in Infrastructure and Trade Policy.
27. Sparrow, F. T., B. H. Bowen, and Z. Yu. July 1999. Modeling Long-Term Capacity Expansion Options for theSouthern African Power Pool (SAPP). Available in French.
28. Goldsmith, A., M. F. McPherson, and J. Duesenberry. January 2000. Restarting and Sustaining Growth andDevelopment in Africa.
29. Gray, C., and M. F. McPherson. January 2000. The Leadership Factor in African Policy Reform and Growth.
30. Masters, W. A., R. Davies, and T. W. Hertel. November 1998 revised June 1999. Europe, South Africa, andSouthern Africa: Regional Integration in a Global Context. Available in French.
31. Beltchika-St. Juste, N., M. Thiam, J. D. Stryker, with assistance from P. I. Sow. 1999. Barriers to BusinessExpansion in a New Environment: The Case of Senegal. Available in French.
32. Salinger, B. L., D. P. Flaherty, and M. Keswell. September 1999. Promoting the Competitiveness of Textiles andClothing Manufacture in South Africa.
33. Block, S. A. August 1999. Does Africa Grow Differently?
34. McPherson, M. F. and T. Rakovski. January 2000. A Small Econometric Model of the Zambian Economy.
40. Bräutigam, D. July 2000. Interest Groups, Economic Policy, and Growth in Sub-Saharan Africa.
43. Glenday, G., and D. Ndii. July 2000. Export Platforms in Kenya.
44. Glenday, G. July 2000. Trade Liberalization and Customs Revenues: Does trade liberalization lead to lowercustoms revenues? The Case of Kenya.
46. Goldsmith, A. June 2000. Risk, Rule, and Reason in Africa.
47. Goldsmith, A. June 2000. Foreign Aid and Statehood in Africa.
49. McPherson, M. F., and C. Gray. July 2000. An ‘Aid Exit’ Strategy for African Countries: A Debate.
53. McPherson, M. F., and C. B. Hill. June 2000. Economic Growth and Development in Zambia: The Way Forward.
56. McPherson, M. F., and T. Rakovski. July 2000. Exchange Rates and Economic Growth in Kenya: An EconometricAnalysis.
57. McPherson, M. F. July 2000. Exchange Rates and Economic Growth in Kenya.
58. McPherson, M. F. July 2000. Seignorage in Highly Indebted Developing Countries.
EAGER Research Reports
Cockburn, John, E. Siggel, M. Coulibaly, and S. Vézina. October 1998. Measuring Competitiveness and its Sources:The Case of Mali’s Manufacturing Sector. Available in French.
McEwan, Tom et al. A Report on Six Studies of Small, Medium and Micro Enterprise Developments in Kwazulu-Natal.
McPherson, Malcolm F. Sustaining Trade and Exchange Rate Reform in Africa: Lessons for MacroeconomicManagement.
Metzel, Jeffrey, A. Doumbia, L. Diakite, and N. A. Diarra. July 1998. Prospects for Developing Malian Red Meat andLivestock Exports. Available in French.
Salinger, Lynn B., H. Bhorat, D. P. Flaherty, and M. Keswell. August 1999. Promoting the Competitiveness of Textilesand Clothing Manufacture in South Africa.
Sparrow, F. T., and B. H. Bowen. July 1999. Modeling Electricity Trade in South Africa: User Manual for the Long-Term Model.
Other Publications
McPherson, Malcolm F., and Arthur Goldsmith. Summer-Fall 1998. Africa: On the Move? SAIS Review, A Journal ofInternational Affairs, The Paul H. Nitze School of Advanced International Studies, The John Hopkins University,Volume XVIII, Number Two, p. 153.
EAGER All Africa Conference Proceedings. October 18-20, 1999.
EAGER Regional Workshop Proceedings on the Implementation of Financial Programming. Lilongwe, Malawi. June10-11, 1999.
EAGER Workshop Proceedings Senegal. November 4-6, 1998.
EAGER Workshop Proceedings South Africa. February 4-6, 1998.
EAGER Workshop Proceedings Tanzania. August 13-16, 1997.
EAGER Workshop Proceedings Ghana. February 5-8, 1997.
EAGER Workshop Proceedings. Howard University. July 17-19, 1996.
EAGER Workshop Proceedings Uganda. June 19-22, 1996.