exchange traded funds: history, trading and research · pdf fileexchange traded funds:...
TRANSCRIPT
HAL Id: halshs-00162223https://halshs.archives-ouvertes.fr/halshs-00162223
Submitted on 12 Jul 2007
HAL is a multi-disciplinary open accessarchive for the deposit and dissemination of sci-entific research documents, whether they are pub-lished or not. The documents may come fromteaching and research institutions in France orabroad, or from public or private research centers.
L’archive ouverte pluridisciplinaire HAL, estdestinée au dépôt et à la diffusion de documentsscientifiques de niveau recherche, publiés ou non,émanant des établissements d’enseignement et derecherche français ou étrangers, des laboratoirespublics ou privés.
Exchange Traded Funds: History, Trading and ResearchLaurent Deville
To cite this version:Laurent Deville. Exchange Traded Funds: History, Trading and Research. C. Zopounidis, M.Doumpos, P. Pardalos. Handbook of Financial Engineering, Springer, pp.1-37, 2008. <halshs-00162223>
Exchange Traded Funds: History, Trading and Research
Laurent Deville Paris-Dauphine University, CNRS, DRM-CEREG [email protected]
June 2006
Key words: literature review, Exchange Traded Funds
2
1. Introduction
One of the most spectacular successes in financial innovation since the advent of financial
futures is probably the creation of Exchange Traded Funds (ETFs). As index funds, they aim
at replicating the performance of their benchmark indices as closely as possible. Contrary to
conventional mutual funds, however, ETFs are listed on an exchange and can be traded
intradaily. Issuers and exchanges set forth the diversification opportunities they provide to all
types of investors at a lower cost, but also highlight their tax efficiency, transparency and low
management fees. All of these features rely on a specific “in-kind” creation and redemption
principle: new shares can continuously be created by depositing a portfolio of stocks that
closely approximates the holdings of the fund and similarly, investors can redeem outstanding
ETF shares and receive the basket portfolio in return. Holdings are transparent since fund
portfolios are disclosed at the end of the trading day.
ETFs were introduced on U.S. and Canadian exchanges in the early 90s. In the first
several years, they represented a small fraction of the assets under management in index
funds. However, the 132% average annual growth rate of ETF assets from 1995 through 2001
(Gastineau, 2002) illustrates the increasing importance of these instruments. The launching of
Cubes in 1999 was accompanied by a spectacular growth in trading volume, making the
major ETFs the most actively traded equity securities on the U.S. stock exchanges. Since
then, ETF markets have continued to grow, not only in the number and variety of products,
but also in terms of assets and market value. Initially, they aimed at replicating broad-based
stock indices, new ETFs extended their fields to sectors, international markets, fixed-income
instruments and lately commodities. By the end of 2005, 453 ETFs were listed around the
world for assets worth $343 billion. In the U.S., overall ETF assets totalled $296.02 billion,
compared to $8.9 trillion in mutual funds1.
ETFs were initially developed in the U.S. by the American Stock Exchange (AMEX), but
soon faced competition for trading. Before the NYSE ventured into ETFs, these securities
were already traded on the Nasdaq InterMarket, regional exchanges, and the Island Electronic
Crossing Network. Though long opposed to this practice, for the first time in its history the
NYSE began trading the three most active ETFs under Unlisted Trading Privileges on July
31, 2001. Moreover, the different trading venues also competed for listings. On December 1,

3
2004, Nasdaq-100 Index Tracking Stocks, more commonly known as “Cubes”, changed
listing from the AMEX to Nasdaq. More recently, on July 20, 2005, Barclays Global
Investors announced the transfer of 61 iShares ETFs to the NYSE from the AMEX.
Even though they received extraordinary press coverage, few academic researches were
devoted to the study of ETFs prior to 2000. This only with the spectacular growth ETFs
experienced since the launch of Cubes that a more extensive literature focused on these
securities. ETFs are in competition with existing index securities: index component stocks,
index futures and options contracts and naturally, index mutual funds and closed-end funds.
ETFs may be primarily seen as highly redundant assets that should not affect the prevailing
established equilibriums. Nonetheless, their success suggests that they filled a gap in
investors’ needs. The considerable trading volume is likely to impact the markets for the
related securities. Research in ETFs is built on the basis of three main topics, all studied from
an empirical viewpoint:
- does the ETF specific structure allow for more efficient index fund pricing?
- do ETFs represent a performing alternative to conventional index mutual funds?
- what impact does the advent of ETFs has on trading and market quality with
regard to index component stocks and index derivatives?
Other empirical studies also focus on ETFs and investigate diverse topics, such as competition
between trading venues, the shape of the demand curve or the use of ETFs. Even though they
are only loosely related, we will discuss these studies under the heading “other research
related to ETFs”.
In the following section, we start by providing an overview of the history of ETFs, from
their creation in North-American markets to their more recent developments in the U.S. and
European markets. In section 3, we detail the mechanics of ETFs with a special focus on
creation and redemption and present the ETF industry. The next four sections are devoted to
the survey itself. In section 4, we look at the pricing efficiency of ETFs and compare it to that
of closed-end funds, while in section 5 we examine the relative performance of ETFs over
conventional index mutual funds. In section 6, we explore the impact the arrival of ETFs has
on the market quality of the stock components of the underlying indices, the efficiency of
index derivatives markets and the pricing discovery process for index prices. In section 7, we
1 Data from the Investment Company Institute; http://www.ici.org/.
4
discuss other, less studied ETF-related issues. Section 8 concludes and presents directions for
further research.
2. The History of ETFs
2.1. The Birth and Development of ETFs in North America 2
Depending on how restrictive the authors are in their definition, ETFs as we now know them
were first introduced in the early 1990s, either in Canada (with the TIPs that were first traded
in 1990) or three years later in the U.S. (with the SPDRs). However, the ability to trade a
whole stock basket in a single transaction dates further back. Major US brokerage firms
provided such program trading facilities as early as the late 1970s, particularly for the S&P
500 index. With the introduction of index futures contracts, program trading became more
popular. As such, the opportunity to develop a suitable instrument allowing index components
to be negotiated in a single trade became increasingly interesting.
In 1989, the American Stock Exchange and the Philadelphia Stock Exchange started
trading Index Participation Shares (IPS). These synthetic instruments were aimed at
replicating the performance of the S&P 500 index, among others, but they had characteristics
similar to those of futures contracts. Despite significant interest from investors, IPS had to
stop trading after the lawsuit by the Chicago Mercantile Exchange and the Commodity
Futures Trading Commission (CFTC) was won. As futures contracts, IPS had to be traded on
a futures exchange regulated by the CFTC.
The first equity-like index fund, the Toronto Index Participation units (TIPs), was
introduced on the Toronto Stock Exchange on March 9, 1990. Tracking the Toronto 35, they
were traded on the stock exchange and were characterized by extremely low management
fees, given that the fund manager was authorized to loan the stocks held by the fund, for
which demand was usually high. This product was followed in 1994 by HIPs, based on the
broader TSE-100 index. Despite the huge success of these securities, their very low expense
ratios finally made them too costly for the exchange and its members. TIPs and HIPs were
terminated in 20003. In 1993, after three years of dispute with the SEC, the American Stock
2 A more exhaustive presentation of the premises and early development of ETF-like products and ETFs in the US and Canadian markets can be found in Gastineau (2001, 2002) and Blank and Lam (2002). 3 In 1999, S&P acquired the rights to the TSE index family and the TSE-30 and TSE-100 indices were combined into the S&P/TSE-60. Owners of TIPs and HIPs then had to choose between redemption and conversion into the

5
Exchange (AMEX) began trading Standard & Poor’s 500 Depositary Receipt (SPDR,
popularly known as “Spider”, ticker SPY), which is often referred to as the world’s first ETF.
The fund was sponsored by PDR Services Corporation, an AMEX subsidiary, with State
Street Bank and Trust as trustee. Its specific trust structure and trading process then
constituted a model for the next ETFs introduced, such as MidCap SPDRs, Diamonds (ticker
DIA), based on the Dow Jones Industrial Average, or Select Sector SPDRs. In 1996, Barclays
Global Investors preferred a mutual fund structure for their WEBS (World Equity Benchmark
Shares), ETFs that track the performance of foreign markets indices. Despite a growing
interest, it took a few years for these funds to really take off.
The ETF marketplace experienced its effective boom in March 1999 with the launch of
the Nasdaq-100 Index Tracking Stock, popularly known as Cubes or Qubes in reference to its
initial ticker, QQQ, recently changed to QQQQ. In its second year of trading, a daily average
of 70 million shares was being traded in Cubes, which is roughly 4% of the Nasdaq trading
volume. The popularity of this specific fund increased market awareness for the other ETFs
and the total assets under management more than doubled in 2000, up to $70 billion at the end
of December (Frino and Gallagher, 2001). Since then, growth in ETF assets has shown no
signs of slowing in the US: 27% in 2001, 23% in 2002, 48% in 2003, 50% in 2004, even
remaining high at 31% in 20054. Over the years, ETFs progressively became an alternative to
traditional non-traded index mutual funds which led their major competitors such as
Vanguard or Fidelity to lower their fees by up to 10 basis points or less.
By the end of 2002, there were 113 ETFs in the US with about $102.14 billion in assets
under management. At the end of April 2006, with new cash invested in the existing ETFs
and new ETFs based on still more diverse types of indices launched, the ETF marketplace
consisted of four stock exchanges listing 216 ETFs with $335 billion in assets. The iShares
(sponsored by Barclays Global Investors) and StreetTracks (sponsored by State Street Global
Advisors) series present an extremely diversified offer among sectors and/or countries, but
ETF assets are dominated by Spider, Cube and Diamond, which are based on relatively broad
market indexes. Trading volume concentrates on the two most popular ETFs, Cubes and
Spiders, with annual turnovers as high as 3 700% for the former and 2 400% for the latter,
according to Bogle (2004). This makes Cubes, a passive investment instrument, the most
i60 Fund based on this new index, the first ETF managed by Barclays Global Investors. Biktimirov (2004) analyzes the conversion of the remaining assets to examine the effect of demand on stock prices. 4 Data source: Investment Company Institute.
6
actively traded listed equity security in the U.S. in 2005, with a daily average of 97 million
shares traded.
2.2. The Market for ETFs in Europe 5
European stock exchanges started listing their first ETFs in 2000, while they had already
gained popularity in the U.S. The first exchanges to quote ETFs in Europe were the Deutsche
Börse and the London Stock Exchange in April 2000 with the opening of the XTF and
extraMARK specific market segments. Competition rapidly intensified with the entry of the
Stockholm Stock Exchange at the end of October 2000, Euronext in January 2001 when
NextTrack began trading ETFs first in Paris and Amsterdam marketplaces, (trading in
Brussels began in October 2002) and of the Swiss Stock Exchange in March 2001. In
February of 2002, the Helsinki Stock Exchange listed its first ETF, the IHEX 35, whereas the
Borsa Italiana opened the MTF segment dedicated to ETFs in September. More recently,
ETFs were launched in the Icelandic market (December 2004), the Norwegian market (March
2005), the Irish market (April 2005) and the Austrian market (November 2005).
As of the end of 2005, eleven exchanges listed more than 160 ETFs, with assets growing
at an annual rate of 60% up to €45 billion. Following the same trend as the one observed in
the U.S., exchanges began by quoting broad-based national and regional equity index ETFs.
They then quickly diversified the benchmarks to a variety of underlying indices. For example,
after only six and five years, respectively, Euronext and the Deutsche Börse listed 95 and 77
ETFs.6 This included ETFs based on eurozone or European indices, emerging country indices,
style (socially responsible, growth, value, small caps, mid caps, etc.) or sectors indices.
Besides these equity-based ETFs, sponsors launched fixed-income ETFs, ETFs based on
precious metals and lastly, on commodities.
5 Mussavian and Hirsch (2002) present an overview of the European ETF markets at the end of the first quarter of 2002 and illustrate some possible ETF applications. 6 Between January and March 2006, European marketplaces made new listings, with the launch of 40, 16, 15 and 9 ETFs, respectively, on the Deutsche Börse, the Borsa Italiana, the Swiss Stock Exchange and Euronext.
7
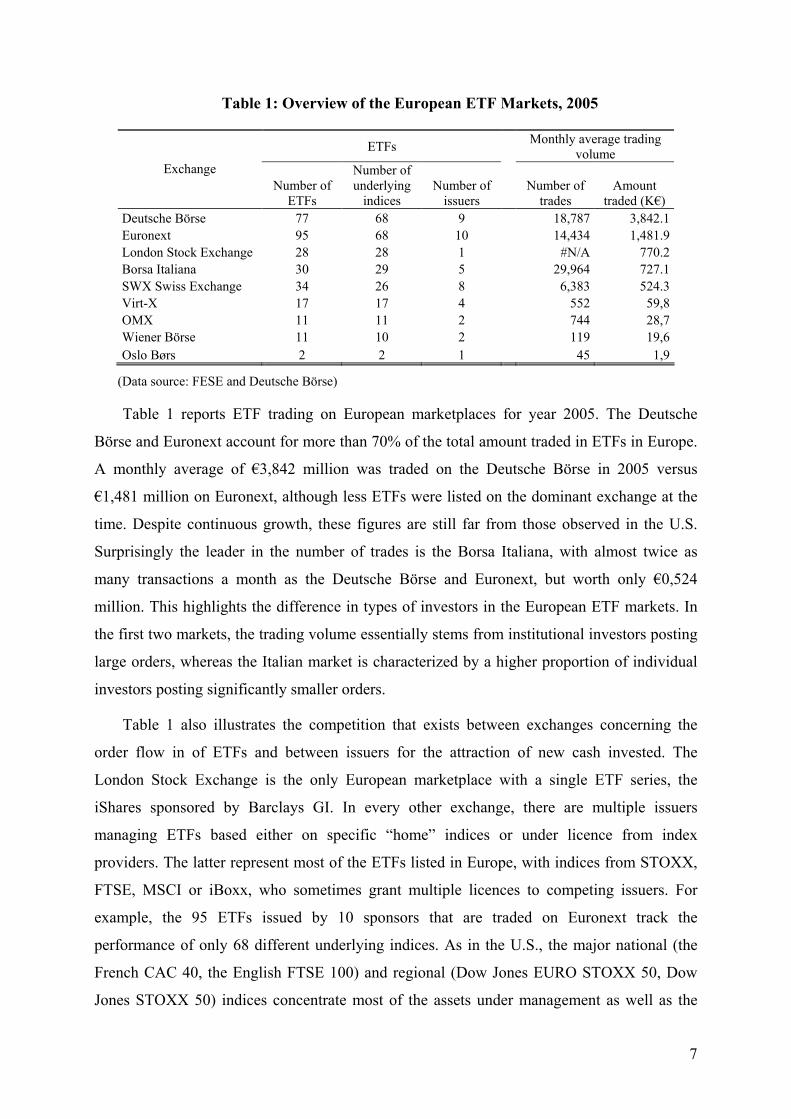
Table 1: Overview of the European ETF Markets, 2005
ETFs Monthly average trading
volume Exchange
Number of ETFs
Number of underlying indices
Number of issuers
Number of trades
Amount traded (K€)
Deutsche Börse 77 68 9 18,787 3,842.1
Euronext 95 68 10 14,434 1,481.9
London Stock Exchange 28 28 1 #N/A 770.2
Borsa Italiana 30 29 5 29,964 727.1
SWX Swiss Exchange 34 26 8 6,383 524.3
Virt-X 17 17 4 552 59,8
OMX 11 11 2 744 28,7
Wiener Börse 11 10 2 119 19,6
Oslo Børs 2 2 1 45 1,9
(Data source: FESE and Deutsche Börse)
Table 1 reports ETF trading on European marketplaces for year 2005. The Deutsche
Börse and Euronext account for more than 70% of the total amount traded in ETFs in Europe.
A monthly average of €3,842 million was traded on the Deutsche Börse in 2005 versus
€1,481 million on Euronext, although less ETFs were listed on the dominant exchange at the
time. Despite continuous growth, these figures are still far from those observed in the U.S.
Surprisingly the leader in the number of trades is the Borsa Italiana, with almost twice as
many transactions a month as the Deutsche Börse and Euronext, but worth only €0,524
million. This highlights the difference in types of investors in the European ETF markets. In
the first two markets, the trading volume essentially stems from institutional investors posting
large orders, whereas the Italian market is characterized by a higher proportion of individual
investors posting significantly smaller orders.
Table 1 also illustrates the competition that exists between exchanges concerning the
order flow in of ETFs and between issuers for the attraction of new cash invested. The
London Stock Exchange is the only European marketplace with a single ETF series, the
iShares sponsored by Barclays GI. In every other exchange, there are multiple issuers
managing ETFs based either on specific “home” indices or under licence from index
providers. The latter represent most of the ETFs listed in Europe, with indices from STOXX,
FTSE, MSCI or iBoxx, who sometimes grant multiple licences to competing issuers. For
example, the 95 ETFs issued by 10 sponsors that are traded on Euronext track the
performance of only 68 different underlying indices. As in the U.S., the major national (the
French CAC 40, the English FTSE 100) and regional (Dow Jones EURO STOXX 50, Dow
Jones STOXX 50) indices concentrate most of the assets under management as well as the
8
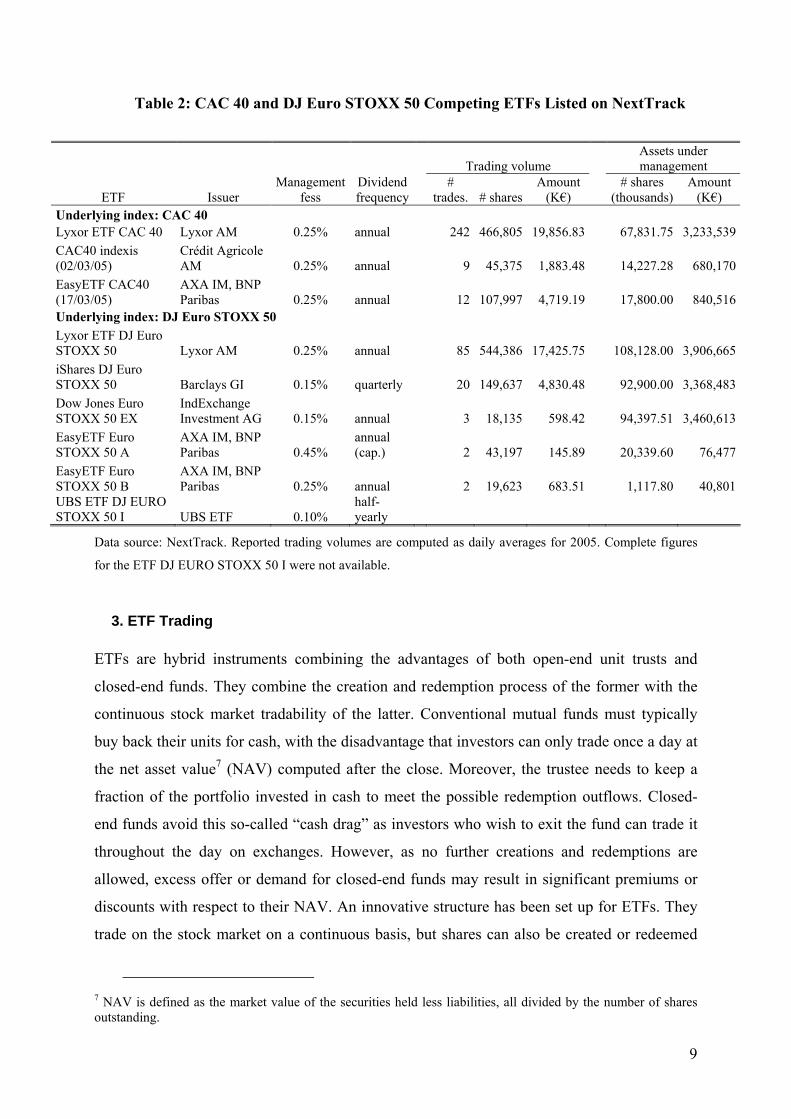
trading volume. Typically, several ETFs use these indices as benchmark and are either listed
on different European exchanges or on the same exchange. Table 2 reports basic information
on the ETFs tracking the CAC 40 and the DJ Euro STOXX 50 indices competing on
NextTrack as of December 31, 2005. It appears that even if those ETFs are the most traded on
Euronext, the average daily number of transactions is low and highly concentrated on a single
ETF for each index, namely those issued by Lyxor AM. If the same observation applies to the
assets under management for the CAC 40 index with more than €3 billion, it does not apply to
the DJ Euro STOXX 50. For this eurozone index, three ETFs, issued by Lyxor, Barclays, and
IndExchange, have assets greater than €3 billion under management. Nonetheless, the trading
volume still mostly concentrates on a single ETF. This situation is typical of the cross listing
of ETFs in Europe (DJ Euro STOXX 50-based ETFs are listed on 7 different exchanges)
where issuers benefit both from their nationality on their home market and more importantly,
from anteriority. Investors appear to keep trading on the same ETF even when competitors are
launched on the same indices.
9
Table 2: CAC 40 and DJ Euro STOXX 50 Competing ETFs Listed on NextTrack
Data source: NextTrack. Reported trading volumes are computed as daily averages for 2005. Complete figures
for the ETF DJ EURO STOXX 50 I were not available.
3. ETF Trading
ETFs are hybrid instruments combining the advantages of both open-end unit trusts and
closed-end funds. They combine the creation and redemption process of the former with the
continuous stock market tradability of the latter. Conventional mutual funds must typically
buy back their units for cash, with the disadvantage that investors can only trade once a day at
the net asset value7 (NAV) computed after the close. Moreover, the trustee needs to keep a
fraction of the portfolio invested in cash to meet the possible redemption outflows. Closed-
end funds avoid this so-called “cash drag” as investors who wish to exit the fund can trade it
throughout the day on exchanges. However, as no further creations and redemptions are
allowed, excess offer or demand for closed-end funds may result in significant premiums or
discounts with respect to their NAV. An innovative structure has been set up for ETFs. They
trade on the stock market on a continuous basis, but shares can also be created or redeemed
7 NAV is defined as the market value of the securities held less liabilities, all divided by the number of shares outstanding.
Trading volume Assets under management
ETF Issuer Management
fess Dividend frequency
# trades. # shares
Amount (K€)
# shares (thousands)
Amount (K€)
Underlying index: CAC 40
Lyxor ETF CAC 40 Lyxor AM 0.25% annual 242 466,805 19,856.83 67,831.75 3,233,539
CAC40 indexis (02/03/05)
Crédit Agricole AM 0.25% annual 9 45,375 1,883.48 14,227.28 680,170
EasyETF CAC40 (17/03/05)
AXA IM, BNP Paribas 0.25% annual 12 107,997 4,719.19 17,800.00 840,516
Underlying index: DJ Euro STOXX 50
Lyxor ETF DJ Euro STOXX 50 Lyxor AM 0.25% annual 85 544,386 17,425.75 108,128.00 3,906,665
iShares DJ Euro STOXX 50 Barclays GI 0.15% quarterly 20 149,637 4,830.48 92,900.00 3,368,483
Dow Jones Euro STOXX 50 EX
IndExchange Investment AG 0.15% annual 3 18,135 598.42 94,397.51 3,460,613
EasyETF Euro STOXX 50 A
AXA IM, BNP Paribas 0.45%
annual (cap.) 2 43,197 145.89 20,339.60 76,477
EasyETF Euro STOXX 50 B
AXA IM, BNP Paribas 0.25% annual 2 19,623 683.51 1,117.80 40,801
UBS ETF DJ EURO STOXX 50 I UBS ETF 0.10%
half-yearly
10
directly from the fund. The efficiency of the ETF specific dual trading system essentially
relies on the in-kind creation and redemption process that is only available to institutional
investors. We will first describe the ETF trading structure and then present the different
players in the ETF marketplace.
3.1. The ETF Trading Process
ETF trading in the major marketplaces around the world closely resembles the system that
was set up in the AMEX for SPDRs. The basic idea the original designer of ETFs, Nathan
Most, had was to organize ETFs as commodity warehouse receipts with the physicals
delivered and stored, whereas only the receipts are traded, although holders of the receipt can
take delivery. This “in-kind” creation and redemption principle has been extended from
commodities to stock baskets. Market makers and institutional investors can deposit the stock
basket underlying an index with the fund trustee and receive fund shares in return. The shares
thus created can then be traded on an exchange as simple stocks or later redeemed for the
stock basket then making up the underlying index. The interesting feature in this process is
that the performance earned by an investor who creates new shares and redeems them later is
equal to the index return less fees even if the composition of the index has changed in the
meantime.
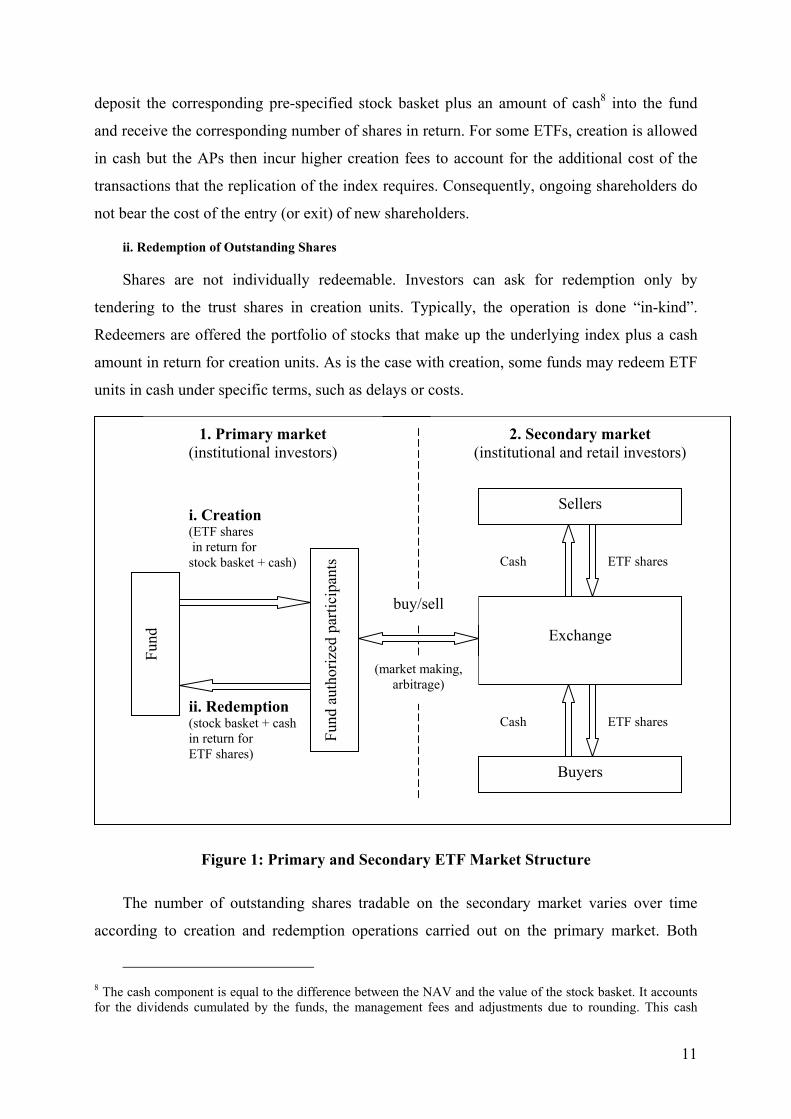
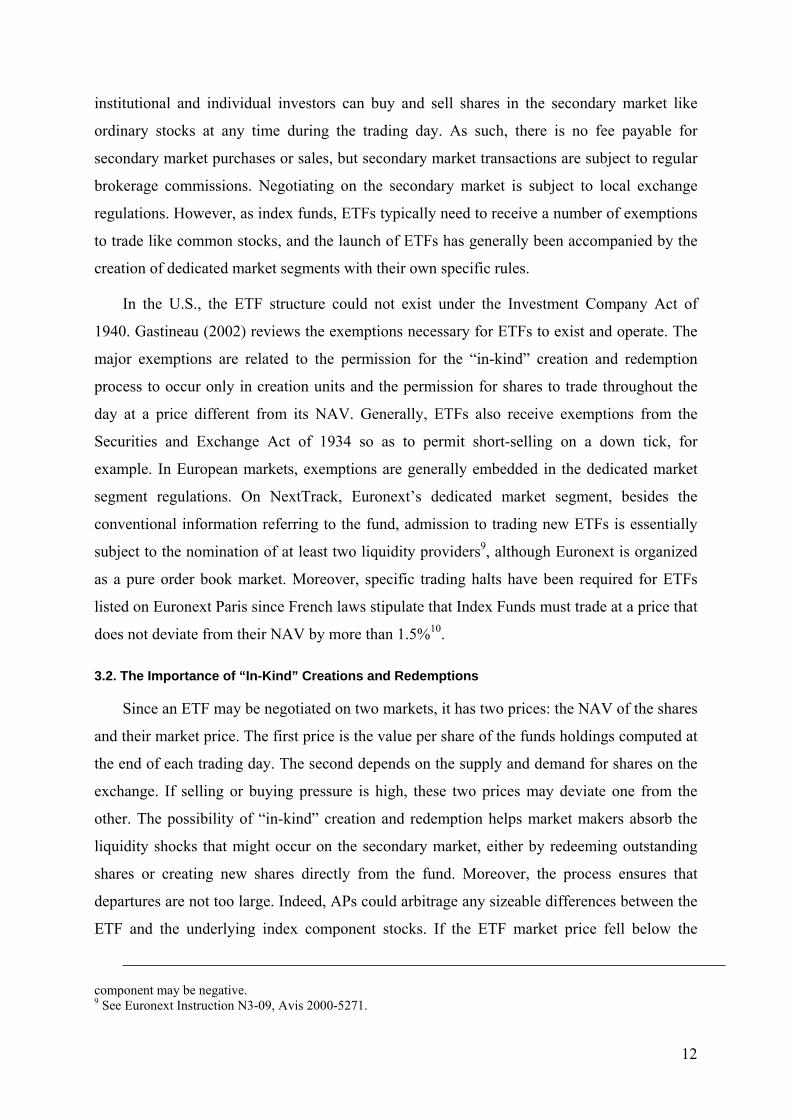
Figure 1 illustrates the dual structure of the ETF trading process with a primary market
open to institutional investors for the creation and redemption of ETF shares in lots directly
from the fund, and a secondary market where ETF shares can be traded with no limitation on
order size. The conditions for the creation and redemption of shares, such as the size of
creation units, can vary from one fund to another, but the equity ETF process is typically as
follows.
i. Creation of New Shares
Only authorized participants (APs), typically large institutional investors who have an
agreement with the fund sponsor, are allowed to create new shares, in blocks of specified
minimal amounts called creation units. Creation units vary in size from one fund to another,
ranging from 25 000 up to 300 000 shares. Most ETFs have creation units of 50 000 shares,
which represents an amount 500 times the dollar value of the index underlying the ETF. APs
11
deposit the corresponding pre-specified stock basket plus an amount of cash8 into the fund
and receive the corresponding number of shares in return. For some ETFs, creation is allowed
in cash but the APs then incur higher creation fees to account for the additional cost of the
transactions that the replication of the index requires. Consequently, ongoing shareholders do
not bear the cost of the entry (or exit) of new shareholders.
ii. Redemption of Outstanding Shares
Shares are not individually redeemable. Investors can ask for redemption only by
tendering to the trust shares in creation units. Typically, the operation is done “in-kind”.
Redeemers are offered the portfolio of stocks that make up the underlying index plus a cash
amount in return for creation units. As is the case with creation, some funds may redeem ETF
units in cash under specific terms, such as delays or costs.
Figure 1: Primary and Secondary ETF Market Structure
The number of outstanding shares tradable on the secondary market varies over time
according to creation and redemption operations carried out on the primary market. Both
8 The cash component is equal to the difference between the NAV and the value of the stock basket. It accounts for the dividends cumulated by the funds, the management fees and adjustments due to rounding. This cash
Fund
i. Creation (ETF shares in return for
stock basket + cash)
Exchange
Buyers
Sellers
ETF shares
Cash
Cash
ETF shares
buy/sell
ii. Redemption (stock basket + cash in return for
ETF shares)
(market making, arbitrage)
Fund auth
orize
d participan
ts
1. Primary market
(institutional investors) 2. Secondary market
(institutional and retail investors)
12
institutional and individual investors can buy and sell shares in the secondary market like
ordinary stocks at any time during the trading day. As such, there is no fee payable for
secondary market purchases or sales, but secondary market transactions are subject to regular
brokerage commissions. Negotiating on the secondary market is subject to local exchange
regulations. However, as index funds, ETFs typically need to receive a number of exemptions
to trade like common stocks, and the launch of ETFs has generally been accompanied by the
creation of dedicated market segments with their own specific rules.
In the U.S., the ETF structure could not exist under the Investment Company Act of
1940. Gastineau (2002) reviews the exemptions necessary for ETFs to exist and operate. The
major exemptions are related to the permission for the “in-kind” creation and redemption
process to occur only in creation units and the permission for shares to trade throughout the
day at a price different from its NAV. Generally, ETFs also receive exemptions from the
Securities and Exchange Act of 1934 so as to permit short-selling on a down tick, for
example. In European markets, exemptions are generally embedded in the dedicated market
segment regulations. On NextTrack, Euronext’s dedicated market segment, besides the
conventional information referring to the fund, admission to trading new ETFs is essentially
subject to the nomination of at least two liquidity providers9, although Euronext is organized
as a pure order book market. Moreover, specific trading halts have been required for ETFs
listed on Euronext Paris since French laws stipulate that Index Funds must trade at a price that
does not deviate from their NAV by more than 1.5%10.
3.2. The Importance of “In-Kind” Creations and Redemptions
Since an ETF may be negotiated on two markets, it has two prices: the NAV of the shares
and their market price. The first price is the value per share of the funds holdings computed at
the end of each trading day. The second depends on the supply and demand for shares on the
exchange. If selling or buying pressure is high, these two prices may deviate one from the
other. The possibility of “in-kind” creation and redemption helps market makers absorb the
liquidity shocks that might occur on the secondary market, either by redeeming outstanding
shares or creating new shares directly from the fund. Moreover, the process ensures that
departures are not too large. Indeed, APs could arbitrage any sizeable differences between the
ETF and the underlying index component stocks. If the ETF market price fell below the
component may be negative. 9 See Euronext Instruction N3-09, Avis 2000-5271.
13
indicative NAV, it could be profitable for APs to buy ETFs in the secondary market, take on a
short position in the underlying index stocks and then ask the fund manager to redeem the
ETFs for the stock basket before closing the short position at a profit.
Another major advantage of the “in-kind” process relies on the receipt and delivery of the
stock basket with its weightings specified so as to replicate the underlying index. As they
need not sell any stocks on the exchange to meet redemptions, ETF fund managers can fully
invest their portfolio. Moreover, creations do not yield any additional costly trading within the
fund. In the U.S., “in-kind” operations are a non-taxable event, making the ETF structure
seem particularly tax efficient. When confronted with massive redemptions, which often
occur in bull markets, classical funds must sell their stock, resulting in taxable capital gains.
When requesting redemption, APs are indifferent to the cost basis of the stocks they receive in
return for the shares since their basis is the price at which they first delivered the stocks for
the creation of the ETF shares. The ETF sponsor thus has the ability to deliver the stocks with
the largest embedded capital gain. Historically, Dellva (2001) reports almost insignificant
capital gains delivered by ETFs with respect to conventional mutual funds.
As efficient as it may be, this process is not sufficient to ensure a perfect replication of
the underlying index. Changes in the composition of the index and constraints on the use of
dividends and management fees induce some tracking error. Constraints depend on the legal
structure chosen for the fund, but they generally remain low. Some structures allow the use of
derivatives to ensure replication, whereas others restrict the holdings to the stocks that make
up the index11. Loaning securities held by the fund might be permitted and is all the more
profitable as the fund turnover is low and demand for its constituting stocks is high. This may
help reduce management fees and expense ratios. Dividends are generally paid quarterly or
half yearly. Their value includes the cumulated dividends delivered by the underlying stocks,
less management fees, bringing the NAV back to the initially specified multiple of the index
(usually 1/10th or 1/100th).
10 Decree no. 89-624, September 6, 1989. 11 The major differences between the two structures used in the U.S., namely the mutual fund or the unit investment trust, will be reviewed later.
14
3.3. ETF Market Participants
Besides the index providers that develop and provide licences for existing or new indices,
ETF players are the stock exchanges, sponsors and trustees, ETF authorized participants,
market makers and investors on the secondary market.
Stock Exchanges
A stock exchange’s first task upon entering the ETF business is to define admission to trading
conditions and trading rules in conjunction with market authorities and regulators. The rules
depend on local regulations and often require exemptions to the existing security laws and
regulations. Its second task is to provide information. Stock exchanges disseminate classical
intraday and daily data on market activity such as trades and quotes, trading volume and so
on. More specific information including assets under management or the number of
outstanding shares is also made available. More importantly, exchanges compute and disclose
indicative NAVs on a frequent basis. They are updated throughout the day so as to reflect
changes in the underlying index. Investors can thus assess how far from their value ETFs
trade on the marketplace. Historical data on the mean premium and discount values may also
be available for each ETF. That is the case with the AMEX, for example. Usually, effective
NAVs are computed and disclosed at the end of the trading day, along with the composition
of the creation and redemption stock baskets.
Moreover, exchanges usually undertake marketing and educational activities to benefit
investors. However, the role of stock exchanges is not limited to these regulatory and
operating aspects. More specifically, the exchanges generally select which ETFs will be listed
in the last resort. For example, Euronext explicitly states that it “may reject an application for
admission to trading on NextTrack if the applicable conditions are not met or if Euronext
believes that admission would not be in the interests of NextTrack or investors.” It is unclear
whether listings of competitor ETFs based on the same or close indices improve or deteriorate
the market quality of their underlying stocks and other ETFs. In this respect, European
exchanges have very different strategies. Contrary to Euronext and the Deutsche Börse, the
Italian and English exchanges follow very restrictive listing strategies, limiting listings to very
specific indices for the first and to one single sponsor for the second. Finally, exchanges can
also influence the offer by providing and licensing their own indices as benchmarks for ETFs.
Sponsors and Trustees
15
Sponsors and trustees issue ETFs and manage the fund’s holdings so as to replicate their
underlying index or benchmark as closely as possible. However, in the U.S., before an ETF is
admitted to trading on a stock exchange, it must pass through the SEC’s exemptive process
since no set of rules exists to allow firms to launch such an instrument. When a sponsor wants
to cross-list his ETFs in multiple markets, the full prospectus may eventually be rewritten
since, even though regulations are similar, as in Europe, different information may be needed
or different presentation formats may prevail according to the country. The prospectuses
provide information on the risks associated to the index replicating scheme. They also contain
various information, including the list of shareholders, legal representatives and directors of
the ETF’s management company, the terms and conditions of the product and the way it
operates. More specifically, the creation and redemption conditions are fully detailed.
Replicating the performance of the underlying index is an objective, but not a mandatory one.
Prospectuses include a tracking error objective, but specify that it may not be achieved.
Holdings management is broadly limited to adjustments caused by changes to the index,
managing dividends and creating new shares or redeeming outstanding shares. ETFs are
extremely transparent since the information on the holdings and their value as well as the
number of outstanding shares must be reported to the exchange and then made public.
Fund Authorized Participants and Market Makers
Although theoretically opened to all investors, the ETF primary market practically aims
at the funds managers and authorized participants. Fund managers whose role has already
been briefly described are responsible for issuing and redeeming trackers. Authorized
participants have the fund manager’s permission to request share creation and redemption,
generally in multiples of the creation units. All investors requesting that creation units be
created or redeemed must place an order with an AP. APs may be simple investors in the ETF
fund or act as market makers on the secondary market. As with the AMEX, most ETF
marketplaces have specialists or market makers. One major difference with stock markets
specialists is their ability to create or redeem shares to manage their inventory risk. They play
an essential role in the efficient pricing of ETFs through possible arbitrage between the ETF
primary and secondary market as well as with the underlying index futures and options
markets.
Retail and Institutional Investors on the Secondary Market
16
Most ETF trading occurs in the secondary market. That is one major advantage ETFs have
over classical mutual funds. Investors need not redeem their shares to exit the fund, they can
simply sell them on the market. Depending on the market and the ETF, the secondary market
may be dominated either by institutional investors and APs or by retail investors. Trading
ETF shares on the secondary market is organized in the same way as regular stocks, with the
possible difference that there are specialists and market markers posting bid and offer prices
even on order-driven markets. Short-selling, even on a down tick, and margin buying are
usually allowed and ETFs may be eligible to block trades and other trading facilities.
3.3. ETFs of Different Kinds
a. Differences in Legal Structure
The ETF legal structure primarily depends on which exchange it is listed on. Security
laws and stock exchange regulations differ from country to country. Sponsors who want to
cross-list their ETFs have to accommodate multiple legal regimes. Even in the U.S., three
main legal structures co-exist: open-ended index mutual funds, unit investment trusts and
exchange-traded grantor trusts. ETFs are regulated by the SEC as mutual funds but, as we
discussed previously, their structure is subject to a number of exemptions and there is still no
set of rules that would allow new ETFs to be listed directly. Historically, the first ETFs were
initially designed as Unit Investment Trusts (UIT) for simplicity and cost-saving reasons
(Gastineau, 2002). Followers and most of the new ETFs preferred the more flexible structure
provided by mutual funds. The main difference between the two structures is the use of
dividends and the securities the fund holds. Unlike open-end index mutual funds, UITs cannot
reinvest the dividends delivered by the underlying stocks12 and must cumulate them in cash.
Mutual funds are also allowed to use derivatives such as futures, which allows them to
equitize their dividend stream and, finally, unlike UITs, they can generate income from
loaning the securities they hold. QQQs (Qubes), DIAMONDS and S&P 500 SPDRs are
structured as UITs while Select Sector SPDRs and iShares are open-end index mutual funds.
Although HOLDRs are sometimes referred to as ETFs, such exchange-traded grantor
trusts cannot be considered as such according to strict definitions of the term. They are more
similar to owning the underlying shares, since investors keep the right to vote shares and to
12 This UIT feature results in a so-called “dividend-drag” during rising markets. As we will discuss more extensively later, it partly explains the poor performance of UITs, such as the S&P 500 SPDR, in comparison with some of their major mutual fund competitors. See Elton et al. (2002).
17
receive dividends. However, such funds do not track independent indices, given that the
stocks to be included in the fund are selected based on objective criteria once the industry
sector, or more generally the group of securities, has been chosen. New shares can then be
created and outstanding shares can be cancelled against the delivery of the stock portfolio.
The included stocks are fixed and cannot be changed even though some of the basket
components are acquired by other companies.
b. Differences in the Underlying Indices
ETFs were initially meant to replicate broad-based stock indices. However, as the
instrument became more familiar to investors, the universe of ETFs expanded progressively
to replicate indices built around sectors, countries or styles. The process continued with the
launch of fixed-income, commodity and finally currency ETFs.
Broad-based stock indices measure the performance of companies that represent a
market. The number of stocks included in the index, and therefore the diversification of the
associated fund, varies from one index to another, from 30 stocks in the case of the Dow
Jones Industrial Average to as much as 3 000 for the Russell 3000 Index (which measures the
performance of the largest U.S. companies based on total market capitalization) or almost
5 000 for the Dow Jones Wilshire 5 000 Composite Index. Major ETFs based on broad-based
stock indices include SPDRs, QQQQs, DIAMONDS or iShares Russell 2000 that replicate
the S&P 500, the Nasdaq 100, the DJIA and the Russell 2000 indices, respectively. Specific
ETF series usually break down broad-based indices into “growth” and “value” management
styles and small, medium or large capitalization stock sizes. With broad-based ETFs, it is
possible to establish positions in global markets very quickly and equitize temporary cash
positions. They may be used for long term investing, as a tool to hedge well-diversified
portfolios or to implement multiple strategies. Core-satellite strategies typically use such
broad-based ETFs to build the core allocation. Capitalization size trading strategies can be
implemented with large, medium and small capitalization ETFs.
Country and regionally-based ETFs also generally replicate broad-based foreign equity
market indices. Country ETFs replicate indices that focus on a single country, whereas
regional ETFs track an index that focuses on a geographical or monetary zone such as Asia,
Europe or the Eurozone. They provide easy and rapid international diversification but, since
ETFs and their underlying stocks need not be traded synchronously, deviations to the NAV
18
may be larger for these instruments. WEBs were the first country ETFs to be launched in
1996 and the iShares MSCI series offer worldwide country ETFs.
Broad-based indices are also generally broken down into sectors. In some instances,
sector indices are designed specifically for the funds. For example, select sector SPDRs break
down the overall S&P 500 index into industry components that differ from classical S&P
sector indices (an individual security cannot account for more than 25% of the index in order
to comply with the Internal Revenue Code). Other examples of sector ETF series are iShares
Dow Jones, SPDR Sector Series or Merrill Lynch HOLDRs insofar as they can be considered
ETFs. Sector ETFs appear to be particularly useful in implementing sector rotation strategies
since they make it is easy to overweigh or underweigh sectors in a single transaction.
The first fixed-income ETFs appeared in Canada in 2000 and to date, there are only six of
these products on the U.S. market, all iShares funds issued by Barclays in 2002. These were
meant to replicate Goldman Sachs and Lehman Brothers bond indices, which measure the
performance of obligations with different maturities and issuers, both public and corporate.
Fixed-income ETFs do not mature, but maintain a portfolio that reflects the underlying bond
index's target maturity. As of April 2006, fixed-income ETFs represented $16.14 billion in
assets out of a total $334.87 billion in assets under management for the whole ETF industry.
Fixed-income ETFs are used for portfolio diversification, core holding for bond portfolios or
transition management, among others. European marketplaces list country-specific fixed-
income ETFs.
Commodity ETFs were first launched in the U.S. with StreetTracks Gold Shares, whose
objective is to reflect the performance of the gold bullion. To create new shares, APs must
deposit a specified gold amount plus cash. They are redeemed the same in-kind basket in
return for shares. Commodity ETFs give investors exposure to a variety of commodities such
as gold, silver, oil or broad-based index commodities that include commodities from sectors
as diverse as energy, metals, agriculture and livestock. Examples of such broad-based
commodity ETFs include EasyETF GSCIs based on the Goldman Sachs Commodity Index
(listed on the Deutsche Börse and the Swiss Stock Exchange), Lyxor ETF Commodities
CRBs based on the Reuters/Jefferies CRB index (listed on Euronext) and the Deutsche Bank
Commodity Index Tracking Fund and based on the Deutsche Bank Liquid Commodity Index
(listed on the AMEX). Unlike classical ETFs, these funds invest in futures contracts on the
underlying commodities.

19
To date, the last type of ETFs to be created is currency ETFs, with the launch of Euro
CurrencyShares sponsored by Rydex Investments in December 2005. It is listed on the NYSE
and its objective is to reflect the price of the euro. In this last case, no derivatives are used and
the Trust’s assets consist only of euros on demand deposit. APs can issue and redeem shares
in euro-based creation units.
4. ETFs Pricing Efficiency
The specificity of ETF trading is based on the creation and redemption process we
presented in the previous section. Exchanges and sponsors claim that this structure necessarily
brings a high pricing efficiency to the ETF market. Pricing efficiency is a major concern since
trading in index funds has long been at the root of the most intriguing puzzles in finance: the
closed-end fund discount. Although fund holdings are made public and the NAV is disclosed
at least daily, closed-end funds generally trade at a discount to NAV. Conventional
explanations for the closed-end fund puzzle13 include biases in NAV calculation, agency
costs, tax inefficiency and market segmentation. However, none of these theories can explain
the full set of anomalies associated with the pricing of closed-end funds. One must forego the
rational expectation framework to encompass these anomalies in a single theory. The limited
rationality model developed by Lee, Shleifer and Thaler (1991) shows how the behaviour of
individual investors can explain the puzzle. Misperception leads to overreaction, and the
unpredictability of variations in investor sentiment makes arbitrage risky. Most of the
empirical tests support this investor sentiment theory.
In contrast to closed-end funds whose capitalization is fixed, ETFs are characterized by a
variable number of shares in issue. APs can ask the fund to create new shares or redeem
outstanding shares with no impact on market prices and thus should be able to quickly
arbitrage any deviation of the price to the NAV. No specific model that integrates the ETF
arbitrage process has yet been developed. However, some empirical studies test the ability of
the ETF structure to ensure efficient pricing in the U.S. ETF market. Using closing data,
Ackert and Tian (2000) show that discounts on the price of SPDRs had no economic
significance between 1993 and 1997, even though individual investors were the primary
investors in the fund. They measure larger discounts for the MidCap SDPR based on the S&P
400 index. This confirms the hypothesis that limits to arbitrage cause deviations given that
13 For a review on the closed-end fund puzzle, see Dimson and Minio-Kozerski (1999).
20
this ETF is likely to have higher arbitrage costs due to higher fundamental risk, transactions
costs and lower dividend yield associated with its benchmark index. Discounts remain very
low compared to those observed on closed-end funds and excessive volatility is only observed
for MidCap SDPRs. Hence, the ETF specific structure lessens the impact of noise traders
since rational traders can more easily arbitrage deviations to the NAV.
These results are confirmed by the empirical studies carried out by Elton, Gruber, Comer
and Li (2002) on SPDRs, Engle and Sarkar (2002) on a sample of 21 ETFs listed on the
AMEX and Curcio, Lipka and Thornton, Jr. (2004) on Cubes or Cherry (2004) on 73 iShares
ETFs. Elton, Gruber, Comer and Li (2002) show that deviations to the NAV do not persist
from day to day. The fact that trading volume is linked to premium and discount values
supports the claim that the arbitrage mechanism is responsible for this efficiency. Engle and
Sarkar (2002) examine the magnitude and persistence of discounts both daily and intradaily.
On average, they find that ETFs are efficiently priced since only small deviations were seen,
lasting for only a few minutes. The daily results of Curcio, Lipka and Thornton, Jr. (2004)
confirm those of Ackert and Tian (2000). From an intradaily perspective, their study of
transaction size proves that, even if individual investors seem to be the primary holders of
SPDRs and Cubes, they account for less than one half of the trading volume. Some
economically significant discounts are found, but these are very short-lived and can be
attributed to institutional arbitrage activity.
The structure is the same for all ETFs but, in the case of country ETFs, the arbitrage
mechanism is somewhat inhibited by non-overlapping trading hours between ETFs and their
underlying index component stocks. Engle and Sarkar (2002) find that deviations to the NAV
are greater and more persistent for the 16 country-ETFs sample compared to the 21 domestic-
ETFs sample. Though imperfect, the existence of the creation/redemption process along with
the high transparency of the funds holdings appears to enhance price efficiency. In effect,
deviations remain smaller in magnitude (around 100 basis points on average with a maximum
of 211 bps) than those generally observed for comparable closed-end country funds (often
greater than 10%). Jares and Lavin (2004) study this issue for Japan and Honk-Kong WEBs
that trade on the AMEX. Non-tradability of the underlying stocks is an especially meaningful
concern in this case since Asian markets are closed for the day before U.S. markets open. For
these ETFs, an Indicated Optimized Portfolio Value serves as the Indicative NAV and is
disclosed throughout the day. It is based on stale stock prices and accounts solely for changes
in exchange rates. Jares and Lavin find frequent discounts and premiums for the period
21
ranging from 1996 to 2001. Moreover, there is predictability in returns giving rise to highly
profitable trading rules. These results are confirmed in Madura and Richie (2004), who find
reversals in prices that support the hypothesis that informed traders arbitrage overreacting
investors. The measured reversals are insignificant for broad-based ETFs, but are more
pronounced for international ETFs. Simon and Sternberg (2004) also find significant
premiums and discounts at the end of the day and overreaction for European ETFs traded on
the AMEX. Hence, if the trading system appears to enhance pricing efficiency for traded
funds, some inefficiency seems to remain for ETFs replicating illiquid or foreign benchmarks.
5. ETF Performance
Marketing for ETFs, presented as a low-cost alternative to traditional mutual funds, has
always focused on their low management fees and expense ratios. As ETFs attracted more
and more cash, fierce competition between ETFs and mutual funds led to the fee war
described in Dellva (2001) and Bogle (2004). Fidelity and Vanguard progressively lowered
their fees and after an almost ten-year fall in expense ratios, they are now at a historical low
with 10 basis points and still less for Vanguard major funds. Broad-based ETFs generally
display annual expense ratios of 20 basis points or less. Recently, the expense ratio for SPDRs
was lowered from 0.12% to 0.10% while Barclays’ iShares S&P 500 fees are set at 0.09%.
The expense ratio comparisons used as a competitive tool by issuers are obviously in favour
of ETFs. However, such direct comparisons are too simplistic since they omit ETF trading
costs and relative tracking performance over mutual funds.
Dellva (2001) and Kostovetsky (2003) compare both types of funds based on total costs
supported by investors. ETFs generally have lower expense ratios. Investors incur transaction
costs when they buy and sell ETFs while there is no supplementary cost for trading no-load
mutual funds. Taxes are also of importance to taxable investors. As registered investments
companies, mutual funds and ETFs must both distribute capital gains to their shareholders. If
mutual funds are considered tax-friendly investments, this is even truer of ETFs. Actually,
ETF managers do not need to sell shares to meet redemptions as creations/redemptions are
done in-kind. More, they can also redeem shares with the higher tax basis. ETFs distribute
almost no capital gains but, overall, Dellva (2001) finds that trading costs are typically higher
than expense ratios and tax savings for small investors. However, as the invested amount
increases, ETFs become more profitable than mutual funds, even for short-term investment of
two or three years. Kostovetsky (2003) goes one step further by quantitatively modelling the
22
difference in cost both in a single and multiple periods setting. He also finds that there is a
threshold in the amount invested over which ETFs dominate mutual funds. However, both
studies assume that there is no tracking error for both types of funds although it is well known
that the replication of the benchmark index is rarely, if ever perfect.
Replication strategies cannot always be perfect. Even if most times fund holdings mimic
the index composition, when it changes, fund managers must trade to adjust their holdings.
The related transaction costs and possible flaws in the replication strategies induce tracking
error. Elton, Gruber, Comer and Lee (2002) evidence an average 0.28% annual
underperformance for SPDRs relative to the S&P 500 index over the 1993-1998 period.
Moreover, SPDRs do not favourable compare with major index mutual funds: annually, the
Vanguard mutual fund that replicates the S&P 500 index yields on average 0.18% more than
the SPDRs. These results are confirmed in the study by Poterba and Shoven (2002) over the
1994-2000 period, even when taxes on capital gains delivered by both funds are taken into
account. Although differences in performance are reduced, they remain economically
significant. For Elton and al. (2002), 9.95 basis points are lost due to the SPDR structure. As a
Unit Investment Trust, the dividends received on the fund holdings have been kept in a non-
interest-bearing account until distributed to shareholders. The authors claim that investors are
still investing in SPDRs rather than in relatively outperforming mutual funds because they
assign value to the ability to trade their shares intradaily. The value of immediacy is 9.95
basis points. In addition to comparing SPDRs and Vanguard performances, Gastineau (2004)
investigates the difference in returns between iShares Russell 2000 ETFs and Vanguard Small
Cap Investor Shares over the 1994-2002 period. Irrespective of the underlying index, ETFs
underperform the corresponding mutual fund. However, Gastineau attributes these differences
to passiveness from ETF managers when faced with changes in index composition. Mutual
fund managers typically anticipate upcoming events to reduce transaction costs embedded in
the index modification process while ETF managers wait until the announcement.
To date, only a few studies deal with this issue concerning ETFs that are not based on
major broad-based indices or listed in the United States. Harper, Madura and Schnusenberg
(2006) extend the performance issue to country funds. Due to significantly lower expense
ratios, iShares country ETFs offer higher returns than corresponding closed-end country
funds. ETFs also have higher Sharpe ratios. In this case, the ETF cost efficient structure
proves decisive. On the younger Australian ETF market, Gallagher and Segara (2004) do not
find evidence that the streetTRACKS S&P/ASX 200 ETF over or underperformes the mutual
23
funds tracking the same index in 2002 and 2003. To our best knowledge, despite the growing
success of ETFs in Europe, only one study is dedicated to the performance of European ETFs
to date. For the seven most important ETFs traded on the Italian market, Zanotti and Russo
(2005) show that risk-adjusted returns are higher on average than those observed for
traditional mutual funds. It therefore seems that, contrary to what is observed in U.S. major
broad-based indices, ETFs based on less liquid indices or listed on less mature exchanges
might outperform their mutual fund counterparts.
6. The Impact of the Introduction of ETFs on Tradin g and Efficiency of Related
Securities
Before the introduction of ETFs, investors could already trade stock indices intradaily through
their component stocks and index derivatives. The advent of ETFs offers a new means to take
quick and inexpensive positions in indices. Given their specific characteristics and
organization, ETFs have attracted a significant portion of index-based trading. Either ETF
investors are new to indexing or they come from the other pre-existing index markets.
However, it is not very clear whether the arrival of new investors and the possible migration
of existing investors from one market to another alter the mix between liquidity and informed
traders for the basket and underlying stock components.
The spectacular growth of index futures markets in the 1980s had already raised the
question of what impact the introduction of a basket market would have on market quality.
Depending on the assumptions made about the integration of the different markets, theoretical
models predict opposite effects. In the framework of perfectly integrated markets,
Subramanyam (1991) and Gorton and Pennacchi (1993) model the strategic behaviour of
traders who can choose to trade either in the basket stock market or the underlying stocks
market. Subramanyam (1991) demonstrates that the basket security market most probably
serves as the lowest-cost market for the index. Adverse selection costs are lower on the
market for the basket in which the firm-specific private information is diversified. In Gorton
and Pennacchi’s (1993) model, liquidity traders will prefer the basket market as it enables
them to build their portfolios at a lower cost. Hence, the proportion of informed traders
negotiating the individual securities increases, which results in higher adverse selection costs.
In Fremault (1991) and Kumar and Seppi (1994), markets are assumed to be imperfectly
integrated. The introduction of a basket instrument removes some of the obstacles that limited
arbitrageurs from establishing profitable portfolios. Information asymmetry across markets
24
and arbitrage costs will tend to decrease, attracting new arbitrageurs. Arbitrage activity and
competition between informed traders will increase and result in higher liquidity in the
individual securities market.
Hedge and McDermott (2004) transpose these predictions to the introduction of ETFs. On
the one hand, the migration of liquidity trading from the stock market to the ETF market
could deter the liquidity of individual securities. On the other hand, if ETFs facilitate arbitrage
trading, their introduction would increase arbitrage activity and enhance both the liquidity of
the underlying stocks and the efficiency of the derivatives markets. Two contrasting theories
on how the introduction of ETFs modifies the established equilibriums can be tested: the
“adverse selection hypothesis” and the “arbitrage hypothesis”. The number of studies on this
issue is still limited, but we will nonetheless divide the discussion into three parts. We will
first review the studies that analyze to what extent ETF trading affects the quality of the
underlying index component stocks. Then, we will look at the research that tests what impact
the introduction of ETFs has on derivatives markets efficiency. Finally, we will consider
works that measure how the index pricing discovery process is influenced by the high ETF
trading levels.
6.1. ETFs and the Market Quality of Their Underlying Stocks
The advent of ETF trading is likely to have modified the mix of informed and liquidity traders
on the market for individual securities. To test to what extent this is the case, empirical studies
measure the importance of information asymmetries both in ETFs and individual stock
markets. This research typically relies on the analysis of bid-ask spreads and trading volumes
and measures the evolution of market quality after trading in ETFs becomes possible. Overall,
the ETF market is found to attract very few informed trading and to be more liquid than the
individual stocks market. However, there is no clear consensus on whether ETFs enhance
liquidity in the underlying stocks.
Hedge and McDermott (2004) provide an in-depth analysis of the market liquidity of
Diamonds and the stocks that constitute the DJIA around the launch of this ETF. Empirical
pre- and post-ETF comparisons of various liquidity measures computed over two 50-day
periods were used to test the impact of the ETF’s introduction. Their results support the
arbitrage hypothesis. The different measures of the individual stocks’ liquidity improve,
appearing to be mostly due to a decrease in adverse selection costs as measured with the price
formation model developed by Madhavan, Richardson and Roomans (1997). Moreover, the
25
trading volume and open interest of DJIA futures contracts increase over the sample period.
Similar, but less significant results are obtained for the introduction of Cubes.
The study of Madura and Richie (2005) on the introduction of Cubes supports the
arbitrage hypothesis. First, there is evidence of a decrease in the spreads of Nasdaq 100 index
components over the three months following the introduction of Cubes compared to the
preceding three-month period. Second, the decrease in the spread is all the more significant as
the weight of the stock is low. This result supports the role of ETFs in the measured decrease.
Passive fund managers need not invest in all securities to replicate the index. Rather, they use
sampling techniques and limit their activity to the top holdings. In contrast, arbitrageurs
investing in ETFs through the in-kind creation/redemption process must transact the full
hundred-stock portfolio. Among these stocks, the less weighted stocks experience the largest
increase in liquidity. Third, the introduction of Cubes was followed by an increase in the
pricing efficiency of the individual stock and a significant decline in systematic risk. Yu
(2005) also finds more efficient pricing and a decline in the trading costs of component stocks
following the introduction of the basket security for a sample of 63 ETFs and 15 HOLDRs
listed on the AMEX.
On the contrary, the results found by Van Ness, Van Ness and Warr (2005) and Ascioglu,
Aydogdu, Chou and Kugele (2006) support the adverse selection hypothesis drawn from
Subrahmanyam’s (1991) model. Over the two-month period that brackets the introduction of
Diamonds, Van Ness, Van Ness and Warr (2005) claim that liquidity traders move to the ETF
market since the spreads measured for the DJIA component stock experience a smaller
decline than those of the control sample. However, no significant modification is found in the
adverse selection components of the individual stocks, but the authors argue that this may
simply be due to the poor performance of adverse selection models in general. Ascioglu,
Aydogdu, Chou and Kugele (2006) break down the spread of 64 broad-based ETFs listed on
Nasdaq using Madhavan, Richardson and Roomans’ (1997) methodology. In this preliminary
study, tests are carried out over two months, March and April 2005. They show that
information asymmetry is less severe for ETFs than it is for comparable stocks, insofar as it is
possible to match the most traded ETFs with stocks.
Nonetheless, whatever the measured effect the introduction of ETFs has on individual
stocks, all studies find that the ETF liquidity is higher than that of the underlying stock
portfolio. For liquidity traders, ETFs appear to be a cheaper vehicle for building a diversified
index portfolio compared to investing in the individual stocks directly. The study of Bennett
26
and Kerins, Jr. (2003) confirms this last point for 92 ETFs listed on the AMEX over the last
quarter of 2000. This remains true even though some ETFs exhibit a lower trading volume
than the underlying stocks.
6.2. ETFs and the Efficiency of the Underlying Index Derivatives
In complete and perfect markets, arbitrage relationships tightly constrain the price of
derivatives with respect to their underlying asset. On real markets, with the existence of
friction and trading constraints, futures (Chung, 1991; Miller, Muthuswamy and Whaley,
1994) and options (Kamara and Miller, 1995) prices can fluctuate around their theoretical
value without giving rise to arbitrage opportunities. Arbitrage relationships only impose
bounds that widen with the prevalence of friction. As Ackert and Tian (2000) note, the advent
of ETFs removes some of the obstacles that prohibited arbitrageurs to enter in efficiency-
creating trades in index derivatives markets. Besides the possibility of shorting the index,
even on a downtick, ETFs should lower both trading costs and the liquidity risk of building an
index position. Moreover, in the imperfectly integrated market framework of Fremault (1991)
and Kumar and Seppi (1994), the advent of ETFs should increase inter-market arbitrage
activity. As a first hint in favour of these predictions, Hedge and McDermott (2004) find a
significant increase in the daily average DJIA and Nasdaq-100 futures trading volume and
open interest over the 101 trading days surrounding the introduction of Diamonds and Cubes,
respectively.
Empirical tests that study what impact the introduction of ETFs have on the efficiency of
derivatives markets first rely on the computation of arbitrage profits. The frequency and
values of arbitrage opportunities measured prior to the advent of ETFs are then compared to
those measured after. Though early studies use daily data, most recent works use tick-by-tick
data, which eventually allows differences in the persistence of efficient value distortions to be
tested. Futures markets distortions are defined with respect to cost-of-carry prices, whereas
the put-call parity relationship is the main benchmark for theoretical option values even
though other arbitrage relationships such as the lower boundary or constraints on spreads may
set efficiency boundaries. Overall, though futures market studies highlight an improvement in
inter-market efficiency, evidence for a similar pattern in the options market is mixed.
Park and Switzer (1995) test how TIPs, the very first ETF listed on the Toronto Stock
Exchange, impacted the efficiency of the Toronto 35 index futures market. Using closing
data, they find a reduction in arbitrage opportunities both in terms of frequency and value.
27
The authors interpret this result as evidence that the TIPs lowered arbitrage costs and thus
attracted more arbitrage activity. Switzer, Varson and Zghidi (2000) draw the same
conclusion from the reduction in mispricings measured after SPDRs were introduced. Non-
synchronous prices do not explain the improved efficiency observed since the pattern is
obtained both with daily and hourly data. As for the advent of Cubes, Kurov and Lasser
(2002) work with one year of transaction data concerning the near maturity of Nasdaq-100
futures. Whatever the assumed transaction cost levels, both the size and frequency of
deviations decrease once Cubes are traded. Kurov and Lasser also conduct ex ante tests that
consist in building the arbitrage portfolios only after an ad-hoc period has elapsed. They
document faster market reactions to observed deviations since a larger percentage of
opportunities disappear within two minutes in the post-ETF period. On the French index
futures market, Deville, Gresse and de Séverac (2006) investigate the impact the introduction
of the Lyxor CAC 40 ETF had on the pricing efficiency of the French broad-based CAC 40
index futures over a two-year period. Even after controlling for liquidity of futures contracts
and individual stocks and market volatility, ETFs appear to enhance inter-market efficiency.
However, further analysis shows that this improvement cannot be directly attributed to ETF
trading. Rather, the introduction of ETFs increased the liquidity of the underlying stocks
which may have attracted new arbitrage activity, thus tightening the spot-futures pricing
relationship.
In contrast, there is no clear evidence of improved efficiency in the options markets.
Their efficiency seems to improve over time, as evidenced by Ackert and Tian (1998) on the
Toronto Stock Exchange when TIPs were launched or by Ackert and Tian (2001) on the
CBOE when SPDRs were launched. However, they find no clear effect on the link between
stock and index options markets as measured by sole deviations to relationships that require
trading in the index. No significant improvement is found in the compatibility of their closing
price samples with these relationships. Opposite results are obtained with tick-by-tick data on
the French market by Deville (2003, 2005) for the launch of CAC 40 index ETFs. The
improvement of all market efficiency measures that rely on put-call parity supports the notion
that ETFs improve the efficiency of the options market. Moreover, the duration of deviations
drops twofold with the introduction of ETFs. Deville and Riva (2006) confirm the importance
of ETFs in enhancing inter-market efficiency through a survival analysis approach. The
existence of ETFs is found to be a major determinant of the process that drives prices back to
values compatible with efficiency.
28
6.3. ETFs and Price Discovery
With the creation and development of index futures, the cash market for component
stocks has gradually lost its prominence in index trading. Empirically, for U.S. broad-based
indices, studies that explore the dynamics of index prices show that the futures markets
incorporate information more rapidly than the stock markets. However, significant, but
weaker effects are measured from the latter to the first market. ETFs allow indices to be
traded throughout the day at low cost and may appear to be more convenient trading vehicles
than futures for smaller orders and liquidity traders. A question that naturally arises from this
is whether futures contracts remain the lead instrument in the price discovery process. A by-
product of the studies on price discovery is the insightful information they provide on where
uninformed and informed traders trade.
Despite the introduction of SPDRs, Chu, Hsieh and Tse (1999) show in a Vector Error
Correction framework that price discovery still takes place on S&P 500 futures. SPDRs only
make a small contribution to the common factor, but more so than the spot market. Since the
study is based on the ETFs’ first year of trading, it is necessary to view these results with
some caution. SPDRs only began to exhibit a high trading volume years later. Over the
March-May 2000 period, Hasbrouck (2003) analyzes the price discovery process using the
information share approach of Hasbrouck (1995) for three major U.S. indices. Investors can
take positions on the S&P 500 and Nasdaq-100 indices through individual stocks, floor-traded
futures contracts, electronically-traded E-mini futures contracts, options or ETFs. The largest
informational contributions come from the futures market, with the ETF market playing a
minor, though significant role. Interestingly enough, there was no E-mini contract for the S&P
MidCap 400 over the sample period and the ETF information share is the most important for
this last index.
Recent work by Tse, Bandyopadhyay and Shen (2006) shows that although the E-mini
DJIA futures contracts dominate price discovery, Diamonds also play a very significant part
in the process. Their results for the S&P 500 highlight a contribution of about 49% for the
ETF. However, this does not cast doubt on Hasbrouck’s (2003) results since they are based on
floor-based quotes and trades from the AMEX whereas Tse, Bandyopadhyay and Shen use
quotes from the ArcaEx Electronic Crossing Network14. The anonymous and immediate
14 This confirms what Tse and Erenburg (2003) find concerning the Nasdaq-100 index in that trading in ECNs contributes the most to price discovery.
29
trading execution obtained on electronic trading platforms may indeed attract informed
trading.
The results obtained by Henker and Martens (2004) contrast with the view that
derivatives and ETFs are the leading instruments. They follow Hasbrouck’s (1995)
methodology to assess the discovery process for two liquid HOLDRs from January to July
2003. Although there are no futures contracts that could attract most of the informed trading
activity, HOLDRs are dominated in the pricing discovery by component stocks. This evidence
is in line with the predictions of the Subrahmanyam’s (1991) model, in that the underlying
stocks will lead the basket instrument.
Each stock in the S&P 500 is also assigned to one of the nine Select Sector indices.
Sector ETFs may be of interest to liquidity traders looking for specific diversification as well
as to investors trading on private information at the sector-level. Even though some Sector
SPDRs such as the XLK (technology) exhibit significant trading, Hasbrouck (2003) show that
their information share is limited. In the period running from July 1, 2002 to September 20,
2002 the results obtained by Yu (2005) in a VAR framework are consistent with the view that
low information production occurs at the sector level. One explanation is that the high trading
costs and low liquidity that characterize these ETFs might deter liquidity trading.
Consequently, Sector SPDRs are unattractive to informed traders.
7. More Studies Devoted to ETFs
ETFs are often presented as an alternative, either interesting or not, to other index
instruments, mutual funds and derivatives. Literature on ETFs mostly takes the same
perspective. ETF performance is compared to that of index mutual funds and their efficiency
to that of closed-end funds. Their trading is essentially analyzed for the impact the advent of
ETFs has on the efficiency of the related index markets. However, ETFs trade like stocks and
a few studies started to transpose security market issues to ETFs. In particular, Boehmer and
Boehmer (2003) and Tse and Erenburg (2003) study the influence the NYSE ETF listing has
on the competition for order flow and market quality with regard to ETFs primarily traded on
the AMEX. Furthermore, the specific ETF structure may shed new light on other classical
questions. Arshanapalli, Switzer and Arbesfeld (2002) measure the impact SPDR creations
and redemptions have on the SPDR market price and index component stocks. Biktimirov
(2004) studies the conversion of TIPs to the i60 Fund to assess the shape of the demand curve
for equities. Finally, ETFs where initially designed to offer low-cost diversification in a single
30
trade, but little is known about their real use. The capacity of country ETFs to enhance
international diversification is questioned by Pennathur, Delcoure and Anderson (2002) and
Miffre (2004). Amenc, Malaise and Martellini (2004) illustrate the potential use of fixed-
income ETFs in core-satellite portfolio management.
On July 31, 2001, for the first time in its history, the NYSE exercised Unlisted Trading
Privileges15 and began trading the three majors ETFs, namely QQQQs, SPDRs and DIAs that
were then primarily listed on the AMEX. On April 15, 2002, the process was continued with
the addition of 27 new AMEX-listed ETFs and HOLDRs, mostly based on sector indices. As
of April 2006, 270 ETFs now trade on the NYSE on an UTP basis along with 94 primary
listed ETFs. The considerable ETF trading volume16 made the NYSE decide to join in the
competition. Before the NYSE entered into ETFs, QQQQs, SPDRs and DIAs were already
traded on the Nasdaq InterMarket, regional exchanges and the Island ECN. Tse and Erenburg
(2003) focus on QQQQs to investigate to what extent NYSE trading influenced the ETF
market quality as measured by liquidity, efficiency and price discovery. They find evidence
that trading on the NYSE has increased competition for order since spread declined in all
trading venues and the information shares of QQQQs relative to Nasdaq-100 futures increased
following competition from NYSE. However, this accrued competition between different
trading centres did not result in market fragmentation or increased trading costs. Boehmer and
Boehmer (2003) confirm these results for the entire 30-ETF set that began trading on the
NYSE. Post-NYSE liquidity is higher compared to pre-NYSE figures both in the entire
market and different market centres. Further analysis supports the hypothesis that ETF market
makers earned significant rents prior to the NYSE entry. However, in his discussion of
Boehmer and Boehmer (2003), Peterson (2003) suggests that these results are also consistent
with a segmentation hypothesis in which traders migrate to the market offering the best
liquidity for their trades. Nonetheless, competition appears to enhance overall market liquidity
without impeding the price discovery process. Competition between exchanges for ETF
listings caused Cubes to switch their listing from AMEX to Nasdaq on December 1, 2004,
with a change in ticker from QQQ to QQQQ. Broom, Van Ness and Warr (2006) show that
even when trading already takes place in different market venues, the location of the primary
15 An Unlisted Trading Privilege (UTP) is a right, provided by the Securities Exchange Act of 1934, that permits securities listed on any U.S. securities exchange to be traded by other such exchanges. 16 Boehmer and Boehmer (2003) note that, in early 2001, Cubes, Spiders and Diamonds generated an average daily trading volume of about $5 billion all together.
31
listing is an important determinant of trading activity since the move resulted in a decline in
trading costs, a consolidation of order flow and a less fragmented market.
ETFs are of particular interest in the study of the shape of the stock demand curve since
non-informational events regarding individual stocks are likely to occur for these securities.
Such events may be regular as is the case for in-kind creations and redemptions studied by
Arshanapalli, Switzer and Arbesfeld (2002) or exceptional like the conversion of TIPs into a
new fund that is the central point of Biktimirov (2004). The findings of Arshanapalli, Switzer
and Arbesfeld (2002) concerning the impact of index composition changes and SPDR
creations and redemptions from January 29, 1993 to September 29, 2001 support the
downward sloping demand curve concept. Biktimirov (2004) makes use of a more specific
event to examine the effect of demand on stock prices: the conversion of unredeemed TIPs 35
and TIPs 100 shares into new S&P/TSE 60 Index Participation Fund (i60 Fund) shares that
occurred on the Toronto Stock Exchange on March 6, 2000. The forty stocks in the Toronto
100 index that were not included in the S&P/TSE 60 index (which served as a benchmark for
the i60 Fund) had to be sold. Biktimirov claims that this event is completely non-
informational since it has been long anticipated and is not associated with a change in the
composition of the index. Selling pressure results in a decline in value both the day before
conversion and the day of conversion with abnormal trading volumes. There is no change in
liquidity and the price decline is permanent. All this evidence is consistent with the
downward-sloping demand curve hypothesis.
The natural properties of country-ETFs for international diversification are studied by
Pennathur, Delcoure and Anderson (2002). They find that the international iShares series
efficiently replicates its foreign index benchmarks. However, its potential for diversification
is limited due to of a high degree of exposure to U.S. equity markets. Miffre (2004)
nonetheless insists on the specific advantages country-ETFs have over conventional mutual
and closed-end country funds: short-selling on a downtick, low costs and tax efficiency, to
name but a few. Investors are thus able to achieve superior diversification with ETFs as long
as they invest significant amounts. Amenc, Malaise and Martellini (2004) measure the
performance of a dynamic core-satellite approach based on fixed-income ETFs. However,
ETFs only serve illustrative purposes and no empirical comparison with other investment
vehicles is provided.

32
8. Conclusion and Perspectives
ETFs are open-end index funds that trade like regular stocks on exchanges. They combine the
features of conventional mutual funds and closed-end funds since new shares can be
continuously created or redeemed and outstanding shares trade throughout the day on
exchanges. They were initially launched in North-American markets in the early 1990s and
new listings on exchanges led to more than 450 different ETFs being traded around the world
with steadily increasing assets under management. What is even more spectacular is the
growth in trading volume these instruments have generated. In the U.S., major ETFs are more
traded than any other security. European ETF markets are younger, but they exhibit similar
tendencies, with fierce competition both between issuers for new cash and between exchanges
for order flow. Their success raises the issue of the organization of mutual fund trading.
Research on ETFs mostly focuses on their efficiency and performance as well as on their
impact on the other index markets. Compared to closed-end funds, the specific in-kind
creation and redemption process ensures a higher degree of pricing efficiency. Nonetheless,
the advantages inherent to the in-kind process do not help ETF managers provide higher
performance over the least-cost no-load index mutual funds. Overall, the advent of ETFs
enhances the liquidity of the individual stock making up the benchmark indices and the
efficiency of index derivatives markets. Finally, ETFs play a significant, though not
prominent role in the price discovery process.
Despite the increasing importance of ETFs markets, literature on these topics is still
scarce, although research perspectives are promising. For example, European and Asian ETFs
markets are very active, but remain an almost untouched research field. The empirical, but
also theoretical questions of competition between marketplaces and between ETFs tracking
the same index still need to be investigated. Regulatory issues should also be included in
future research as the evolution of ETF markets may lead markets and regulators to adopt new
rules. This has already been the case for the so-called trade-through rule exemption
implemented by SEC for ETFs studied by Hendershott and Jones (2005). Finally, new types
of ETFs, such as the recent commodity ETFs, are launched on a regular basis and a study has
yet to examine their specificities, trading or uses for fixed-income ETFs and ETF derivatives.
33
References
Ackert L. F. and Y. S. Tian (1998). “The Introduction of Toronto Index Participation Units
and Arbitrage Opportunities”, Journal of Derivatives, v5(4), 44-53.
Ackert L. F. and Y. S. Tian (2000). “Arbitrage and Valuation in the Market for Standard and
Poor’s Depositary Receipts”, Financial Management, v29, 71-87.
Ackert L. F. and Y. S. Tian (2001). “Efficiency in Index Options Markets and Trading in
Stock Baskets”, Journal of Banking and Finance, v25, 1607-1634.
Amenc M., P. Malaise and L. Martellini (2004). “Revisiting Core-Satellite Investing”,
Journal of Portfolio Management, v31(1), 64-75.
Ascioglu A., M. Aydogdu, R. K. Chou and L. P. Kugele (2006). “An Analysis of Intraday
Patterns in ETF and Common Stock Spreads”, working paper.
Arshanapalli B., L. N. Switzer and J. Abersfeld (2002). “Index Participation Units and the
Structure of Equity Market Demand: Evidence from New Issues and Redemption of
SPDRs”, working paper.
Bennet J. and F. J. Kerins, Jr (2003). “Exchange Traded Funds: Liquidity and Informed
Trading Levels”, working paper.
Biktimirov E. N. (2004). “The Effects of Demand on Stock Prices: Evidence from Index Fund
Rebalancing”, Financial Review, v39, 455-472.
Blank, H. and P. Lam (2002). “The Development and Evolution of ETFs in North America”,
Investment & Pensions Europe.
Boehmer B. and E. Boehmer (2003). “Trading your Neighbor’s ETFs: Competition or
Fragmentation?”, Journal of Banking and Finance, v27, 1667-1703.
Bogle J. C. (2004). “Convergence: The Great Paradox?”, Remarks before “The Art of
Indexing” Conference.
Broom K. D., R. A. Van Ness and R. S. Warr (2006). “Cubes to Quads: The Move of the
QQQ ETF from AMEX to NASDAQ”, working paper.
Cherry J. (2004). “The Limits of Arbitrage: Evidence from Exchange Traded Funds”,
working paper, University of California, Berkeley.
34
Chu Q. C., W.-L. G. Hsieh and Y. Tse (1999). “Price discovery on the S&P 500 index
markets: An analysis of spot index, index futures, and SPDRs”, International Review of
Financial Analysis, v8, 21-34.
Chung P. (1991). “A Transactions Data Test of Stock Index Futures Market Efficiency and
Index Arbitrage Profitability”, Journal of Finance, v46(5), 1791-1809.
Curcio R. J., J. M. Lipka and J. H. Thornton, Jr (2004). “Cubes and the Individual Investor”,
Financial Services Review, v13, 123-138.
Dellva W. L. (2001). “Exchange-Traded Funds Not for Everyone”, Journal of Financial
Planning, 110-124.
Deville L. (2003). “Impact de l’introduction du tracker Master Share CAC40 sur la relation de
parité call-put”, Banque et Marchés, 62, 50-57.
Deville L. (2005). “Time to Efficiency in Options Markets and the Introduction of ETFs:
Evidence from the French CAC40 Index”, working paper, Paris Dauphine University.
Deville L., C. Gresse and B. de Séverac (2006). “The Introduction of the CAC 40 Master Unit
and the CAC 40 Index Spot-Futures Pricing Relationship”, working paper, Paris
Dauphine University.
Deville L. and F. Riva (2006). “The Efficiency Process in Options Markets: A Survival
Analysis Approach”, working paper, Paris Dauphine University.
Dimson E. and C. Minio-Kozerski (1999). “Closed-End Funds: A Survey”, Financial
Markets, Institutions & Instruments, v8(2).
Elton E. J., M. J. Gruber, G. Comer and K. Li (2002). “Spiders: Where are the Bugs?”,
Journal of Business, v75(3), 453-472.
Engle R. and D. Sarkar (2006). “Premiums-Discounts and Exchange Traded Funds”, Journal
of Derivatives.
Fremault A. (1991). “Stock Index Futures and Index Arbitrage in a Rational Expectations
Model”, Journal of Business, v64, 523-547.
Gallagher D. R. and R. Segara (2004). “The Performance and Trading Characteristics of
Exchange-Traded Funds Funds”, working paper, University of New South Wales.
Gastineau G. L. (2001). “Exchange Traded Funds: An Introduction”, Journal of Portfolio
Management, v27(3), 88-96.
35
Gastineau G. L. (2002). The Exchange-Traded Funds Manual, John Wiley & Sons, New
York.
Gastineau G. L. (2004). “The Benchmark Index ETF Performance Problem”, Journal of
Portfolio Management, v30(2), 96-103.
Gleason K. C., I. Mathur and M. A. Peterson (2004). “Analysis of Intraday Herding
Behaviour Among the Sector ETFs”, Journal of Empirical Finance, v11(5), 681-694.
Gorton G. and G. Pennacchi (1993). “Security Baskets and Index-Linked Securities”, Journal
of Business, v66, 1-27.
Harper J. T., J. Madura and O. Schnusenberg (2006). “Performance Comparison Between
Exchange Traded Funds and Closed-End Country Funds”, Journal of International
Markets, Institutions, and Money, v16(2), 104-122.
Hasbrouck J. (1995). “One Security, Many Markets: Determining the Contributions to Price
Discovery”, Journal of Finance, v50(4), 1175-1199.
Hasbrouck J. (2003). “Intraday Price Formation in U.S. Equity Index Markets”, Journal of
Finance, v58(6), 2375-2399.
Hegde S. P. and J. B. McDermott (2004). “The Market Liquidity of DIAMONDS, Q’s and
their Underlying Stocks”, Journal of Banking and Finance, v28, 1043-1067.
Hendershott T. and C. M. Jones (2005). “Trade-Through Prohibitions and Market Quality”,
Journal of Financial Markets, v8, 1-23.
Henker T. and M. Martens (2004). “Price Discovery in HOLDR Security Baskets and the
Underlying Stocks”, working paper, University of New South Wales.
Jares T. E. and A. M. Lavin (2004). “Japan and Hong Kong ExchangeTraded Funds (ETFs):
Discounts, Returns and Trading Strategies”, Journal of Financial Services Research,
v25(1), 57-69.
Kostovetsky L. (2003). “Index Mutual Funds and Exchange-Traded Funds”, Journal of
Portfolio Management, v29(4), 80-92.
Kumar P. and D. Seppi (1994). “Information and Index Arbitrage”, Journal of Business, v67,
481-509.
36
Kurov A. A. and D. J. Lasser (2002). “The Effect of the Introduction of Cubes on the Nasdaq-
100 Index Spot-Futures Pricing Relationship”, Journal of Futures Markets, v22(3), 197-
218.
Lee C. M. C., A. Shleifer and R. Thaler (1991). “Investor sentiment and the closed-end fund
puzzle”, Journal of Finance, v46(1), 75-109.
Madhavan A., M. Richardson and M. Roomans (1997). “Why Do Security Prices Change? A
Transaction-Level Analysis of NYSE Stocks”, Review of Financial Studies, v10, 1035-
1064.
Madura J. and N. Richie (2004). “Overreaction of Exchange-Traded Funds During the Bubble
of 1998-2002”, Journal of Behavioral Finance, v5(2), 91-104.
Madura J. and N. Richie (2005). “Impact of the QQQ on Liquidity, Pricing Efficiency, and
Risk of the Underlying Stocks”, working paper, Susquehanna University.
Miller M. H., J. Muthuswamy and R. E. Whaley (1994). “Mean Reversion of S&P500 Index
Basis Changes: Arbitrage Induced or Statistical Illusion?”, Journal of Finance, v49(2),
479-513.
Miffre J. (2004). “Country Specific ETFs: An Efficient Approach to Global Asset
Allocation”, working paper, Cass Business School.
Mussavian M. and L. Hirsch (2002). “European Exchange-Traded Funds: An overview”,
Journal of Alternative Investments, v5, 63-77.
Park T. H. and Switzer L. N. (1995). “Index Participation Units and the Performance of Index
Futures Markets, Evidence from the Toronto 35 Index Participation Units Market”,
Journal of Futures Markets, v15, 187-2000.
Pennathur A. K., N. Delcoure and D. Anderson (2002). “Diversification benefits of iShares
and closed-end country funds”, Journal of Financial Research, v25, 541-557.
Peterson M. (2003). “Discussion of “Trading your Neighbor’s ETFs: Competition or
Fragmentation?” by Boehmer and Boehmer”, Journal of Banking and Finance, v27,
1705-1709.
Poterba J. M. and J. B. Shoven (2002). “Exchange-Traded Funds: A New Investment Option
for Taxable Investors”, American Economic Review, v92(2), 422-427.
37
Simon D. P. and J. S. Sternberg (2004). “Overreaction and Trading Strategies in European
iShares”, working paper.
Subrahmanyam A., (1991). “A Theory of Trading in Stock Index Futures”, Review of
Financial Studies, v4, 17-51.
Switzer L. N., P. L. Varson and S. Zghidi (2000). “Standard and Poor’s Depository Receipts
and the Performance of the S&P 500 Index Futures Market”, Journal of Futures
Markets, v20(8), 705-716.
Thirulamai R. S. (2003). “Active vs. Passive ETFs”, working paper.
Tse Y. and G. Erenburg (2003). “Competition for Order Flow, Market Quality, and Price
Discovery in the Nasdaq 100 Index Tracking Stock”, Journal of Financial Research,
v26(3), 301-318.
Tse Y., P. Bandyopadhyay and Y.-P. Shen (2006). “Intraday Price Discovery in the DJIA
Index Markets”, working paper.
Van Ness B. F., R. A. Van Ness and R. S. Warr (2005). “The Impact of the Introduction of
Index Securities on the Underlying Stocks: The Case of the Diamonds and the Dow 30”,
Advances in Quantitative Finance and Accounting, v2, 105-128.
Yu L. (2005). “Basket Securities, Price Formation and Informational Efficiency”, working
paper, Notre Dame University.
Zanotti G. and C. Russo (2005). “Exchange Traded Funds Versus Traditional Mutual Funds:
A Comparative Analysis on the Italian Market”, working paper, Bocconi University.