excise and import taxes on wine, beer and spirits: an ... · an international comparison . kym...
TRANSCRIPT

Excise and Import Taxes on Wine, Beer and Spirits: An
International Comparison
Kym Anderson
Kym Anderson School of Economics University of Adelaide Adelaide SA 5005 Phone: +61 8 8303 4712 [email protected]
Revised December 2009
Paper for the pre-AARES conference workshop on The World’s Wine Markets by 2030: Terroir, Climate Change, R&D and Globalization, Adelaide Convention Centre, Adelaide, South Australia, 7-9 February 2010.

2
2
Excise and Import Taxes on Wine, Beer and Spirits: An International Comparison
Kym Anderson
School of Economics University of Adelaide
Adelaide SA 5005 Phone +61 8 8303 4712
Revised December 2009
For presentation as a Contributed Paper at the AARES/AAWE Workshop on The World’s Wine Markets by 2030, Adelaide Convention Centre, 8-9 February 2010. Thanks are due to Jayanthi Thennakoon for research assistance, and to Fosters, GWRDC (Project Number UA08/04) and the University of Adelaide’s Wine2030 project for financial support. The views expressed are the author’s alone and not necessarily those of any of the funders.

3
3
Excise and Import Taxes on Wine, Beer and Spirits: An International Comparison
Abstract
Nearly all countries tax the domestic consumption of alcoholic beverages. However, the rates
of taxation, and the tax instruments used, vary enormously between countries. This
paper provides estimates, for a wide range of high-income and developing countries, of the
consumer tax equivalents (CTEs) of wine, beer and spirits taxes as of 2008 (and also 2005
and 2007 in some cases). It encompasses wholesale sales taxes, excise taxes and import
tariffs expressed both in dollars per litre of alcohol and as a percentage of what the wholesale
price would be without those taxes (since many taxes are volumetric and so their percentage
CTE rates vary with the price of the product). The wine CTE tends to be lower in countries
with a large wine industry, by which standard Australia and New Zealand are shown to have
relatively high wine CTEs. In Australia's case this is especially so for premium wine, because
Australia uses a percentage tax rather than the more-commonly used volumetric tax measure.
This has implications for the current debate over reforms to Australia's tax system. It also
reduces the incentive for Australian vignerons to produce fine wines, given that one-third of
production is still sold to domestic consumers.
Keywords: consumer wine taxation, excise taxes, wine import tariffs, consumer tax equivalent
JEL codes: H21, H22, H23, F13 Author contact: Kym Anderson School of Economics University of Adelaide Adelaide SA 5005 Phone: +61 8 8303 4712 [email protected]

Excise and Import Taxes on Wine, Beer and Spirits: An International Comparison
Kym Anderson
Ten years ago the Australian Government introduced a goods-and-services tax (GST).
In doing so it replaced the wholesale sales tax on wine of 41 per cent with a top-up
wholesale Wine ‘Equalization’ Tax (WET) which, together with the GST, brought in
roughly the same tax revenue from domestic wine consumers as the tax it replaced.1
Alternative proposals, pushed by some spirits industry and anti-alcohol interest
groups, suggested the WET should be much higher and volume based.2
The Australian Government is again considering tax reform, following a major
review of the overall Australian tax system (the Henry Review, completed at the end
of 2009 but not yet made public), and again the question of wine and other alcohol tax
rates and instruments has come into focus (encouraged somewhat by the World
Health Organization (2009) call for tougher measures to reduce the harmful use of
alcohol). Australia’s wine industry has argued that the rate of taxation of wine should
not be raised as they claim (a) it is still high by international standards and (b) wine is
Australia’s
rate of wine consumer taxation was shown by Berger and Anderson (1999) to be high
by OECD standards at that time, and especially by the standards of significant wine
producing/exporting countries. But Australia’s type of wine tax is unusual in being ad
valorem (percentage) rather than specific (cents per litre).
1 Government revenue raising is a significant, but not the only, reason for the current tax. Its relevance should have diminished in the context of a major tax reform that introduced a general goods-and-services tax. An additional motivation for taxing wine and other alcoholic beverages is to offset perceived negative health and other social externalities from excessive drinking. In the case of wine, however, there is evidence of positive health benefits from moderate drinking, especially of red wine. Assessments of those externalities and other aspects affecting the optimal type and rate of taxation of different alcoholic beverages are provided in, e.g., Pogue and Sgontz (1989) and Freebairn (2010). 2 For an empirical analysis of these and other wine tax options for Australia at that time, using an economy-wide model, see Wittwer and Anderson (2002). A contemporary empirical analysis of options under consideration currently, with a focus on their distributional consequences for Australia’s various wine regions, is available in Anderson, Valenzuela and Wittwer (2010).

2
2
drunk mainly by adults in moderation with food rather than by young binge drinkers
and so has fewer social costs than other forms of alcohol (WFA 2010). This paper
examines that first claim by comparing recent rates for Australia with those of other
countries, as a contribution to that debate. In doing so we also compile tax rates for
other alcoholic beverages, for prospective use by those modellers of the world’s wine
markets with a model that includes demand functions for those substitutes for wine.
The taxes normally considered are domestic excise taxes, but countries can – and
some do – use import taxes at their border as an additional or alternative way of
raising the consumer price. Hence they too are considered here.3
The present paper begins by discussing the data available and the methodology
for comparing rates of taxation across countries. It then presents estimates of the
domestic alcohol taxes in Australia and 45 other high-income and developing
countries that together account for more than 90 per cent of global wine consumption.
The tax rates are expressed both as ad valorem equivalents and as volumetric rates
(per litre of alcohol), and at a selection of price points. The latter is helpful for
considering the impact these taxes are having on different types of consumers; but it is
also helpful for analysts seeking to use these estimates in economic models of wine
markets in which the distinction is made between, say, non-premium, commercial
premium and super-premium wines. The ad valorem consumer tax equivalents of
import tariffs on those products are then presented, both on their own and then in
combination with domestic taxes so as to get a set of overall consumer tax rates. The
final section draws out implications for the on-going tax reform debate in Australia.
Methodology and data sources
Since specific (volumetric, dollars per litre) as well as ad valorem (percentage) tax
rates are used in many countries, the consumer tax equivalent (CTE) in percentage
terms typically varies with the price of wine. This distinction is important because in
recent years the world wine market has been characterised by a trend towards
premium wine consumption, and in some traditional wine-consuming countries the
volume of non-premium wine consumption has fallen greatly. We therefore identify 3 Export subsidies also could raise the consumer price, but they have been minor in the past and are mostly phased out now. The effect of government policies on grape and wine producer incentives are ignored here, since wine is a traded product and so those supply-side effects mainly influence the share of production exported rather than the price paid by domestic consumers.

3
3
the tax type (specific or ad valorem) and express the CTE in terms of dollars per litre
or bottle as well as an ad valorem equivalent for three different retail pre-tax price
levels: for non-premium wine (A$2.50 per litre at the wholesale pre-tax level), for
mid-range commercial premium wine (A$7.50 per litre) and for super-premium wine
(A$20 per litre). The chosen price for non-premium wine such as sold in casks
(A$2.50/litre wholesale pre-tax), with a 29% excise tax (WET), a 33% mark-up to
retail, and the 10% GST, implies a retail price of $18.90 for a 4-litre cask. For
commercial premium wine, A$7.50/litre wholesale implies, with a 29% excise tax
(WET), a 50% mark-up to retail and 10% GST, a retail price of $12 for a 750ml
bottle; and for super-premium wine (A$20/litre wholesale) and the same mark-ups as
commercial premium implies a retail price of almost $32 for a 750ml bottle. Two
types of sparkling wine also are considered, at wholesale pre-tax prices of A$7.50 and
A$25/litre. In making these calculations we assume that wine and beer degree alcohol
contents are 12 and 4 percent, respectively, and that the absolute alcohol content for
spirits is 40 percent.
The consumer tax equivalent (CTE) is defined as the percentage by which the
pre-tax wholesale price has been raised by beverage taxes (but not including the GST
or VAT).4
Second, we assume that imported and domestically produced wines are perfect
substitutes. That is, we assume the domestic prices of all wines, not just those
imported, are raised by the amount of any import tariff. The tariff portion of the price
is then also subject to any domestic consumer tax. Given the heterogeneous nature of
wine, it is unlikely that the average price of all wine will increase by the full amount
of the tariff, and more so the less substitutability there is between domestically
produced and foreign wines (the degree of which in practice differs by country of
origin). This assumption inflates the estimated CTE above its true value in countries
To estimate it, numerous assumptions have to be made. First, the CTE is
assumed to apply also at the retail level, on the assumption that the wholesale-to-retail
margin is ad valorem. If in fact those margins are somewhat independent of the
product price, then our CTE estimate will overstate the impact on consumers at rte
retail level.
4 Most countries also have a value-added or goods-and-services tax applying to beverages, but since those taxes apply at the retail level to most other goods as well we do not add them to the beverage-specific taxes. However, for completeness they are reported in Appendix Table 7. Also included in the Appendix are the foreign exchange rates used to convert specific tax rates expressed in national currencies to a common currency (Appendix Table 9).

4
4
that are significant producers of wines that differ from those countries’ imports.
However, this is more or less offset by our inability to include estimates of the
contribution to the true CTE of non-tariff barriers to wine imports.
Third, neither the average pre-tax retail prices of a bottle of commercial or
super-premium wine or a litre of non-premium wine, nor the shares of each of these
types in national wine consumption, are reliably known for more than a handful of
countries. Hence an average CTE for each country is not calculated for wine as a
group. Instead we calculate the CTE at price levels that approximate the average
prices in Australian dollars for the three chosen categories of wine sold in Australia in
2008. For each of beer and spirits we use, for simplicity of comparison, only one
representative price (A$2 and A$15 per litre at the wholesale pre-tax level,
respectively).
The primary source for domestic tax data are national government websites
plus the European Commission (2008) and the OECD (2006, 2008). The import tariffs
are taken from the WITS database (World Bank and UNCTAD 2009). Depending on
the importing country, a bottle of wine could face a specific (volume-based) tariff, an
ad valorem (value-based) tariff or a tariff based on the volume of alcohol in the
product. Specific tariffs based on volume are the most popular in Europe and the
United States, while ad valorem tariffs based on product value are the norm in the
Asia-Pacific region with the exception of Japan and Malaysia.
CTE calculations
Appendix Tables 1 to 6 detail the rates used as the basis for calculating the consumer
tax equivalent (CTE) by tax instrument for the various beverages expressed both in
dollars and in percentages. Summaries of those estimates are shown in Tables 1 to 5,
each of which is discussed in turn.
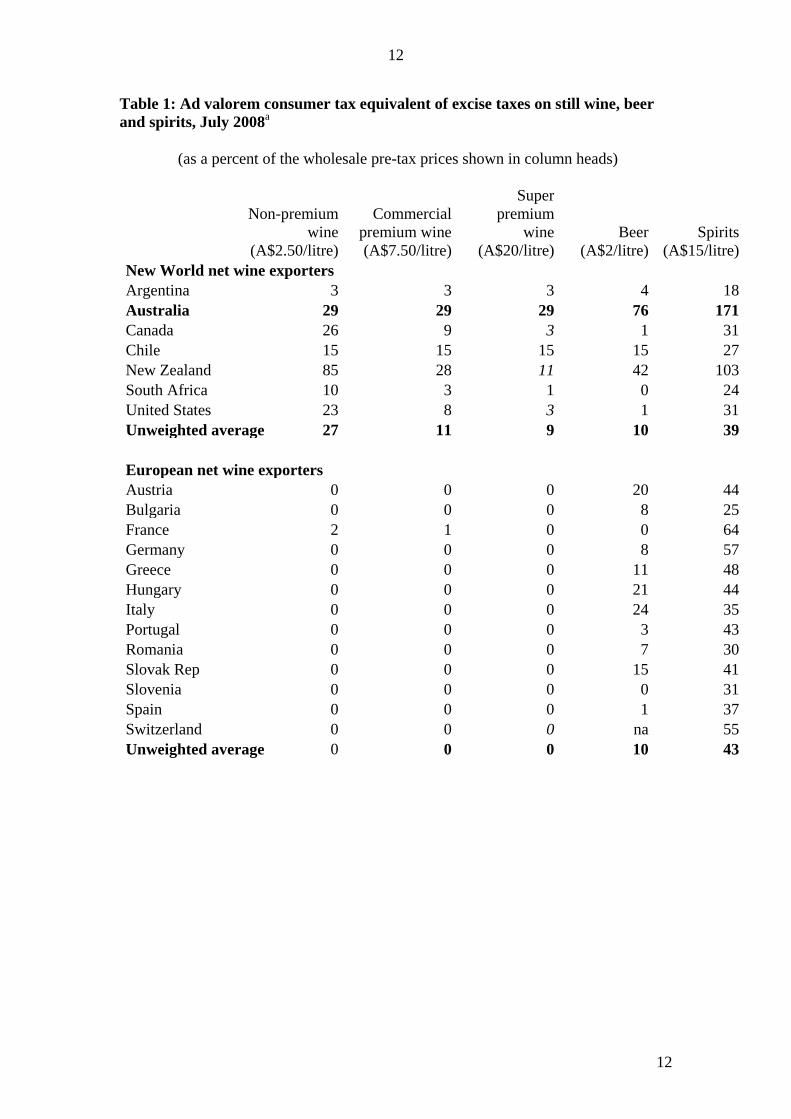
In Table 1 we show the CTE for still wine, beer and spirits (excluding VAT or
GST), expressed as a percentage of selected wholesale pre-tax prices. Relative to
other wine-exporting New World countries, and certainly European wine-exporting
countries, Australia does indeed have higher ad valorem equivalent excise taxes on
wine at all three price points. However, Australia’s wine tax rates are lower than their
counterparts in wine-importing countries, shown in the second half of Table 1, except

5
5
in the case of wines above the commercial premium range. Furthermore, Australia has
higher excise taxes also for beer and spirit than the average for either of those two
groups of other countries, and by that international standard wine is lightly taxed
relative to beer and spirits in Australia. The only group of wine consumers in
Australia who could claim to be relatively highly taxed are those who buy super-
premium or iconic wines. This is ironic, since they are the least likely to contribute to
the social problem of binge drinking – which is not the case in most other countries
because they have volumetric rather than ad valorem wine taxes.
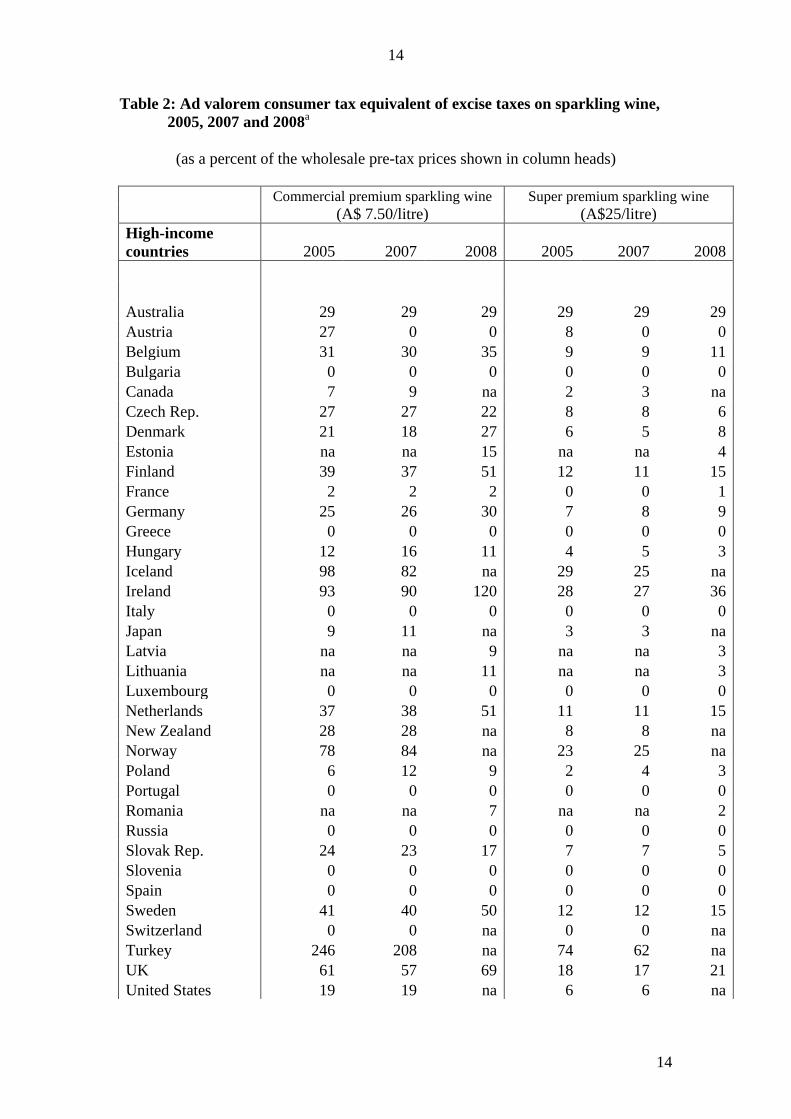
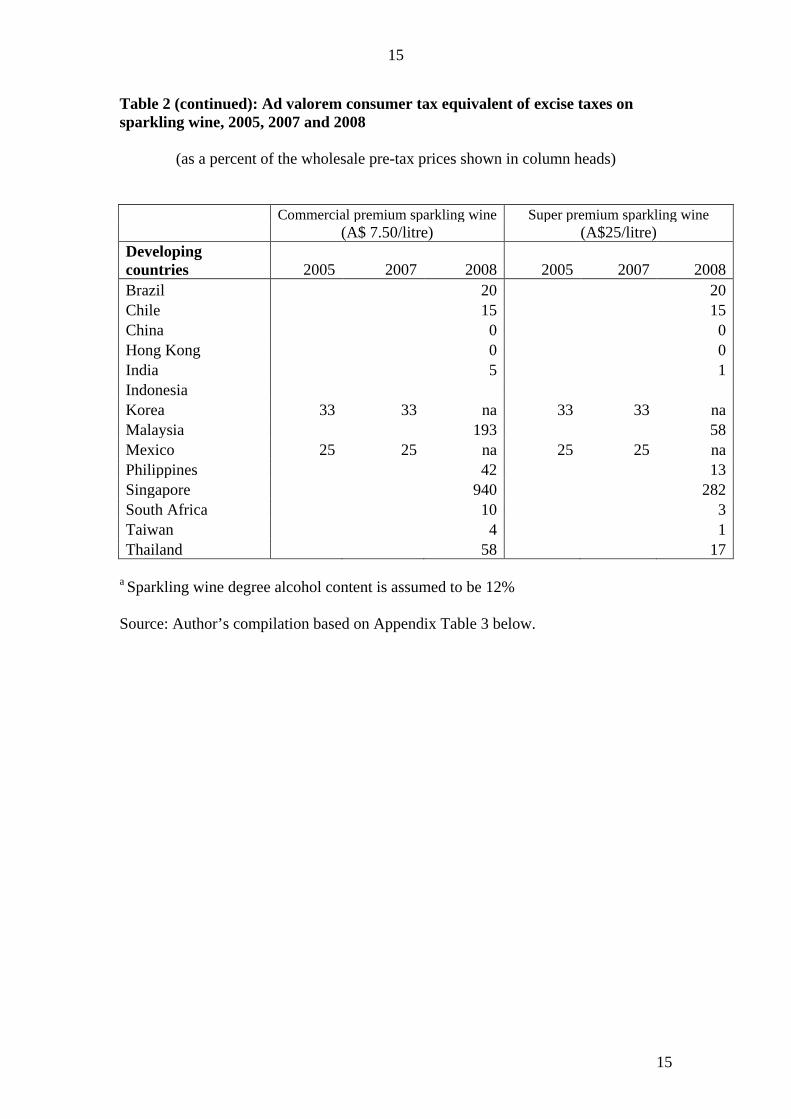
Table 2 provides comparable numbers for the CTE on sparkling wines, where
the story is much the same as for still wines, that is, only consumers of the super-
premium (not commercial premium) product could be considered relatively highly
taxed in Australia. There is no obvious economic justification for this type of
penalizing of consumers of high-quality wine, given the presence of tiered income tax
rates that can deal adequately with any income distributional issues society may have.
In Table 3 the CTEs are expressed not as percentages of the wholesale price
but rather as dollars per litre of alcohol. These present a mirror to the numbers just
summarized, in that they confirm (a) that low-quality wines below about A$7.50 are
lightly taxed in Australia relative to other countries except the group of net exporters
of wine, and (b) that the alcohol in beer and spirits is taxed more in Australia than in
most other countries, so making low-quality wine an even cheaper source of alcohol
relative to non-wine sources in Australia than elsewhere.
Those first three tables refer only to domestic taxes on alcohol. Many
countries also impose import duties on beverages at their border. Table 4 summarizes
estimates of the ad valorem equivalent of them, given that an import duty is the
equivalent of a production subsidy and a consumption tax on like goods. As can be
seen, these duties are close to zero for most high-income countries including
Australia,5
When the import duties are combined with the ad valorem excise taxes shown
in Table 1, Australia’s relative position does not change much vis-à-vis other high-
income countries, but the CTEs of developing countries now look higher compared
but they are nontrivial for numerous developing countries.
5 The calculated CTEs for North America are ‘lower bound’ estimates of the true CTEs as the price effects of state monopoly controls on the distribution of alcohol in Canada, and myriad state-controlled non-tariff barriers to wine trade into the United States, have not been quantified. It is alleged, for example, that the Liquor Control Board of Ontario (possibly the world’s biggest importer of wine) applies a two-thirds mark-up on imported wine.

6
6
with Australia’s. Even so, when illustrated as in Figures 1 and 2, Australia is seen as
an outlier in terms of its high taxes on high-priced wines whereas it is seen as more
towards the low-tax end of the spectrum for non-premium wines. Australia’s super-
premium wine consumers face a CTE three times greater than the OECD unweighted
average of 9.7 percent, while its non-premium consumers face a CTE of only half the
OECD unweighted average of 67 percent. Meanwhile Australia’s beer and spirits
CTEs, according to Table 5, are about seven times and twice the OECD unweighted
averages of 10 and 85 percent, respectively.
Implications for Australia’s tax reform debate
Even the relatively light taxation of lower-priced wine consumption in Australia over
the past decade was a long time in coming. While beer and spirits have always
attracted excise taxes in Australia, it was not until August 1970 that an excise tax (of
50 cents per gallon) was imposed on wine. So unpopular was the tax that it was
halved in March 1992 and completely removed in December 1972 by the new
Whitlam Labor Government. The Fraser Coalition Government that followed resisted
re-introducing it, but the Hawke Labor Government chose to impose a 10 per cent
wholesale sales tax in its first (August 1984) budget. The wholesale sales tax was
subsequently raised to 20 per cent in the August 1986 budget, where it stayed until the
Labor Government raised it to 31 per cent in the August 1993 budget. The outcry that
followed led to its reduction to 22 per cent in October of that year and the setting up
of an inquiry into the industry and its taxation (Industry Commission 1995). In the
event, the wholesale sales tax was raised by two percentage points in July 1994 and
again in July 1995, after which it remained at 26 per cent until the GST came in at the
turn of the century. Meanwhile, State government franchise fees on wine sales had
risen to close to 15 per cent at the wholesale level. From August 1997, those fees were
collected by the Federal Government on behalf of the States, following a High Court
ruling declaring State franchise fees unconstitutional. Thus the wholesale sales tax
was a total of 41 per cent when the GST was introduced on 1 July 2000, at which time
it was replaced by the wholesale-level Wine Equalization Tax of 29 percent plus the
retail 10 percent GST.
The steady rise in the ad valorem tax rate over the past two decades has raised
government revenue from wine at a much faster rate than those rate hikes imply. This
7
7
is not because growth in national consumption of wine, because that has changed very
little over that period. Rather, it is because the premium wine share of domestic
consumption has risen steadily, and so too has its average price. Prior to the mid-
1980s, less than 20 percent of wine consumed in Australia was considered of
premium quality and sold in 750 ml bottles, but by the mid-1990s that had risen to
around 30 percent and now it is above 45 percent.
Given the strong lobbying by the health community for higher volumetric
taxation of alcohol consumption in general, and by the beer and spirits industries for
greater tax equality across types of alcoholic beverages, it is not surprising that
Australia’s 2009 Henry review of taxation has focused on both the level of wine
taxation and on whether the tax measure should remain ad valorem. An economic
modelling analysis of what impacts a change in the type and rate of tax on wine might
have on wine and other beverage consumption in Australia, and on the wine
industry’s production and exports, is available in Anderson, Valenzuela and Wittwer
(2010) and so is not provided here. But one adverse impact of the current ad valorem
wine tax is that it reduces the incentive for Australian vignerons to produce fine
wines, given that one-third of total production, and an even larger share of super
premium wine, is sold to domestic consumers.
By way of conclusion, several points the industry might note from this paper’s
tables are the following:
• Wine consumption is not taxed in most European wine-producing countries;
• Among the New World wine-exporters, Australia is the highest-taxing country
for 750ml bottles of wine above about A$7.50 wholesale pre-tax;
• Even for non-premium wine retailing at less than $20 for a 4-litre cask, among
the New World wine-exporters only New Zealand has (at 85 percent) an ad
valorem equivalent wine tax rate above Australia’s 29 percent;
• Among the wine-importing high-income countries, for 750ml bottles of wine
above A$7.50 wholesale pre-tax the only countries with ad valorem equivalent
wine tax rates above Australia’s 29 percent are the UK, Ireland and the Nordic
countries;
• Even for the wine-importing developing countries for which data have been
found, for 750ml bottles of wine above $7.50 wholesale pre-tax only half have
ad valorem equivalent wine tax rates above Australia’s 29 percent, namely,

8
8
Korea, Malaysia, Thailand and Turkey (and India if import duties are
included).
References
Anderson, K., E. Valenzuela and G. Wittwer (2010), “Wine Export Demand Shocks
and Wine Tax Reform in Australia: Regional Consequences Using an
Economy-Wide Approach”, Paper at the AARES/AAWE Workshop on The
World’s Wine Markets by 2030, Adelaide Convention Centre, 8-9 February.
Berger, N. and K. Anderson (1999), “Consumer and Import Taxes in the World Wine
Market: Australia in International Perspective”, Australasian Agribusiness
Review 7(3), June. http://www.agrifood.info/review/1999/Berger.html
Cnossen, S. (2009), “Excise Taxation in Australia”, Paper presented at a conference
on Australia’s Future Tax System, University of Melbourne, 18-19 June.
Available at www.treasury.gov.au, 18 June.
European Commission (2008), Excise Duty Tables: Part 1: Alcoholic Beverages,
Brussels: European Commission.
Freebairn, J. 2010, “Special Taxation of Wine and Other Alcoholic Beverages”,
Invited Paper for the AARES/AAWE Workshop on The World’s Wine
Markets by 2030, Adelaide Convention Centre, 8-9 February.
OECD (2006), Consumption Tax Trends, Paris: OECD, December.
OECD (2008), Consumption Tax Trends, Paris: OECD, December.
Pogue, T. and L. Sgontz (1989), “Taxing to Control Social Costs: The Case of
Alcohol”, American Economic Review 79(1): 235-43, February.
Wittwer, G. and K. Anderson (2002), “Impact of the GST and Wine Tax Reform on
Australia’s Wine Industry: A CGE Analysis”, Australian Economic Papers
41(1): 69-81, March.
WFA (2010), Pre-Budget Submission 2010-11, Adelaide: Winemakers’ Federation of
Australia, January.
World Bank and UNCTAD (2009), World Integrated Trade Solution (WITS)
Database. Washington DC: World Bank and Geneva: United Nations

9
9
Conference on Trade and Development, available at wits.worldbank.org,
accessed December.
World Health Organization (2009), Strategies to Reduce the Harmful Use of Alcohol:
Draft Global Strategy, report by the Secretariat to the Executive Board’s 126th
Session, EB126/13, Geneva, 3 December.

10
10
Figure 1: Ad valorem consumer tax equivalent of excise plus import taxes on non-premium wine, 2008
(percent)
Source: Table 5.

11
11
Figure 2: Ad valorem consumer tax equivalent of excise plus import taxes on super premium wine, 2008
(percent)
Source: Table 5.
12
12
Table 1: Ad valorem consumer tax equivalent of excise taxes on still wine, beer and spirits, July 2008a
(as a percent of the wholesale pre-tax prices shown in column heads)
Non-premium wine
(A$2.50/litre)
Commercial premium wine (A$7.50/litre)
Super premium
wine (A$20/litre)
Beer (A$2/litre)
Spirits (A$15/litre)
New World net wine exporters Argentina 3 3 3 4 18
Australia 29 29 29 76 171 Canada 26 9 3 1 31 Chile 15 15 15 15 27 New Zealand 85 28 11 42 103 South Africa 10 3 1 0 24 United States 23 8 3 1 31 Unweighted average 27 11 9 10 39
European net wine exporters Austria 0 0 0 20 44
Bulgaria 0 0 0 8 25 France 2 1 0 0 64 Germany 0 0 0 8 57 Greece 0 0 0 11 48 Hungary 0 0 0 21 44 Italy 0 0 0 24 35 Portugal 0 0 0 3 43 Romania 0 0 0 7 30 Slovak Rep 0 0 0 15 41 Slovenia 0 0 0 0 31 Spain 0 0 0 1 37 Switzerland 0 0 0 na 55 Unweighted average 0 0 0 10 43

13
13
Table 1 (continued): Ad valorem consumer tax equivalent of excise taxes on still wine, beer and spirits, July 2008a (as a percent of the wholesale pre-tax prices shown in column heads)
Non-premium wine
(A$2.50/litre)
Commercial premium wine (A$7.50/litre)
Super premium wine
(A$20/litre) Beer
(A$2 /litre) Spirits
(A$15 /litre) High-income country net wine importers
Belgium 31 10 4 17 77 Czech Rep 0 0 0 9 49 Denmark 54 18 7 0 89 Estonia 44 15 5 0 57 Finland 154 51 19 1 143 Iceland 252 84 32 1 26 Ireland 180 60 23 1 173 Japan 32 11 4 0 11 Latvia 28 9 4 0 39 Lithuania 34 11 4 0 49 Luxembourg 0 0 0 8 46 Netherlands 45 15 6 0 66 Norway 253 84 32 0 202 Poland 27 9 3 18 60 Sweden 151 50 19 1 234 UK 162 54 20 1 119 Unweighted average 91 30 11 0 90 Developing country net wine importers Brazil 10 10 10 40 60 Hong Kong 0 0 0 0 100 India 15 5 2 0 1 Korea 33 33 33 94 94 Malaysia 204 68 26 6 26 Mexico 25 25 25 25 50 Philippines 15 5 2 1 25 Taiwan 13 4 2 2 23 Thailand 173 58 22 9 0 Turkey 183 61 23 63 304 Unweighted average 67 27 14 24 68
a Tax rates in italics refer to January 2007. Wine and beer degree alcohol contents are assumed to be 12% and 4%, respectively; the absolute alcohol content for spirits is assumed to be 40%. Source: Author’s compilation based on Appendix Tables 1 and 2 below.
14
14
Table 2: Ad valorem consumer tax equivalent of excise taxes on sparkling wine, 2005, 2007 and 2008a
(as a percent of the wholesale pre-tax prices shown in column heads)
Commercial premium sparkling wine Super premium sparkling wine
(A$ 7.50/litre) (A$25/litre) High-income countries 2005 2007 2008 2005 2007 2008
Australia 29 29 29 29 29 29 Austria 27 0 0 8 0 0 Belgium 31 30 35 9 9 11 Bulgaria 0 0 0 0 0 0 Canada 7 9 na 2 3 na Czech Rep. 27 27 22 8 8 6 Denmark 21 18 27 6 5 8 Estonia na na 15 na na 4 Finland 39 37 51 12 11 15 France 2 2 2 0 0 1 Germany 25 26 30 7 8 9 Greece 0 0 0 0 0 0 Hungary 12 16 11 4 5 3 Iceland 98 82 na 29 25 na Ireland 93 90 120 28 27 36 Italy 0 0 0 0 0 0 Japan 9 11 na 3 3 na Latvia na na 9 na na 3 Lithuania na na 11 na na 3 Luxembourg 0 0 0 0 0 0 Netherlands 37 38 51 11 11 15 New Zealand 28 28 na 8 8 na Norway 78 84 na 23 25 na Poland 6 12 9 2 4 3 Portugal 0 0 0 0 0 0 Romania na na 7 na na 2 Russia 0 0 0 0 0 0 Slovak Rep. 24 23 17 7 7 5 Slovenia 0 0 0 0 0 0 Spain 0 0 0 0 0 0 Sweden 41 40 50 12 12 15 Switzerland 0 0 na 0 0 na Turkey 246 208 na 74 62 na UK 61 57 69 18 17 21 United States 19 19 na 6 6 na
15
15
Table 2 (continued): Ad valorem consumer tax equivalent of excise taxes on sparkling wine, 2005, 2007 and 2008
(as a percent of the wholesale pre-tax prices shown in column heads)
Commercial premium sparkling wine Super premium sparkling wine
(A$ 7.50/litre) (A$25/litre) Developing countries 2005 2007 2008 2005 2007 2008 Brazil
20
20
Chile
15
15 China
0
0
Hong Kong
0
0 India
5
1
Indonesia
Korea 33 33 na 33 33 na Malaysia
193
58
Mexico 25 25 na 25 25 na Philippines
42
13
Singapore
940
282 South Africa
10
3
Taiwan
4
1 Thailand 58 17
a Sparkling wine degree alcohol content is assumed to be 12% Source: Author’s compilation based on Appendix Table 3 below.

16
16
Table 3: Excise taxes on alcoholic beverages per litre of alcohol for still wine, beer and spirits, July 2008a
(A$ at the wholesale pre-tax prices shown in column heads)
Non-premium wine
(A$2.50/litre)
Commercial premium wine (A$7.50/litre)
Super premium
wine (A$20/litre)
Beer (A$2/litre)
Spirits (A$15/litre)
New World net wine exporters Argentina 0.6 1.9 5.0 2.0 6.8
Australia 6.0 18.1 48.3 38.0 64.1 Canada 5.4 5.6 5.0 0.5 11.6 Chile 3.1 9.4 25.0 7.5 10.1 New Zealand 17.7 17.5 18.3 21.0 38.6 South Africa 2.1 1.9 1.7 0.0 9.0 United States 4.8 5.0 5.0 0.5 11.6 Unweighted average 5.7 8.5 15.5 9.9 21.7
European net wine exporters Austria 0.0 0.0 0.0 10.0 16.5
Bulgaria 0.0 0.0 0.0 4.0 9.4 France 0.4 0.6 0.0 0.0 24.0 Germany 0.0 0.0 0.0 4.0 21.4 Greece 0.0 0.0 0.0 5.5 18.0 Hungary 0.0 0.0 0.0 10.5 16.5 Italy 0.0 0.0 0.0 12.0 13.1 Portugal 0.0 0.0 0.0 1.5 16.1 Romania 0.0 0.0 0.0 3.5 11.3 Slovak Rep 0.0 0.0 0.0 7.5 15.4 Slovenia 0.0 0.0 0.0 0.0 11.6 Spain 0.0 0.0 0.0 0.5 13.9 Switzerland 0.0 0.0 0.0 na 20.6 Unweighted average 0.0 0.0 0.0 4.9 16.0

17
17
Table 3 (continued): Excise taxes on alcoholic beverages per litre of alcohol for still wine, beer and spirits, July 2008a
(A$ at the wholesale pre-tax prices shown in column heads)
Non-premium
wine (A$2.50/litre)
Commercial premium
wine (A$7.50/litre)
Super premium
wine (A$20/litre)
Beer (A$2 /litre)
Spirits (A$15 /litre)
High-income country net wine importers
Belgium 6.5 6.3 6.7 8.5 28.9 Czech Rep 0.0 0.0 0.0 4.5 18.4 Denmark 11.3 11.3 11.7 0.0 33.4 Estonia 9.2 9.4 8.3 0.0 21.4 Finland 32.1 31.9 31.7 0.5 53.6 Iceland 52.5 52.5 53.3 0.5 9.8 Ireland 37.5 37.5 38.3 0.5 64.9 Japan 6.7 6.9 6.7 0.0 4.1 Latvia 5.8 5.6 6.7 0.0 14.6 Lithuania 7.1 6.9 6.7 0.0 18.4 Luxembourg 0.0 0.0 0.0 4.0 17.3 Netherlands 9.4 9.4 10.0 0.0 24.8 Norway 52.7 52.5 53.3 0.0 75.8 Poland 5.6 5.6 5.0 9.0 22.5 Sweden 31.5 31.3 31.7 0.5 87.8 UK 33.8 33.8 33.3 0.5 44.6 Unweighted average 18.8 18.8 19.0 1.8 33.8 Developing country net wine importers Brazil 2.1 6.3 16.7 20.0 22.5 Hong Kong 0.0 0.0 0.0 0.0 37.5 India 3.1 3.1 3.3 0.0 0.4 Korea 6.9 20.6 55.0 47.0 35.3 Malaysia 42.5 42.5 43.3 3.0 9.8 Mexico 5.2 15.6 41.7 12.5 18.8 Philippines 3.1 3.1 3.3 0.5 9.4 Taiwan 2.7 2.5 3.3 1.0 8.6 Thailand 36.0 36.3 36.7 4.5 0.0 Turkey 38.1 38.1 38.3 31.5 114.0 Unweighted average 14.0 16.8 24.2 12.0 25.6
a Tax rates in italics refer to January 2007. Wine and beer degree alcohol contents are assumed to be 12% and 4%, respectively; the absolute alcohol content for spirits is assumed to be 40%. Source: Author’s compilation based on Appendix Tables 1, 2, 4 and 5 below.

18
18
Table 4: Ad valorem consumer tax equivalent of import taxes on alcoholic beverages, 2008a
(percent)
Year (if not 2008)
Beer (HS 2203)
Sparkling wine (HS 220410)
Still wine (HS
220421) Spirits
(HS2208) New World net wine exporters
Argentina
13.1 20.0 17.9 13.2 Australia
0.0 2.4 0.7 0.0
Canada
0.0 0.0 0.0 0.0 Chile
1.0 1.3 1.5 1.4
New Zealand
0.0 2.9 0.9 0.5 South Africa
0.1 25.0 25.0 0.0
United States
0.0 0.0 0.0 0.0 Unweighted average
2.0 7.4 6.6 2.2
European net wine exporters Austria
0 0 0 0
Bulgaria
0 0 0 0 France
0 0 0 0
Germany
0 0 0 0 Greece
0 0 0 0
Hungary
0 0 0 0 Italy
0 0 0 0
Portugal
0 0 0 0 Romania
0 0 0 0
Slovak Rep
0 0 0 0 Slovenia
0 0 0 0
Spain
0 0 0 0 Switzerland
0 0 0 0
Unweighted average
0 0 0 0

19
19
Table 4 (continued): Ad valorem consumer tax equivalent of import taxes on alcoholic beverages, 2008 a
(percent)
Year (if not 2008)
Beer (HS 2203)
Sparkling wine (HS 220410)
Still wine (HS
220421) Spirits
(HS2208) High-income country net wine importers
Belgium 0 0 0 0 Czech Rep 0 0 0 0 Denmark 0 0 0 0 Estonia 0 0 0 0 Finland 0 0 0 0 Iceland 1.6 0 0.5 0 Ireland 0 0 0 0 Japan 0 0 0 0.7 Latvia 0 0 0 0 Lithuania 0 0 0 0 Luxembourg 0 0 0 0 Netherlands 0 0 0 0 Norway 0 0 0 0 Poland 0 0 0 0 Sweden 0 0 0 0 UK 0 0 0 0 Unweighted average 0.1 0.0 0.0 0.0 Developing country net wine importers Brazil 9.8 16.9 12.3 16.9 Hong Kong 0.0 0.0 0.0 0.0 India 100.0 150.0 150.0 150.0 Korea 2007 30.0 15.0 13.2 19.9 Malaysia na na na na Mexico 0.7 1.3 3.1 2.2 Philippines 2007 8.7 4.6 6.9 10.3 Taiwan 0.0 20.0 10.0 0.4 Thailand 2006 42.5 54.0 59.2 52.1 Turkey 0.0 50.6 57.2 0.6 Unweighted average 21.3 34.7 34.7 28.0
a The most recent year available, if it is not 2008, is shown in column 1. The conversion from a specific to an ad valorem rate is calculated at the weighted average price of imports by UNCTAD as part of their TRAINS database input into WITS. Source: World Bank and UNCTAD (2009)

20
20
Table 5: Ad valorem consumer tax equivalent of excise plus import taxes on alcoholic beverages, 2008a
(percent)
Non-premium wine (A$2.50/litre)
Commercial premium wine (A$7.50/litre)
Super premium
wine (A$20/litre)
Beer (A$2/litre)
Spirits (A$15/litre)
New World net wine exporters Argentina 21 21 21 17 31
Australia 30 30 30 76 171 Canada 26 9 3 1 31 Chile 17 17 17 16 28 New Zealand 86 29 12 42 103 South Africa 35 28 26 0 24 United States 23 8 3 1 31 Unweighted average 34 20 16 22 60
European net wine exporters Austria 0 0 0 20 44
Bulgaria 0 0 0 8 25 France 2 1 0 0 64 Germany 0 0 0 8 57 Greece 0 0 0 11 48 Hungary 0 0 0 21 44 Italy 0 0 0 24 35 Portugal 0 0 0 3 43 Romania 0 0 0 7 30 Slovak Rep 0 0 0 15 41 Slovenia 0 0 0 0 31 Spain 0 0 0 1 37 Switzerland 0 0 0 0 55 Unweighted average 0 0 0 10 43

21
21
Table 5 (continued): Ad valorem consumer tax equivalent of excise plus import taxes on alcoholic beverages, 2008 a
(percent)
Non-premium
wine (A$2.50/litre)
Commercial premium
wine (A$7.50/litre)
Super premium
wine (A$20/litre)
Beer (A$2 /litre)
Spirits (A$15 /litre)
High-income country net wine importers
Belgium 31 10 4 17 77 Czech Rep 0 0 0 9 49 Denmark 54 18 7 0 89 Estonia 44 15 5 0 57 Finland 154 51 19 1 143 Iceland 252 84 32 3 26 Ireland 180 60 23 1 173 Japan 32 11 4 0 12 Latvia 28 9 4 0 39 Lithuania 34 11 4 0 49 Luxembourg 0 0 0 8 46 Netherlands 45 15 6 0 66 Norway 253 84 32 0 202 Poland 27 9 3 18 60 Sweden 151 50 19 1 234 UK 162 54 20 1 119 Unweighted average 90 30 11 4 90 Developing country net wine importers Brazil 22 22 22 50 77 Hong Kong 0 0 0 0 100 India 165 155 152 100 151 Korea 46 46 46 124 114 Malaysia Mexico 28 28 28 26 52 Philippines 22 12 9 10 35 Taiwan 23 14 12 2 23 Thailand 232 117 81 51 52 Turkey 240 118 80 63 305 Unweighted average 87 57 48 47 101
a The most recent year available for tariffs is used if 2008 is not available, see column 1 of Table 4. It is assumed that the ad valorem tariff is the same for all 3 still wine types. For space reasons, sparkling wine is not shown here. Source: Tables 1 and 4 above.
22
22
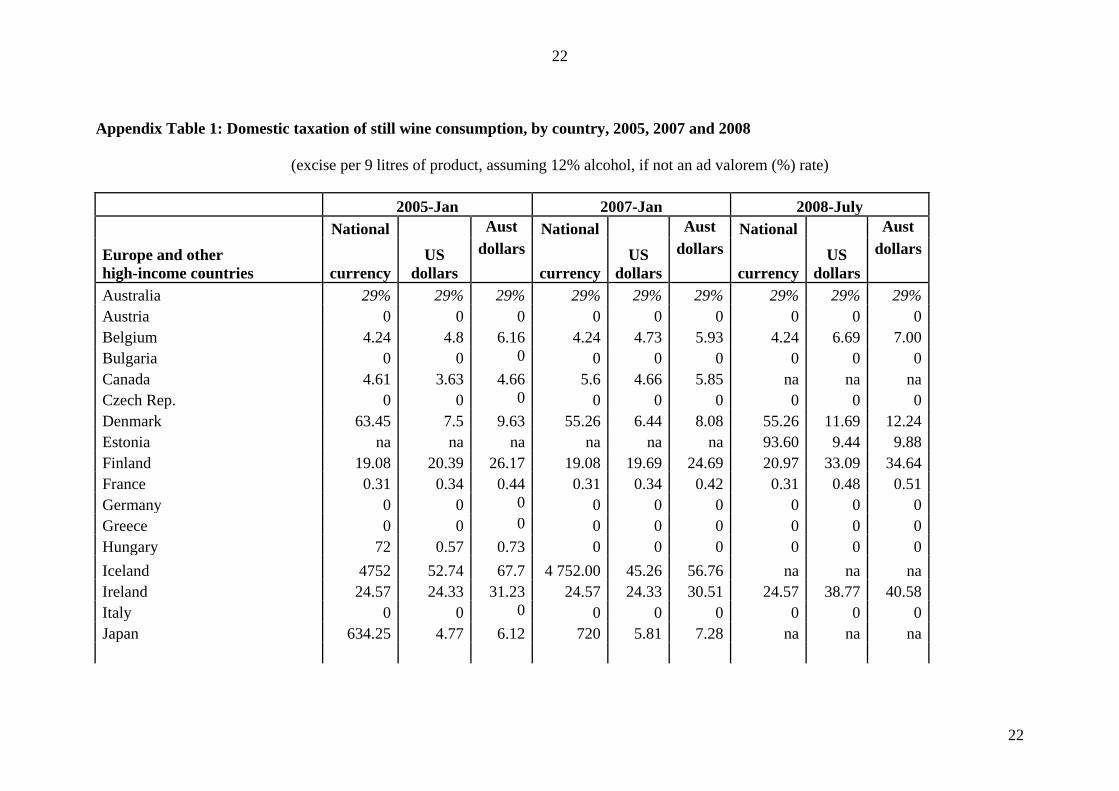
Appendix Table 1: Domestic taxation of still wine consumption, by country, 2005, 2007 and 2008
(excise per 9 litres of product, assuming 12% alcohol, if not an ad valorem (%) rate)
2005-Jan 2007-Jan 2008-July
Europe and other high-income countries
National US
dollars
Aust National US
dollars
Aust National US
dollars
Aust
currency dollars
currency dollars
currency dollars
Australia 29% 29% 29% 29% 29% 29% 29% 29% 29% Austria 0 0 0 0 0 0 0 0 0 Belgium 4.24 4.8 6.16 4.24 4.73 5.93 4.24 6.69 7.00 Bulgaria 0 0 0 0 0 0 0 0 0 Canada 4.61 3.63 4.66 5.6 4.66 5.85 na na na Czech Rep. 0 0 0 0 0 0 0 0 0 Denmark 63.45 7.5 9.63 55.26 6.44 8.08 55.26 11.69 12.24 Estonia na na na na na na 93.60 9.44 9.88 Finland 19.08 20.39 26.17 19.08 19.69 24.69 20.97 33.09 34.64 France 0.31 0.34 0.44 0.31 0.34 0.42 0.31 0.48 0.51 Germany 0 0 0 0 0 0 0 0 0 Greece 0 0 0 0 0 0 0 0 0 Hungary 72 0.57 0.73 0 0 0 0 0 0 Iceland 4752 52.74 67.7 4 752.00 45.26 56.76 na na na Ireland 24.57 24.33 31.23 24.57 24.33 30.51 24.57 38.77 40.58 Italy 0 0 0 0 0 0 0 0 0 Japan 634.25 4.77 6.12 720 5.81 7.28 na na na

23
23
Appendix Table 1 (continued): Domestic taxation of still wine consumption, by country, 2005, 2007 and 2008 Latvia na na na na na na 3.83 6.05 6.33 Lithuania na na na na na na 4.69 7.40 7.75 Luxembourg 0 0 0 0 0 0 0 0 0 Netherlands 5.31 5.78 7.42 5.31 5.93 7.44 6.17 9.73 10.19 New Zealand 20.33 14.53 18.65 21.54 15.19 19.05 na na na Norway 389.88 41.13 52.79 403.92 45.44 56.98 na na na Poland 12.24 2.96 3.8 12.24 6.44 8.08 12.24 5.76 6.03 Portugal 0 0 0 0 0 0 0 0 0 Romania 0 0 0 0 0 0 0 0 0 Russia Slovak Rep. 0 0 0 0 0 0 0 0 0 Slovenia 0 0 0 0 0 0 0 0 0 Spain 0 0 0 0 0 0 0 0 0 Sweden 198.72 21.32 27.37 198.72 21.69 27.21 194.22 32.41 33.93 Switzerland 0 0 0 0 0 0 na na na Turkey 29.52 37.85 48.58 29.52 32.76 41.09 na na na UK 14.71 23.77 30.51 14.71 22.56 28.3 17.49 34.85 36.48 United States 4.14 4.14 5.31 4.14 4.14 5.19 na na na

24
24
Appendix Table 1 (continued): Domestic taxation of still wine consumption, by country, 2005, 2007 and 2008 2005-Jan 2007-Jan 2008-Dec
Developing countries
National US
dollars
Aust National
US dollars
Aust National
US dollars
Aust
currency dollars
currency dollars
currency dollars
Argentina 2.5% 2.5% 2.5% Brazil 10% 10% 10% Chile 15% 15% 15% China 0.00 0.00 0.00 Hong Kong 0% 0% 0% India 108.00 2.13 3.29 Indonesia Korea 33% 33% 33% 33% 33% 33% na na na Malaysia 108.00 29.77 45.93 Mexico 25% 25% 25% 25% 25% 25% na na na Philippines 108.00 2.22 3.42 Singapore 630.00 411.39 634.76 South Africa 15.44 1.50 2.31 Taiwan 63.00 1.89 2.92 Thailand 900.00 25.19 38.86
Sources: OECD, Consumption Tax Trends, Paris: OECD, 2006 and 2008; European Commission, Excise Duty Tables: Part 1: Alcoholic Beverages, Brussels: EC, 2008; http://www.bir.gov.ph/taxcode/2041.htm; http://www.kerala.gov.in/dept_excise/rates_duties.htm ; www.mof.gov.sg/budget_2008/speech_p4/annexb-5.pdf; http://www.excise.go.th/tax/eng-totaltax.html#e1; http://www.customs.gov.my/index.php?option=com_docman&task=cat_view&gid=33&Itemid=191; http://www.customs.gov.my/

25
25
http://www.customs.gov.hk/eng/major_dutiable_freeport_e.html ; http://www.sars.gov.za/home.asp?pid=4139; http://china-customs.com/customs-tax/22/; http://www.receita.fazenda.gov.br/aliquotas/DownloadArqTIPI.htm; www.sii.cl; Administracion federal Ingresos Publicos(AFIP)

26
26
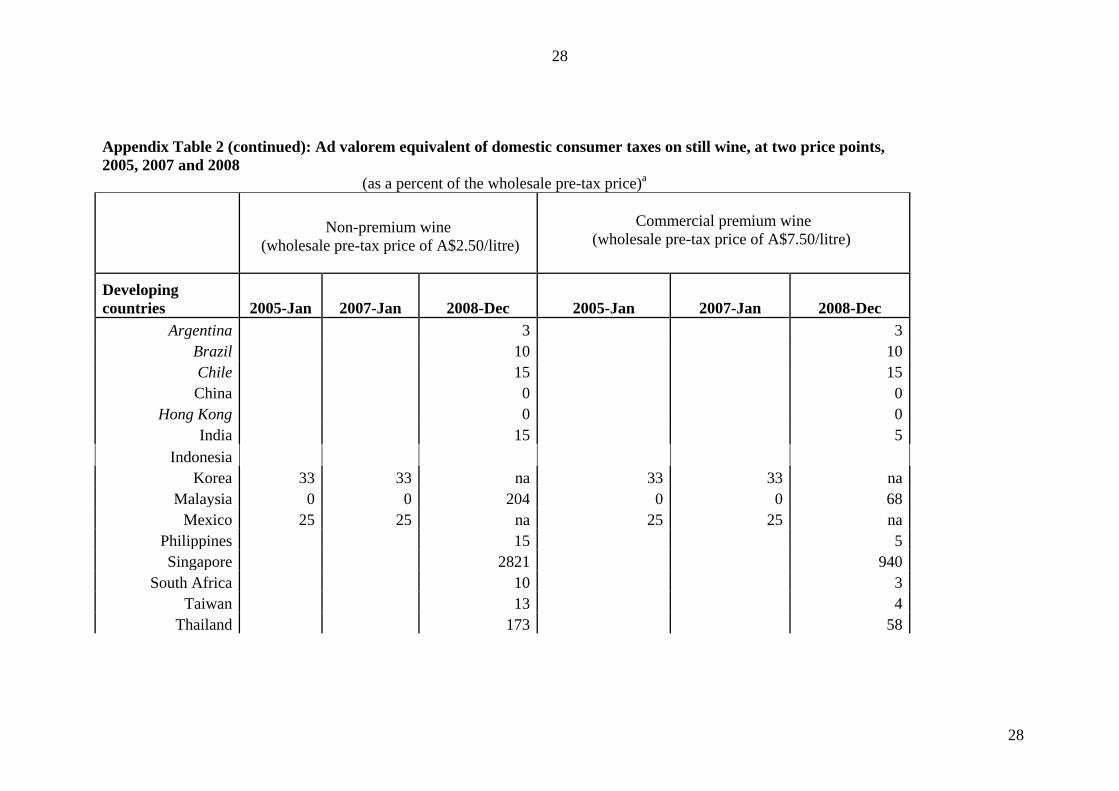
Appendix Table 2: Ad valorem equivalent of domestic consumer taxes on still wine, at two price points, 2005, 2007 and 2008 (as a percent of the wholesale pre-tax price)a
Non-premium wine (wholesale pre-tax price of A$2.50/litre)
Commercial premium wine
(wholesale pre-tax price of A$7.50/litre)
Europe and other high-income countries 2005-Jan 2007-Jan 2008-Jul 2005-Jan 2007-Jan 2008-Jul
Australia 29 29 29 29 29 29 Austria 0 0 0 0 0 0
Belgium 27 26 31 9 9 10 Bulgaria 0 0 0 0 0 0 Canada 21 26 na 7 9 na
Czech Rep. 0 0 0 0 0 0 Denmark 43 36 54 14 12 18
Estonia na na 44 na na 15 Finland 116 110 154 39 37 51 France 2 2 2 1 1 1
Germany 0 0 0 0 0 0 Greece 0 0 0 0 0 0
Hungary 3 0 0 1 0 0 Iceland 301 252 na 100 84 na Ireland 139 136 180 46 45 60
Italy 0 0 0 0 0 0 Japan 27 32 na 9 11 na
Latvia na na 28 na na 9

27
27
Appendix Table 2 (continued): Ad valorem equivalent of domestic consumer taxes on still wine, at two price points, 2005, 2007 and 2008
(as a percent of the wholesale pre-tax price)a
Lithuania na na 34 na na 11 Luxembourg 0 0 0 0 0 0 Netherlands 33 33 45 11 11 15
New Zealand 83 85 na 28 28 na Norway 235 253 na 78 84 na Poland 17 36 27 6 12 9
Portugal 0 0 0 0 0 0 Romania 0 0 0 0 0 0
Russia 0 0 0 0 0 0 Slovak Rep. 0 0 0 0 0 0
Slovenia 0 0 0 0 0 0 Spain 0 0 0 0 0 0
Sweden 122 121 151 41 40 50 Switzerland 0 0 na 0 0 na
Turkey 216 183 na 72 61 na UK 136 126 162 45 42 54
United States 24 23 na 8 8 na
28
28
Appendix Table 2 (continued): Ad valorem equivalent of domestic consumer taxes on still wine, at two price points, 2005, 2007 and 2008
(as a percent of the wholesale pre-tax price)a
Non-premium wine (wholesale pre-tax price of A$2.50/litre)
Commercial premium wine
(wholesale pre-tax price of A$7.50/litre)
Developing countries 2005-Jan 2007-Jan 2008-Dec 2005-Jan 2007-Jan 2008-Dec
Argentina 3 3 Brazil 10 10 Chile 15 15 China 0 0
Hong Kong 0 0 India 15 5
Indonesia Korea 33 33 na 33 33 na
Malaysia 0 0 204 0 0 68 Mexico 25 25 na 25 25 na
Philippines 15 5 Singapore 2821 940
South Africa 10 3 Taiwan 13 4
Thailand 173 58

29
29
a $2.50/litre wholesale in Australia with a 29% excise tax (WET), a 33% mark-up to retail and 10% GST implies a retail price of $18/90 for a 4-litre cask; $7.50 (or $20)/litre wholesale in Australia with a 29% excise tax (WET), a 50% mark-up to retail and 10% GST implies a retail price of $12 (or $31.90) for a 750ml bottle. Source: Author’s calculation based on Table 1.

30
30
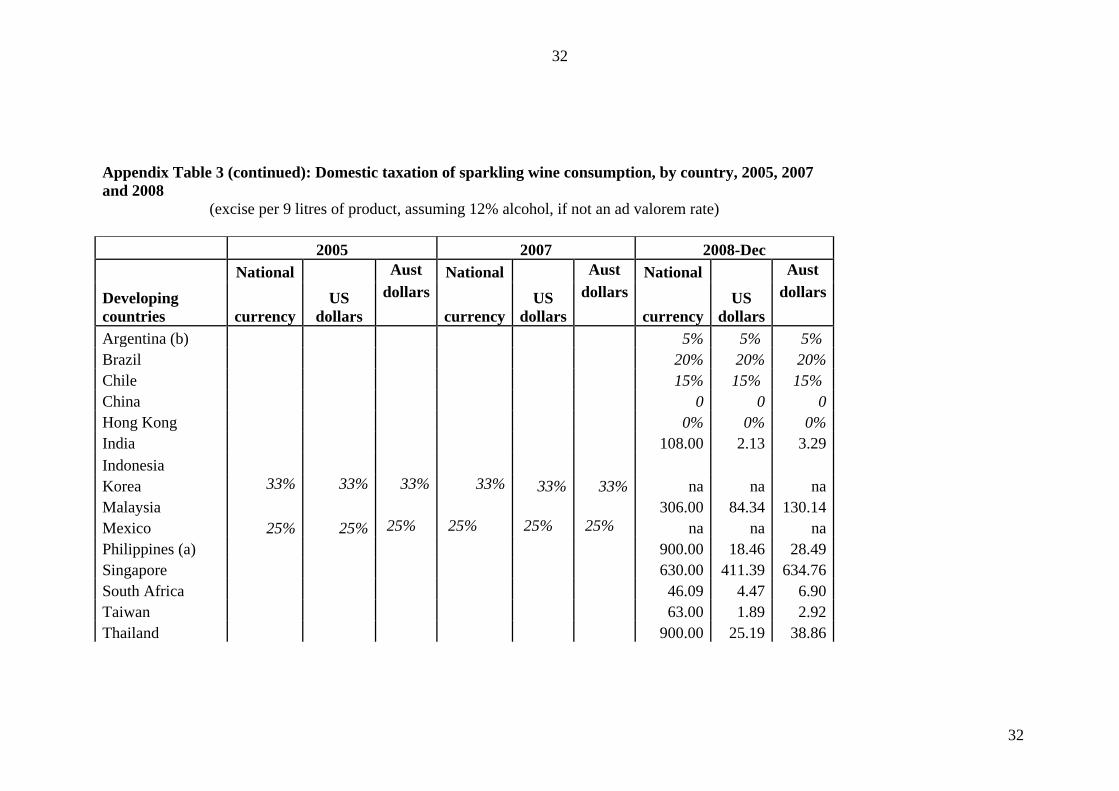
Appendix Table 3: Domestic taxation of sparkling wine consumption, by country, 2005, 2007 and 2008 (excise per 9 litres of product, assuming 12% alcohol, if not an ad valorem rate)
2005 2007 2008-July
EU and Other HIC
National US
dollars
Aust National US
dollars
Aust National US
dollars
Aust
currency dollars
currency dollars
currency dollars
Australia 29% 29% 29% 29% 29% 29% 29% 29% 29% Austria 12.96 14.27 18.32 0 0 0 0 0 0 Belgium 14.50 16.42 21.08 14.50 16.19 20.30 14.50 22.88 23.95 Bulgaria 0 0 0 0 0 0 0 0 0 Canada 4.61 3.63 4.66 5.60 4.67 5.85 na na na Czech Rep. 210.60 14.42 18.52 210.60 14.73 18.47 210.60 13.96 14.61 Denmark 94.95 11.22 14.41 82.80 9.65 12.10 82.80 17.52 18.34 Estonia na na na na na na 93.60 9.44 9.88 Finland 19.08 20.39 26.17 19.08 19.69 24.69 20.97 33.09 34.64 France 0.76 0.84 1.08 0.76 0.83 1.04 0.76 1.19 1.25 Germany 12.24 13.03 16.73 12.24 13.88 17.40 12.24 19.31 20.22 Greece 0 0 0 0 0 0 0 0 0 Hungary 820.80 6.51 8.36 1099.80 8.46 10.61 1098.00 7.35 7.69 Iceland 4633.20 51.42 66.01 4633.20 44.13 55.34 na na na Ireland 49.14 48.65 62.46 49.14 48.65 61.02 49.14 77.54 81.17 Italy 0 0 0 0 0 0 0 0 0 Japan 634.25 4.77 6.12 720.00 5.81 7.28 na na na Latvia na na na na na na 3.83 6.05 6.33 Lithuania na na na na na na 4.69 7.40 7.75

31
31
Appendix Table 3 (continued): Domestic taxation of sparkling wine consumption, by country, 2005, 2007 and 2008
(excise per 9 litres of product, assuming 12% alcohol, if not an ad valorem rate) Luxembourg 0 0 0 0 0 0 0 0 0 Netherlands 18.11 19.71 25.30 18.11 20.24 25.38 21.03 33.19 34.74 New Zealand 20.33 14.53 18.65 21.54 15.19 19.05 na na na Norway 389.88 41.13 52.79 403.92 45.44 56.98 na na na Poland 12.24 2.96 3.80 12.24 6.44 8.08 12.24 5.76 6.03 Portugal 0 0 0 0 0 0 0 0 0 Romania na na na na na na 10.29 4.45 4.66 Russia Slovak Rep. 216.00 12.56 16.12 216.00 12.49 15.66 216.00 11.26 11.79 Slovenia 0 0 0 0 0 0 0 0 0 Spain 0 0 0 0 0 0 0 0 0 Sweden 198.72 21.32 27.37 198.72 21.69 27.21 194.22 32.41 33.93 Switzerland 0 0 0 0 0 0 na na na Turkey 100.91 129.37 166.07 100.91 112.00 140.45 na na na UK 19.85 32.07 41.16 19.85 30.44 38.18 22.40 44.63 46.72 United States 10.17 10.17 13.06 10.17 10.17 12.75 na na na
32
32
Appendix Table 3 (continued): Domestic taxation of sparkling wine consumption, by country, 2005, 2007 and 2008
(excise per 9 litres of product, assuming 12% alcohol, if not an ad valorem rate) 2005 2007 2008-Dec
Developing countries
National US
dollars
Aust National US
dollars
Aust National US
dollars
Aust
currency dollars
currency dollars
currency dollars
Argentina (b) 5% 5% 5% Brazil 20% 20% 20% Chile 15% 15% 15% China 0 0 0 Hong Kong 0% 0% 0% India 108.00 2.13 3.29 Indonesia Korea 33% 33% 33% 33% 33% 33% na na na Malaysia 306.00 84.34 130.14 Mexico 25% 25% 25% 25% 25% 25% na na na Philippines (a) 900.00 18.46 28.49 Singapore 630.00 411.39 634.76 South Africa 46.09 4.47 6.90 Taiwan 63.00 1.89 2.92 Thailand 900.00 25.19 38.86

33
33
Sources: OECD, Consumption Tax Trends, Paris: OECD, 2006 and 2008; European Commission, Excise Duty Tables: Part 1: Alcoholic Beverages, Brussels: EC, 2008; http://www.bir.gov.ph/taxcode/2041.htm; http://www.kerala.gov.in/dept_excise/rates_duties.htm ; www.mof.gov.sg/budget_2008/speech_p4/annexb-5.pdf; http://www.excise.go.th/tax/eng-totaltax.html#e1; http://www.customs.gov.my/index.php?option=com_docman&task=cat_view&gid=33&Itemid=191; http://www.customs.gov.my/; http://www.customs.gov.hk/eng/major_dutiable_freeport_e.html ; http://www.sars.gov.za/home.asp?pid=4139; http://china-customs.com/customs-tax/22/; http://www.receita.fazenda.gov.br/aliquotas/DownloadArqTIPI.htm; www.sii.cl; Administracion federal Ingresos Publicos(AFIP) Notes: (a) Tax for a bottle worth of more than 500 pesos is 300 pesos.

34
34
Appendix Table 4: Domestic taxation of regular-strength beer consumption, by country, 2005, 2007 and 2008 (excise per hectolitre per degree alcohol, if not an ad valorem (%) rate)
2005 2007 2008 -July EU and other high-income countries
National US
dollars
Aust National US
dollars
Aust National US
dollars
Aust
currency dollars
currency dollars
currency dollars
Australia 3553 2768 3553 3790 3021 3790 na na na Austriaf Belgiumf Bulgaria na na na na na na Canada 28 22 28 31 26 33 na na na Czech Rep.h Denmark 58 7 9 51 6 7 51 11 11 Estonia na na na na na na 77 8 8 Finland 19 21 27 19 20 25 21 34 35 France 3 3 4 3 3 4 3 4 4 Germanye Greecee Hungaryg Iceland 5870 65 84 5870 56 70 na na na Ireland 20 20 25 20 20 25 20 31 33 Italyf Japana 888 9 11 880 7 9 na na na Latvia na na na na na na 2 3 3

35
35
Appendix Table 4 (continued): Domestic taxation of regular-strength beer consumption, by country, 2005, 2007 and 2008
(excise per hectolitre per degree alcohol, if not an ad valorem (%) rate) Lithuania na na na na na na 2 4 4 Luxembourge Netherlands 0.92 1 2 1 1 2 New Zealand 2259 1615 2073 2394 1688 2118 na na na Norwaya 65 11 14 67 11 13 na na na Polandc Portugala 75 101 130 79 104 131 Romania na na na na na na Russia Slovak Rep.d Slovenia na na na na na na 7 11 11 Spaina 34 46 59 40 53 66 Sweden 147 16 20 147 16 20 166 28 29 Switzerlandb Turkey 63.3% 63.3% 63.3% 63.3% 63.3% 63.3% na na na UK 13 20 26 13 19 24 15 30 31 United States 21 21 27 21 21 26 na na na

36
36
Appendix Table 4 (continued): Domestic taxation of regular-strength beer consumption, by country, 2005, 2007 and 2008
(excise per hectolitre per degree alcohol, if not an ad valorem (%) rate)
2005 2007 2008 -Dec
Developing countries
National US dollars
Aust National US dollars
Aust National US dollars
Aust currency dollars currency dollars currency dollars
Argentina 4% 4% 4% Brazil 40% 40% 40% Chile 15% 15% 15% China 0 0 0 Hong Kong 0% 0% 0% India 200 3.952 6.09782 Indonesia Korea 117% 117% 117% 93.60% 93.60% 93.60% na na na Malaysia 740 203.963 314.709 Mexico 25% 25% 25% 25% 25% 25% na na na Philippines (a) 1215 24.9234 38.4562 Singapore 4800 3134.39 4836.28 South Africa 7.82 0.7584 1.17018 Taiwan 2600 77.9844 120.328 Thailand 10000 279.838 431.782
a Assuming 4% alcohol b SF24 per degree Plato (=US$13.98 in 2005, US$1.24 in 2007) c PLN7 per degree Plato (=US$1.66 in 2005, US$3.61 in 2007, US$ 3.23 in 2008) d SKK50 per degree Plato (=US$2.91 in 2005, US$2.89 in 2007, US$ 2.61 in 2008)
37
37
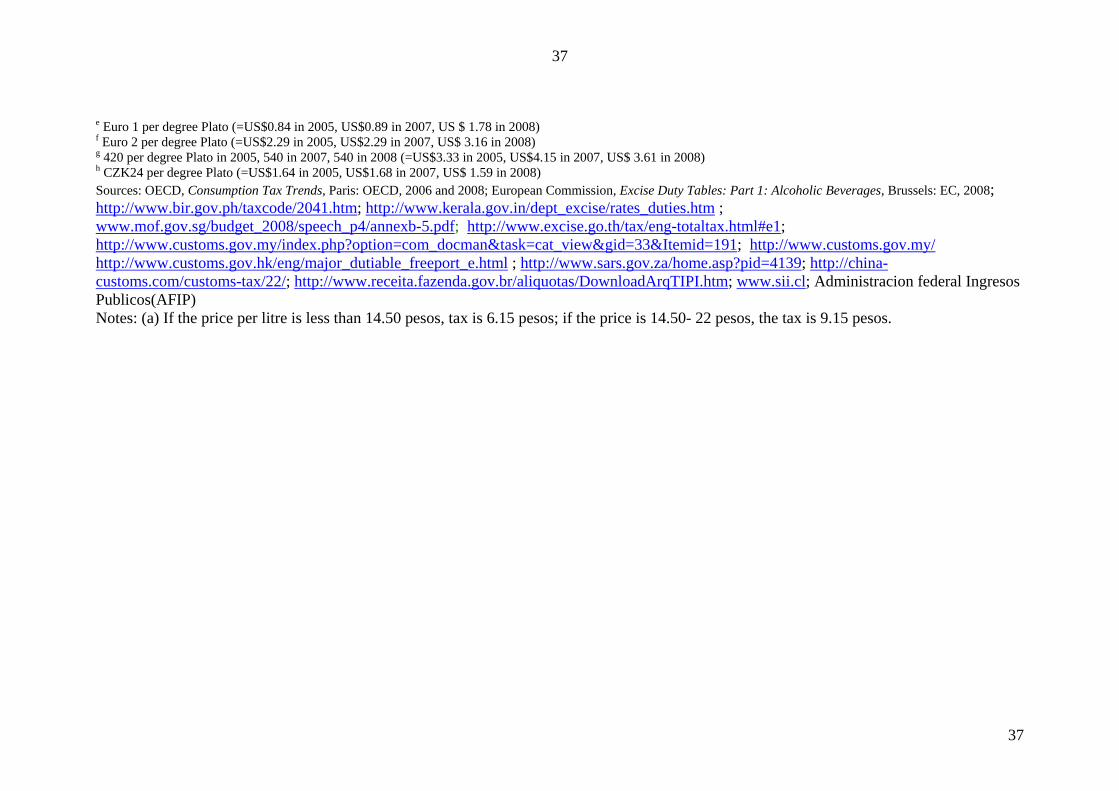
e Euro 1 per degree Plato (=US$0.84 in 2005, US$0.89 in 2007, US $ 1.78 in 2008) f Euro 2 per degree Plato (=US$2.29 in 2005, US$2.29 in 2007, US$ 3.16 in 2008) g 420 per degree Plato in 2005, 540 in 2007, 540 in 2008 (=US$3.33 in 2005, US$4.15 in 2007, US$ 3.61 in 2008) h CZK24 per degree Plato (=US$1.64 in 2005, US$1.68 in 2007, US$ 1.59 in 2008) Sources: OECD, Consumption Tax Trends, Paris: OECD, 2006 and 2008; European Commission, Excise Duty Tables: Part 1: Alcoholic Beverages, Brussels: EC, 2008; http://www.bir.gov.ph/taxcode/2041.htm; http://www.kerala.gov.in/dept_excise/rates_duties.htm ; www.mof.gov.sg/budget_2008/speech_p4/annexb-5.pdf; http://www.excise.go.th/tax/eng-totaltax.html#e1; http://www.customs.gov.my/index.php?option=com_docman&task=cat_view&gid=33&Itemid=191; http://www.customs.gov.my/ http://www.customs.gov.hk/eng/major_dutiable_freeport_e.html ; http://www.sars.gov.za/home.asp?pid=4139; http://china-customs.com/customs-tax/22/; http://www.receita.fazenda.gov.br/aliquotas/DownloadArqTIPI.htm; www.sii.cl; Administracion federal Ingresos Publicos(AFIP) Notes: (a) If the price per litre is less than 14.50 pesos, tax is 6.15 pesos; if the price is 14.50- 22 pesos, the tax is 9.15 pesos.

38
38
Appendix Table 5: Domestic taxation of alcoholic spirits consumption, 2005, 2007 and 2008 (excise per hectolitre of absolute alcohol, if not an ad valorem (%) rate)
2005 2007 2008-July
EU and other high-income countries
National US
dollars
Aust National US
dollars
Aust National US
dollars
Aust
currency dollars
currency dollars
currency dollars
Australia 6020 4690 6020 6421 5120 6421 na na na Austria 1000 1101 1414 1000 1101 1381 1000 1578 1652 Belgium 1661 1881 2415 1660 1880 2358 1752 2765 2894 Bulgaria na na na na na na 1100 887 929 Canada 1107 871 1119 1170 921 1155 na na na Czech Rep. 26500 1815 2330 26500 1815 2276 26500 1756 1838 Denmark 15000 1773 2276 15000 1773 2224 15000 3174 3322 Estonia na na na na na na 20200 2037 2132 Finland 2825 3018 3874 2825 3018 3785 3250 5128 5368 France 1450 1617 2075 1450 1616 2027 1450 2288 2395 Germany 1303 1388 1781 1303 1388 1740 1303 2056 2152 Greece 908 1303 1672 1090 1564 1961 1090 1720 1800 Hungary 192000 1524 1956 236000 1873 2349 236000 1579 1653 Iceland 70780 786 1008 70780 786 985 na na na Ireland 3925 3886 4989 3925 3886 4874 3925 6193 6483 Italy 731 871 1118 800 954 1196 800 1262 1321 Japan 40900a 398 511 40900a 342 429 na na na Latvia na na na na na na 895 1412 1478 Lithuania na na na na na na 1112 1755 1837

39
39
Appendix Table 5 (continued): Domestic taxation of alcoholic spirits consumption, 2005, 2007 and 2008 (excise per hectolitre of absolute alcohol, if not an ad valorem (%) rate)
Luxembourg 1041 1058 1358 1041 1058 1327 1041 1643 1720 Netherlands 1775 1931 2479 1504 1637 2052 1504 2373 2484 New Zealand 4115 2941 3776 4359 3074 3855 na na na Norway 55400 5844 7502 57400 6055 7593 na na na Poland 4550 1099 1411 4550 1099 1378 4550 2141 2241 Portugal 916 501 643 957 523 656 977 1541 1614 Romania na na na na na na 2517 1090 1141 Russia 150% 150% 150% Slovak Rep. 25000 1453 1866 28300 1645 2063 28300 1475 1544 Slovenia na na na na na na 695 1096 1148 Spain 755 983 1262 830 1081 1356 830 1310 1371 Sweden 50141 5380 6906 50141 5380 6747 50141 8368 8759 Switzerland 2900 1638 2103 2900 1638 2055 na na na Turkey 7093 9093 11673 7093 9093 11403 na na na UK 1956 3160 4056 1956 3160 3963 2135 4255 4454 United States 923 923 1185 923 923 1158 na na na

40
40
Appendix Table 5 (continued): Domestic taxation of alcoholic spirits consumption, 2005, 2007 and 2008
(excise per hectolitre of absolute alcohol, if not an ad valorem (%) rate) 2005 2007 2008-Dec
Developing countries
National currency
US dollars
Aust dollars
National currency
US dollars
Aust dollars
National currency
US dollars
Aust dollars
Argentina (b) 18% 18% 18% Brazil 60% 60% 60% Chile 27% 27% 27% China 0 0 0 Hong Kong 100% 100% 100% India 1550 31 47 Indonesia Korea 93.60% 93.60% 93.60% 93.60% 93.6% 93.6% na na na Malaysia 2250 620 957 Mexico 50% 50% 50% 50% 50% 50% na na na Philippines (a) 30000 615 950 Singapore 7000 4571 7053 South Africa 6101 592 913 Taiwan 18500 555 856 Thailand 100 3 4
a For whisky and brandy (40% vol.), otherwise Y36,719 for 37% vol. (spirits) or 24810 for 25% vol. (shochu)

41
41
Sources: OECD, Consumption Tax Trends, Paris: OECD, 2006 and 2008; European Commission, Excise Duty Tables: Part 1: Alcoholic Beverages, Brussels: EC, 2008; http://www.bir.gov.ph/taxcode/2041.htm; http://www.kerala.gov.in/dept_excise/rates_duties.htm ; www.mof.gov.sg/budget_2008/speech_p4/annexb-5.pdf; http://www.excise.go.th/tax/eng-totaltax.html#e1; http://www.customs.gov.my/index.php?option=com_docman&task=cat_view&gid=33&Itemid=191; http://www.customs.gov.my/ http://www.customs.gov.hk/eng/major_dutiable_freeport_e.html ; http://www.sars.gov.za/home.asp?pid=4139; http://china-customs.com/customs-tax/22/; http://www.receita.fazenda.gov.br/aliquotas/DownloadArqTIPI.htm; www.sii.cl; Administracion federal Ingresos Publicos(AFIP) Notes: (a) Tax for a bottle worth of less than 250 pesos is 75 pesos; a bottle worth of 250-675 pesos is 150 pesos.
(b) For whisky, 30%

42
42
Appendix Table 6: Ad valorem import taxes on alcoholic beverages, by country, 2008
(percent)
Beer (2203)
Sparkling wine
(220410)
Still wine, <2l bottles (220421)
Still wine, bulk
(220429) Spirits (2208)
European Union 0.0 4.5 3.9 15.5 0.0 Switzerland 0.4 8.5 25.5 60.4 4.2 Other Western Europe 0.3 0.0 0.0 0.0 0.0 Azerbaijan 0.0 0.0 0.0 227.9 7.2 Bulgaria 31.6 14.6 17.9 37.8 22.3 Croatia 0.0 17.9 18.5 21.9 0.1 Georgia 7.9 0.0 0.0 0.0 0.0 Moldova 0.0 0.5 1.0 4.2 0.1 Russia 0.0 17.9 17.2 16.8 0.0 Ukraine 0.0 0.0 0.0 0.0 0.0 Uzbekistan 0.0 30.0 0.0 n.a. 0.0 Other C/East Europe 2.0 22.4 1.9 14.2 8.7 Australia 0.0 2.4 0.7 0.5 n.a. New Zealand 0.0 2.9 0.9 1.6 0.5 United States 0.0 0.0 0.0 0.0 0.0 Canada 0.0 0.0 0.0 0.0 0.0 Argentina 13.1 20.0 17.9 20.0 13.2 Brazil 9.8 16.9 12.3 17.7 16.9 Chile 1.0 1.3 1.5 2.0 1.4 Mexico 0.7 1.3 3.1 2.7 2.2 Uruguay 1.7 6.7 2.7 19.1 10.9 Other Latin America 14.3 20.3 13.1 31.2 23.4 South Africa 0.1 25.0 25.0 25.0 0.0 Turkey 0.0 50.6 57.2 50.0 0.6 North Africa 30.4 20.5 21.4 47.9 0.2 Other Africa 18.4 26.5 25.8 16.2 21.1 Middle East 50.1 76.9 47.0 69.1 49.0 China 0.0 14.0 13.8 16.3 10.0 Japan 0.0 0.0 0.0 0.0 0.7 Other North East Asia 30.0 15.0 13.2 13.9 19.9 Other South East Asia 9.0 12.1 15.4 34.7 32.8 South Asia (and other Asia Pacific) 62.9 62.3 56.5 66.7 50.5 World 20.4 5.8 3.8 8.1 4.9
Source: World Bank and UNCTAD (2009)

43
43
Appendix Table 7: Value added tax rate, by country, 2005, 2007 and 2008 (percent)
EU and other high-income countries 2005
2007 2008 Australia 10 10 10 Austria 20 20 20 Belgium 21 21 21 Bulgaria na na 20 Canada 7 or 15 6 or 14 na Czech Rep. 19 19 19 Denmark 25 25 25 Estonia na na 18 Finland 22 22 22 France 20 20 20 Germany 16 19 19 Greece 18 19 19 Hungary 25 20 20 Iceland 25 25 na Ireland 21 21 21 Italy 20 20 20 Japan 5 5 na Latvia na na 18 Lithuania na na 18 Luxembourg 15 15 15 Netherlands 19 19 19 New Zealand 13 13 na Norway 25 25 na Poland 22 22 22 Portugal 19 21 21 Romania na na 19 Slovak Rep. 19 19 19 Slovenia na na 20 Spain 16 16 16 Sweden 25 25 25 Switzerland 8 8 na Turkey 18 18 na UK 18 18 18 United States 0 0 0
Sources: OECD, Consumption Tax Trends, Paris: OECD, 2006 and 2008; European Commission, Excise Duty Tables: Part 1: Alcoholic Beverages, Brussels: EC, 2008

44
44
Appendix Table 7 (continued): Value added tax rate, by country, 2005, 2007 and 2008
(percent)
Developing countries 2008 Argentina (b) 21 Brazil 12 Chile 19 China 17 Hong Kong na India 12.5 Indonesia 10 Korea 10 Malaysia 5 Mexico 15 Philippines (a) 12 Singapore 7 South Africa 14 Taiwan na Thailand 7
Source: http://en.wikipedia.org/wiki/Value_added_tax#Non-EU_countries

45
45
Appendix Table 8: Foreign exchange rates, by country, 2005, 2007 and 2008 (US $ per national currency)
Jan. 2005 Jan. 2007
2008-July 2008-Dec
Australia 0.779 0.797 0.955 0.648 Argentina 0.296 Austria 1.348 1.317 1.578 Belgium 1.348 1.317 1.578 Bulgaria 0.807 Brazil 0.423 Canada 0.826 0.855 China 0.145 Chile 0.001 Czech Rep. 0.044 0.048 0.066 Denmark 0.181 0.177 0.212 Estonia 0.101 Finland 1.348 1.317 1.578 France 1.348 1.317 1.578 Hong Kong 0.129 Germany 1.348 1.317 1.578 Greece 1.348 1.317 1.578 Hungary 0.005 0.005 0.007 Iceland 0.016 0.014 India 0.020 Indonesia 0.000 Ireland 1.348 1.317 1.578 Italy 1.348 1.317 1.578 Japan 0.01 0.008 Korea 0.001 0.001 Latvia 1.578 Lithuania 1.578 Luxembourg 1.348 1.317 1.578 Malaysia 0.276 Mexico 0.089 0.093 Netherlands 1.348 1.317 1.578 New Zealand 0.715 0.705
Norway 0.164 0.16 Philippines 0.021 Poland 0.331 0.344 0.470 Portugal 1.348 1.317 1.578 Romania 0.433

46
46
Appendix Table 8: Foreign exchange rates, by country, 2005, 2007 and 2008
(US $ per national currency) Jan. 2005 Jan. 2007 2008-July 2008-Dec Singapore 0.653 Slovenia 1.578 Slovak Rep. 0.035 0.038 0.052 South Africa 0.097 Spain 1.348 1.317 1.578 Sweden 0.150 0.146 0.167 Switzerland 0.872 0.815 Thailand 0.028 Taiwan 0.030 Turkey 0.742 0.709 UK 1.906 1.950 1.993 US 1.000 1.0000 1.000 1.000
Source: www.xe.com