exciton-phonon luminescence of perfect and doped ... · index s numerates all the states of a local...
TRANSCRIPT

Dow
nloa
ded
By:
[HE
AL-
Link
Con
sorti
um] A
t: 15
:59
14 J
anua
ry 2
008
Mol. Cryst. Liq. Cryst., 1980, Vol. 57, pp. 65-88
@ 1980 Gordon and Breach Science Publishers, Inc. Printed in U.S.A.
0026-894 1 /80/.5701-0065$04.50/0
Exciton-Phonon Luminescence of Perfect and Doped Naphthalene Crystals K. P. MELETOV and E. F. SHEKA
Institute of Solid State Physics. Academy of Sciences of the U.S.S.R., Chernogofovka 142432, U.S.S.R.
and
E. I. RASHBA
L. D. Landau Institute for Theoretical Physics, Academy of Sciences of the U.S.S.R., Chernogolovka 142432, U.S.S.R.
The structure of phonon side bands in luminescence spectra of local excitons is investigated both theoretically and experimentally. A gradual transition from a spectrum behaviour peculiar for deep impurity centers (with wide phonon side band) to that peculiar for low temperature intrinsic luminescence (the side band becomes split into several bands corresponding to long wave lattice phonons) is investigated depending on the local exciton level depth. Experimental investigations of deuteronaphthalene solutions are presented.
1. INTRODUCTION
There is a qualitative difference between the low temperature one-phonon luminescence spectra from the impurity levels and from the exciton states.' For the intrinsic one-phonon luminescence from exciton states the momen- tum of the emitted phonon actually coincides, due to momentum conserva- tion, with the initial momentum of the exciton. For instance, if the bottom of exciton band is at k = 0, the momenta of the phonons emitted are q N Ji;zT < n/d, that is, of the order of magnitude of the exciton thermal momentum and much less than the Briliouin one; here m is the exciton effective mass, d is the lattice constant. Therefore in the one-phonon side bands of intrinsic luminescence spectra the pronounced structure corresponding to separation of long-wave phonon groups dominates. The picture is changed completely
65

Dow
nloa
ded
By:
[HE
AL-
Link
Con
sorti
um] A
t: 15
:59
14 J
anua
ry 2
008
66 K. P. MELETOV, E. F. SHEKA, AND E. I . RASHBA
when going to the vibronic region. The vibronic luminescence side bands correspond to the transitions with simultaneous emission of two phonons : internal (intramolecular) and external (lattice) ones. In these transitions only the total phonon momentum q = q1 + q2 is conserved, thus momenta q1 and qz separately can be large (of the order n/d). Therefore, the phonons from the whole Brillouin band participate in the luminescence. Consequently, the structure is smeared, the spectra become much more diffuse.
In the impurity spectra the wide range of phonon momenta contributes into one-phonon luminescence due to the non-conservation of total momen- tum. If the radius of the electron center is of the order of d, this range covers, actually, the whole Brillouin zone. To a large extent, these spectra resemble the intrinsic vibronic phonon side bands. The structure has the scale of the phonon band width and is related to separate peaks in the external phonons density of states. Naturally, the one-phonon side bands differs from the phonon density-of-state function due to the dependence of exciton-phonon coupling on the phonon momentum and the number of phonon branch. In this sense, the notion of “weighed” density of states is used.
In the present work both the intrinsic and extrinsic luminescence of naphthalene crystals is investigated. The impurity centers of small and large radii are considered. In the latter case, the structure of one-phonon side bands is investigated both theoretically and experimentally as a function of the center radius. In these spectra a continuous transition from the spectrum behaviour typical of luminescence of small radius centers to that typical of intrinsic one-phonon luminescence was observed for the first time. Most of the measurements were done with naphthalene isotopic solutions ; the centers radii were changed by the isotopic shift of electron levels.
It is shown that the phonon contribution from different regions of q-space may be significantly changed by the variation of electronic level isotopic shift. It is, therefore, to be hoped that a quantitative analysis of these spectra will prove effective in the determination of the constants of exciton-phonon coupling.
2. LOCAL EXCITON ONE-PHONON LUMINESCENCE
Theory
Consider one-phonon luminescence from the local exciton states. Depending on the depth of local exciton level, the extension of its wave function tyi can substantially be varied. For deep levels, it is practically restricted by the guest molecule, for shallow ones it is extended over an essential region of the host crystal. For simplicity, we restrict ourselves to the case of an isotopic molecule and temperature T = 0.
Dow
nloa
ded
By:
[HE
AL-
Link
Con
sorti
um] A
t: 15
:59
14 J
anua
ry 2
008
EXCITON-PHONON LUMINESCENCE 61
Aiming to consider one-phonon side bands and assuming exciton phonon coupling to be weak, we shall write a standard expression for the ground state wave function of a local exciton in the first order in exciton-phonon inter- tion Hex-ph :
Index s numerates all the states of a local exciton: s = i corresponds to its ground state (a discrete level), and s # i to excited states (a continuous spectrum). In what follows we shall use designations wi = li) for the wave function of the ground state. Frequency n(vq) corresponds to the phonon of the vth branch with the wave vector q. Summation over the whole spectrum of the local exciton in (1) makes it impossible to carry out a straightforward calculation of Y i thus complicating the problem. Nevertheless, the final results for the transition intensities can be obtained in an explicit form.
The operator of the crystal-light interaction is
H l K N"'{? (ejJa(p0) + Herm. Conj. ; I here e is the light polarization vector, j, is the current matrix element for the transition to the pth exciton band, N is the number of unit cells in the basic region, a(pk) are exciton annihilation operators.
A matrix element of an optical transition from the state (i) to the state I cvq) (exciton vacuum + phonon vq) equals :
Let us consider the linear exciton-phonon interaction
1 Hex-ph = 1/2 vq)a:k-q,zallk+q,2(bv+q + b, - 9 ) (4)
Wkvq
and take into account that
here ys(pk) is the wave function of sth state of the local exciton in pk repre- sentation. Then, the matrix element of operator Hex-ph, defined by of Eq. (4), can be written in the form
Dow
nloa
ded
By:
[HE
AL-
Link
Con
sorti
um] A
t: 15
:59
14 J
anua
ry 2
008
68 K. P. MELETOV, E. F. SHEKA, A N D E. 1. RASHBA
Substituting Eq. ( 5 ) into Eq. (3), after some transformations we obtain
W v q ) = C (e.jp,)Gp,o.pk-qp(Ei - Q(vq)) r‘aOk
(6)
where
(7) WS(Pk)y/,*(P‘k’)
Gsk,p’k‘(E) = c - E , . S
So, the matrix element of one-phonon transition is expressed through the Green function G of a crystal with a single guest molecule in the absence of exciton-phonon interaction. It can be written directly by the methods of the degenerated perturbations theory2 through Go(pk, E ) = ( E - E(pk))-’ the exciton Green function of the perfect crystal; namely, if an isotopic defect is placed in the lattice site ly (I numberates the cells, y are positions within the cell) and the isotopic shift equals A, then the following expression holds ( ~ o m p . ~ ) :
Gpk,p’k’(E) = Go(f& E)apk,p’k’
x exp{i(k’ - k)rIy}. (8)
Here
and quantities operators from
Go@) = c Go(pk, El, (9)
B,(pk) are the coefficients of the transformation of exciton momentum to site representation :
pk
1 &a) = N1/2 c B,(pk)eikrnZa(pk).
pk
From a comparison of Eqns. (7) and (8) the formula for the wave function of the local exciton in the pk representation can also be obtained

Dow
nloa
ded
By:
[HE
AL-
Link
Con
sorti
um] A
t: 15
:59
14 J
anua
ry 2
008
EXCITON-PHONON LUMINESCENCE
After the substitution of Eq. (8) into Eq. (6 ) we get:
P’
69
The separate terms in Eq. (12) have a clear physical sense. The first term is proportional to the value of li/i at the momentum q. It describes the process of the emission of phonon vq by exciton, which transfers to the state with zero momentum and then annihilates radiationally ; this process is utterly analogous to the luminescence of the band exciton. The second term desribes some more complicated process. Here, the exciton pk + q/2 undergoes a transition to the state pk - q/2 at first, emitting the phonon vq, and then annihilates radiationally after the impurity scattering with the momentum transfer k - q/2.
The final expression for M(vq) may be obtained by substitution of Eq. (1 1) into Eq. (12). We shall write it out only for the case of one molecule per primitive cell, supposing also, that A depends only on the momentum trans- fer. Supposing the impurity molecule be in the lattice site 1 = 0, the transition matrix element equals :
(13) The intensity distribution in the one phonon side band is described by the
expression :
I (o ) CK 1 )M(vq)I 2 6 ( ~ - Ei + R(vq))d3q. (14) ,, s
Everywhere the energy is counted off the energy of the crystal ground state. Since for the allowed transitions the well known singularity exists in the
exciton energy spectrum at k = 0 caused by the long-range dipole-dipole interaction, several quantities, entering Eq. (12) and Eq. (13) need to be as- certained. An analysis can be done analogously to that presented in paper3, and the answer is as follows. The functions Go(pk, E ) and B,(pk) correspond to mechanical excitons4 at k = 0, and to Coulomb excitons4 at k # 0 (i.e. in all expressions, including integration over Brillouin zone).

Dow
nloa
ded
By:
[HE
AL-
Link
Con
sorti
um] A
t: 15
:59
14 J
anua
ry 2
008
70 K. P. MELETOV, E. F. SHEKA, AND E. I. RASHBA
It is worthy to trace how the limit formulas for the deep and shallow local excitons may be obtained from the general formulas Eq. (12) and Eq. (13).
A. A deep level: !A1 b YJ1, R; 911 is half-width of the exciton band. In this case, the first term in the braces in Eq. (13) is approximately equal
to A-’, and the second one to (-0)- ; therefore, the second term dominates. Simplifying also the prebraces factor, we obtain finally
This is the usual formula of the theory of impurity luminescence spectra; A is seen to fall out of it.
The luminescence intensity distribution in one-phonon side band is usually attributed to the weighed density of states that is the product of density of states in a phonon spectrum by a “weighing factor”-an averaged square of interaction. Apparently the quantities M(v,q) have the sense of interaction constants.
B. A shallow level: local exciton binding energy &b 6 %I, 0. The point k = 0 is at the bottom of exciton band; thus &b = E(0) - Ei.
For the interaction with long-wave optical phonons the second term in the braces in Eq. (13) remains finite at &b + 0, q + 0 and has the order of magnitude of (SZ(v, O))-’, whereas the first term diverges. Omitting the second term and making use of Eq. (ll), we obtain
This formula is equally valid for the low temperature luminescence from the band states near the band bottom :
E(q) - E(O) 4 R(vq).
Namely in this way the limit transition to free exciton luminescence is attained. Their spectrum is some convolution of the side band corresponding to shallow centers, with the Boltzmann distribution function of band excitons at a given temperature. As a result of this convolution the side band width turns out to be of the order of (kT/‘JJI)GR (911is the exciton band halfwidth, 6 0 is the phonon dispersion).
A comparison of Eq. (13a) and Eq. (13b) shows that for deep and shallow levels “weighing factors ” differ by multiplier 1 t,hi(q) I ‘. Therefore, for shallow local excitons the processes accompanied by long-wave phonon emission are strengthened whereas the processes accompanied by short-wave phonon emission are suppressed.

Dow
nloa
ded
By:
[HE
AL-
Link
Con
sorti
um] A
t: 15
:59
14 J
anua
ry 2
008
EXCITON-PHONON LUMINESCENCE 71
The luminescence spectrum is usually measured in relative units. There- fore, it is convenient to compare Eq. (13) with the matrix element of the zero- phonon transition from the i-state. Using Eq. (2) and Eq. (la) we obtain
Let us introduce again the binding energy of a local exciton &b = IEi - Eedl ; here Eed is the position of the nearest edge of the exciton band. As &b decreases, the quantity M o shows Rashba effect: it increases, if at the band edge k = 0, and it decreases if at the edge k # 0. This change is caused by the increase of the exciton cloud radius in @,-state with decreasing &b.
Our aim is to analyse the ratio [(vq) = M(vq)/M, at small values of & b . To be definite, we again assume the point k = 0 to be at the bottom of the exciton band and A -= 0, that is, the local exciton level is below the exciton band. In this case, in the crystals with three-dimensional exciton energy spectrum M o a &;3/4 in the vicinity of the band edge (that is at &b +'$I).
Consider the cases of optical and acoustic phonons separately
1. Optical phonons Let us assume that A(v0) # 0, that is the scattering by long-wave phonons is allowed. First consider the first term in Eq. (13). At q = 0 in this expression a factor arises, which totally coincides with M o , therefore it grows at small &b as M o does. The coefficient at this factor is: Go(O, Ei - Q(v0)) = (&b + R(v0))- ; thus it increases rapidly with decreasing of &b and R(v0); therefore ( ( ~ 0 ) is especially large for shallow levels and low- frequency phonons. With q increasing (starting from q - (meb)1/2, m is the exciton effective mass), the Green function Go(q, Ei) oc q F 2 decreases rapidly. As a result, the side band width turns out to be of the order of (6R/%t)&b (8Q is the magnitude of the dispersion in the phonon band) that is, it is small at &b 49lI. Outside this region the luminescence intensity is small. Thus, for shallow impurity centers the one-phonon side band is narrowed from the scale of dR down to (&b/%i)dR.
It is more difficult to estimate the contribution of the second term in Eq. (13), since the result depends on the dimensionality of the exciton spectrum; therefore we shall not enter the details. It is only to be noted that the contribu- tion of the second term is most substantial at small R 2 ei as it has been pointed out above.
2. Acoustic phonons Here, A(vq) oc q1I2, Q = sq (s is the sound velocity). If, again, we restrict ourselves to considering the first term in Eq. (13), then the simple analysis of the Eq. (14) shows that in the I ( o ) a low-frequency

Dow
nloa
ded
By:
[HE
AL-
Link
Con
sorti
um] A
t: 15
:59
14 J
anua
ry 2
008
72 K. P. MELETOV, E. F. SHEKA, AND E. I. RASHBA
maximum is to appear. Its position is dependent on the value of the dimen- sionless parameter ms2/eb. If ms2/Eb << 1, then the maximum is displaced from the zero-phonon line at a distance - ( & b . ms2)112. If ms2/Eb % 1, the maxi- mum is displaced at the distance -&b. In either case, the maximum up- proaches the zero-phonon line when &b decreases. The second term in Eq. (13) results in the similar picture but we shall not consider it thoroughly since its detailed behaviour is, again, dependent on the dimensionality of the exciton spectrum. It is only to be noted that at q + 0 it is especially large since the scattering of an exciton with energy Ei - s4 on the quest molecule becomes resonant and this enlarges the factor before the sum over k.
In conclusion, the theoretical analysis of one-phonon luminescences spectrum allows one to state that the main features of the spectrum can be formulated in the general form despite the details of the spectrum being substantially dependent on the parameters of the problem. As the depth of the local exciton level &b decreases, the parts of the phonon side band corre- sponding to largeq die off. As a result, the side band becomes splitted into a set of relatively narrow sub-bands, corresponding to optical phonons with small values of q. When &b decreases the intensities of these bands increase just as the intensity of the zero-phonon transition enhanced by Rashba effect. In the limit &b + 0 the side band approaches the low temperature luminescence spectrum of band excitons. In the acoustic part of the side band, the main part corresponding to short-wave phonons dies off with decreasing &b; instead of it the sliding maximum that gradually approaches the zero-phonon band, arises.
Note in conclusion that in the vibronic spectrum all the above stated peculiarities of the phonon side band must be absent and it must have practically universal form independent of the depth of the local exciton level. The weighing factor is determined by the matrix element (13a). Certainly, this statement is correct only when the internal phonon band width is sufficiently small, and the vibronic interaction can be regarded to be purely intramolecular (that is, momentum independent).
3. EXPERIMENTAL
The intrinsic and impurity fluorescence of the naphthalene crystal were re- corded photoelectrically with a 1 cm- ' resolution on a spectrograph DFS-13 provided with an attachment with photomultiplier PM-106. Fluorescence excitation was provided by 45" illumination with lo00 W high pressure xenon arc lamp appropriately filtered with monochromator. The dispersion of the device in the region investigated is 2 &mm, the spectral width of the appara- tus function equals 3 cm-'. An error of the fluorescence intensity determina-

Dow
nloa
ded
By:
[HE
AL-
Link
Con
sorti
um] A
t: 15
:59
14 J
anua
ry 2
008
EXCITON-PHONON LUMINESCENCE 73
tion did not exceed 5%. The spectra were investigated within the temperature range from 2 to 20 K. Thin (10-100 p) heat and doped single crystals were grown in nitrogen atmosphere.
Naphthalene was highly purified by a combined te~hnique.~ In its fluore- scence spectrum at 2 K neither the bands of any chemical doping nor the fluorescence spectrum from defect levels6 caused by the presence of thio- naphthene were observed.
To investigate the fluorescence of an impurity center of a small radius we chose P-methylnaphthalene (BMN) as a guest that usually attends naphtha- lene not highly purified. The doping concentration is 2-3%. The fluorescence from the large radius impurity centers was studied using a set of isotopic mixed deuteronaphthalene crystals. Four systems were studied : C loH, doped CloDs (further, do in d 8 ) ; 2a-C10H6D2 doped C10D8 (ad2 in d8) , CloHs doped 2c(-CloH,D6 (do in ad,) and CloHs doped 4a-C,,H4D, (do in ad4). Deuteronaphthalene compounds were zone refined. The doping concentration was 1-2%.
The fluorescence spectra were recorded in the regions of the electronic and one of the vibronic transitions. In a naphthalene crystal and isotopic doped crystals an internal phonon participating in a vibronic transition corre- sponded to a non-totally symmetrical intramolecular vibration b3g (509 cm- for do). In the spectrum of BMN the intramolecular vibration of the vibronic transition has the symmetry ug (520 cm-').
4. THE INTRINSIC LUMINESCENCE OF A PERFECT N APHTH ALEN E CRYSTAL
When investigating the fluorescence spectra of a benzene crystal7 an attention was paid to a great qualitative difference of electronic and vibronic phonon side band (PSB) structures at T = 4.3 K. This phenomenon was attributed to different conditions imposed on the thermalized exciton momentum conservation in one phonon and two-phonon transitions (this was discussed in detail in Introduction). The phenomenon proved to be sufficiently general and was, later, observed in the fluorescence spectra of naphthalene crystals.8 Benzene and naphthalene crystals have weak electronic transitions thus the exciton-phonon broadening of the exciton levels exceeds the exciton-photon interaction value. In this case, elementary excitations are fairly described by excitons, and the effect of retardation on exciton spectra can be ignored.
The main pattern of the low-temperature fluorescence spectrum of a naphthalene crystalg is formed by sufficiently intense bands of the electronic and vibronic intramolecular transitions. The majority of the vibronic bands
Dow
nloa
ded
By:
[HE
AL-
Link
Con
sorti
um] A
t: 15
:59
14 J
anua
ry 2
008
74 K. P. MELETOV, E. F. SHEKA, AND E. I. RASHBA
A i t -
I
I 6
I-
v),
z w
z
-
t- -it-
!
0 20 40 60 80 00 no Irg w.:f?i
-it-
\
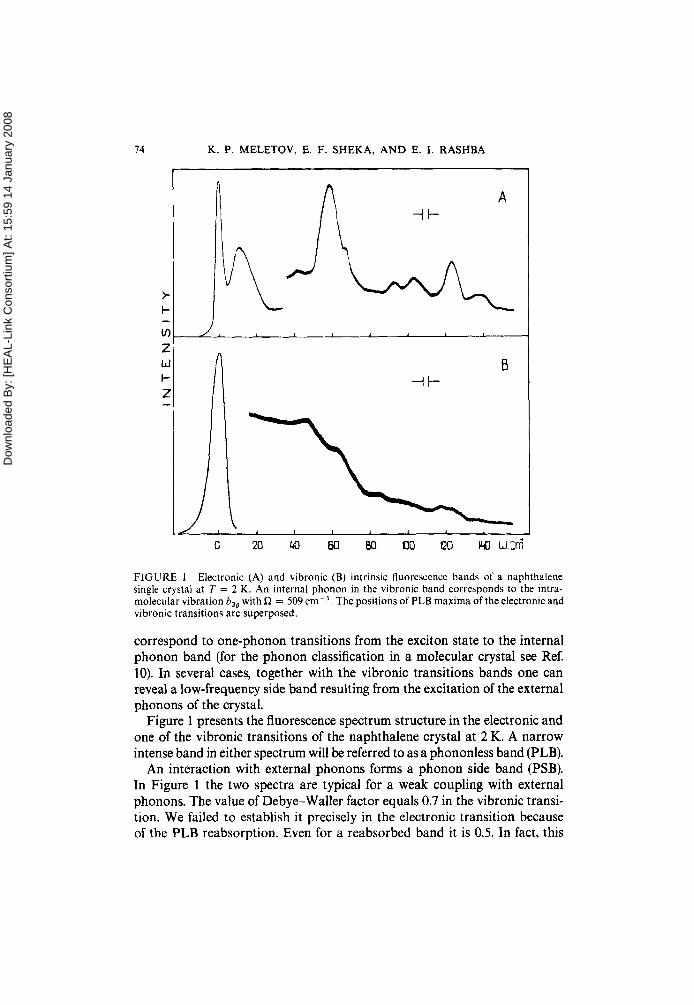
FlGURE 1 Electronic (A) and vibronic (B) intrinsic fluorescence bands of a naphthalene single crystal at T = 2 K. An internal phonon in the vibronic band corresponds to the intra- molecular vibration b,, with R = 509 cm-’. The positions of PLB maxima of the electronic and vibronic transitions are superposed.
correspond to one-phonon transitions from the exciton state to the internal phonon band (for the phonon classification in a molecular crystal see Ref. 10). In several cases, together with the vibronic transitions bands one can reveal a low-frequency side band resulting from the excitation of the external phonons of the crystal.
Figure 1 presents the fluorescence spectrum structure in the electronic and one of the vibronic transitions of the naphthalene crystal at 2 K. A narrow intense band in either spectrum will be referred to as a phononless band (PLB).
An interaction with external phonons forms a phonon side band (PSB). In Figure 1 the two spectra are typical for a weak coupling with external phonons. The value of Debye-Waller factor equals 0.7 in the vibronic transi- tion. We failed to establish it precisely in the electronic transition because of the PLB reabsorption. Even for a reabsorbed band it is 0.5. In fact, this

Dow
nloa
ded
By:
[HE
AL-
Link
Con
sorti
um] A
t: 15
:59
14 J
anua
ry 2
008
EXCITON-PHONON LUMINESCENCE 75
value is muc higher. These values as well as the other impurity centers investigations in molecular crystals' evidence that the processes with the generation of one external phonon are predominant in the formation of either PSB. Therefore, both PSB will be referred to as one-phonon side bands meaning here the number of external phonons. One has to bear in mind the different conditions of momentum conservation in them due to one-particle and two-particle nature of the final electronic and vibronic states.'* For simplicity, let us denote the PSB of the electronic transition as PSBe and that for the vibronic as PSBv.
As seen from Figure 1 the PSBe and the PSBv differ substantially: the PSBe has a prominent narrow-band structure, whereas the PSBv is rather structureless.
With a temperature increase from 2 K to 20 K (see Figure 2) the PSBe changes strikingly. Its structure broadens and acquires the likeness of the PSBv. Under the same conditions the PSBv preserves its structure but gets noticeably diffuse. This diffuseness is due to the temperature broadening of the vibronic PLB that is a band of band-to-band transitions with the partici- pation of internal phonon~.'~-' ' At a change of temperature from 2 K to 2 0 K the half-width of the vibronic PLB increases from 8 cm-' to 4Ocm-l.
To analyse the PSB structure consider the energy spectrum of the crystal. Figure 3 presents the exciton bands of the crystal in two directions. The excitation transfer integrals determined in Ref. 10 are used when mapping the dispersion. The phonon dispersion is obtained experimentally from the coherent inelastic neutron scattering at 5 K in a naphthalene-& crystals.' 7 , 1
The PSBe structure is determined by the exciton distribution in the band. At low temperatures excitons are concentrated in the vicinity of the lowest band bottom. The values of thermal momenta Q (measured in the Brillouin momenta units) are determined by the condition E(Q) % kT. In Figure 3 vertical lines correspond to the Qb and Qc values for T = 2 K. As is seen from Figure 3 the values of exciton thermal momenta are different in different directions. Thus, at T = 2 K (an analogous situation holds for T = 4.3 K too) a maximal value Qb = 0, 1 (actually, the same value has Qa) whereas Qc E 0.3. As the major part of thermalized excitons has momenta which are small, then a prominent structure associated with the emission of long-wave phonon groups must be observed in the PSBe. At T = 0 K only the q = 0 phonon frequencies should have appeared in the spectrum.
The probability of the electronic transition with the generation ofa phonon with a momentum q is proportional to the probability of exciton occupation of the intial state k = q. At low temperatures (2 or 4.3 K) this probability is great only in a small region of the Brillouin zone. It is convenient to introduce a partial phonon-density of state gm(w) to take into account the exciton population in the initial states. It characterizes the distribution of phonons

Dow
nloa
ded
By:
[HE
AL-
Link
Con
sorti
um] A
t: 15
:59
14 J
anua
ry 2
008
16
F t-
m Z w t- Z
-
-
K. P. MELETOV, E. F. SHEKA, AND E. I. RASHBA
0 20 40 60 80 100 I20 140 W.Ct FIGURE 2 PSBe) of a naphthalene crystal A = 4.3 K ; B = 10 K ; C = 20 K.
Temperature dependence of the electronic intrinsic fluorescence bands (PLB and
active in PSBe at temperature T. Figure 4 presents full and partial calculated phonon densities-of-states of a naphthalene crystal. When calculating gpr(co) the Brillouin zone region limited by the values of exciton thermal momenta at T = 2 K was used. The calculations were done by the Dr. Pawley’s program CRASH2’ using Kytaigorodski’s set for the parameters of the atom-atom interaction potential in the form “ 6-exp.” These param- eters enable one to calculate the phonon density-of-states of a crystal, g(co),

Dow
nloa
ded
By:
[HE
AL-
Link
Con
sorti
um] A
t: 15
:59
14 J
anua
ry 2
008
31575
31475
100
1.0 .8 .6 .4 .2 0 .2 .4 .6 .8 1.0 (010) -REDUCED WAVE VECTOR- [ 001)
4 FIGURE 3 Exciton ~(n) and phonon n(q) energy spectra of a naphthalene crystal. q are given in the units of Brillouin momenta. The vertical lines limit the k-space region wherein the exciton energy is z k T , T = 2 K. The exciton band dispersion is described by the expression
i : (k ) = 2 M , c o s ( k . a ) + 2 M b C O S ( ~ h ) + 2 M , cos(k ' C) + 2M, ,+ ,
x [cos(k a) cos(k . c ) - sin(k a) x sin(k . c)]
k ri
-sin(k. c ) x sin ~ sin ~
2 2
where M l z = 18; M I 2 = 2.0; M . = -0.6; M b = -3.9; M , = 6.1; Ma+c = -3.7cm-' according to Ref. 16. The phonon dispersion Q(q) is measured experimentally at 5 K from neutron inelastic coherent scattering in naphthalene-d8 crystal. l 7 3 l 8
77

Dow
nloa
ded
By:
[HE
AL-
Link
Con
sorti
um] A
t: 15
:59
14 J
anua
ry 2
008
78 K. P. MELETOV, E. F. SHEKA, A N D E. I . RASHBA
1
0 20 40 60 80 100 120 140 W.Cm
FIGURE 4 (A) Experimental function c ( w ) proportional to the phonon density-of-states in a naphthalene crystal at 5 K (for details see Ref. 19). Total g(w) (B) and partial g p T ( o ) (C) cal- culated phonon density-of-states of a naphthalene crystal. In the calculation of g P r ( o ) for T = 2 K the k-space region is limited by the vectors qo = qb = 0.1 and qc = 0.3. Arrows mark the calculated frequencies values of the q = 0 phonons.
agreeing with the experimental G(o) (see Figure 4A) determined by inelastic incoherent neutron scattering.'
As seen from the figure the densities g ( o ) and gpT(co) differ substantially. In g p T ( o ) the long-wave optical phonons groups are prominent, the peak at 42 cm-' connected with acoustic phonons is weakened. Instead, a broad peak is observed in the low frequency region.
A comparison of the PSBv with the density g(o) shows the weighing factor M(vq) tending to decrease readily with an increase of phonon frequency.
Dow
nloa
ded
By:
[HE
AL-
Link
Con
sorti
um] A
t: 15
:59
14 J
anua
ry 2
008
EXCITON-PHONON LUMINESCENCE
I
A
0 20 4 80 8@ I00 110 140 I60 W. C f i '
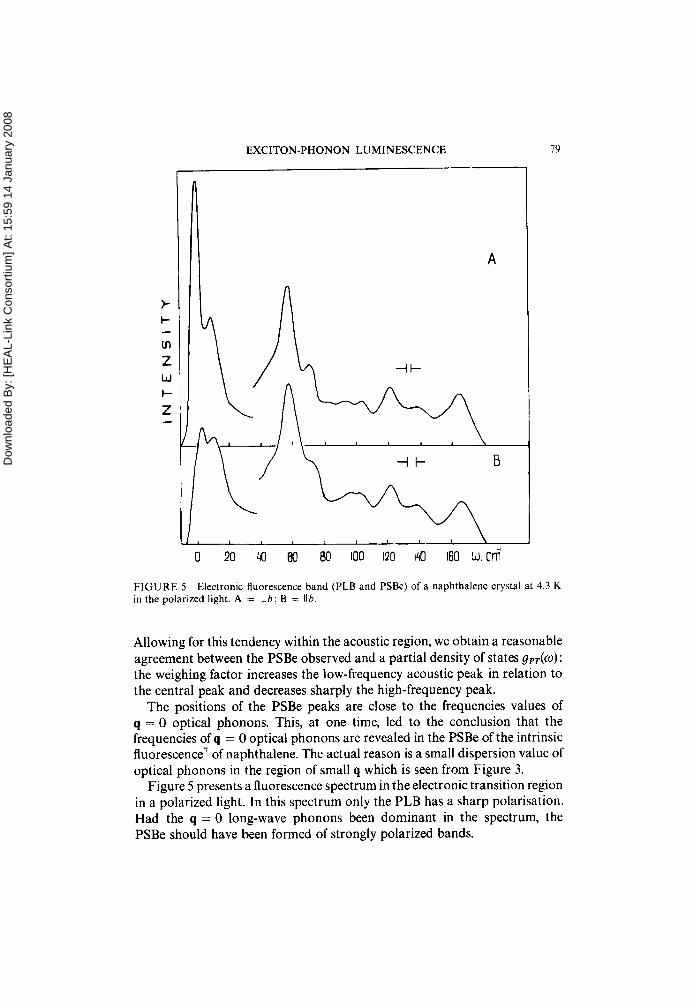
FIGURE 5 in the polarized light. A = I h ; B = Ilh.
Electronic fluorescence band (PLB and PSBe) of a naphthalene crystal at 4.3 K
Allowing for this tendency within the acoustic region, we obtain a reasonable agreement between the PSBe observed and a partial density of states gpT(m) : the weighing factor increases the low-frequency acoustic peak in relation to the central peak and decreases sharply the high-frequency peak.
The positions of the PSBe peaks are close to the frequencies values of q = 0 optical phonons. This, at one time, led to the conclusion that the frequencies of q = 0 optical phonons are revealed in the PSBe of the intrinsic fluorescence' of naphthalene. The actual reason is a small dispersion value of optical phonons in the region of small q which is seen from Figure 3.
Figure 5 presents a fluorescence spectrum in the electronic transition region in a polarized light. In this spectrum only the PLB has a sharp polarisation. Had the q = 0 long-wave phonons been dominant in the spectrum, the PSBe should have been formed of strongly polarized bands.

Dow
nloa
ded
By:
[HE
AL-
Link
Con
sorti
um] A
t: 15
:59
14 J
anua
ry 2
008
80 K . P. MELETOV, E. F. SHEKA, AND E. I . RASHBA
5. LUMINESCENCE OF A DEEP LOCAL EXCITON
In a naphthalene crystal one fails to obtain a deep exciton level by means of an isotopic doping. A maximal isotopic shift A = 115 cm-' (do and d8 mixing) corresponds to the level located at a depth of 49cm-' below the exciton band bottom. A deeper level can be obtained only by means of a chemical impurity. We chose P-methylnaphthalene (BMN).
The distance between the level of an exciton localized on a guest molecule and the exciton band is x400 cm-' which exceeds greater the overall width of exciton bands.
Figure 6 presents the fragments of the BMN fluorescence spectrum in naphthalene in electronic and vibronic transition regions. Just as the
A +I-
-It- B
1 I
0 20 4 60 80 IM3 00 140 160 W. Cd FlGURE 6 Electronic (A) and vibronic (B) fluorescence bands of P-methylnaphthalene guest molecules in a naphthalene crystal at 4.3 K; in the vibronic band the intramolecular vibration is a,. C2 = 520 cm-'. In Figure B in the region - 110 cm-' a surplus maximum is the PLB of the vibronic transition superposed. The positions of PLB maxima of the electronic and vibronic transitions are superposed. The solid curve is the one-phonon transition spectrum calculated according to Ref. 11. The dashed curve is a higher order phonon processes contribution.

Dow
nloa
ded
By:
[HE
AL-
Link
Con
sorti
um] A
t: 15
:59
14 J
anua
ry 2
008
EXCITON-PHONON LUMINESCENCE 81
intrinsic fluorescence of the crystal the spectra are formed by comparatively narrow PLB followed by low-frequency PSB caused by the interaction with external phonons. The value of Debye-Waller factor is 0.70 and 0.73 for the electronic (there is a reabsorption) and vibronic transitions. In Figure 6 is shown a one-phonon part of the PSBv determined from the experimental spectrum according to the procedure described in Ref. 11. It is seen that, actually, the main part of the PSBv consists of one-phonon transitions. The contribution of the higher order phonon processes is x0, 1.
Unlike the intrinsic fluorescence, the PSBe and PSBv are, practically, similar for a deep local exciton. This is consistent with the general regularities of the fluorescence spectrum structure of deep impurity centers (see, for instance 11 and, also, the limit case (A) and the end of section 2). The PSB structure is described by the weighed phonon density-of-states.
The structure of either PSB in the deep local exciton spectrum, as is to be expected, is close to that of the PSBv intrinsic fluorescence spectrum (see Figures 1B and 6).
6. LUMINESCENCE OF A SHALLOW EXCITON
The approach of the local exciton level to the exciton band edge is followed by a progressive delocalization of the exciton wave function. The result of this delocalization is a well known gigantic change of the intensity of the local exciton phononless absorption band.z,zl Recently, we have observedz3 a related effect in a phonon side band of the local exciton luminescence. Here a reduction of a local level depth is followed by a complete reconstruction of the PSB shape : the regions corresponding to the long-wave phonons contri- bution get strengthened prominently, whereas the intermediate regions are suppressed. The picture arisen corresponds to a gradual transition from the type of behaviour corresponding to the small radius exciton luminescence (see section 5) to that corresponding to low-temperature luminescence of band excitons (see section 4).
As has been stated in section 3, the low-temperature fluorescence spectra of isotopic doped naphthalene crystals in which guest molecules form a shallow local level below the exciton band bottom of the host crystal, were measured for four doped crystals : do in d8 (I), adz in d8 (11) do in ad6 (111) and do in ad, (IV). The impurity level depth E~ equals 49,30, 18 and 8 cm-' for crystals I to IV, respectively.
Figure 7 presents the fluorescence spectra of crystal I at 4,3 K (temperature decrease down to 2 K results in no changes) in the electronic and vibronic transitions regions. In either case, the spectrum consists of a narrow (half- width is 4 to 8 cm-') PLB and an extended PSB. The latters will be referred to, according to the above designations, as PSBe and PSBv.

Dow
nloa
ded
By:
[HE
AL-
Link
Con
sorti
um] A
t: 15
:59
14 J
anua
ry 2
008
K. P. MELETOV, E. F. SHEKA, AND E. I . RASHBA
\
FlGURE 7 Electronic (A) and vibronic (B) fluorescence bands of a do-naphthalene impurity in a dx-naphthalene crystal at 4.3 K. The intramolecular vibration in the vibronic band is b30, R = 509 cm-’. The positions of PLB maxima of the electronic and vibronic transitions are superposed.
There is a substantial difference between the PLB of the two transitions. The PLB of the vibronic transition is doublet. A more intense component of the doublet corresponds to the transitions with excitation of guest molecules vibration. A less intense one corresponds to host molecules vibration. The splitting of the vibronic transition PLB was observed by Broude et al.24 and then, again, in Ref. 25. It is related to a partial delocalization of excitation on shallow impurity levels. The amount of the degree of delocalization is deter- mined by the relation of the intensity of the “crystalline” part of the PLB marked by an asterisk in Figure 7, to the overall PLB intensity. As the im- purity level depth decreases a relative intensity of the PLB crystalline com- ponent increases; the doublet components are brought closer. In the investi- gated crystals the delocalization degree increases from 17 % (crystal 1) up to 50% (crystal IV) with level depth changing from 49 down to 8 cm- ’.
The PSBe and PSBv presented in Figure 7 are also different. In the PSBe
Dow
nloa
ded
By:
[HE
AL-
Link
Con
sorti
um] A
t: 15
:59
14 J
anua
ry 2
008
EXCITON-PHONON LUMINESCENCE 83
an additional structure that is absent in PSBv appears to the right of the peak at 48 cm-'. Alternatively in the PSBv the low-frequency peak (o x 30 cm-I) to the left of the main peak becomes more prominent.
The doublet structure of the vibronic PLB, must, naturally, be reflected in the PSBv structure. This results in a superposition of two similar PSB such as PSBv of the intrinsic fluorescence or of a small radius local exciton multiplied by a factor of intensity distribution in the PLB doublet. This might explain a new peak appearing to the left of the main peak at x 30 cm-' in the PSBv. The most interesting differences, however, are revealed in the PSBe evolution at a change of the local exciton level depth.
Figure 8 presents the fluorescence spectra of the four crystals investigated in the electronic transitions region. The guest excitation delocalization increases downwards. The positions of the PSBe peaks with respect to the PLB changed insignificantly, that is, as much as the phonon spectra of different I-IV host crystals are changed. At the same time intensity of PSBe additional bands increases rapidly in going from crystal I to crystal IV. The intensity of mean peak at 48cm-' caused by short wave acoustic phonons in the host phonon density-of-states (see Figure 3) decreases continuously and com- pletely disappears in crystal IV. Instead, a peak, connected with long-wave acoustic phonons appears at a distance of 12 cm-' away from the PLB. The crystal IV spectrum looks like that of low temperature intrinsic fluorescence of a naphthalene crystal (see Figure 1A) very much.
In the vibronic transitions region (Figure 9) the changes of the PSBv are limited by what follows from the change of the PLB doublet. As the intensity of the crystalline doublet component increases the intensity of a low-frequency peak at o x 30 cm-I increases too. Simultaneously, because of the doublet components being brought together this peak approaches the central one and, in crystal IV, amalgamates with it. The vibronic spectrum of crystal IV, practi- cally, cannot be differed from the intrinsic fluorescence vibronic spectrum of a naphthalene crystal (see Figure 1B).
The experimental fact that the PSBe of crystal IV became analogous to the intrinsic fluorescence PSBe of a naphthalene crystal is the basic one for the interpretation suggested. In accordance with the results of Section 2, the narrowing factor of the order of &,/'m appears for PSBe in the case of shallow local exciton levels. In the crystals investigated this factor changes by approxi- mately a factor of 6 which defines a large value of the effect observed. Simul- taneously, a comparison over the values of the narrowing factor &b/m for crystal do in ad4 and kT for the intrinsic luminescence at 2 to 4.3 K results in the fact that the PSBe of crystal IV is similar to that of the intrinsic fluores- cence.
In the vibronic transitions the dependence of i,bi(k) on the momentum is insignificant due to the local character of the intramolecular vibration.

Dow
nloa
ded
By:
[HE
AL-
Link
Con
sorti
um] A
t: 15
:59
14 J
anua
ry 2
008
84
t I-
In Z w I- Z
-
-
K. P. MELETOV, E. F. SHEKA, AND E. I . RASHBA
FIGURE 8 Electronic fluorescence bands of isotopic impurity deuteronaphthalene crystals at 4.3 K. Arrows mark the PLB of isotopic minorities in host crystals. The PLB maxima positions are superposed. (A) do in d, ; (B) ad, in d, ; (C) do in ads ; (D) do in ad,.

Dow
nloa
ded
By:
[HE
AL-
Link
Con
sorti
um] A
t: 15
:59
14 J
anua
ry 2
008
EXClTON-PHONON LUMINESCENCE 85
> I-
m Z W
I- Z
-
-
I \ I
L 0 20 40- KO 00 I00 do I40 w.crii I
FIGURE 9 Vibronic fluorescence bands of isotopic impurity deuteronaphthalene crystals at 4.3 K. Intramolecular vibration is b3p (0 = 509 cm-' for a &-naphthalene). Asterisks mark the crystalline components of the PLB and the corresponding maxima in PSBv. For the remain- ing, see Figure 8.
Dow
nloa
ded
By:
[HE
AL-
Link
Con
sorti
um] A
t: 15
:59
14 J
anua
ry 2
008
86 K. P. MELETOV, E. F. SHEKA, A N D E. I . RASHBA
Owing to this the PSBv structure is determined, like the PSBv of deep local excitons, by the weighed phonon density-of-states of the host crystal (see the end of Section 2).
A rigorous calculation of Section 2 is in a fair qualitative agreement with the experimental data. In order to make a quantitative comparison between the theory and the experiment the calculation of the exciton-phonon inter- should be done. To solve this problem successfully one has to determine more precisely the energy spectra of excitons and phonons and to develop reasonable models for exciton-phonon interaction. At present, only first steps were donez6 to determine the constants of this interaction.
Low-temperature luminescence of molecular crystals was the field of the scientific activity of V. L. Broude for the period of 20 years long, beginning with the work at the review paper” and including his further numerous publications in this field. Discussions with him at an early stage of this work were both stimulating and fruitful. We remember them with the gratitude.
Acknowledgment
The authors are very grateful to Mrs. Yu. D. Midelashvili for help in preparing the English version of the manuscript.
References
I . A. S . Davydov. Theory of Molecular Excitons. Nauka. Moscow (1968). ch. 2. $8 (Plenum
2. 1. M. Lifshitz. Zh. Eksp. Twr. Fii.. 17. 1017. 1076 (1947). 3. E. 1. Rashba, Fiz. Tiwd. Tda, 4, 3301 (1962). (Sor. Phys.-SSolidS/ufe. 4, 2417 (1963)). 4. V . M. Agranowich. Theory of Excitons. Nauka. Moscow (1968). 5. S. S. Grazhulene, L. A. Musikhin, and G . Ph. Telegin, Zhurn. Prikl. Khimii, 50, 885 (1977). 6. N. 1. Ostapenko. V. 1. Sugakov, and M. T. Shpak, J . oj Lutnin, 4, 261 (1971). 7. V. L. Broude, V. K. Dolganov, Ph. B. Slobodskoj, and F. E. Sheka. Izc. A N SSSR. srr.fiz.,
8. K. P. Meletov and E. F. Sheka. Izc. A N SSSR, ser.fiz., 42. 435 (1978). 9. V. L. Broude, E. F. Sheka, and M. T. Shpak, Optiku i Spekfr., Shornik Stutej I. Lumineszen-
Press, New York, 1971).
37. 311 (1973).
zia, p. 102 (1963). 10. G. Vankataraman and V. C. Sahni, Rev. Mod. Phys., 42,409 (1970). 1 1 . K. P. Meletov and E. F. Sheka, Mol. Cryst. Liquid. Cryst., 43, 203 (1978). 12. Ph. B. Slobodskoj and E. F. Sheka, Fiz. Turrd. Telu, 15. 1270 (1973). (Soc. Phys.-Solid
13. E. I . Rashba, Fiz. Tiwd Telu, 5. 1040 (1963). (Sol.. fh,vs.-SolidS/ute. 5. 757 (1963)). 14. V. L. Broude, E. F. Sheka, M. T. Shpak. and A. G. Shpakovskaja. Optika i Sprktr., Sbornik
Statej 1. Lumineszenzia. p. 18 (1963). 15. S. D. Colson. D. M . Hanson, R. Kopelman and G . W. Robinson, J . Chrm. Phvs.. 48,2215
( I Y68). 16. H. K. Hong and R. Kopelman, J . Cheni. Phys., 55, 724 (1971). 17. E. L. Bokhenkov. B. Dorner, 1. Natkaniec. and E. F. Sheka. Solid Stuto C{JtilJ,lUn.S. 23. 89.
(1977).
Strrtr. 4. 860 (1973)).

Dow
nloa
ded
By:
[HE
AL-
Link
Con
sorti
um] A
t: 15
:59
14 J
anua
ry 2
008
EXCITON-PHONON LUMINESCENCE 87
18. E. L. Bokhenkov, B. Dorner, J . Kalua, G. McKenzie, I . Natkaniec, G. S. Pawley, and E. F. Sheka. ILL Annual Report, 1978,04-01-028R3.
19. E. L. Bokhenkov. E. F. Sheka. 1. Natkaniec, B. Dorner, and W. Drexel in "Lattice Dy- namics" (Proceeding of the International Conference on Lattice Dynamics 6-9 Sept., 1977, Paris). Flammarion Science. p. 471 (1978).
20. G. S. Pawley, Phj,s. Sfat . So/., 20. 347 (1967); 49, 475 (1972). 21. E. 1. Rashba, Opiiku i Sprktuosk.. 2, 568 (1957). 22. V. L. Broude. E. 1. Rashba. and E. F. Sheka, Dokl. A N SSSR, 139, 1085 (1961). (Sou. Phys.
L)ukl. ,6, 718 (1962)). 23. K. P. Meletov, E. 1. Rashba, and E. F. Sheka. Pis'niu ZhETF, 29, 184 (1979). 24. V. L. Broude. A. I . Vlasenko. E. I. Rashba, and E. F. Sheka, Fiz. Tuerd Tela. 7,2094 (1965).
(Soc. Phys-Solid Stute, 7. 1686 (!966)). 25. F. W. Ochs, P. N. Prasad. and R. Kopeiman. C/icvn. P/iys., 6 . 253, 1974. 26. N . 1. Ostapenko. V. I . Sugakov, M. P. Chernomoretz, and M. T. Shpak. Pis'mu ZhETP,
27, 452 (1978). 27 V. L. Broude. A. F. Prikhot'ko, and E. I . Rashba. Usp. Fiz. Nuuk. 67, 99 (1959). (Suc.
Phy.sics- lisprkhi, 67(2), 38 (1959)).