executing our initiatives
DESCRIPTION
Executing our Initiatives. Winn Dixie Stores, Inc. Investor Day Hosted by Karen Short Friedman, Billings, Ramsey & Co., Inc October 9, 2007. Safe Harbor Statement. - PowerPoint PPT PresentationTRANSCRIPT

Executing our InitiativesWinn Dixie Stores, Inc.
Investor Day Hosted by Karen Short
Friedman, Billings, Ramsey & Co., IncOctober 9, 2007

2
Safe Harbor Statement
Certain statements made in this presentation may constitute “forward-looking statements” within the meaning of the federal securities laws. These forward-looking statements are based on our current plans and expectations and involve certain risks and uncertainties. Actual results may differ materially from the expected results described in the forward-looking statements. These forward-looking statements include and may be indicated by words or phrases such as “anticipate,” “estimate,” “plan,” “expect,” “project,” “continuing,” “ongoing,” “should,” “will,” “believe,” or “intend” and similar words and phrases. There are many factors that could cause the Company’s actual results to differ materially from the expected results contemplated or implied by the Company’s forward-looking statements. The Company faces a number of risks and uncertainties with respect to its continuing business operations and its attempt to increase its sales and gross profit margin, including, but not limited to: the Company’s ability to improve the quality of its stores and products; the Company’s success in achieving increased customer count and sales in remodeled and other stores; the results of the Company’s efforts to revitalize the corporate brand; competitive factors, which could include new store openings, price reduction programs and marketing strategies from other food and/or drug retail chains, supercenters and non-traditional competitors; the ability of the Company to effectively manage gross margin rates, particularly in the first half of the fiscal year; the ability of the Company to attract, train and retain key leadership; the Company’s ability to implement, maintain or upgrade information technology systems, including programs to support retail pricing policies; the outcome of the Company’s programs to control or reduce operating and administrative expenses and to control inventory shrink; increases in utility rates or gasoline costs, which could impact consumer spending and buying habits and the cost of doing business; the availability and terms of capital resources and financing and its adequacy for the Company’s planned investment in store remodeling and other activities; the concentration of the Company’s locations in the southeastern United States, which increases its vulnerability to severe storm damage; general business and economic conditions in the southeastern United States, including consumer spending levels, population, employment and job re-growth in some of our markets, and the additional risks relating to limitations on insurance coverage following the catastrophic storms in recent years; the Company’s ability to successfully estimate self-insurance liabilities; changes in laws and other regulations affecting the Company’s business; events that give rise to actual or potential food contamination, drug contamination or food-borne illness; the Company’s ability to use net operating loss carryforwards under the federal tax laws; and the outcome of litigation or legal proceedings. Please refer to discussions of these and other factors in the Company’s Annual Report on Form 10-K for the fiscal year ended June 27, 2007, and other Company filings with the Securities and Exchange Commission. These statements are based on current expectations and speak only as of the date of such statements. The Company undertakes no obligation to publicly revise or update these forward-looking statements, whether as a result of new information, future events or otherwise.

3
Meeting Agenda
8:00AM – 8:30AM: Breakfast
8:30AM – 8:50AM: Winn-Dixie - “The Brand”
8:50AM – 9:30AM: Management Presentation
9:30AM – 9:45AM: Break
9:45AM – 10:45AM: Q&A
11:00AM – 1:00PM: Store Tours

Executing our InitiativesPeter Lynch
Chairman, President & CEOWinn Dixie Stores, Inc.
October 9, 2007

5
Early Progress in our Multi-Year Turnaround
Implementing a multi-year turnaround strategy Financial results in fiscal 2007 show early progress:
Adjusted EBITDA of $85.9 million compared to a loss of $27.8 million last year Gross margin of 26.9% compared to 25.9% last year, an increase of 100 basis
points Identical store sales increase of 1.6% Store remodel program on track with 20 remodels completed in fiscal 2007 Liquidity of $592.9 million and no significant borrowing under our revolving credit
facility
Continued progress on strategic initiatives: Our major store remodeling program is underway We completed 4 remodels in the first quarter of fiscal 2008 A major corporate brands initiative is underway New marketing and merchandising initiatives are underway
Customers are responding favorably to our initiatives – Winn-Dixie received its highest score ever in customer service based on the recent ACSI Index
in the supermarket category.
Source: Univ. of Michigan – the American Consumer Satisfaction Index (ACSI) February 2007.

6
Foundation For Future Growth
Energized the 52,000 associates whose dedication and commitment to “getting better all the time” is critical to our continued success
Chapter 11 enabled the company to streamline its store base Focused on convenient store locations where we are No. 1, 2 or 3 in market share
Exited non-core markets and closed ~ 400 stores Narrowed footprint to key DMAs in five states
Florida, Louisiana, Georgia, Alabama, Mississippi
Achieved numerous operational improvements: Reduced costs by $100 million on an annualized basis Reduced shrink by over 100 basis points on an annualized basis Implemented a sustainable strategic sourcing program resulting in savings of >$20
million annually Consolidated 10 distribution centers into 6; eliminated three office buildings here in
Jacksonville Invested $70 million annually to put more labor back into stores and improve
customer service Realigned the retail organization with stronger focus on customer service and
execution of marketing and merchandising plans.
7
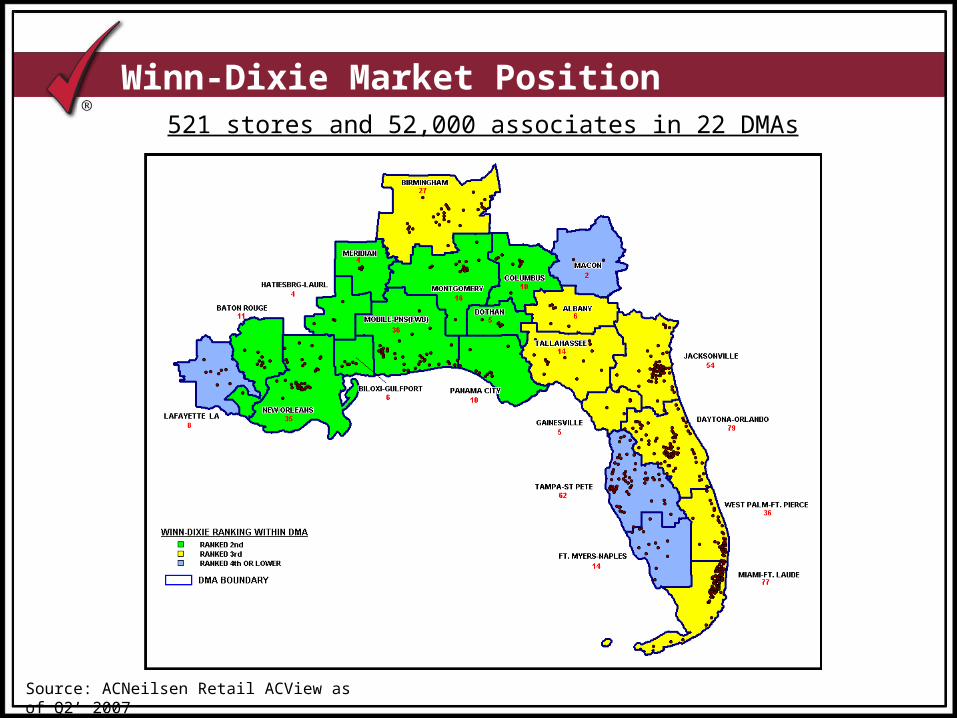
Winn-Dixie Market Position521 stores and 52,000 associates in 22 DMAs
Source: ACNeilsen Retail ACView as of Q2’ 2007

8
Senior Management Team
Experienced and Committed Leadership
Peter Lynch Chairman, President & CEO
Bennett Nussbaum Senior Vice President & CFO
Larry Appel Senior Vice President & General Counsel
Anthony Austin Senior Vice President of Human Resources
Frank Eckstein Senior Vice President of Retail Operations
Dan Portnoy Senior Vice President & Chief Merchandising & Marketing Officer
Dave Henry Senior Vice President of Marketing
Phil Pichulo Group Vice President of Development
Chris Scott Group Vice President of Logistics & Distribution
Charlie Weston Group Vice President of Information Technology

9
Our Strategy
Rebuilding trust in our brand
Investing capital in our stores
Merchandising for the neighborhood
Training and developing our Associates
Achieving profitable sales

10
Rebuilding Trust in Our Brand
Approximately 300 of our Corporate Brands products are in-store with newly redesigned packaging.
Our goal is to have at least 1,000 SKUs with newly redesigned packaging on-shelf by the end of fiscal 2008.
In fiscal 2007, our Corporate Brand penetration rate for categories we measure was 19.1%, an increase of 100 basis points from 2006.
Our target for fiscal 2008 is to increase our penetration rate by 140 basis points compared to 2007.
Corporate Brands Program

11
Rebuilding Trust in Our Brand
Thrifty Maid, our “Good” product line that matches the national and regional “value” brands in quality.
Three Quality Tiers

12
Rebuilding Trust in Our Brand
Winn-Dixie, our “Better” product line designed to be equal to or better than the comparable national or regional brand category leader.
Three Quality Tiers

13
Rebuilding Trust in Our Brand
Winn & Lovett, our “Best” product line for premium tier products.
Three Quality Tiers

14
Investing Capital in Our Stores
Major remodel initiative began in the second half of FY07 to address dated store conditions Dramatically improves store appearance with a focus on fresh products Caters to customer needs and enhances shopping experience Potential to drive significant traffic and revenue increases
24 Remodels completed as of end of Q1 FY08
Encouraged by initial progress
Plan to remodel 75 stores per year at cost of $1.9 million per store
FY2008: Investing $140 million on our remodel initiative

15
Investing Capital in Our Stores
Two types of remodels – “offensive” and “defensive”
Offensive remodels Done in stores that currently face direct competition No new competitive openings expected in current fiscal year Offensive remodels have high potential for sales increases Sales lift(1) measures actual year over year sales increases
Defensive remodels Stores facing new competitive openings in the current fiscal year May not lead to absolute sales lift but necessary to defend against loss of existing sales Previous competitive openings against non-remodeled stores gives us good data to
estimate the impact of unaddressed new competition Sales lift(1) calculation based on actual year over year sales increases adjusted for
estimated sales impact of new competitive openings
We are primarily focused on offensive remodels Of 24 remodels completed, 15 are offensive and 9 are defensive Next remodels are expected to be 80% offensive and 20% defensive
“Offensive” compared to “Defensive”
(1)The sales lift calculation for offensive and defensive remodels excludes the post grand re-opening period, meaning the four-week period of heavy promotions, which is therefore not included in our progress report.

16
Investing Capital in Our Stores
Remodels are meeting expectations
Of 24 remodels completed, 3 still in grand reopening phase
Weighted average sales lift on remaining 21 is approximately 13.3% as of end of Q1 FY08 Lift for 12 offensive remodels is 15.0%. Lift for 9 defensive remodels (adjusted for estimated competitive impact(1)) is
11.2%.
Increases in both transaction count and basket size in offensive remodels (transaction count increased 8.6%; basket size increased 6.1%)
(1)Estimated competitive impact is based on management’s assessment of the sales impact from a new competitive store opening. This assessment is based on the sales impact Winn-Dixie has experienced in the past when a competitor has opened in our operating region.

17
Investing Capital in Our Stores
75 remodels planned 25 stores by end of 2Q FY2008 50 additional stores by end of 4Q FY2008
Company expects strong results from remodels over time We target a 10% sales lift in the first year following completion of the
remodel Store remodels incur some one-time costs (e.g., advertising, additional
labor costs and supplies) ~ $150k per store Bottom-line improvement resulting from FY2008 store remodels is not
expected to be evident until first half of FY2009
FY08 Remodels

18
Merchandising for the Neighborhood
Aligned Merchandising and Marketing departments to better serve the neighborhoods in which we operate; Hispanic, Urban, Affluent, Kosher and Resort
Provide the right products for each neighborhood that we serve
Focused on keeping our 521 stores Clean, Fresh, Friendly, and Local
Building a stronger and more competitive Winn-Dixie

19
Training and Developing our Associates
Provided defined career path for Associates • Created environment for growth, trust and excitement in one of the most crucial parts of
operation.
Attracting talent from outside; hired 60 new experienced Store Directors
Presidents Club – rewarding our best performing Store Directors with a long term incentive award under the Winn-Dixie Equity Incentive Plan (EIP).
80 Store Directors were selected based on the following performance metrics: Total Store Sales Total Store Shrink % Total Store EBITDA % Compliance
Continued success depends on making sure we properly motivate our Associates to execute on all initiatives
Motivated Associates

20
Our Strategy
Rebuilding trust in our brand Investing capital in our stores Merchandising for the neighborhood Training and developing our Associates Achieving profitable sales
Adjusted EBITDA as measure of performance ID store sales on a two year annualized growth rate Improving gross margin and leveraging expenses Net operating loss carry forward (NOL) Capital Expenditures – Fiscal 2008 Depreciation and amortization – Fiscal 2008 Other non cash and cash items – Fiscal 2008
21
Focus on Achieving Profitable Sales
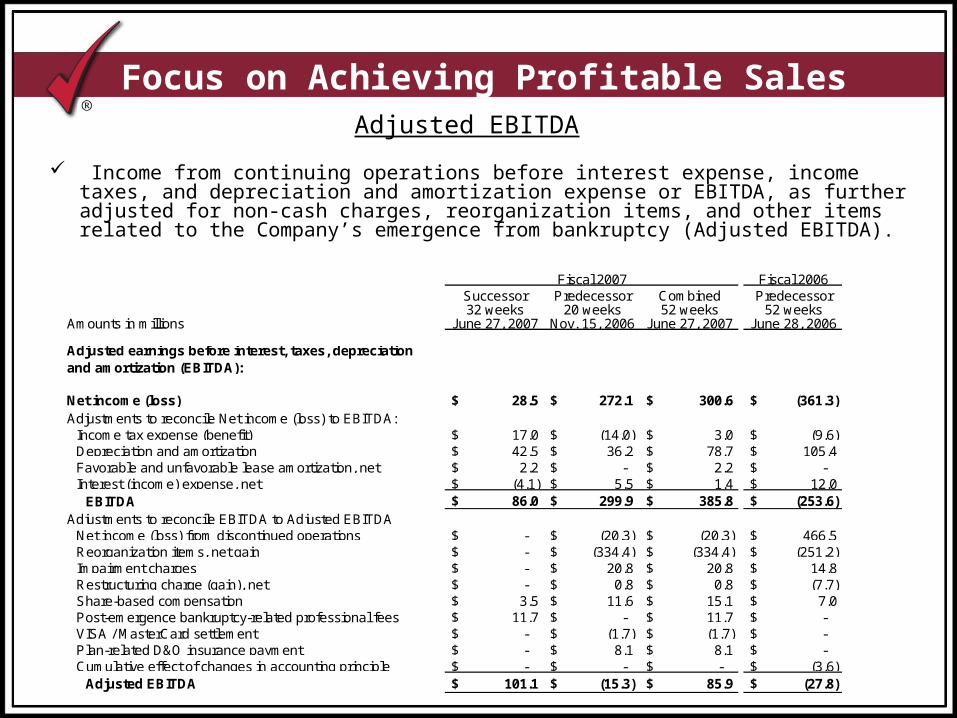
Income from continuing operations before interest expense, income taxes, and depreciation and amortization expense or EBITDA, as further adjusted for non-cash charges, reorganization items, and other items related to the Company’s emergence from bankruptcy (Adjusted EBITDA).
Adjusted EBITDA
Fiscal 2007 Fiscal 2006Successor Predecessor Combined Predecessor32 weeks 20 weeks 52 weeks 52 weeks
Amounts in millions June 27, 2007 Nov. 15, 2006 June 27, 2007 June 28, 2006
Adjusted earnings before interest, taxes, depreciation and amortization (EBITDA):
Net income (loss) $ 28.5 $ 272.1 $ 300.6 $ (361.3)Adjustments to reconcile Net income (loss) to EBITDA:
Income tax expense (benefit) $ 17.0 $ (14.0) $ 3.0 $ (9.6)Depreciation and amortization $ 42.5 $ 36.2 $ 78.7 $ 105.4 Favorable and unfavorable lease amortization, net $ 2.2 $ - $ 2.2 $ - Interest (income) expense, net $ (4.1) $ 5.5 $ 1.4 $ 12.0
EBITDA $ 86.0 $ 299.9 $ 385.8 $ (253.6)Adjustments to reconcile EBITDA to Adjusted EBITDA
Net income (loss) from discontinued operations $ - $ (20.3) $ (20.3) $ 466.5 Reorganization items, net gain $ - $ (334.4) $ (334.4) $ (251.2)Impairment charges $ - $ 20.8 $ 20.8 $ 14.8 Restructuring charge (gain), net $ - $ 0.8 $ 0.8 $ (7.7)Share-based compensation $ 3.5 $ 11.6 $ 15.1 $ 7.0 Post-emergence bankruptcy-related professional fees $ 11.7 $ - $ 11.7 $ - VISA / MasterCard settlement $ - $ (1.7) $ (1.7) $ - Plan-related D&O insurance payment $ - $ 8.1 $ 8.1 $ - Cumulative effect of changes in accounting principle $ - $ - $ - $ (3.6)
Adjusted EBITDA $ 101.1 $ (15.3) $ 85.9 $ (27.8)

22
Focus on Achieving Profitable Sales
Reported identical store sales include the impacts hurricane Katrina and Wilma had on the business
In Q2 FY06, 113 stores were impacted by Wilma in the Miami-Ft. Lauderdale and West Palm-Ft. Pierce DMAs
In Q2 through Q4 FY06, 65 stores were impacted by Katrina in the New Orleans, Baton Rouge, Lafayette, Biloxi-Gulfport, Hattiesburg-Laurel and Meridian DMAs
On a two-year annualized growth rate, we have continued to show positive identical store sales trends in each sequential quarter
Positive identical store sales trend
Q1 Q2 Q3 Q4 Total
FY06 Reported ID% (1.9%) 8.1% 7.5% 9.4% 5.9%FY07 Reported ID% 5.1% (0.5%) 1.6% 1.3% 1.6%
2-YR Annualized Growth% 1.6% 3.7% 4.5% 5.3% 3.8%

23
Focus on Achieving Profitable Sales
Balancing gross margins and sales growth to remain profitable
Increasing sales and the mix between perishable and non-perishable
Operating and administrative expenses are under control
Increasing sales per square foot
Positive Adjusted EBITDA
Improving gross margins and leveraging expenses
Gross margin and operating and administrative expenses include $3.2 million and $17.4 million from favorable development of prior years’ insurance claims, primarily related to workers’ compensation, respectively.
FY 2007 FY 2006 Getting Better($ in millions, except for squre foot amount)
Net Sales 7,201$ 7,133$ up $68 million, or 1.0%Gross Profit on sales 1,936$ 1,851$ up $85 million, or 4.6%Gross Margin % of Sales 26.9% 25.9% up 100 basis points
Operating & Admin Expense 1,964$ 1,991$ down $27 million, or 1.4%Operating & Admin Exp % of Sales 27.3% 27.9% down 60 basis points
Sales per Sq Foot 298.8$ 285.3$ up $13.5 million, or 4.7%Adjusted EBITDA 85.9$ (27.8)$ up $113.7 millionAdjusted EBITDA % of Sales 1.2% -0.4% up 160 basis points

24
Focus on Achieving Profitable Sales
Net operating loss carry forward for federal income tax purposes or “NOL” is about $480 million, as of June 27, 2007.
NOL will increase as we settle the remaining outstanding bankruptcy claims and distribute an approximately 8 million shares of our stock The 8 million shares are included in our reported 53.9 million shares outstanding
The amount by which our NOL will increase will be determined based on the current market value of our stock at the time these additional shares are distributed
For example: assume the closing stock price is $20 per share on the date that the 8 million shares are distributed, our NOL would increase by about $160 million, giving us a total NOL of $640 million.
We anticipate making an election with our 2007 Federal tax return in March, which will allow us to fully utilize our NOL to offset our “taxable income” as we generate it.
Net operating loss carry-forward

25
Focus on Achieving Profitable Sales
Capex expected to total $250 million, excluding capital leases
$140 million budgeted for the store remodeling program(75 stores @ $1.9 million each)
Other Capex expected to be approximately $110 million: Approximately $60 million for retail store maintenance capital, with the
remaining amount for IT systems, back-up generators, new stores, and warehouse and manufacturing equipment
FY08 Capital Expenditures

26
Focus on achieving profitable sales
Other non-cash items include depreciation and amortization, share based compensation expense and asset write downs
FY08 non-cash charges are estimated to be ~ $100 to $110 million Depreciation and amortization expense for FY08 are expected to be ~ $90
to $95 million The majority of the remaining charges are related to non-cash share-based
compensation
Cash items include legal fees from Chapter 11 and interest expense, primarily on capital leases FY08 cash items are estimated to be about $10 million due to Chapter 11
professional fees and interest expense, primarily on capital leases
FY08 other non-cash and cash items

27
Our Strategy
Rebuilding trust in our brand
Investing capital in our stores
Merchandising for the neighborhood
Training and developing our Associates
Achieving profitable sales

28
Meeting Agenda
8:00AM – 8:30AM: Breakfast
8:30AM – 8:50AM: Winn-Dixie - “The Brand”
8:50AM – 9:30AM: Management Presentation
9:30AM – 9:45AM: Break
9:45AM – 10:45AM: Q&A
11:00AM – 1:00PM: Store Tours

AppendixWinn Dixie Stores, Inc.
October 9, 2007
30
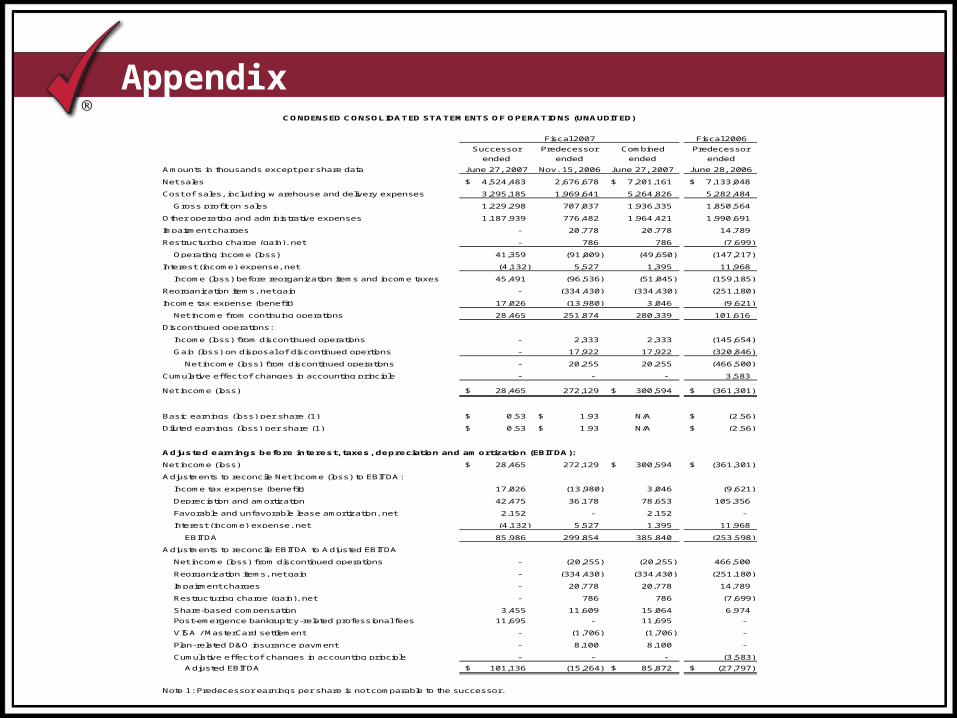
Appendix CONDENSED CONSOLIDATED STATEM ENTS OF OPERATIONS (UNAUDITED)
Fiscal 2007 Fiscal 2006
Successor Predecessor Combined Predecessor32 w eeks ended
20 w eeks ended
52 w eeks ended
52 w eeks ended
Amounts in thousands except per share data June 27, 2007 Nov. 15, 2006 June 27, 2007 June 28, 2006
Net sales $ 4,524,483 2,676,678 $ 7,201,161 $ 7,133,048
Cost of sales, including w arehouse and delivery expenses 3,295,185 1,969,641 5,264,826 5,282,484
Gross prof it on sales 1,229,298 707,037 1,936,335 1,850,564
Other operating and administrative expenses 1,187,939 776,482 1,964,421 1,990,691
Impairment charges - 20,778 20,778 14,789
Restructuring charge (gain), net - 786 786 (7,699)
Operating income (loss) 41,359 (91,009) (49,650) (147,217)
Interest (income) expense, net (4,132) 5,527 1,395 11,968
Income (loss) before reorganization items and income taxes 45,491 (96,536) (51,045) (159,185)
Reorganization items, net gain - (334,430) (334,430) (251,180)
Income tax expense (benef it) 17,026 (13,980) 3,046 (9,621)
Net income f rom continuing operations 28,465 251,874 280,339 101,616
Discontinued operations:
Income (loss) f rom discontinued operations - 2,333 2,333 (145,654)
Gain (loss) on disposal of discontinued opertions - 17,922 17,922 (320,846)
Net income (loss) f rom discontinued operations - 20,255 20,255 (466,500)
Cumulative ef fect of changes in accounting principle - - - 3,583
Net income (loss) $ 28,465 272,129 $ 300,594 $ (361,301)
Basic earnings (loss) per share (1) $ 0.53 $ 1.93 N/A $ (2.56)
Diluted earnings (loss) per share (1) $ 0.53 $ 1.93 N/A $ (2.56)
Adjusted earnings before interest, taxes , depreciation and am ortization (EBITDA):
Net income (loss) $ 28,465 272,129 $ 300,594 $ (361,301)
Adjustments to reconcile Net income (loss) to EBITDA:
Income tax expense (benef it) 17,026 (13,980) 3,046 (9,621)
Depreciation and amortization 42,475 36,178 78,653 105,356
Favorable and unfavorable lease amortization, net 2,152 - 2,152 -
Interest (income) expense, net (4,132) 5,527 1,395 11,968
EBITDA 85,986 299,854 385,840 (253,598)
Adjustments to reconcile EBITDA to Adjusted EBITDA
Net income (loss) f rom discontinued operations - (20,255) (20,255) 466,500
Reorganization items, net gain - (334,430) (334,430) (251,180)
Impairment charges - 20,778 20,778 14,789
Restructuring charge (gain), net - 786 786 (7,699)
Share-based compensation 3,455 11,609 15,064 6,974
Post-emergence bankruptcy-related professional fees 11,695 - 11,695 -
VISA / MasterCard settlement - (1,706) (1,706) -
Plan-related D&O insurance payment - 8,100 8,100 -
Cumulative ef fect of changes in accounting principle - - - (3,583)
Adjusted EBITDA $ 101,136 (15,264) $ 85,872 $ (27,797)
Note 1: Predecessor earnings per share is not comparable to the successor.

31
Appendix CONDENSED CONSOLIDATED BALANCE SHEETS (UNAUDITED)
Dollar amounts in thousands except par value Successor PredecessorASSETS June 27, 2007 June 28, 2006Current assets:
Cash and cash equivalents $ 201,946 187,543 Marketable securities 4,836 14,308 Trade and other receivables, less allow ance for doubtful
receivables of $3,663 ($9,537 at June 28, 2006) 94,173 152,237 Insurance claims receivable 22,900 46,162 Income tax receivable 15,883 40,427 Merchandise inventories, less LIFO reserve of
$5,107 ($152,729 at June 28, 2006) 641,458 477,885 Prepaid expenses and other current assets 40,982 48,827 Assets held for sale - 44,710
Total current assets 1,022,178 1,012,099 Property, plant and equipment, net 300,174 496,830 Intangible assets, net 331,803 38,979 Other assets, net 16,736 60,241
Total assets $ 1,670,891 1,608,149
LIABILITIES AND SHAREHOLDERS’ EQUITY (DEFICIT)
Current liabilities:Current borrow ings under credit facilities $ - 40,000 Current portion of long-term debt - 232 Current obligations under capital leases 6,289 3,617 Accounts payable 262,787 229,951 Reserve for self -insurance liabilities 73,451 74,905 Accrued w ages and salaries 76,334 80,495 Accrued rent 39,685 43,942 Accrued expenses 83,763 108,281 Liabilities related to assets held for sale - 9,206
Total current liabilities 542,309 590,629 Reserve for self -insurance liabilities 147,339 151,131 Long-term borrow ings under credit facilities 14 - Long-term debt - 164 Unfavorable leases 138,700 - Obligations under capital leases 18,622 5,369 Other liabilities 26,966 24,990
Total liabilities not subject to compromise 873,950 772,283 Liabilities subject to compromise - 1,117,954
Total liabilities 873,950 1,890,237 Shareholders’ equity (def icit): Predecessor common stock, $1 par value. Authorized 400,000,000 shares; 154,332,048 shares issued; 141,858,015 shares outstanding at June 28, 2006 - 141,858 Successor common stock, $0.001 par value. Authorized 400,000,000 shares; 54,000,000 shares issued; 53,901,473 shares outstanding at June 27, 2007 54 -
Additional paid-in-capital 762,401 34,874 Retained earnings (accumulated def icit) 28,465 (438,015) Accumulated other comprehensive income (loss) 6,021 (20,805)
Total shareholders’ equity (def icit) 796,941 (282,088) Total liabilities and shareholders’ equity (def icit) $ 1,670,891 1,608,149

32
Appendix CONDENSED CONSOLIDATED STATEM ENTS OF CASH FLOWS (UNAUDITED)
Amounts in thousands Fiscal 2007 Fiscal 2006Successor Predecessor Combined Predecessor32 w eeks
ended20 w eeks
ended52 w eeks
ended52 w eeks
ended
June 27, 2007 Nov. 15, 2006 June 27, 2007 June 28, 2006Cash f low s f rom operating activities: Net income (loss) $ 28,465 272,129 300,594 (361,301) Adjustments to reconcile net income (loss) to net cash provided by (used in) operating activities: Loss (gain) on sales of assets, net 1,566 (35,373) (33,807) (112,748) Reorganization items, net gain - (334,430) (334,430) (251,180) Impairment charges - 20,857 20,857 23,292 Depreciation and amortization 42,475 36,274 78,749 111,336 Deferred income taxes 17,026 - 17,026 - Share-based compensation, net 3,455 11,609 15,064 2,391 Change in operating assets and liabilities: Favorable and unfavorable leases, net 2,152 - 2,152 - Trade, insurance and other receivables 17,762 29,850 47,612 20,875 Merchandise inventories 15,305 (31,564) (16,259) 307,602 Prepaid expenses and other current assets 16,313 (2,426) 13,887 37,637 Accounts payable (18,288) (20,458) (38,746) 57,096 Lease liability on closed facilities - (838) (838) 415,993 Income taxes payable/receivable 32,436 (2,944) 29,492 (8,990) Reserve for self -insurance liabilities (12,988) (1,203) (14,191) 6,027 Accrued expenses and other (50,030) (3,440) (53,470) 2,221 Net cash provided by (used in) operating activities before reorganization items 95,649 (61,957) 33,692 250,251 Cash ef fect of reorganization items - (11,085) (11,085) (55,027) Net cash provided by (used in) operating activities 95,649 (73,042) 22,607 195,224 Cash f low s f rom investing activities: Purchases of property, plant and equipment (68,517) (23,888) (92,405) (30,538) Decrease in investments and other assets, net 12,672 15,067 27,739 6,592 Sales of assets 2,071 83,012 85,083 167,630 Purchases of marketable securities (2,165) (4,321) (6,486) (9,120) Sales of marketable securities 1,325 14,991 16,316 14,158 Other, net 164 (308) (144) 683 Net cash (used in) provided by investing activities (54,450) 84,553 30,103 149,405 Cash f low s f rom f inancing activities: Gross borrow ings on credit facilities 4,955 7,690 12,645 698,542 Gross payments on credit facilities (4,941) (47,690) (52,631) (903,545) Increase in book overdraf ts 15,063 164 15,227 4,178 Principal payments on long-term debt and capital leases (3,372) (981) (4,353) (1,804) Debt issuance costs (8,829) (366) (9,195) (721) Other, net - - - 858 Net cash provided by (used in) f inancing activities 2,876 (41,183) (38,307) (202,492) Increase (decrease) in cash and cash equivalents 44,075 (29,672) 14,403 142,137 Cash and cash equivalents classif ied as assets held for sale - - - (16,735) Cash and cash equivalents at beginning of period 157,871 187,543 187,543 62,141 Cash and cash equivalents at end of period $ 201,946 157,871 201,946 187,543