executive directors for personal use only
TRANSCRIPT

SciGen Ltd and its subsidiaries
Corporate Directory
1
Directors Executive Chairman and Chief Executive Director
Slawomir Ziegert
Executive Chairman and Chief Executive Officer
Executive Directors
Jenny Low
Senior Vice President & Corporate Secretary
Adam Aleksandrowicz
Chief Financial Officer
Non-Executive Directors
Kenneth Gross
Non-Executive Director
Chairman, Audit Committee
Mateusz Patryk Kosecki
Non-Executive Director
Amol Jashvant Shah
Non-Executive Director
Adam Wilczega
Non-Executive Director
Member, Audit Committee
Marcin Dukaczewski
Non-Executive Director
Adam Tomasz Polonek
Non-Executive Director
Joanna Szymanska-Bulska
Non-Executive Director
Secretaries Lai Leng Wong
Jenny Low
Senior Vice President & Corporate Secretary
For
per
sona
l use
onl
y

SciGen Ltd and its subsidiaries
Corporate Directory
2
Principal registered office in Singapore 152 Beach Road, #26-07/08 Gateway East, Singapore 189721
Principal registered office in Australia Suite 1, 13B Narabang Way, Belrose, NSW 2085, Australia Share and debenture registers Computershare Investor Services Pty Limited Level 5, 115 Grenfell Street, Adelaide,
South Australia, 5000, Australia Ph: 1300 556 161 (within Australia) Ph: (61) 3 9615 5970 (outside Australia) Fax: (61) 8 8236 2305 Website: www.computershare.com
Auditors Deloitte & Touche LLP 6 Shenton Way #32-00 DBS Building Tower Two Singapore 068809 Partner-in-charge: Ng Peck Hoon
(appointed in June 30, 2010) Solicitors Allen & Gledhill Norton Rose
Bankers ANZ Bank, Ltd. Bank Leumi Israel Citibank, N.A. DBS Bank Ltd Kookmin Bank, Ltd.
Westpac Bank HDFC Bank Bank of Communications Stock exchange listings SciGen Ltd is a public company incorporated in Singapore.
Shares are held by Chess Depository Nominees in Australia and are publicly traded on the Australian Stock Exchange in the form of CHESS Units of Foreign Securities (CUFS) on a 1 CUF for 1 fully paid ordinary share basis.
Website address www.scigenltd.com Currency The annual report is prepared in United States dollars.
For
per
sona
l use
onl
y
3
SCIGEN LTD AND ITS SUBSIDIARIES
REPORT OF THE DIRECTORS
The directors present their report together with the audited consolidated financial statements of the Group and statement of financial position and statement of changes in equity of the Company for the financial year ended December 31, 2010. Directors
The directors in office at the date of this report are as follows:
Mr. Slawomir Ziegert Mr. Adam Aleksandrowicz (Appointed March 3, 2011) Ms. Jenny Low Mr. Kenneth Gross
Mr. Adam Wilczega Ms. Joanna Szymanska-Bulska
Mr. Marcin Dukaczewski Mr.Adam Tomasz Polonek
Mr. Mateusz Patryk Kosecki Mr. Amol Jashvant Shah
Mr. Ryszard Krzysztof Krauze (Resigned March 22, 2011) Dr. Marian Gorecki (Resigned March 3, 2011) Mr. Martin Cooper (Resigned March 3, 2011)
Principal activities
During the year, the principal activities of the Group and the Company consisted of:
a. Business development; b. Collaborative research & development of biotechnology derived products; c. Sales, marketing and distribution;
d. Health registration of those products; and e. Manufacturing - Establishment of facilities for the manufacture of Insulin.
Dividends
Due to the capital requirements and early stage growth of the Company, the Directors have not declared a dividend for the financial year ended December 31, 2010. No dividends have been paid, declared or proposed since the end of the Company‟s preceding financial year. F
or p
erso
nal u
se o
nly

4
Results and review of operations and activities
A summary of consolidated revenue and results by significant geographical segments is set out below:
Segment revenue Segment results
Year Year Year Year
ended ended ended ended
31/12/2010 31/12/2009 31/12/2010 31/12/2009
US$’000 US$’000 US$’000 US$’000
Singapore 2,555 2,208 (24) (9)
Australia 3,522 2,064 1,348 1,630
Korea 461 554 93 (201)
Thailand 2,213 1,673 298 219
Vietnam 1,682 1,074 268 202
Philippines 1,351 1,017 240 130
Israel 164 - (10,636) (15,039)
India - 2,553 (801) (6,968)
China - - (907) (3,611)
Others 421 108 231 (44)
Total for all segments 12,369 11,251 (9,890) (23,691)
Unallocated revenue less unallocated expenses (7,772) (18,358)
Loss from ordinary activities before income tax (17,662) (42,049)
Income tax credit 7,464 89
Net loss for the year (10,198) (41,960)
Comments on the operations and the results of those operations are set out below:
Revenue surpassed the preceding year on the back of improved performance from all regions except India,
coupled with the profit sharing revenue of US$0.1 million which arose from the commercialisation of
Bioton‟s insulin in People‟s Republic of China.
The stop in supply to India following disruptions in payments from the distributor, contributed to a decline
in revenue by US$2.6 million as compared to last year. A new product, Seruderm™, was launched during
the third quarter in Australia, where initial response from the market has been encouraging.
Net loss for the year was primarily due to write-down of carrying value of the facility at Israel amounting
to US$6.1 million and Sci-B-Vac™ licences amounting to US$2.7 million. Subsequently, the carrying
value of the facility and licences is reclassified to Assets Held for Sale in the Consolidated Statement of
Financial Position. In addition, Group depreciation increased by US$0.8 million from the subsidiaries in
Israel and China as the manufacturing facilities were put to use.
The notable reduction in net losses from the preceding year was attributable to the high provision for
impairment loss and write-off of assets in 2009, which amounted to US$30.1 million coupled with the
provision for the termination benefits payable to the ex-CEO of US$2.6 million. Improvement in results
was further enhanced with recognition of deferred tax asset of US$7.5 million this year. For
per
sona
l use
onl
y
5
Loss per share
Group
Year ended Year ended
31/12/2010 31/12/2009
US$’000 US$’000
Basic loss per share (1,766) (7,285)
Arrangements to enable directors to acquire benefits by means of the acquisition of shares and
debentures
Neither at the end of the financial year nor at any time during the financial year did there subsist any
arrangement whose object is to enable the directors of the company to acquire benefits by means of the
acquisition of shares or debentures in the company or any other body corporate, except for the items
mentioned in paragraph 3 below.
Directors’ interests in shares and debentures
The directors of the Company holding office at the end of the financial year had no interest in the share
capital and debenture of the Company and related corporations as recorded in the register of directors‟
shareholding kept by the Company under Section 164 of the Singapore Companies Act except as follows:
Holdings in
which the
director
Holdings registered is deemed to
in the name of the director have an interest
At At
beginning of beginning of
Name of directors the year or At the year or At
and companies in date of appointment, end of the date of appointment, end of the
which interests are held if later year if later year
Ordinary shares
Holding company
Bioton S.A
Ryszard K. Krauze - - 500,026,507 524,786,735
Convertible debentures
Subsidiary company
SciGen BioPharma Pvt. Ltd.
Amol Jashvant Shah - - - 750,000
For
per
sona
l use
onl
y
6
By virtue of Section 7 of the Singapore Companies Act, Mr. Ryszard K. Krauze is deemed to have interests in
the share capital of the Company and its wholly-owned subsidiaries, at the beginning and end of the financial
year, by virtue of his deemed interest of not less than 20% in the issued share capital of Bioton S.A., a
shareholder of the Company.
Directors’ receipt and entitlement to contractual benefits
Since the beginning of the financial year, no director has received or become entitled to receive a benefit
which is required to be disclosed under section 201(8) of the Singapore Companies Act, by reason of a
contract made by the company or a related corporation with the director or with a firm of which he is a
member, or with a company in which he has a substantial financial interest except for salaries, bonuses and
other benefits as disclosed in the financial statements. Certain directors received remuneration from related
corporations in their capacity as directors and/or executives of those related corporations.
Share options
(a) Options to take up unissued shares
During the financial year, no option to take up unissued shares of the company or any corporation in the Group was granted.
(b) Options exercised
During the financial year, there were no shares of the company or any corporation in the Group issued
by virtue of the exercise of an option to take up unissued shares. (c) Unissued shares under option
At the end of the financial year, there were no unissued shares of the company or any corporation in the Group under option.
Significant changes in the state of affairs
Significant changes in the state of affairs of the Group and the Company during the financial year are as follows:
a. Major investment in SciGen Ltd‟s subsidiary in India.
On March 15, 2010, SciGen Ltd (the “Company”) announced that it had signed an investment
agreement with Anglo Gulf Ltd (the “Anglo Gulf”) for the issue and allotment of new shares in SciGen
BioPharma Pvt Ltd (the “Subsidiary”), which is 100% owned by the Company and operating in India.
This transaction involves a cash injection of US$8 million by Anglo Gulf for 49.99% interest in the
equity of the Subsidiary. Following the issue of new shares in the Subsidiary to Anglo Gulf, the
Company will continue to retain control of the Subsidiary.
For
per
sona
l use
onl
y
7
The funds injected by Anglo Gulf will expedite the completion of the manufacturing facility of the
Subsidiary. The facility, when completed, will be manufacturing recombinant human insulin and
potentially other biotechnological products.
Anglo Gulf is a part of the Indian MJ Group which has 30 years presence in the pharmaceutical
industry and extensive experience in the development, sales and marketing of biotechnology derived
and other pharmaceutical products.
b. Change of shareholding of Bioton S.A.
On May 7, 2010, SciGen Ltd announced that Bioton S.A. (“Bioton”), which holds over 90% of the
shares in SciGen Ltd has increased its shareholding from 90.54% to 95.02%.
The additional shares were acquired at AUD7,428,068 and payment was made in the form of ordinary
shares of Bioton, where Bioton delivered 89,474,460 newly issued ordinary shares (“New Shares”) in
Bioton at the issue price of PLN0.22 per one New Share with an implied swap ratio of 3.6136 New
Shares per one share in SciGen. The shares are purchased from HBS S.A., acting as representative for
certain minority shareholders of SciGen Ltd.
In July 2010, Bioton acquired an additional 3,000,000 ordinary shares in SciGen Ltd, bringing its
shareholding to 95.57% at date of this report.
c. Agreement with Bayer HealthCare (“Bayer”) in People‟s Republic of China (“China”)
In the preceding year, on July 10, 2009, SciGen Ltd (the “Company”) announced that together with its
holding company, Bioton S.A. (“Bioton”), an exclusive supply and distribution agreement (the
“Distribution Agreement”) has been signed with Bayer HealthCare (“Bayer”). The Distribution
Agreement is to realise the Group‟s strategic goal of expansion of the insulin franchise through
alliances with blue-chip pharma companies on most important global markets. Collaboration with
Bayer facilitates the availability of SciLin™ to diabetes patients throughout China.
Following the execution of the agreement, the Company entered into a profit sharing agreement with
Bioton, whereby the Company will receive a profit share of the revenues from the Distribution
Agreement. The profit share is specified as price per vial/cartridge of the product sold and paid by
Bayer in China for a period of 15 years starting from the date of the first commercial sales of the
product under the Distribution Agreement.
Matters subsequent to the end of the financial year
In the opinion of the directors, no item, transaction or event of a material and unusual nature has arisen in the
interval between the end of the financial year and the date of this report which would substantially affect the
results of the Group and of the Company for the financial year in which this report is made.
For
per
sona
l use
onl
y
8
Likely developments and expected results of operations
Likely developments in the operations of the Group and the Company at the date of this report include:
(a) The main focus for the Group during the financial year ending December 31, 2011 is to commission the start-up of its packaging facility line in China and to continue with the construction of its facility in India.
(b) The Group will launch at least four new products into the Asia Pacific market within the first half year of 2011. The Group will continually look for opportunities for new products and technology to
add to its portfolio.
(c) The Company will continue to register and commence commercialization of its products in the countries where the Company has rights of registration, sales and marketing.
(d) The Company will look into potential divestment of its subsidiary in Israel, SciGen (I.L.) Ltd and the
related intangible assets, following the decision aimed at focusing on recombinant human insulin as its core product and development of insulin-related products, which is the global strategy of its ultimate holding company, Bioton S.A.
Further information on likely developments in the operations of the Group and the Company and the expected
results of operations have not been included in this report, because the directors are of the opinion that such
information is commercially sensitive.
Going concern
The management is responsible for preparation and fair presentation of these financial statements in
accordance with provisions of the Singapore Companies Act and Singapore Financial Reporting Standards.
The directors of the Company consider that it is appropriate for the financial statements to be prepared on a
going concern basis as the Group and the Company will have sufficient funding to carry out its operating and
investment activities based on the financial support given by the ultimate holding company.
For
per
sona
l use
onl
y

9
Director Experience
Mr. Slawomir Ziegert
(Age 45)
Mr. Slawomir Ziegert, is a medical doctor, graduate of the Medical University in
Gdańsk. He has been connected with the pharmaceutical industry for over sixteen years,
working in Poland and abroad for such concerns as Eli Lilly, Egis Group (a part of
Servier group) and Ipsen. He has got enormous business experience covering different
sectors of the pharmaceutical industry, including biotechnology, in particular business
development within the scope of endocrinology and treatment of diabetes. In 1993-
2004 he worked in the Polish branch of Eli Lilly, one of the world‟s leading
pharmaceutical concerns and manufacturers of recombinant human insulin and insulin
analogues, where he was responsible for the development of diabetes business, relations
with the diabetes environment and governmental affairs.
In 1998-2000 he was also Eli Lilly's Country Manager in Slovakia, supervising, among
others, the development of sale of insulins and antibiotics. In 2004-2005 he was CEO of
Egis Pharmaceuticals (a part of Servier group) where he was responsible for the Baltic
States area. In 2006-2009 he was CEO of Ipsen Poland. Working for Ipsen Poland, he
was responsible for introduction of somatostatin analogue and IgF1 to the Polish market
and for improvement of efficiency of marketing and sales activities. He has taken many
manager courses and training abroad. He is fluent in: English, Russian, German and
Slovak.
Since November 9, 2009 he has been holding the position of the President of the
Managing Board of Biton S.A. and is CEO of the Company.
Mr. Adam
Aleksandrowicz
(Age 38)
(appointed March 3,
2011)
Mr. Adam Aleksandrowicz, the financial director and member of the Managing Board
of Bioton S.A, is a graduate from the University of Gdańsk. He has extensive
knowledge and experience in corporate finance management, in particular in companies
in pharmaceutical industry. Between 2006-2009 he worked for AstraZenaca, one of the
world‟s leading pharmaceutical concerns, holding the position of CFO in AstraZeneca‟s
companies in Poland and in Russia. Prior to this, Mr. Aleksandrowicz was with Pliva
Kraków S.A., a subsidiary of TEVA, where he started CFO and progressed to the
position of President of the Managing Board. Mr. Aleksandrowicz had also worked as a
manager in Corporate Finance in PriceWaterhouseCoopers, Poland, working on
mergers and acquisitions, evaluation of businesses, restructuring of companies and
optimization of financing structures of company development. Before taking up the
work at PriceWaterhouseCoopers he worked as Corporate Finance consultant at O.M.
Investment Sp. z o.o and in investors relations department at Bank Gdański S.A. He has
completed a number of postgraduate studies, among others Executive Management
Program University of Michigan School of Business Administration in the United
States.
For
per
sona
l use
onl
y

10
Director Experience
Ms. Jenny Low
(Age 59)
Ms. Jenny Low is the Senior Vice President & Corporate Secretary of the Company.
Ms. Low, who has been with the company for over 18 years, is the longest service staff
member and has been involved in many areas of the Company‟s operations, including
the listing of the Company in ASX. Prior to her appointment as the Senior Vice
President in October 2006, Ms. Low was the Chief Financial Officer of the Company.
Ms. Low, a Chartered Accountant, held senior accountancy positions in various
companies in both Malaysia and Singapore. With over 30 years of accounting
experience, Ms. Low is well versed with accounting practices and tax laws of the Asia-
Pacific region. Before joining SciGen in September 1991, Ms. Low was with Abacus
Distribution Systems Pte Ltd, a company owned jointly by the major airline companies
in Asia.
Mr. Kenneth Gross
(Age 81)
Mr. Kenneth Gross co-founded Goldmark Plastic Compounds in 1957. The Company
has since become a major distributor of plastic raw materials within the United States.
In addition, Mr. Gross holds a number of directorships in various companies involved
in chemical, metals, engineering resins and lubricating oils.
Joanna Szymańska-
Bulska (Age 47)
Ms. Joanna Szymańska-Bulska is the Member of the Management Board and the
Foreign Markets Director of Bioton. She has over 17 years of experience in
pharmaceutical industry and distribution. During her career, Ms. Szymańska-Bulska
held several management and senior management positions in Ciba Geigy, Novartis,
Phoenix Pharma Aktiengesellschaft, Phoenix Pharma PL (“PPL”), mainly in the field of
sales and marketing. For one year, she was appointed to the position of the Advisor of
the Polish Minister of Health. She has also served as Member of the Polish Pharmacy
Chamber and Member of the Supervisory Board of the PKPP Pharmacy and Chemistry
Chamber. Before joining Bioton, Ms. Szymańska-Bulska was a Chairman of the
international Management Board and CEO of PPP for six years where she had overall
responsibility for PPP.
Mr. Adam Wilczega
(Age 56)
Mr. Adam Wilczega is a graduate of Warsaw School of Economics, where he obtained
the title of MSc in economics. Moreover, in 1991 he completed managers training in
Japan. His professional career started in 1979 at PTHZ Varimex in Warsaw where he
worked as a section manager until 1984. In 1984-1989 he was employed as a director of
Technical and Trade Information Centre in Cairo, Egypt. Then, in the period 1989-1991
he held the position of the Director of PTHZ Varimex in Warsaw. In 1991-1996 he was
the president of the managing board of Future Trading Co. Sp. z o.o. (limited liability
company) in Warsaw. He has been working in the Company since 1996, when he has
become director for foreign co-operation and a Member of the Managing Board. Since
1998 he has been the president of the managing board of BIOTON TRADE Sp. z o.o.
He is the a member of the board of directors of SciGen Ltd. From 1997 till January 15,
2009 he was holding the post of the President of the Managing Board. Since January
15, 2009 he has been Vice President of the Managing Board and since March 2009 he
has been holding the post of Director for Foreign Markets of the Company
For
per
sona
l use
onl
y
11
Director Experience
Marcin Dukaczewski (Age 32)
Mr. Marcin Dukaczewski was trained in International Political and Economical
Relations at the Warsaw University. Since 2001, Mr. Dukaczewski works for the Polish
private-equity fund, Prokom Investments (being the strategic investor in Bioton), where
he started his career with marketing and investor relations positions and moved to
business development. Mr. Dukaczewski has been involved in working for Bioton
Group‟s strategic investments, mergers & acquisitions and IPO projects in
biotechnology, IT, real-estate and oil and gas E&P. Prior to joining Prokom, Mr.
Dukaczewski worked for the Foreign Investors Chamber in Poland, Metro Group and in
the NGO sector.
Adam Tomasz
Polonek (Age 34)
Mr Adam Polonek is a graduate of the Economic Faculty at Academy of Economics in
Poland. Mr. Polonek joined Bioton in 2006 as Deputy Finance Director and since April
2009 as the Finance Director. Mr. Polonek holds also position of Deputy Finance
Director of Bioton Trade Ltd and Member of the Board of BioPartners Polska Ltd,
which are part of the Bioton Group.
Mr. Polonek‟s professional experience includes successful career in one of the leading
investment bank in CEE Europe, CAIB Financial Advisers, which is part of the leading
banking group Unicredit in Europe. During Mr. Polonek‟s career, he was involved in
several Corporate Finance transactions and he has vast experience in stock exchange
markets.
Mateusz Patryk
Kosecki (Age 36)
Mr. Mateusz Kosecki is a graduate of the Executive MBA Program of European
University, Montreux, Switzerland. Mr Kosecki is the Managing Director for Eastern
Europe, Asia and Pacific Region of Bioton S.A. and oversees the operations of the
company in the region and is also responsible for the business development. Mr. Kosecki
possesses extensive experience in international business. From 1995 to 1996 he worked
as the Marketing Manager in Lenex Company in Sofia, Bulgaria. From 1997 to 2001 he
was Head of Foreign Corporate Governance and Operations of Ciech S.A., the biggest
Polish chemical holding company. He has been connected with pharmaceutical industry
for 8 years. From 2002 to 2006, as the Country Manager for Russia of the Polish
pharmaceutical company Ciech Polfa, and from 2006 to 2009 as Regional Director for
Eastern Europe in Bioton S.A.
Amol Jashvant Shah
(Age 45 )
Mr. Amol Shah is the managing director of MJ Biopharm Pvt. Ltd., an Indian based
company possessing a modern facility in Mumbai for manufacturing of life saving
products including Insulin. He focuses on overall supervision of the company and the
development of strategic business alliances. From 1990 to 1995 he worked as a Director
at Anglo Gulf Limited in Dubai where he was responsible for setting up of a new facility
for manufacture of pesticides in Jebel Ali, Dubai and managing of new business
collaboration with multinational companies
For
per
sona
l use
onl
y

12
Director Experience
Mr. Ryszard K.
Krauze
(Age 54)
(resigned March 22,
2011)
Mr. Ryszard Krauze is a graduate of Technical University of Gdańsk. In 1984-1986 he
was employed at Centrala Handlu Zagranicznego Polservice in Warsaw. From 1987
until 1994 he was the owner and director of Innowacyjny Zakład Techniki
Komputerowej Prokom, then Prokom Komputer System R. Krauze. In 1990 he founded
ComputerLand Sp. z o.o. (at present ComputerLand S.A.) where he was holding the
position of the president of the Managing Board since 1992 and in 1993-1994 he was
the vice-president of the supervisory board of that company. Since 1990 he has been the
president of the Managing Board of Prokom Software System Sp. z o.o. (at present
PROKOM Investments S.A.) and in the years 1994-2007 he was the president of the
Managing Board of Prokom International Sp. z o.o. (PROKOM Software S.A.). He
held the position of the vice-president of the supervisory board of Wirtualna Polska
S.A., Zakłady Farmaceutyczne Biolek Sp. z o.o. and Incenti, the chairman of the
supervisory board of PROKOM Internet S.A., KOMA S.A. and The Polished Group
S.A. Moreover, he was also holding position of the president of the Managing Board of
the companies Polfruit Sp. z o.o. (until April 2006), Eurodata Sp. z o.o. (until April
2006) and Context International Textile Limited Sp. z o.o.
(until May 2006).
At present he is the Chairman of the supervisory boards of the following companies:
Petrolinvest S.A., Softbank S.A., Polnord S.A., Zakłady Ogrodnicze C. Ulrich założone
1805 w Warszawie S.A. He is also the vice-chairman of the supervisory board of
Fadesa PROKOM Polska Sp. z o.o., a member of the supervisory board of C2 System
Polska S.A. and RUM IT S.A. He is also a member of the board of directors of the
following companies: Occidental Resources, Siewiergeofizyka, Amiga Inc. and Hakia
Inc.
He is the president of the Managing Board and first honorary president of the Tennis
Club Arka Sp. z o.o. Moreover, he is the president of the managing board of
International Data Technology Sp. z o.o. He is a member of the Polish Business
Roundtable and the vicepresident of the Polish Confederation of Employers. He also
holds the function of an honorary consul of Austria and sits at the senate of The
Academy of International Economic and Political Relations in Gdynia. He is also the
chairman of the board of Ryszard Krauze Foundation. Since 28 March 1996 he has
been the Chairman of the Supervisory Board of Bioton S.A..
For
per
sona
l use
onl
y
13
Director Experience
Mr. Martin Cooper
(Age 44)
(resigned March 3,
2011)
Mr. Martin Cooper is the Chief Financial Officer of the SciGen Group. Mr. Cooper, a
British Citizen, is based in Singapore. He qualified as a Chartered Accountant in 1990
with Deloitte & Touche and has an MBA from Henley Management College, Oxford,
England.
Prior to joining SciGen in October 2006, Mr. Cooper spent 6 years as the Group
Finance Director (“FD”) for the The Parkmead Group Plc (“Parkmead”). Parkmead is a
venture capital company listed on the AIM in London. In addition to his role as FD, he
was also the company secretary and was a Non-Executive Director of a number of early
stage high growth businesses.
Mr. Cooper has extensive experience including restructuring private equity investments,
preparation and appraisal of financial business models, restructuring of finance
departments, maintaining financial controls in fast growth environments as well as
substantial strategic and commercial experience.
Dr. Marian Gorecki
(Age 70)
(resigned March 3,
2011)
Dr. Marian Gorecki received a PhD from the Weizmann Institute of Science and was a
post graduate fellow in Biology Department at the Massachusetts Institute of Technology
(MIT). In 1976, he was appointed Senior Research Scientist and Associate Professor at
the Weizmann Institute, Israel. In 1980, Dr. Gorecki co-founded BioTechnology General
Corp, now Savient Pharmaceuticals, Inc. He was appointed Senior Vice President, Chief
Technical Officer for BTG Corp. and Managing Director for BTG (Israel). He also
served as Chairman and CEO of Mediwound Ltd., a biotechnology company developing
enzyme-based products in the fields of burn and wound management. He is currently
Director of Mediwound Ltd., and Chairman of Thrombotech, a company developing a
peptide to mitigate the side effects of standard stroke treatments and is a consultant to
Clal Biotechnology. Dr. Gorecki was responsible for overseeing the clinical
development, regulatory approval and commercialization of five biotechnology drugs that
are currently marketed worldwide as well as two that are now in Phase III trials. Dr.
Gorecki has more than 21 patents to his name and author to 73 peer-reviewed scientific
articles. Dr. Gorecki is the Chairman of SciGen‟s Scientific Advisory Board and has
been instrumental in the development of the Company‟s product portfolio.
Information on Company Secretaries
Ms. Jenny Low was appointed to the position of company secretary in August 2003. Ms. Jenny Low previously held the role of Chief Financial Officer of the Company for 17 years.
Lai Leng Wong has been the Company Secretary of the Company since 2002.
For
per
sona
l use
onl
y
14
Meetings of directors
The numbers of meetings of the Company's Board of directors and of each board committee held during the financial year ended December 31, 2010, and the numbers of meetings attended by each director were: Full meetings Meetings of committees of directors Audit Remuneration A B A B A B Mr. Kenneth Gross 2 2 2 2 - - Mr. Adam Wilczega 1 1 2 2 - - Ms. Joanna Szymańska-Bulska 1 1 - - - - Mr. Marcin Dukaczewski 2 2 - - - - Mr. Adam Tomasz Polonek 1 1 - - - - Dr. Marian Gorecki (resigned on March 3, 2011) 1 1 2 2 - - Mr. Ryszard Krzysztof Krauze (resigned on March 22, 2011) - - - - - - Mr. Slawomir Ziegert 2 2 - - - - Mr. Mateusz Patryk Kosecki 1 1 - - - - Mr. Amol Jashvant Shah 2 2 - - - - Mr. Martin Cooper (resigned on March 3, 2011) 2 2 2 2 - - Ms. Jenny Low 2 2 - - - -
A = Number of meetings attended
B = Number of meetings held during the time the director held office or was a member of the committee during the year
Key management personnels’ emoluments
The Remuneration Committee, comprising the following non-executive directors: - Dr. Marian Gorecki (Chairman) - Resigned March 3, 2011 - Mr. Ryszard Krauze – Resigned March 22, 2011 - Mr. Adam Aleksandrowicz - Appointed March 3, 2011 - Mr. Marcin Dukaczewski - Appointed March 22, 2011 - Mr. Adam Tomasz Polonek - Appointed March 22, 2011
The Remuneration Committee should comprise entirely of non-executive directors and be chaired by an independent Director. During the year, the remuneration committee did not meet. Dr. Marian Gorecki and Mr. Ryszard Krauze remained on the Remuneration Committee until their resignations on March 3, 2011 and March 22, 2011 respectively. Whilst this is a departure from the recommendation, the Board believes that the new Committee have the knowledge and experience on remunerations in the biopharmaceutical industry.
The Remuneration Committee advises the Board on remuneration policies and practices generally, and makes specific recommendations on remuneration packages and other terms of employment for the Chief Executive Officer (who is also the Executive Chairman) and remuneration for non-executive directors. In reviewing remuneration levels, the Board takes into account financial performance in addition to other goals related to business development and operational issues.
Executive remuneration and other terms of employment are reviewed annually by the Chief Executive Officer having regard to performance against goals set at the start of the year, relevant comparative information and independent expert advice. As well as base salary, remuneration packages include superannuation, performance-related bonuses and fringe benefits.
For
per
sona
l use
onl
y
15
Remuneration packages are set at levels that are intended to attract and retain executives capable of managing the Group and the Company‟s operations.
Remuneration of non-executive directors is determined by the Board within the maximum amount approved by the shareholders from time to time. Options are issued but bonuses are not payable to non-executive directors.
Details of remunerations
Details of the remunerations of the directors and the key management personnel of the Company and the
Group are set out in the following tables. During the year, the directors did not receive remunerations from
the Company, except for those as disclosed in the tables below.
The key management personnel of the Company includes the directors as per pages 9-13 above and the
following executive officers, which also includes the following highest paid executives of the entity:
Adam Allerhand - Commercial Director - Asia Pacific Region
(Until August 31, 2010)
Marcus Poh - Regional Marketing Manager
Yvonne Lim - Group Financial Controller
(From February 1, 2010)
Liza Domingo - Country Manager – Philippines
RC Tulasi - Regional Regulatory Manager
(Until November 24, 2010)
The key management personnel of the Group are the directors of SciGen Ltd (see pages 9-13 above) and
those executives that are involved in the decision making of the Company and the Group. This includes
these group executives who received the highest remuneration for the financial year ended December 31,
2010. The executives are :
Adam Allerhand - Commercial Director - Asia Pacific Region
(Until August 31, 2010)
Jean-Claude Balducci - Country Manager - Australia & New Zealand
Chander Shehkar Sharma - Business Development Executive
Sharon Walters - Business Development Executive
Yaacov R. Hartman - Director of Research & Development
(Until October 31, 2010) For
per
sona
l use
onl
y

16
Key management personnel of SciGen Ltd
Year ended
December 31, 2010
Short-term employee benefits Post-employment benefits
Termination
benefits
Name
Cash
salary
and
fees
Cash
bonus
Non
monetary
benefits
Superan-
nuation
Retirement
&
Insurance
benefits
Amount Total
US$ US$ US$ US$ US$ US$ US$
Non-executive directors
Mr. Kenneth Gross 27,641 - - - - - 27,641
Dr. Marian Gorecki 60,000 - - - - - 60,000
Sub-total non-executive
directors 87,641 - - - - - 87,641
Executive director
Mr. Martin Cooper 142,601 8,495 100,844 8,455 - - 260,395
Ms. Jenny Low 211,032 27,044 6,209 5,089 - - 249,374
Other key management
personnel
Mr. Adam Allerhand 137,092 152,327 54,358 - - - 343,777
(Until August 31, 2010)
Mr. Marcus Poh 97,610 14,666 - 8,250 - - 120,526
Ms. Yvonne Lim 68,829 12,572 - 917 - - 82,318
(From February 1, 2010)
Ms. Liza Domingo 68,913 3,960 5,652 35 - - 78,560
Mr. RC Tulasi 47,597 3,460 11,843 - - - 62,900
(Until November 24,
2010)
Total 861,315 222,524 178,906 22,746 - - 1,285,491
For
per
sona
l use
onl
y

17
Key management personnel of SciGen Ltd (continued)
Year ended
December 31, 2009
Short-term employee benefits
Post-employment
benefits
Termination
benefits
Name
Cash
salary
and
fees
Cash
bonus
Non
monetary
benefits
Superan-
nuation
Retirement
&
Insurance
benefits
Options Total
US$ US$ US$ US$ US$ US$ US$
Non-executive directors
Mr. Paul Freiman 15,000 - - - - - 15,000
(Until June 29, 2009)
Mr. Kenneth Gross 23,686 23,686
Dr. Marian Gorecki 60,000 - - - - - 60,000
Sub-total non-executive
directors 98,686 - - - - - 98,686
Executive director
Mr. Saul A. Mashaal * 120,240 4,416 73,222 - 2,073 2,726,543 2,926,494
(Until June 29, 2009)
Mr. Adam Allerhand 121,935 45,000 46,484 163 - - 213,582
Mr. Martin Cooper 11,291 2,024 5,638 468 - - 19,421
(From December 1, 2009)
Ms. Jenny Low 15,683 12,074 267 1,150 - - 29,174
(From December 1, 2009)
Other key management
personnel
Mr. David M. Mashaal 136,996 8,971 46,300 5,894 - 109,176 307,337
(Until July 31, 2009)
Mr. Martin Cooper 103,009 - 63,106 2,993 - - 169,108
(Until November 30, 2009)
Ms. Jenny Low 146,454 - 12,561 2,641 - - 161,656
(Until November 30, 2009)
Dr. G. Balasubramaniam 67,230 4,678 103 4,436 - - 76,447
(Until August 15, 2009)
Mr. Marcus Poh 59,668 6,494 407 6,422 - - 72,991
Total 881,192 83,657 248,088 24,167 2,073 2,835,719 4,074,896
* Included in base salary is a consultancy fee of US$45,787 payable to a corporation in which Mr. Saul
A. Mashaal has an interest. The amount was paid for services of Mashaal Enterprises Ltd.
For
per
sona
l use
onl
y
18
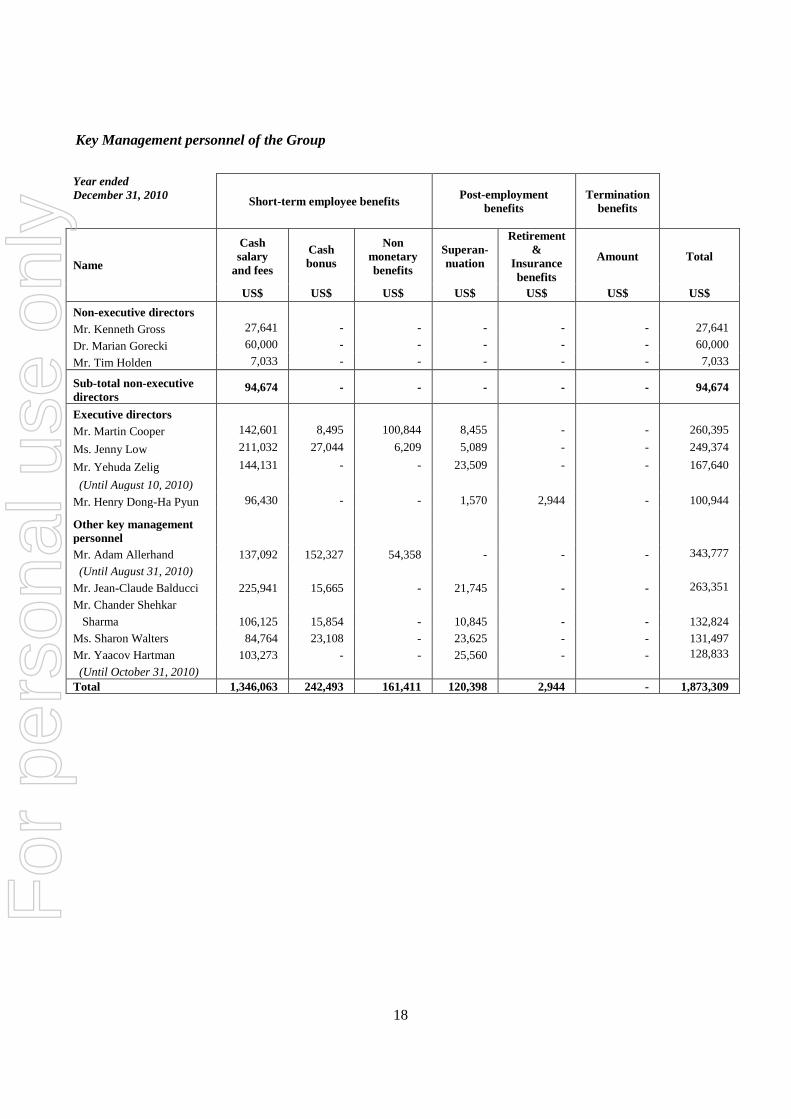
Key Management personnel of the Group
Year ended
December 31, 2010 Short-term employee benefits
Post-employment
benefits
Termination
benefits
Name
Cash
salary
and fees
Cash
bonus
Non
monetary
benefits
Superan-
nuation
Retirement
&
Insurance
benefits
Amount Total
US$ US$ US$ US$ US$ US$ US$
Non-executive directors
Mr. Kenneth Gross 27,641 - - - - - 27,641
Dr. Marian Gorecki 60,000 - - - - - 60,000
Mr. Tim Holden 7,033 - - - - - 7,033
Sub-total non-executive
directors 94,674 - - - - - 94,674
Executive directors
Mr. Martin Cooper 142,601 8,495 100,844 8,455 - - 260,395
Ms. Jenny Low 211,032 27,044 6,209 5,089 - - 249,374
Mr. Yehuda Zelig 144,131 - - 23,509 - - 167,640
(Until August 10, 2010)
Mr. Henry Dong-Ha Pyun 96,430 - - 1,570 2,944 - 100,944
Other key management
personnel
Mr. Adam Allerhand 137,092 152,327 54,358 - - - 343,777
(Until August 31, 2010)
Mr. Jean-Claude Balducci 225,941 15,665 - 21,745 - - 263,351
Mr. Chander Shehkar
Sharma 106,125 15,854 - 10,845 - - 132,824
Ms. Sharon Walters 84,764 23,108 - 23,625 - - 131,497
Mr. Yaacov Hartman 103,273 - - 25,560 - - 128,833
(Until October 31, 2010)
Total 1,346,063 242,493 161,411 120,398 2,944 - 1,873,309
For
per
sona
l use
onl
y
19
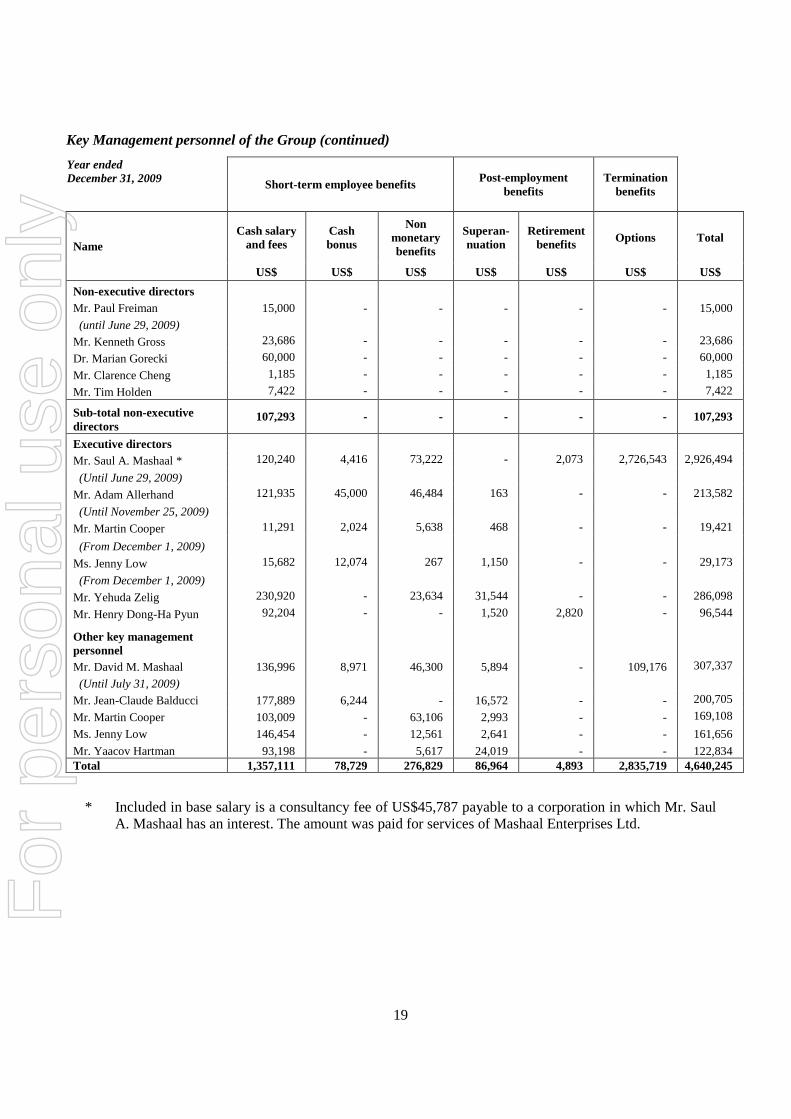
Key Management personnel of the Group (continued)
Year ended
December 31, 2009 Short-term employee benefits
Post-employment
benefits
Termination
benefits
Name
Cash salary
and fees
Cash
bonus
Non
monetary
benefits
Superan-
nuation
Retirement
benefits Options Total
US$ US$ US$ US$ US$ US$ US$
Non-executive directors
Mr. Paul Freiman 15,000 - - - - - 15,000
(until June 29, 2009)
Mr. Kenneth Gross 23,686 - - - - - 23,686
Dr. Marian Gorecki 60,000 - - - - - 60,000
Mr. Clarence Cheng 1,185 - - - - - 1,185
Mr. Tim Holden 7,422 - - - - - 7,422
Sub-total non-executive
directors 107,293 - - - - - 107,293
Executive directors
Mr. Saul A. Mashaal * 120,240 4,416 73,222 - 2,073 2,726,543 2,926,494
(Until June 29, 2009)
Mr. Adam Allerhand 121,935 45,000 46,484 163 - - 213,582
(Until November 25, 2009)
Mr. Martin Cooper 11,291 2,024 5,638 468 - - 19,421
(From December 1, 2009)
Ms. Jenny Low 15,682 12,074 267 1,150 - - 29,173
(From December 1, 2009)
Mr. Yehuda Zelig 230,920 - 23,634 31,544 - - 286,098
Mr. Henry Dong-Ha Pyun 92,204 - - 1,520 2,820 - 96,544
Other key management
personnel
Mr. David M. Mashaal 136,996 8,971 46,300 5,894 - 109,176 307,337
(Until July 31, 2009)
Mr. Jean-Claude Balducci 177,889 6,244 - 16,572 - - 200,705
Mr. Martin Cooper 103,009 - 63,106 2,993 - - 169,108
Ms. Jenny Low 146,454 - 12,561 2,641 - - 161,656
Mr. Yaacov Hartman 93,198 - 5,617 24,019 - - 122,834
Total 1,357,111 78,729 276,829 86,964 4,893 2,835,719 4,640,245
* Included in base salary is a consultancy fee of US$45,787 payable to a corporation in which Mr. Saul
A. Mashaal has an interest. The amount was paid for services of Mashaal Enterprises Ltd.
For
per
sona
l use
onl
y

20
Insurance of officers
During the financial year, the Company paid a premium of US$39,300 to insure the directors and officers of the Company and its controlled entities, and the managers of each of the divisions of the Group and the Company.
The liabilities insured are legal costs that may be incurred in defending civil or criminal proceedings that may be brought against the officers in their capacity as officers of entities in the Group and the Company, and any other payments arising from liabilities incurred by the officers in connection with such proceedings, other than where such liabilities arise out of conduct involving a wilful breach of duty by the officers or the improper use by the officers of their position or of information to gain advantage for themselves or someone else or to cause detriment to the Company. It is not possible to apportion the premium between amounts relating to the insurance against legal costs and those relating to other liabilities. The Audit Committee has full access to and has the co-operation of the management and has been given the resources required for it to discharge its function properly. It also has full discretion to invite any director and executive officer to attend its meetings. The external and internal auditors have unrestricted access to the Audit Committee. The Audit Committee has recommended to the directors the nomination of Deloitte & Touche LLP for re-appointment as external auditors of the group at the forthcoming AGM of the Company. Auditor
The auditors, Deloitte & Touche LLP, have expressed their willingness to accept re-appointment. ON BEHALF OF THE DIRECTORS ........................................................... Slawomir Ziegert Chairman, Chief Executive Officer & Director
......................................................... Adam Aleksandrowicz Chief Financial Officer Singapore March 31, 2011
For
per
sona
l use
onl
y
21
SCIGEN LTD AND ITS SUBSIDIARIES
STATEMENT OF DIRECTORS
In the opinion of the directors, the consolidated financial statements of the Group and the statement of
financial position and statement of changes in equity of the Company set out on pages 35 to 91 are drawn up
so as to give a true and fair view of the state of affairs of the Group and of the Company as at
December 31, 2010 and of the results, changes in equity and cash flows of the Group and changes in equity of
the Company for the financial year then ended and at the date of this statement, with the continued financial
support from its ultimate holding Company, there are reasonable grounds to believe that the company will be
able to pay its debts when they fall due.
ON BEHALF OF BOARD OF DIRECTORS
...........................................................
Slawomir Ziegert
Chairman, Chief Executive Officer & Director
..........................................................
Adam Aleksandrowicz
Chief Financial Officer
Singapore
March 31, 2011
For
per
sona
l use
onl
y

22
Corporate Governance Statement
SciGen Ltd (the “Company” or “SciGen”) and the Board are committed to achieving and demonstrating the highest standards of corporate governance. The Company‟s corporate governance framework is largely consistent with the Best Practice recommendations released by the Australian Stock Exchange Corporate Governance Council when taking into account the size and scope of the company. The Company and its controlled entities together are referred to as the Group in this statement.
A summary of the compliance status of the Group under the broad Principle headings as defined in the Guidelines is shown below. Principle 1 Lay solid foundations for management and oversight
1.1 Establish the functions reserved to the Board and those delegated to Senior Executives
The relationship between the Board and senior executives is important to the Group‟s long-term success. Day to day management of the Group‟s affairs and the implementation of the corporate strategy and policy initiatives are formally delegated by the Board to the Chief Executive Officer (“CEO”) and senior executives. Responsibilities are delineated by formal authority delegation.
The directors are responsible to the shareholders for the performance of the Company in both the short and longer term and seek to balance sometimes competing objectives in the best interests of the Group as a whole. Their focus is to enhance the interests of shareholders and other key stakeholders and to ensure the Group is properly managed.
Roles of the Chairman and CEO
The Chairman is responsible for leading the Board, ensuring that Board activities are organised and efficiently conducted and for ensuring the Directors are properly briefed for meetings. The CEO is responsible for implementing Group strategies and policies.
Role of the Board
(a) The Directors are responsible for the direction and supervision of SciGen‟s business and for its overall corporate governance. This includes ensuring that internal controls and reporting procedures are adequate and effective. The Directors recognise the need to maintain the highest standards of behaviour, ethics and accountability.
(b) The primary functions of the Board include:
(1) formulating and approving objectives, strategies and long-term plans for SciGen's continued development and operation, in conjunction with management;
(2) appointing and removing the chief executive officer;
(3) where appropriate, approving the appointment and the removal of senior executives;
(4) monitoring the implementation of these objectives, strategies and long-term plans to ensure SciGen, to the best of its ability, delivers shareholder value;
For
per
sona
l use
onl
y
23
(5) approval and monitoring the progress of major capital expenditure, acquisitions and disposals;
(6) monitoring SciGen‟s overall performance and financial results, including adopting annual budgets and approving SciGen‟s financial statements;
(7) ensuring that adequate systems of internal control exist and are appropriately monitored for compliance;
(8) selecting and reviewing the performance of the CEO and reviewing the performance of senior operating management;
(9) ensuring significant business risks are identified and appropriately managed;
(10) ensuring that SciGen meets the statutory, regulatory and reporting requirements of the ASX and requirements under Australia and Singapore corporations law;
(11) ensuring that SciGen, its Directors, officers, employees and associates are aware of and comply with all relevant laws and regulations;
(12) reporting to shareholders on performance;
(13) deciding the payment of dividends to shareholders; and
(14) reviewing, ratifying and monitoring systems of risk management and internal control, codes of conduct, and legal compliance.
(c) The Board consists of the Chairman and CEO, two executive directors, and seven other non-executive Directors. The term of Directors‟ appointments is governed by SciGen‟s Constitution. At least one third of Directors must retire and seek re-election at each Annual General Meeting of SciGen. Mr. Kenneth Gross having attained the age of 70 years, is required to seek re-election annually, under the provision of the Singapore Companies Act.
(d) The Board has established an Audit Committee, a Remuneration Committee and a Scientific Advisory Board. From time to time, the Board may determine to establish specific purpose sub-committees to deal with specific issues.
1.2 Process for evaluating the performance of senior executives
The evaluation of the performance of senior executives by way of annual appraisals are conducted
annually the respective supervisors and reported to the CEO.
Principle 2
Structure the Board to add value
ASX recommends having a board of an effective composition, size and commitment to adequately discharge
its responsibilities and duties. The Company had addressed these recommendations as noted below:
For
per
sona
l use
onl
y

24
A majority of the Board should be independent Directors
Board members
Details of the members of the Board, their experience, expertise, qualifications are set out in the directors‟ report in pages 9-11. At the date of this report, the Board comprises ten (10) Directors, three (3) being executive Directors and seven (7) being non-executive Directors. Of the seven (7) non-executive directors, one (1) of whom is deemed independent under the principles set out in the Guidelines.
Directors’ independence
The Board does not comprise of a majority of independent directors. The non-independent directors have the relevant expertise in the corporate finance, manufacture and world-wide sales & marketing of the product. Whilst this is a departure from the recommendation, the Board believes that the composition of the Board currently brings the right mix of complementary skills, experience and representation for the Company and its shareholders at this point in its life.
The independent directors as of the date of this report are:
Mr. Kenneth Gross Dr Marian Gorecki - Resigned on March 3, 2011
Dr. Marian Gorecki remained as an independent director of the Company until his resignation on March 3, 2011.
Independent professional advice
Directors and Board committees have the right, in connection with their duties and responsibilities, to seek independent professional advice at the Company's expense. Prior written approval of the Chairman is required, but this will not be unreasonably withheld. Matters requiring professional independent advice are tabled and discussed at board meetings.
Commitment
The number of meetings of the Company‟s Board of directors and of each board committee held during the year ended December 31, 2010, and the number of meetings attended by each director is disclosed on page 14. It is the Company‟s practice to allow its executive directors to accept appointments outside the company with prior written approval of the Chairman.
Conflict of interests
Entities connected with Mr. Kenneth Gross, Mr. Ryszard K. Krauze, Mr. Adam Wilczega, Dr Marian Gorecki, Mr. Marcin Dukaczewski, Mr. Adam Polonek, Ms. Joanna Szymanska-Bulska, Mr. Slawomir Ziegert, Mr. Mateusz Kosecki and Mr. Amol Shah had business dealings with the Group and the Company during the year, as described in note 6 to the financial statements. In accordance with the Board charter, the directors concerned declare their interests in those dealings to the Company and take no part in decisions relating to them or the preceding discussions.
Performance assessment
It is intended that the Board may undertake an annual self-assessment of its collective performance. The process may be facilitated by an independent third party. In addition, each board committee may undertake an annual self assessment on the performance of the committee and achievement of committee objectives.
For
per
sona
l use
onl
y
25
The Chairman intends when possible to annually assess the performance of individual directors and meet privately with each director and senior executives to discuss this assessment. The Chairman‟s performance may be reviewed by the Board.
Each year‟s budget provides for training and education of staff, both internally and externally.
2.1 The Chair should be an independent Director
Mr. Slawomir Ziegert, Chairman of the Board is not an independent director under the principles set out in the Guidelines. Whilst this is a departure from the recommendation, the appointment of Mr. Ziegert, who is the Chief Executive Officer of Bioton S.A., holder of 95.57% of the Company, is vital at this point in time as Mr. Ziegert is well positioned to take an active and effective role to oversee and expedite the restructure, formulate objectives, strategies and long-term plans of the Company.
2.2 The roles of the Chair and Chief Executive Officer should not be exercised by the same individual
The Chairman of the Company was Mr. Ryszard Krauze until his resignation on March 22, 2011. Upon the resignation of Mr. Krauze, Mr. Slawomir Ziegert, the Chief Executive Officer, is appointed as Chairman. Whilst this is a departure from the recommendation, Mr. Ziegert will hold the position of Chairman in the interim period until such time the Company appoints an independent Chairman. The Board are actively looking into the appointment of an independent director to hold the position of Chairman.
2.3 The Board should establish a Nomination Committee
The Company does not have a formally constituted Nomination Committee given the early stage of the Company‟s development and the complete nature of the Board composition currently. The Board is of the opinion that there would be no efficiencies to be gained in establishing a separate Nomination Committee. The function of reviewing the competencies of directors, appoint and re-appointment of directors, review of board succession and evaluation of the performances of the board and committees is undertaken by the full Board. At such time when the company is well established, a Nomination Committee will be formed and the Board restructured.
2.4 Process for evaluating the performance of the Board, its Committees and individual Directors
The Chairman of the Board is responsible for evaluating Board and individual directors performance annually. To-date, there is no review of the Board and individual directors.
Induction and education
Induction procedures have not been required as all recently appointed directors have been involved with the industry and or with the Company prior to their appointment as directors.
Access to information
The Board is provided access to all documents and information it needs in order to discharge its responsibilities effectively. As directed by the Board, senior executives furnish the board with monthly, quarterly and ad hoc reports on the operations.
The Board and the Company Secretary
The Company Secretary supports the Board by monitoring the Board policy and ensuring that the procedures are followed. The Company Secretary coordinates the completion and despatch of board agenda. The Company Secretary also advises the Board on corporate governance matters.
For
per
sona
l use
onl
y

26
Principle 3
Promote ethical and responsible decision-making
ASX recommends that the company should actively promote ethical and responsible decision-making. The Company had addressed these recommendations as noted below:
3.1 Establish and Disclosure of a Code of Conduct
The Company has developed a Code of Conduct (the “Code”) which has been reviewed by the Board and will apply to all Directors and employees. The Code will be regularly reviewed and updated as necessary to ensure it reflects the highest standards of behaviour and professionalism and the practices necessary to maintain confidence in the Group‟s integrity.
In summary, the Code requires that at all times, all Company personnel act with the utmost integrity, objectivity and in compliance with the letter and the spirit of the law and company policies.
The Company is in the process of reviewing the current policies of the Code of Conduct to include the reporting and investigation of unethical practices. Although the process is not included in the current Code of Conduct, to date, all reports of unethical practices received have been taken seriously by the Board and investigated and action taken if required.
3.2 Policy concerning trading in the Company‟s securities
Trading in Company securities is regulated by the Securities and Futures Act and the ASX Listing Rules. The Board makes all Directors, officers and employees aware on the appointment that it is prohibited to trade in the Company‟s securities whilst that Director, officer or employee is in the possession of price sensitive information.
For details of shares held by Directors and officers please refer to the Directors‟ Report on page 5. Directors are required to report to the Company Secretary any movements in their holdings of Company securities, which are reported to ASX in the required timeframe prescribed by the ASX Listing Rules. The Share Trading Policy can be found on the Company website.
Principle 4
Safeguard integrity in financial reporting
ASX recommends that the Company should have a structure to independently verify and safeguard the integrity of their financial reporting. The Company had addressed these recommendations as noted below: 4.1 The Board should establish an Audit Committee
The Board has established an Audit Committee to assist in the execution of its duties and to allow detailed consideration of complex issues. Matters determined by the Audit Committee are submitted to the Board as recommendations for board decision, as required unless the Board has delegated the authority for a decision to the appropriate committee.
Minutes of Audit Committee meetings are tabled at subsequent board meetings.
4.2 Structure of the Audit Committee
The Audit Committee comprises 3 members: Mr. Kenneth Gross (Chairman) (Independent director) Dr. Marian Gorecki (Independent director) - Resigned March 3, 2011 Mr. Adam Wilczega (Non-independent director)
For
per
sona
l use
onl
y
27
The Chairman of the Audit Committee is an independent director. The majority of the committee are independent as defined by the Corporate Governance Council Guidelines. Dr. Marian Gorecki remained on the audit committee until his resignation from the Board of directors on March 3, 2011. The Board are actively looking into the appointment of an independent director to replace Dr. Gorecki on the Audit Committee.
Details of these directors‟ qualification, expertise, experience and attendance at Audit Committee meetings are set out in the directors‟ report on pages 9 to 14.
4.3 Charter
The Audit Committee does not have a formal Charter. The Audit Committee is of the opinion that as the Company is in the capital investment stage of its development where most of the transactions are by way of turn key projects, a formal Charter may be not be adequate and effective. At such time when the Company‟s manufacturing facilities are operational and established, a formal Charter will be prepared to set out the role and responsibilities and procedures of the Audit committee.
The Audit Committee meets at least 2 times in a year.
The CEO, Chief Financial Officer (“CFO”) and external auditors are invited to attend Audit Committee Meetings at the discretion of the Audit Committee. Time is allocated for the Audit Committee to meet with the external auditors without management being present.
The responsibilities of the Audit Committee are to:
(a) assist the Board to discharge fiduciary responsibilities with regard to the Company's accounting, control and reporting practices by monitoring the internal control environment and management over corporate assets;
(b) review internal controls and any changes thereto approved and submitted by the Company's CFO;
(c) provide assurance regarding the quality and reliability of financial information used by the Board to enable the Board to maintain confidence in the financial reports;
(d) oversee the activities of the external audit staff of the Company and to review the Company's risk management policies, internal control processes, financials, operating results and accounting policies;
(e) review and recommend to the Board the adoption of the Company's annual financial statements; and
(f) liaise with and review the performance of the external auditor, who may be invited to attend Audit Committee meetings to discuss financial matters and business risk.
External auditors
The Company‟s and Audit Committee‟s policy is to appoint external auditors who clearly demonstrate quality and independence. The performance of the external auditor is reviewed annually, taking into consideration assessment of performance and existing value. Deloitte & Touche LLP were appointed as the external auditors in June 2010.
During the financial year, the external auditors did not render any non-audit services to the Group. It is the policy of the external auditors to provide an annual declaration of their independence to the Audit Committee.
For
per
sona
l use
onl
y
28
Principle 5
Make timely and balanced disclosure
ASX recommends that the Company should promote timely and balanced disclosure of all material matters concerning the Company. The Company had addressed these recommendations as noted below:
5.1 Establish written policies to ensure compliance with ASX Listing Rule
Disclosure requirement
All announcements made are reviewed and approved by the Board prior to the release to the market. The CEO, CFO and Senior Vice President & Corporate Secretary have been nominated as the persons responsible for communications with the Australian Stock Exchange (“ASX”). This role includes responsibility for ensuring compliance with the continuous disclosure requirements in the ASX listing rules and overseeing and co-ordinating information disclosure to the ASX, analysts, brokers, shareholders, the media and the public.
The Corporate Secretary advises the Board on ASX Listing Rules and Guidance Recommendations matters.
The Company complies with written policies and procedures of the ASX on information disclosure that focus on continuous disclosure of any information concerning the Company and its controlled entities that a reasonable person would expect to have a material effect on the price of the Company‟s securities.
All information disclosed to the ASX is posted on the Company‟s website as soon as it is disclosed to the ASX. When analysts are briefed on aspects of the Group‟s operations, the material used in the presentation is released to the ASX and posted on the Company‟s website.
All shareholders receives a copy of the Company‟s annual report unless they have indicated otherwise. In addition, the Company seeks to provide opportunities for shareholders to participate through electronic means. All recent announcements of the Company, media briefings, details of the Company‟s meetings, press releases and financial reports are available on the Company‟s website www.scigenltd.com.
The website also includes a feedback mechanism and an option for shareholders to register their e-mail address for e-mail updates of the Company‟s matters.
Principle 6
Respect the rights of shareholders
ASX recommends that the Company should respect the rights of shareholders and facilitate the effective exercise of those rights. The Company had addressed these recommendations as noted below:
6.1 Communications Policy
The Company has developed a website which contains sections dealing specifically with investor information.
All ASX and other important announcements are published on the website simultaneously with their release into the public domain.
Shareholders can also e-mail the Company and receive updates or answers to specific questions where appropriate.
For
per
sona
l use
onl
y
29
In terms of external audit, a formal invitation has been extended by the Board to the audit partner at Deloitte & Touche LLP to attend the Annual General Meeting of the Company and through the Chairman, will be available to answer questions relating to the conduct of the audit.
Principle 7
Recognise and manage risk
ASX recommends that the Company establish a sound system of risk oversight and management and internal control. The Company had addressed these recommendations as noted below:
7.1 Policies for oversight and management of material business risks
The Company is committed to the management of risks to protect its employees, assets, earnings, markets, reputation and the environment.
The Board has implemented risk management procedures throughout the Company that aim to identify the sources of risk and loss, quantify the impact of these sources and control and reduce the risk through practical and cost effective control measures. This will continue to be reviewed and enhanced.
In addition, the Company uses risk-financing techniques, including insurance, to reduce the financial impact of any uncontrollable or catastrophic losses.
The Audit Committee of the Board currently accepts the role and responsibility of over seeing the control of financial risk. The committee ensures that adequate internal controls and risk-financing measures (such as insurance) are in place. These measures provide some protection against financial events.
In terms of more general risk management, managers in each country where the Company employs staff are responsible for conforming to local occupational health and safety requirements. Given the relatively small size of the Company and its geographic diversity it is not considered useful to constitute a formal Risk Management Committee at this point.
Further risk policy development will be undertaken in consultation with the Audit Committee and the Board as appropriate.
7.2 Risk Management and internal control system
Risk assessment and management
The Board is responsible for ensuring there are adequate policies in relation to risk oversight and management, and internal control systems. In summary, the Company‟s policies are designed to ensure strategic, operational, legal, reputation and financial risks are identified, assessed, addressed and monitored to enable achievement of the Group‟s business objectives.
Considerable importance is placed on maintaining a strong control environment. There is an organisation structure with clearly drawn lines of accountability and delegation of authority. Adherence to the code of conduct is required at all times and the Board actively promotes a culture of quality and integrity.
Internal Audit
Given the present size of the Company, the Board does not employ an internal auditor.
For
per
sona
l use
onl
y

30
7.3 Assurances from CEO and CFO
Corporate reporting
The CEO and CFO have made the following certifications in writing to the Board:
that the Company‟s financial reports are complete and present a true and fair view, in all material
respects, of the financial condition and operational results of the Group and Company and are in
accordance with relevant accounting standards; and
that the above statements are founded on a sound system of risk management and internal
compliance and control and which implement the policies adopted and that the Company‟s risk
management and internal compliance and control is operating efficiently and effectively in all
material aspects.
Principle 8
Remunerate fairly and responsibly
ASX recommends that the Company should ensure that the level and composition of remuneration is
sufficient and reasonable and that its relationship to performance is clear. The Company had addressed these
recommendations as noted below:
8.1 Remuneration Committee
The Remuneration Committee currently consists of the following non-executive directors:
Dr. Marian Gorecki (Chairman) - Resigned March 3, 2011
Mr. Ryszard Krauze – Resigned March 22, 2011
Mr. Adam Aleksandrowicz – Appointed March 3, 2011
Mr. Marcin Dukaczewski – Appointed March 22, 2011
Mr. Adam Tomasz Polonek – Appointed March 22, 2011
The Remuneration Committee should comprise entirely of non-executive directors and be chaired by an
independent Director. Dr. Marian Gorecki and Mr. Ryszard Krauze remained on the Remuneration
Committee until their resignations on March 3, 2011 and March 22, 2011 respectively. Whilst this is a
departure from the recommendation, the Board believes that the new Committee have the knowledge
and experience on remunerations in the biopharmaceutical industry.
Until now, the Remuneration Committee was responsible mainly for the review and recommendation of
the remuneration of the CEO. Given the size of the Company and the only function of the Remuneration
Committee, there is no formal charter for the role and responsibilities, composition, structure,
membership requirements and the manner in which the committee is to operate. The Remuneration
Committee is in the process of reviewing the scope of the Remuneration Committee and will be
preparing a formal Charter and when adopted, it will be made available on the Company‟s website.
For
per
sona
l use
onl
y

31
Matters determined by the Remuneration Committee are submitted to the Board as recommendations for
board decision, as required unless the Board has delegated the authority for a decision to the appropriate
committee.
Details of these directors‟ qualifications, experience and attendance at Remuneration Committee
meetings are set out in the directors‟ report on pages 9 to 14. During the year, the Remuneration
Committee did not meet.
The Remuneration Committee advises the Board on remuneration policies and practices generally, and makes specific recommendations on remuneration packages and other terms of employment for executive and non-executive directors.
Further information on directors‟ remuneration is set out in the directors‟ report on pages 16 to 19 and Note 6 to the financial statements.
8.2 Distinguish the structure of non-executive Director‟s remuneration from that of executives
Current remuneration packages of executive directors and senior executives include a balance between fixed and incentive pay. The incentives are payable upon achievement of certain short term and long term objectives. Non-executive directors, if paid, receive a fixed fee.
The twelve months report of the Company contains detailed information of the remuneration of directors and senior executives. This information includes references to share option allocations.
The Remuneration Committee and the Board will review the term of any proposed scheme for the retirement benefits, other than the statutory superannuation, for non-executive directors.
For
per
sona
l use
onl
y
32
INDEPENDENT AUDITORS’ REPORT TO THE MEMBERS OF
SCIGEN LTD Report on the Financial Statements We have audited the accompanying financial statements of SciGen Ltd (the Company) and its subsidiaries (the Group) which comprise the statements of financial position of the Group and the Company as at December 31, 2010, the statement of comprehensive income, statement of changes in equity and statement of cash flows of the Group and the statement of changes in equity of the Company for the year then ended, and a summary of significant accounting policies and other explanatory notes, as set out on pages 35 to 91. Management’s Responsibility for the Financial Statements Management is responsible for the preparation of financial statements that give a true and fair view in accordance with the provisions of the Singapore Companies Act (the “Act”) and Singapore Financial Reporting Standards and for devising and maintaining a system of internal accounting controls sufficient to provide reasonable assurance that assets are safeguarded against loss from unauthorised use or disposition; and transactions are properly authorised and that they are recorded as necessary to permit the preparation of true and fair profit and loss accounts and balance sheets to maintain accountability of assets. Auditors’ Responsibility Our responsibility is to express an opinion on these financial statements based on our audit. We conducted our audit in accordance with Singapore Standards on Auditing. Those standards require that we comply with ethical requirements and plan and perform the audit to obtain reasonable assurance whether the financial statements are free from material misstatement. An audit involves performing procedures to obtain audit evidence about the amounts and disclosures in the financial statements. The procedures selected depend on the auditor‟s judgement, including the assessment of the risks of material misstatement of the financial statements, whether due to fraud or error. In making those risk assessments, the auditor considers internal control relevant to the entity‟s preparation of financial statements that give a true and fair view in order to design audit procedures that are appropriate in the circumstances, but not for the purpose of expressing an opinion on the effectiveness of the entity‟s internal control. An audit also includes evaluating the appropriateness of accounting policies used and the reasonableness of accounting estimates made by management, as well as evaluating the overall presentation of the financial statements. We believe that the audit evidence we have obtained is sufficient and appropriate to provide a basis for our qualified audit opinion.
For
per
sona
l use
onl
y
33
Bases for Qualified Auditor’s Opinion (a) As disclosed in Note 10 to the financial statements, the Group has included net assets of a disposal
group classified as held-for-sale and the Company has included non-current assets classified as held-for-sale as at December 31, 2010 amounting to US$10,000,000 and US$11,652,000, respectively. As further set out in Note 10, the carrying amount of the Group‟s net assets relating to a disposal group and the Company‟s non-current assets classified as held-for-sale is stated at fair value less costs to sell, which is based on management‟s estimate of the transaction price. Singapore Financial Reporting Standard (“FRS”) 105 Non-current Assets Held-for-Sale requires an entity to measure a disposal group and non-current assets classified as held-for-sale at lower of its carrying amount and fair value less costs to sell. We have been unable to obtain sufficient appropriate audit evidence to support the management‟s assessment of the fair value less costs to sell of the Group‟s net assets of a disposal group classified as held-for-sale and the Company‟s non-current assets classified as held-for-sale and, accordingly, we have been unable to determine whether the fair value less costs to sell of these assets as at December 31, 2010 is at least equal to its carrying amount. In the event that the carrying amount of these assets exceeds the fair value less costs to sell, it would be necessary for the carrying amount of these assets to be written down.
(b) As disclosed in Note 3(a) to 3(c) to the financial statements, the recoverability of the carrying amounts
of the following non-current assets is dependent on the ability of the Group and of the Company to achieve certain matters.
i. The non-current assets of the Group totaling US$21,560,000 comprising property, plant and
equipment amounting to US$13,280,000 (Note 11) of a subsidiary in India and intangible assets which represent licences amounting to US$8,280,000 (Note 12) of the Company; and
ii. The non-current assets of the Company totaling US$32,440,000 comprising investment in a
subsidiary in India amounting to US$24,160,000 (Note 16) and intangible assets which represent licences amounting to US$8,280,000 (Note 12) of the Company.
FRS 36 Impairment of Assets requires an asset to be carried at no more than its recoverable amount. As
disclosed in Note 3(a) to 3(c) to the financial statements, significant assumptions were used by management to estimate the recoverable amounts of the non-current assets stated in (i) and (ii) above. We have been unable to obtain sufficient appropriate audit evidence to support management assumptions used to project the revenues which are used to assess the recoverable amount of these assets and, accordingly, we have been unable to determine whether the recoverable amounts of these non-current assets are at least equal to their carrying amounts. In the event that the carrying amounts of the assets exceed their recoverable amount, it would be necessary for the carrying amounts of the assets to be written down to their recoverable amounts.
(c) During the course of our audit, we identified several instances of unrecorded capital expenditure for
construction in progress which was incurred by a subsidiary in India in 2007 and 2008 but was recorded subsequent to the financial year ended December 31, 2010. We are unable to obtain sufficient appropriate evidence over completeness of accruals for construction in progress cost incurred recorded, included in other payables amounting to US$2,394,157 for the Group and, accordingly we are unable to determine the adjustments required for the prior years and current year construction in progress and other payables for the Group.
For
per
sona
l use
onl
y

34
Qualified Auditor’s Opinion
In our opinion, except for the effects of the matters described in the Basis for Qualified Auditor‟s Opinion section, if any, as might have been determined to be necessary had we been able to satisfy ourselves as to the carrying amounts of these assets and liabilities stated in the financial statements, the consolidated financial statements of the Group and the statement of financial position and statement of changes in equity of the Company are drawn up in accordance with the provisions of the Act and Singapore Financial Reporting
Standards so as to give a true and fair view of the state of affairs of the Group and of the Company as at December 31, 2010 and of the results, changes in equity and cash flows of the Group and changes in equity of the Company for the year ended on that date.
Other Matters
The financial statements of the Company and the Group for the year ended December 31, 2009 were audited by another auditor who expressed unmodified opinion on the financial statements in their report dated March 30, 2010. As disclosed in Note 31, the management has restated the comparative figures for the year ended December 31,
2009 in order to correct certain prior period errors. As these errors were discovered by the management subsequent to the issuance of the interim financial statements for the six months period ended June 30, 2010, these adjustments have not been effected in those interim financial statements to correct the errors for both the six month periods ended June 30, 2010 and 2009 as well as the balances as of December 31, 2009 and June 30, 2010. Management is currently taking steps to quantify the errors and to revise the interim financial statements for the six months period ended June 30, 2010.
Report on Other Legal and Regulatory Requirements
In our opinion, except for the effect of the matters described in the Bases for Qualified Auditor‟s Opinion section, the accounting and other records required by the Act to be kept by the Company have been properly
kept in accordance with the provisions of the Act.
Deloitte & Touche LLP Public Accountants and Certified Public Accountants Singapore
March 31, 2011
For
per
sona
l use
onl
y

35
SCIGEN LTD AND ITS SUBSIDIARIES STATEMENTS OF FINANCIAL POSITION December 31, 2010 Group Company Note 2010 2009 2008 2010 2009 US$'000 US$'000 US$‟000 US$'000 US$'000 (Restated) (Restated) ASSETS Current assets Cash and cash equivalents 7 3,926 4,889 6,092 932 1,127 Trade and other receivables 8 4,330 4,176 7,598 2,396 4,411 Inventories 9 1,079 2,636 1,260 189 130 9,335 11,701 14,950 3,517 5,668 Assets classified as held-for-sale 10 10,800 1,051 - 11,652 - Total current assets 20,135 12,752 14,950 15,169 5,668 Non-current assets Property, plant and equipment 11 22,792 31,593 45,304 84 93 Intangible assets 12 14,266 20,508 29,827 13,884 20,303 Lease prepayment 13 826 817 1,299 - - Investment property 14 - 245 249 - - Long term prepayment - - 226 - - Deferred tax assets 15 7,540 12 12 7,366 - Subsidiaries 16 - - - 30,771 43,243 Total non-current assets 45,424 53,175 76,917 52,105 63,639 Total assets 65,559 65,927 91,867 67,274 69,307 LIABILITIES AND EQUITY Current liabilities Trade and other payables 17 21,711 19,807 16,812 16,953 14,966 Bank loans 18 - - 7 - - Current tax payable - 55 126 - - 21,711 19,862 16,945 16,953 14,966 Liabilities directly associated with assets classified as held-for-sale 10 800 - - - - Total current liabilities 22,511 19,862 16,945 16,953 14,966 Non-current liabilities Other payables 17 7,370 6,022 4,683 7,370 6,022 Bank loans 18 11 17 123 - - Loan from ultimate holding company 18 73,727 71,127 61,644 73,727 71,127 Convertible debenture 18 743 - - - - Total non-current liabilities 81,851 77,166 66,450 81,097 77,149 Capital, reserves and non-controlling interests Share capital 19 42,530 42,530 42,530 42,530 42,530 Share option reserve - - 1,600 - - Translation reserves 20 1,313 (1,051) (3,300) - - Accumulated losses (86,554) (76,801) (38,166) (73,306) (65,338) Equity attributable to owners of the company (42,711) (35,322) 2,664 (30,776) (22,808) Non-controlling interests 3,908 4,221 5,808 - - Net (capital deficiency) equity (38,803) (31,101) 8,472 (30,776) (22,808) Total liabilities and equity 65,559 65,927 91,867 67,274 69,307 See accompanying notes to financial statements.
For
per
sona
l use
onl
y
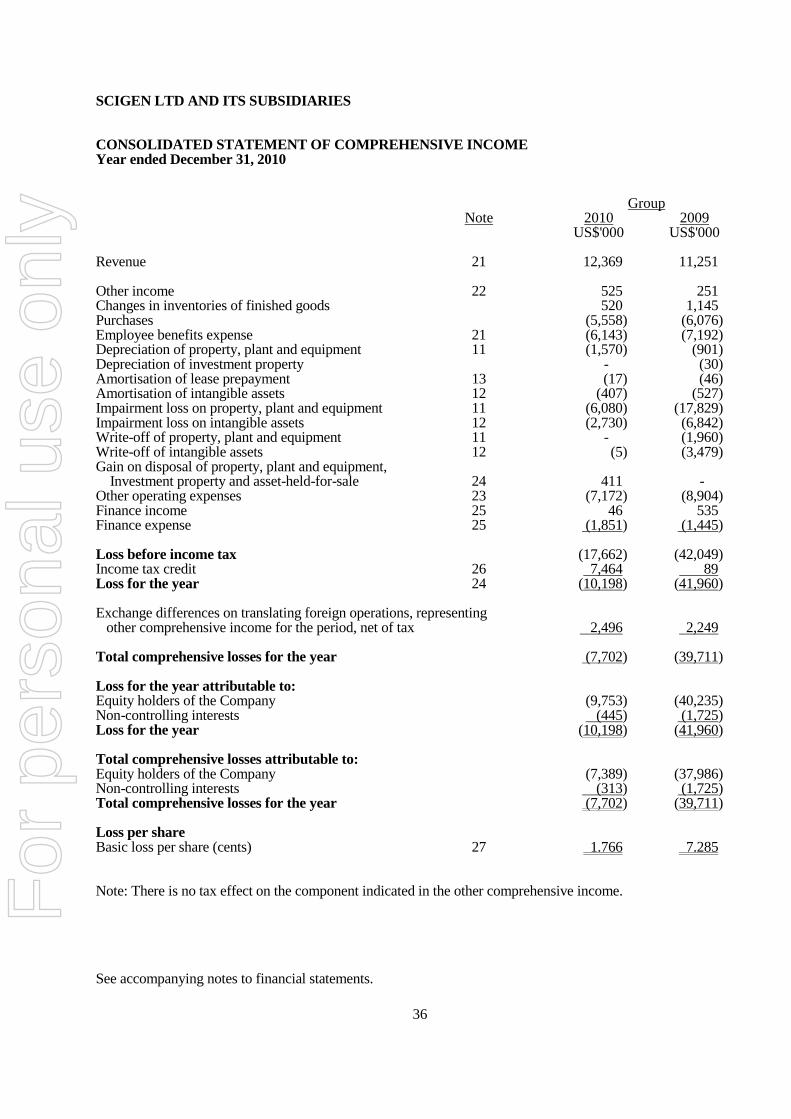
36
SCIGEN LTD AND ITS SUBSIDIARIES CONSOLIDATED STATEMENT OF COMPREHENSIVE INCOME Year ended December 31, 2010 Group Note 2010 2009 US$'000 US$'000 Revenue 21 12,369 11,251 Other income 22 525 251 Changes in inventories of finished goods 520 1,145 Purchases (5,558) (6,076) Employee benefits expense 21 (6,143) (7,192) Depreciation of property, plant and equipment 11 (1,570) (901) Depreciation of investment property - (30) Amortisation of lease prepayment 13 (17) (46) Amortisation of intangible assets 12 (407) (527) Impairment loss on property, plant and equipment 11 (6,080) (17,829) Impairment loss on intangible assets 12 (2,730) (6,842) Write-off of property, plant and equipment 11 - (1,960) Write-off of intangible assets 12 (5) (3,479) Gain on disposal of property, plant and equipment, Investment property and asset-held-for-sale 24 411 - Other operating expenses 23 (7,172) (8,904) Finance income 25 46 535 Finance expense 25 (1,851) (1,445) Loss before income tax (17,662) (42,049) Income tax credit 26 7,464 89 Loss for the year 24 (10,198) (41,960) Exchange differences on translating foreign operations, representing other comprehensive income for the period, net of tax 2,496 2,249 Total comprehensive losses for the year (7,702) (39,711) Loss for the year attributable to: Equity holders of the Company (9,753) (40,235) Non-controlling interests (445) (1,725) Loss for the year (10,198) (41,960) Total comprehensive losses attributable to: Equity holders of the Company (7,389) (37,986) Non-controlling interests (313) (1,725) Total comprehensive losses for the year (7,702) (39,711) Loss per share Basic loss per share (cents) 27 1.766 7.285 Note: There is no tax effect on the component indicated in the other comprehensive income. See accompanying notes to financial statements.
For
per
sona
l use
onl
y
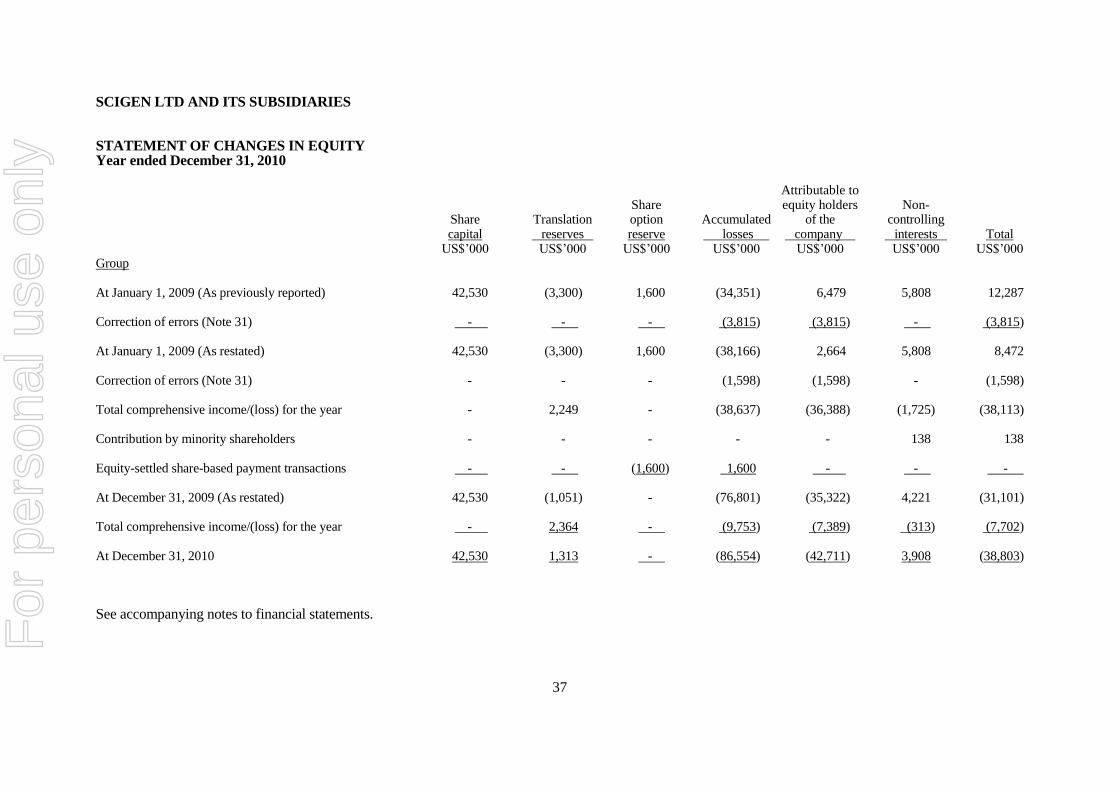
37
SCIGEN LTD AND ITS SUBSIDIARIES STATEMENT OF CHANGES IN EQUITY Year ended December 31, 2010 Attributable to Share equity holders Non- Share Translation option Accumulated of the controlling capital reserves reserve losses company interests Total US$‟000 US$‟000 US$‟000 US$‟000 US$‟000 US$‟000 US$‟000 Group At January 1, 2009 (As previously reported) 42,530 (3,300) 1,600 (34,351) 6,479 5,808 12,287 Correction of errors (Note 31) - - - (3,815) (3,815) - (3,815) At January 1, 2009 (As restated) 42,530 (3,300) 1,600 (38,166) 2,664 5,808 8,472 Correction of errors (Note 31) - - - (1,598) (1,598) - (1,598) Total comprehensive income/(loss) for the year - 2,249 - (38,637) (36,388) (1,725) (38,113)
Contribution by minority shareholders - - - - - 138 138
Equity-settled share-based payment transactions - - (1,600) 1,600 - - -
At December 31, 2009 (As restated) 42,530 (1,051) - (76,801) (35,322) 4,221 (31,101) Total comprehensive income/(loss) for the year - 2,364 - (9,753) (7,389) (313) (7,702)
At December 31, 2010 42,530 1,313 - (86,554) (42,711) 3,908 (38,803) See accompanying notes to financial statements. F
or p
erso
nal u
se o
nly
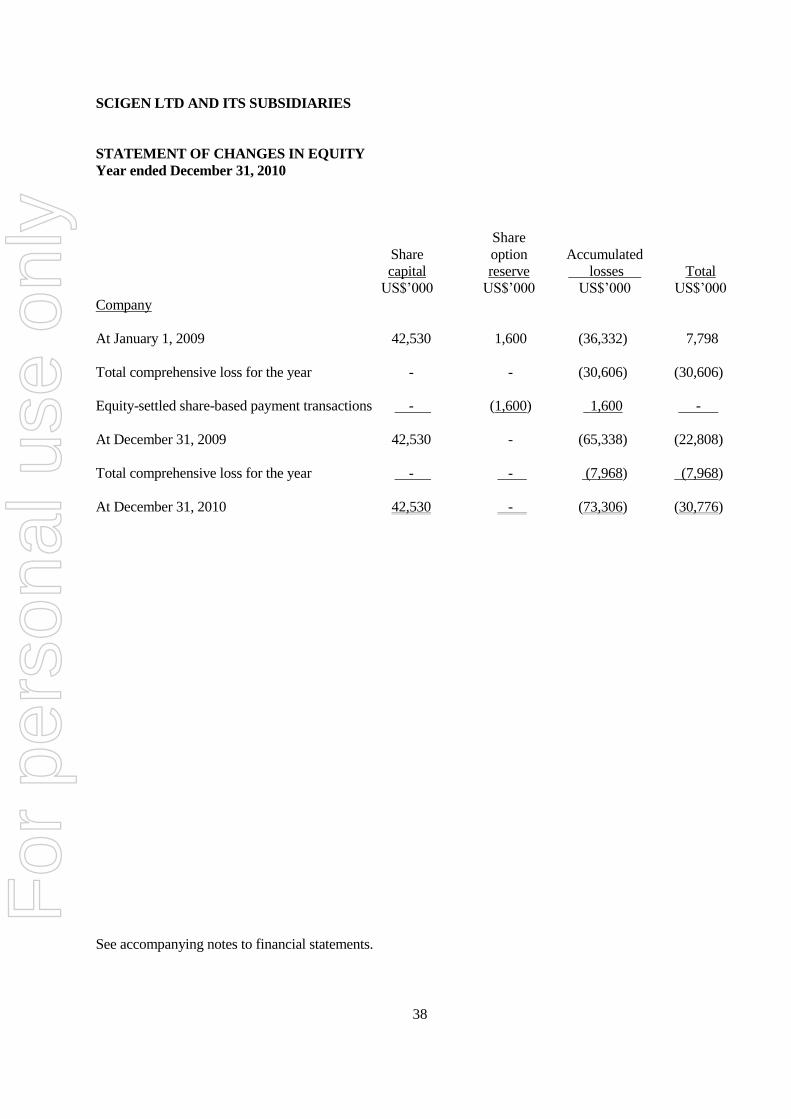
38
SCIGEN LTD AND ITS SUBSIDIARIES
STATEMENT OF CHANGES IN EQUITY
Year ended December 31, 2010
Share
Share option Accumulated
capital reserve losses Total
US$‟000 US$‟000 US$‟000 US$‟000
Company
At January 1, 2009 42,530 1,600 (36,332) 7,798
Total comprehensive loss for the year - - (30,606) (30,606)
Equity-settled share-based payment transactions - (1,600) 1,600 -
At December 31, 2009 42,530 - (65,338) (22,808)
Total comprehensive loss for the year - - (7,968) (7,968)
At December 31, 2010 42,530 - (73,306) (30,776)
See accompanying notes to financial statements.
For
per
sona
l use
onl
y

39
SCIGEN LTD AND ITS SUBSIDIARIES CONSOLIDATED STATEMENT OF CASH FLOWS Year ended December 31, 2010 2010 2009 US$'000 US$'000 (Restated) Operating activities Loss before income tax (17,662) (42,049) Adjustments for: Depreciation of property, plant and equipment 1,570 902 Depreciation of investment property - 30 Amortisation of lease prepayment 17 46 Amortisation of intangible assets 407 527 Gain on disposal of property, plant and equipment (1) - Gain on disposal of investment property (407) - Gain on disposal of asset held-for-sale (3) - Allowance for doubtful debts 274 - Intangible assets written-off 5 3,479 Property, plant and equipment written off - 1,960 Interest income (46) (22)
Interest expenses 1,552 1,445 Impairment loss on property, plant and equipment 6,080 17,829 Impairment loss on intangible assets 2,730 6,842
Net foreign exchange losses 299 - Operating cash flow before movement in working capital (5,185) (9,011) Inventories (593) (1,376) Trade and other receivables (436) 3,658 Trade and other payables 3,271 5,903 Cash used in operations (2,943) (826) Income taxes paid (119) - Net cash flows used in operating activities (3,062) (826) Investing activities Interest received 46 22 Purchase of property, plant and equipment (2,164) (8,357) Purchase of intangible assets (514) (1,284) Proceeds from disposal of investment property 615 - Proceeds from disposal of property, plant and equipment 4 - Proceeds from disposal of asset held-for-sale 1,054 - Net cash flows used in investing activities (959) (9,619) Financing activities Interest paid (80) (18) Repayment of bank loans (8) (132) Loans from ultimate holding company 2,600 9,500 Debenture loan 750 - Capital contribution by minority shareholders of a subsidiary - 138 Net cash flows from financing activities 3,262 9,488 Net decrease in cash and cash equivalents (759) (957) Cash and cash equivalents at beginning of the year 4,889 6,092 Effect of exchange rate fluctuations on cash held (204) (246) Cash and cash equivalents at end of the year 3,926 4,889 See accompanying notes to financial statements.
For
per
sona
l use
onl
y

40
SCIGEN LTD AND ITS SUBSIDIARIES
NOTES TO FINANCIAL STATEMENTS
December 31, 2010
1 GENERAL
The Company (Registration Number. 199805796R) is incorporated in the Republic of Singapore with its
principal place of business and registered office is located at 152 Beach Road, #26-07/08 Gateway East,
Singapore 189721.
The Company is listed on the Australian Stock Exchange. The consolidated financial statements are
presented in United States dollars, which is the Company‟s functional currency and rounded to the
nearest thousand ($‟000), unless stated otherwise.
The principal activities of the Group and Company are those relating to the manufacture and distribution
of biopharmaceutical products under exclusive licensing arrangements.
The Group had a net loss of US$10,198,000 (2009 : US$41,960,000) for the year ended December 31,
2010, and, as of that date, the Group had net current liabilities of US$2,376,000 (2009 : US$7,110,000)
and capital deficiency of US$38,803,000 (2009 : US$31,101,000).
The Group and the Company are dependent on Bioton S.A., the ultimate holding company, for continued
financial support to enable the Group and the Company to operate as going concerns and to discharge the
obligations as and when they fall due. The management is satisfied that financial support will be available
when required.
Additional loans were provided by the ultimate holding company during the year amounting to
US$2,600,000. The ultimate holding company has also undertaken that it will not demand for settlement
of the loans granted to the Company of US$73,727,000 (2009 : US$71,127,000), within the next twelve
months, which are due for repayment on December 31, 2015.
Accordingly, the financial statements of the Group have been prepared assuming that the Group and the
Company will continue as going concerns and do not include any adjustments relating to recoverability
and classification of recorded asset amounts or to amounts and classification of liabilities that might result
if the going concern basis is found to be inappropriate.
The consolidated financial statements of the Group and statement of financial position and statement of
changes in equity of the Company for the year ended December 31, 2010 were authorised for issued by the
Board of Directors on March 31, 2011.
For
per
sona
l use
onl
y

41
2 SUMMARY OF SIGNIFICANT ACCOUNTING POLICIES
BASIS OF ACCOUNTING - The financial statements have been prepared in accordance with the
historical cost basis, except as disclosed in the accounting policies below, and are drawn up in accordance
with the provisions of the Singapore Companies Act and Singapore Financial Reporting Standards
(“FRS”).
ADOPTION OF NEW AND REVISED STANDARDS - In the current financial year, the Group has
adopted all the new and revised FRSs and Interpretations of FRS (“INT FRS”) that are relevant to its
operations and effective for annual periods beginning on or after January 1, 2010. The adoption of these
new/revised FRSs and INT FRSs does not result in changes to the Group and Company‟s accounting
policies and has no material effect on the amounts reported for the current or prior years.
FRS 27 (Revised) Consolidated and Separate Financial Statements and FRS 103 (Revised) Business
Combinations
FRS 27 (Revised) is effective for annual periods beginning on or after July 1, 2009.
FRS 103 (Revised) is effective for business combinations for which the acquisition date is on or after
the beginning of the first annual reporting period beginning on or after July 1, 2009.
Apart from matters of presentation, the principal amendments to FRS 27 that will impact the Group
concern the accounting treatment for transactions that result in changes in a parent‟s interest in a
subsidiary. It is likely that these amendments will significantly affect the accounting for such
transactions in future accounting periods, but the extent of such impact will depend on the detail of the
transactions, which cannot be anticipated. The changes will be adopted prospectively for transactions
after the date of adoption of the revised Standard and, therefore, no restatements will be required in
respect of transactions prior to the date of adoption.
Similarly, FRS 103 is concerned with accounting for business combination transactions. The changes to
the Standard are significant, but their impact can only be determined once the detail of future business
combination transactions is known. The amendments to FRS 103 will be adopted prospectively for
transactions after the date of adoption of the revised Standard and, therefore, no restatements will be
required in respect of transactions prior to the date of adoption.
At the date of authorisation of these financial statements, the following FRSs, INT FRSs and
amendments to FRSs that are relevant to the Group and the Company were issued but not effective:
• Improvements to Financial Reporting Standards (issued in October 2010)
• FRS 24 (Revised) Related Party Disclosures
• Amendment to FRS 32 Financial Instruments: Presentation – Amendments relating to
Classification of Rights Issues
• INT FRS 119 Extinguishing Financial Liabilities with Equity Instruments
• Amendments to FRS 107 Financial Instruments: Disclosures (as part of Improvements to FRSs
issued in 2010)
Consequential amendments were also made to various standards as a result of these new/revised
standards.
For
per
sona
l use
onl
y

42
Management anticipates that the adoption of the other FRSs, INT FRSs and amendments to FRSs issued but not effective at the date of authorisation of the financial statements will not have a material impact on the financial statements of the Group and of the Company in the period of their initial adoption.
FRS 24 (Revised) Related Party Disclosures FRS 24 (Revised) Related Party Disclosures is effective for annual periods beginning on or after
January 1, 2011. The revised Standard clarifies the definition of a related party and consequently additional parties may be identified as related to the reporting entity.
In addition, the revised Standard provides partial exemption for government-related entities, in relation
to the disclosure of transactions, outstanding balance and commitments. Where such exemptions apply, the reporting entity has to make additional disclosures, including the nature of the government‟s relationship with the reporting entity and information on significant transactions or group of transactions involved.
In the period of initial adoption, the changes to related party disclosures, if any, will be applied
retrospectively with restatement of the comparative information. INT FRS 119 Extinguishing Financial Liabilities with Equity Instruments INT FRS 119 provides guidance regarding the accounting for the extinguishment of a financial liability
by the issue of equity instruments. To date, the Group has not entered into transactions of this nature. In particular, under INT FRS 119, equity instruments issued under such arrangements will be measured at their fair value, and any difference between the carrying amount of the financial liability extinguished and the fair value of equity instruments issued will be recognised in profit or loss.
Amendments to FRS 107 Financial Instruments: Disclosures (as part of Improvements to FRSs
issued in 2010)
The amendments to FRS 107 clarify the required level of disclosures about credit risk and collateral
held and provide relief from disclosures previously required regarding renegotiated loans. The Group has applied the amendments in advance of their effective date (annual periods beginning on or after January 1, 2011). The amendments have been applied retrospectively.
BASIS OF CONSOLIDATION - The consolidated financial statements incorporate the financial statements of the Company and entities controlled by the Company (its subsidiaries). Control is achieved where the Company has the power to govern the financial and operating policies of an entity so as to obtain benefits from its activities.
The results of subsidiaries acquired or disposed of during the year are included in the consolidated statement of comprehensive income from the effective date of acquisition and up to the effective date of disposal, as appropriate.
Where necessary, adjustments are made to the financial statements of subsidiaries to bring their accounting policies into line with those used by other members of the Group.
All intra-group transactions, balances, income and expenses are eliminated in full on consolidation.
For
per
sona
l use
onl
y

43
Non-controlling interests in subsidiaries are identified separately from the Group‟s equity therein. The interest of non-controlling shareholders may be initially measured (at date of original business combination) either at fair value or at the non-controlling interests‟ proportionate share of the fair value
of the acquiree‟s identifiable net assets. The choice of measurement basis is made on an acquisition-by-acquisition basis. Subsequent to acquisition, the carrying amount of non-controlling interests is the amount of those interests at initial recognition plus the non-controlling interests‟ share of subsequent changes in equity. Total comprehensive income is attributed to non-controlling interests even if this results in the non-controlling interests having a deficit balance.
Changes in the Group‟s interest in a subsidiary that do not result in a loss of control are accounted for as equity transactions. The carrying amounts of the Group‟s interests and the non-controlling interests are adjusted to reflect the changes in their relative interests in the subsidiary. Any difference between the amount by which the non-controlling interests are adjusted and the fair value of the consideration paid or received is recognised directly in equity and attributed to owners of the Company.
When the Group loses control of a subsidiary, the profit or loss on disposal is calculated as the difference between (i) the aggregate of the fair value of the consideration received and the fair value of any retained interest and (ii) the previous carrying amount of the assets (including goodwill), and liabilities of the subsidiary and any non-controlling interests. Amounts previously recognised in other comprehensive income in relation to the subsidiary are accounted for (i.e. reclassified to profit or loss or transferred directly to retained earnings) in the same manner as would be required if the relevant assets
or liabilities were disposed of. The fair value of any investment retained in the former subsidiary at the date when control is lost is regarded as the fair value on initial recognition for subsequent accounting under FRS 39 Financial Instruments: Recognition and Measurement or, when applicable, the cost on initial recognition of an investment in an associate or jointly controlled entity.
In the Company‟s financial statements, investments in subsidiaries are carried at cost less any
impairment in net recoverable value that has been recognised in profit or loss.
BUSINESS COMBINATIONS - Acquisitions of subsidiaries and businesses are accounted for using the
acquisition method. The consideration for each acquisition is measured at the aggregate of the
acquisition date fair values of assets given, liabilities incurred by the Group to the former owners of the
acquire, and equity interests issued by the Group in exchange for control of the acquire. Acquisition-
related costs are recognised in profit or loss as incurred. The acquiree‟s identifiable assets, liabilities
and contingent liabilities that meet the conditions for recognition under FRS 103 are recognised at their
fair values at the acquisition date except for deferred tax assets or liabilities which are recognised and
measured in accordance with FRS 12 Income Taxes.
The interest of the non-controlling shareholders in the acquire is initially measured at the non-
controlling interest‟s proportion of the net fair value of the assets, liabilities and contingent liabilities
recognised.
FINANCIAL INSTRUMENT - Financial assets and financial liabilities are recognised on the Group‟s
statement of financial position when the Group becomes a party to the contractual provisions of the
instrument.
For
per
sona
l use
onl
y

44
Effective interest method
The effective interest method is a method of calculating the amortised cost of a financial instrument and
of allocating interest income or expense over the relevant period. The effective interest rate is the rate
that exactly discounts estimated future cash receipts or payments (including all fees on points paid or
received that form an integral part of the effective interest rate, transaction costs and other premiums or
discounts) through the expected life of the financial instrument, or where appropriate, a shorter period.
Income and expense is recognised on an effective interest basis for debt instrument other than those
financial instruments “at fair value through profit or loss”.
Financial assets
Loans and receivables
Trade receivables, loans and other receivables that have fixed or determinable payments that are not
quoted in an active market are classified as “loans and receivables”. Loans and receivables are initially
measured at fair value and subsequently measured at amortised cost using the effective interest method
less impairment. Interest is recognised by applying the effective interest rate method, except for short-
term receivables when the recognition of interest would be immaterial.
Impairment of financial assets
Financial assets are assessed for indicators of impairment at the end of each reporting period. Financial
assets are impaired where there is objective evidence that, as a result of one or more events that
occurred after the initial recognition of the financial asset, the estimated future cash flows of the
financial assets have been impacted.
For financial assets carried at amortised cost, the amount of the impairment is the difference between
the asset‟s carrying amount and the present value of estimated future cash flows, discounted at the
original effective interest rate.
The carrying amount of the financial asset is reduced by the impairment loss directly for all financial
assets with the exception of trade and other receivables where the carrying amount is reduced through
the use of an allowance account. When a trade or other receivable is uncollectible, it is written off
against the allowance account. Subsequent recoveries of amounts previously written off are credited
against the allowance account. Changes in the carrying amount of the allowance account are recognised
in profit or loss.
Derecognition of financial assets
The Group derecognises a financial asset only when the contractual rights to the cash flow from the
asset expire or it transfers the financial asset and substantially all of the risks and rewards of
ownership of the asset to another entity. If the Group neither transfers nor retains substantially all the
risks and rewards of ownership and continues to control the transferred asset, the Group recognises its
retained interest in the asset and an associated liability for amounts it may have to pay. If the Group
retains substantially all the risks and rewards of ownership of a transferred financial asset, the Group
continues to recognise the financial asset and also recognises a collateralised borrowing from such
proceeds received.
For
per
sona
l use
onl
y

45
Financial liabilities and equity instruments
Classification as debt or equity
Financial liabilities and equity instruments issued by the Group are classified according to the substance
of the contractual arrangements entered into and the definitions of a financial liability and an equity
instrument.
Equity instruments
An equity instrument is any contract that evidences a residual interest in the assets of the Group after
deducting all of its liabilities. Equity instruments are recorded at the proceeds received, net of direct
issue costs.
Trade and other payables
Trade and other payables are initially measured at fair value, net of transaction costs, and are
subsequently measured at amortised cost, using the effective interest method, with interest expense
recognised on an effective yield basis, except for short-term payable when the recognition of interest
would be immaterial.
Interest-bearing bank loans and overdrafts are initially measured at fair value, and are subsequently
measured at amortised cost, using the effective interest rate method. Any difference between the
proceeds (net of transaction costs) and the settlement or redemption of borrowings is recognised over
the term of the borrowings in accordance with the Group‟s accounting policy for borrowing costs (see
below).
Convertible debentures
Convertible debentures are regarded as compound instruments, consisting of a liability component and
an equity component. The component parts of compound instruments are classified separately as
financial liabilities and equity in accordance with the substance of the contractual arrangement. At the
date of issue, the fair value of the liability component is estimated using the prevailing market interest
rate for a similar non-convertible instrument. This amount is recorded as a liability on an amortised cost
basis until extinguished upon conversion or at the instrument‟s maturity date. The equity component is
determined by deducting the amount of the liability component from the fair value of the compound
instrument as a whole. This is recognised and included in equity, net of income tax effects, and is not
subsequently remeasured.
Derecognition of financial liabilities
The Group derecognises financial liabilities when, and only when, the Group‟s obligations are
discharged, cancelled or they expire.
For
per
sona
l use
onl
y
46
LEASES - Leases are classified as finance leases whenever the terms of the lease transfer substantially
all the risks and rewards of ownership to the lessee. All other leases are classified as operating leases.
The Group as lessor
Rental income from operating leases is recognised on a straight-line basis over the term of the relevant
lease unless another systematic basis is more representative of the time pattern in which use benefit
derived from the leased asset is diminished. Initial direct costs incurred in negotiating and arranging an
operating lease are added to the carrying amount of the leased asset and recognised on a straight-line
basis over the lease term on the sme basis as the lease income.
The Group as lessee
Rentals payable under operating leases are charged to profit or loss on a straight-line basis over the term
of the relevant lease unless another systematic basis is more representative of the time pattern in which
economic benefits from the leased asset are consumed. Contingent rentals arising under operating
leases are recognised as an expense in the period in which they are incurred.
In the event that lease incentives are received to enter into operating leases, such incentives are
recognised as a liability. The aggregate benefit of incentives is recognised as a reduction of rental
expense on a straight-line basis, except where another systematic basis is more representative of the
time pattern in which economic benefits from the leased asset are consumed.
NON-CURRENT ASSETS HELD FOR SALE - Non-current assets and disposal groups are classified as
held for sale if their carrying amount will be recovered principally through a sale transaction rather than
through continuing use. This condition is regarded as met only when the sale is highly probable and the
asset (or disposal group) is available for immediate sale in its present condition. Management must be
committed to the sale, which should be expected to qualify for recognition as a completed sale within one
year from the date of classification.
When the Group is committed to a sale plan involving loss of control of a subsidiary, all of the assets and
liabilities of that subsidiary are classified as held for sale when the criteria described above are met,
regardless of whether the Group will retain a non-controlling interest in its former subsidiary after the sale.
Non-current assets (and disposal groups) classified as held for sale are measured at the lower of their
previous carrying amount and fair value less costs to sell.
INVENTORIES - Inventories are stated at the lower of cost and net realisable value. Cost comprises
direct materials and, where applicable, direct labour costs and those overheads that have been incurred in
bringing the inventories to their present location and condition. Cost is calculated using the weighted
average method. Net realisable value represents the estimated selling price less all estimated costs of
completion and costs to be incurred in marketing, selling and distribution.
For
per
sona
l use
onl
y

47
PROPERTY, PLANT AND EQUIPMENT - Property, plant and equipment are stated at cost less
accumulated depreciation and any accumulated impairment losses.
Depreciation is charged so as to write off the cost of assets over their estimated useful lives using the
straight-line method on the following bases:
Leasehold building - 40 years
Plant and machinery - 5 years
Office furniture and fittings - 5 to 10 years
Office equipment - 3 to 5 years
Motor vehicle - 5 years
Properties in the course of construction for production, supply or administrative purposes, or for
purposes not yet determined, are carried at cost, less any recognised impairment loss. Cost includes
professional fees and, for qualifying assets, borrowing costs capitalised in accordance with the Group‟s
accounting policy. Depreciation of these assets, on the same basis as other property assets, commences
when the assets are ready for their intended use.
The estimated useful lives, residual values and depreciation method are reviewed at each year end, with
the effect of any changes in estimate accounted for on a prospective basis.
The gain or loss arising on disposal or retirement of an item of property, plant and equipment is
determined as the difference between the sales proceeds and the carrying amount of the asset and is
recognised in profit or loss.
INVESTMENT PROPERTY - Investment property, which is property held to earn rentals and/or for
capital appreciation, including property under construction for such purposes, is measured initially at its
costs, including transaction costs. Subsequent to initial recognition, investment property is measured at
fair value. Gains or losses arising from changes in fair value of investment property are included in
profit or loss for period in which they arise.
INTANGIBLE ASSETS -
Intangible assets acquired separately
Intangible assets acquired separately are reported at cost less accumulated amortisation (where they
have finite useful lives) and accumulated impairment losses. Intangible assets with finite useful lives are
amortised on a straight-line basis over their estimated useful lives. The estimated useful life and
amortisation method are reviewed at the end of each annual reporting period, with the effect of any
changes in estimate being accounted for on a prospective basis. Intangible assets with indefinite useful
lives are not amortised. Each period, the useful lives of such assets are reviewed to determine whether
events and circumstances continue to support an indefinite useful life assessment for the asset. Such
assets are tested for impairment in accordance with the policy below.
For
per
sona
l use
onl
y

48
Internally-generated intangible assets - research and development costs
Expenditure on research activities is recognised as an expense in the period in which it is incurred.
An internally-generated intangible asset arising from development (or from the development phase of an
internal project) is recognised if, and only if, all of the following have been demonstrated:
• the technical feasibility of completing the intangible asset so that it will be available for use or
sale;
• the intention to complete the intangible asset and use or sell it;
• the ability to use or sell the intangible asset;
• how the intangible asset will generate probable future economic benefits;
• the availability of adequate technical, financial and other resources to complete the development
and to use or sell the intangible asset; and
• the ability to measure reliably the expenditure attributable to the intangible asset during its
development.
The amount initially recognised for internally-generated intangible assets is the sum of the expenditure
incurred from the date when the intangible asset first meets the recognition criteria listed above. Where
no internally-generated intangible asset can be recognised, development costs is charged to profit or loss
in the period in which it is incurred.
Subsequent to initial recognition, internally-generated intangible assets are reported at cost less
accumulated amortisation and accumulated impairment losses, on the same basis as intangible assets
acquired separately.
IMPAIRMENT OF TANGIBLE AND INTANGIBLE ASSETS - At the end of each reporting period, the
Group reviews the carrying amounts of its tangible and intangible assets to determine whether there is any
indication that those assets have suffered an impairment loss. If any such indication exists, the recoverable
amount of the asset is estimated in order to determine the extent of the impairment loss (if any). When it
is not possible to estimate the recoverable amount of an individual asset, the Group estimates the
recoverable amount of the cash generating unit to which it belongs.
Recoverable amount is the higher of fair value less costs to sell and value in use. In assessing value in use,
the estimated future cash flows are discounted to their present value using pre-tax discount rate that
reflects current market assessments of the time value of money and the risks specific to the asset for which
the estimates of future cash flows have not been adjusted.
If the recoverable amount of an asset is estimated to be less than its carrying amount, the carrying amount
of the asset is reduced to its recoverable amount. An impairment loss is recognised immediately in profit
or loss, unless the relevant asset is carried at a revalued amount, in which case the impairment loss is
treated as revaluation decrease.
For
per
sona
l use
onl
y

49
Where an impairment loss subsequently reverses, the carrying amount of the asset is increased to the
revised estimate of its recoverable amount, but so that the increased carrying amount does not exceed the
carrying amount that would have been determined had no impairment loss been recognised for the asset in
prior years. A reversal of an impairment loss is recognised as income immediately in profit or loss, unless
the relevant asset is carried at a revalued amount, in which case the reversal of the impairment loss is
treated as a revaluation increase.
PROVISIONS - Provisions are recognised when the Group has a present obligation (legal or
constructive) as a result of a past event, it is probable that the Group will be required to settle the
obligation, and a reliable estimate can be made of the amount of the obligation.
The amount recognised as a provision is the best estimate of the consideration required to settle the
present obligation at the end of the reporting period, taking into account the risks and uncertainties
surrounding the obligation. Where a provision is measured using the cash flows estimated to settle the
present obligation, its carrying amount is the present value of those cash flows.
When some or all of the economic benefits required to settle a provision are expected to be recovered
from a third party, the receivable is recognised as an asset if it is virtually certain that reimbursement
will be received and the amount of the receivable can be measured reliably.
REVENUE RECOGNITION - Revenue is measured at the fair value of the consideration received or
receivable. Revenue is reduced for rebates and other similar allowances.
Sale of goods
Revenue from the sale of goods is recognised when all the following conditions are satisfied:
• the Group has transferred to the buyer the significant risks and rewards of ownership of the goods;
• the Group retains neither continuing managerial involvement to the degree usually associated with
ownership nor effective control over the goods sold;
• the amount of revenue can be measured reliably;
• it is probable that the economic benefits associated with the transaction will flow to the entity; and
• the costs incurred or to be incurred in respect of the transaction can be measured reliably.
Interest income
Interest income is accrued on a time basis, by reference to the principal outstanding and at the effective
interest rate applicable.
For
per
sona
l use
onl
y

50
Dividend income
Dividend income from investments is recognised when the shareholders‟ rights to receive payment have
been established.
Profit sharing
Profit sharing revenue is recognised on an accrual basis in accordance with the substance of the relevant
agreement. Profit sharing determined on a time basis are recognised on a straight-line basis over the
period of the agreement. Profit sharing agreements that are based on production, sales and other measures
are recognised by reference to the underlying arrangement.
Rental income
The Group‟s policy for recognition of revenue from operating leases is described above.
RETIREMENT BENEFIT COSTS - Payments to defined contribution retirement benefit plans are
charged as an expense when employees have rendered the services entitling them to the contributions.
Payments made to state-managed retirement benefit schemes, such as the Singapore Central Provident
Fund and state schemes where the Group‟s operations are located, are dealt with as payments to defined
contribution plans where the company‟s obligation under the plans are equivalent to those arising in a
defined contribution retirement benefit plan.
EMPLOYEE LEAVE ENTITLEMENT - Employee entitlements to annual leave are recognised when
they accrue to employees. A provision is made for the estimated liability for annual leave as a result of
services rendered by employees up to the end of the reporting period.
INCOME TAX - Income tax expense represents the sum of the tax currently payable and deferred tax.
The tax currently payable is based on taxable profit for the year. Taxable profit differs from profit as
reported in the statement of comprehensive income because it excludes items of income or expense that
are taxable or deductible in other years and it further excludes items that are not taxable or tax
deductible. The Group‟s liability for current tax is calculated using tax rates (and tax laws) that have
been enacted or substantively enacted by the end of the reporting period.
Deferred tax is recognised on differences between the carrying amounts of assets and liabilities in the
financial statements and the corresponding tax bases used in the computation of taxable profit, and is
accounted for using the balance sheet liability method. Deferred tax liabilities are generally recognised
for all taxable temporary differences and deferred tax assets are recognised to the extent that it is
probable that taxable profits will be available against which deductible temporary differences can be
utilised. Such assets and liabilities are not recognised if the temporary difference arises from goodwill
or from the initial recognition (other than in a business combination) of other assets and liabilities in a
transaction that affects neither the taxable profit nor the accounting profit.
For
per
sona
l use
onl
y
51
Deferred tax liabilities are recognised on taxable temporary differences arising on investments in
subsidiaries and associates, and interests in joint ventures, except where the Group is able to control the
reversal of the temporary difference and it is probable that the temporary difference will not reverse in
the foreseeable future. Deferred tax assets arising from deductible temporary differences associated
with such investments and interests are only recognised to the extent that it is probable that there will be
sufficient taxable profits against which to utilise the benefits of the temporary differences and they are
expected to reverse in the foreseeable future.
The carrying amount of deferred tax assets is reviewed at the end of each reporting period and reduced
to the extent that it is no longer probable that sufficient taxable profits will be available to allow all or
part of the asset to be recovered.
Deferred tax is calculated at the tax rates that are expected to apply in the period when the liability is
settled or the asset realised based on the tax rates (and tax laws) that have been enacted or substantively
enacted by the end of the reporting period. The measurement of deferred tax liabilities and assets
reflects the tax consequences that would follow from the manner in which the Group expects, at the end
of the reporting period, to recover or settle the carrying amount of its assets and liabilities.
Deferred tax assets and liabilities are offset when there is a legally enforceable right to set off current
tax assets against current tax liabilities and when they relate to income taxes levied by the same taxation
authority and the Group intends to settle its current tax assets and liabilities on a net basis.
Current and deferred tax are recognised as an expense or income in profit or loss.
FOREIGN CURRENCY TRANSACTIONS AND TRANSLATION - The financial statements of each
group entity are measured and presented in the currency of the primary economic environment in which
the company operates (its functional currency). The consolidated financial statements of the Group and
the statement of financial position of the Company are presented in United States dollars, which is the
functional currency of the Company and presentation currency for the consolidated financial statements.
In preparing the financial statements of the individual entities, transactions in currencies other than the
entity‟s functional currency are recorded at the rate of exchange prevailing on the date of the transaction.
At the end of the reporting period, monetary items denominated in foreign currencies are retranslated at
the rates prevailing at the end of the reporting period. Non-monetary items carried at fair value that are
denominated in foreign currencies are retranslated at the rates prevailing on the date when the fair value
was determined. Non-monetary items that are measured in terms of historical cost in a foreign currency
are not retranslated.
Exchange differences arising on the settlement of monetary items, and on retranslation of monetary
items are included in profit or loss for the period. Exchange differences arising on the retranslation of
non-monetary items carried at fair value are included in profit or loss for the period except for
differences arising on the retranslation of non-monetary items in respect of which gains and losses are
recognised other comprehensive income. For such non-monetary items, any exchange component of
that gain or loss is also recognised in other comprehensive income.
Exchange differences on foreign currency borrowings relating to assets under construction for future
productive use, are included in the cost of those assets when they are regarded as an adjustment to
interest costs on those foreign currency borrowings.
For
per
sona
l use
onl
y
52
For the purpose of presenting consolidated financial statements, the assets and liabilities of the Group‟s
foreign operations (including comparatives) are expressed in Singapore dollars using exchange rates
prevailing at the end of the reporting period. Income and expense items (including comparatives) are
translated at the average exchange rates for the period, unless exchange rates fluctuated significantly
during that period, in which case the exchange rates at the dates of the transactions are used. Exchange
differences arising, if any, are recognised in other comprehensive income and accumulated in a separate
component of equity under the header of foreign currency translation reserve.
On the disposal of a foreign operation (i.e. a disposal of the Group‟s entire interest in a foreign
operation, or a disposal involving loss of control over a subsidiary that includes a foreign operation, loss
of joint control over a jointly controlled entity that includes a foreign operation, or loss of significant
influence over an associate that includes a foreign operation), all of the accumulated exchange
differences in respect of that operation attributable to the Group are reclassified to profit or loss. Any
exchange differences that have previously been attributed to non-controlling interests are derecognised,
but they are not reclassified to profit or loss.
In the case of a partial disposal (i.e. no loss of control) of a subsidiary that includes a foreign operation,
the proportionate share of accumulated exchange differences are re-attributed to non-controlling
interests and are not recognised in profit or loss. For all other partial disposals (i.e. of associates or
jointly controlled entities not involving a change of accounting basis), the proportionate share of the
accumulated exchange differences is reclassified to profit or loss.
On consolidation, exchange differences arising from the translation of the net investment in foreign
entities (including monetary items that, in substance, form part of the net investment in foreign entities),
and of borrowings and other currency instruments designated as hedges of such investments, are
recognised in other comprehensive income and accumulated in a separate component of equity under
the header of foreign currency translation reserve.
3 CRITICAL ACCOUNTING JUDGEMENTS AND
KEY SOURCES OF ESTIMATION UNCERTAINTY
In application of the Group‟s accounting policies, which are described in Note 2, management is
required to make judgments, estimates and assumptions about the carrying amounts of assets and
liabilities that are not readily apparent from other sources. The estimates and associated assumptions are
based on historical experience and other factors that are considered to be relevant. Actual results may
differ from these estimates.
The estimates and underlying assumptions are reviewed on an ongoing basis. Revisions to accounting
estimates are recognised in the period in which the estimates is revised if the revision affects only that
period, or in the period of the revision and future periods if the revision affects both current and future
periods.
Critical judgements in applying the company’s accounting policies
Management did not make judgements that will have significant effect on the amounts recognised in the
financial statements apart from those involving estimations which are dealt with below and in other
notes to the financial statements.
For
per
sona
l use
onl
y

53
Key sources of estimation uncertainty
The key assumptions concerning the future, and other key sources of estimation uncertainty at the end
of the reporting period, that have a significant risk of causing a material adjustment to the carrying
amounts of assets and liabilities within the next financial year, are disclosed below.
(a) Impairment of property, plant and equipment
The Group has substantial investments in property, plant and equipment for its manufacturing
facilities in Israel, India and China. Each of these manufacturing facilities, including the related
property, plant and equipment, is a separate cash-generating unit.
Impairment loss is recognised when events and circumstances indicate that the Group and the
Company‟s property, plant and equipment may be impaired and the carrying amounts of the
property, plant and equipment exceed their recoverable amounts.
The recoverable amounts of the cash-generating units (the manufacturing facilities) were
estimated based on its value in use, assuming that the commercial production would commence in
2012 for India (2009 : commence in 2010 for Israel, India and China). In 2010, the commercial
production in Israel has commenced as well as the secondary packaging validation batches in
China. The value in use calculations use cash flow projections based on cash flows over the
period of 10 – 15 years with terminal value (estimated useful life of the licences used at the
facilities). Discount rate of 12.2% (2009 : ranging from 12.5% to 22.5%) per annum were used in
discounting the projected cash flows. In addition to the risk free rate of return, management has
considered additional risk factors such as market risks, execution risks and industry risks. The
discount rate 12.2% per annum used in the cash flow projections is the Company‟s weighted
average cost of capital.
Key assumptions used in the value in use calculation include forecasted sales revenue, which is
based on management‟s estimation of units of production and sales as compared to the external
information on the estimated size of markets in the various countries and were extrapolated using
a constant or nil growth rate. Product sale prices were assumed to be constant based on
management‟s current estimate of the prices, which was based on an analysis of the market price
trends in the industry. The assumptions are in line with management‟s understanding of the
current economic conditions, and the business environment in the pharmaceutical industry and
countries in which the Group operates.
Management believes that this forecast period was justified due to the long-term nature of the
biopharmaceutical industry. As the products to be produced in SciGen facilities are generic
products, management believes that these products would be able to generate revenue and future
cash flows for a period of up to 10 – 15 years, with a terminal value.
The values assigned to the key assumptions represent management‟s assessment of future trends
in the Group‟s manufacturing and distribution of biopharmaceutical products business and are
based on both external sources and internal sources (historical data).
For
per
sona
l use
onl
y

54
Based on the above data and assumptions, which were used to determine the value in use of the
facilities in India and China, supported by the signing of JV agreement in India, the management
assessment confirms the non-impairment for India and China facilities during the year ended
December 31, 2010.
During the year ended December 31, 2010, the Group impairment losses amounting to
approximately US$6.1 million for Israel (2009 : US$17 million for Israel and India) facilities
have been recognised in relation to as follows:
Israel
Based on management‟s assessment of the recoverable amount of the cash-generating unit, an
impairment loss of US$6.1 million (2009 : US$13 million) have been recognised to the property,
plant and equipment of the subsidiary in Israel.
India
In 2009, as the assets of the India‟s facility were idle, the Company had obtained a valuation
(prepared on a direct replacement cost basis) for the property, plant and equipment that were
capitalised as the assets are specialised in nature and there is no active market for the assets.
Consequently, these assets have been recorded at its recoverable amount as at December 31, 2009
following the recognition of approximately US$4 million of impairment loss to profit and loss for
the year ended December 31, 2009. Management has re-assessed the above-mentioned valuation
report and to better reflect the recoverable amount which is based on value-in-use of the asset, a
reversal of impairment loss amounting to US$0.5 million was recognised to profit and loss for the
year ended December 31, 2010. The recoverable amount is estimated by the management using
discounted cash flow model as disclosed in Note 3(d).
China
Based on the management assessment of the recoverable amount of the cash generating unit, no
impairment required. The recoverable amount is estimated by the management using discounted
cash flow model as disclosed in Note 3(d).
The carrying amounts of the Group and the Company‟s property, plant and equipment are
disclosed in Note 11 to the financial statements.
(b) Impairment of intangible assets
The Group has substantial investments in intangible assets, which mainly comprise of licences
and the related development costs. Each of these licences, including the related development
costs, is a separate cash-generating unit.
Impairment loss is recognised when events and circumstances indicate that the Group and the
Company‟s intangible assets may be impaired and the carrying amounts of the intangible assets
exceed their recoverable amounts.
For
per
sona
l use
onl
y

55
The recoverable amounts of the cash-generating units (the licences and development costs) were
estimated based on its value in use for all products other than for Sci-B VacTM
. Value in use was
determined by discounting the future cash flows generated from the continuing use of the cash-
generating units and was based on the following key assumptions:
Key assumptions used in the value in use calculation include forecasted sales revenue,
which is based on management‟s estimation of units of production and sales as compared to
the external information on the estimated size of markets in the various countries. Product
sale prices were assumed to be constant based on management‟s current estimate of the
prices, which was based on an analysis of the market price trends in the industry. The
assumptions are in line with management‟s understanding of the current economic
conditions, and the business environment in the pharmaceutical industry and countries in
which the Group operates.
Cash flows were projected based on actual operating results and the financial budgets for
the period of the estimated useful life of the respective licences of 10-20 years from the date
of registration.
Cash flow forecasts were estimated based on management‟s assessment of the external
information on the estimated size of markets in the various countries.
Management believes that this forecast period was justified due to the long-term nature of
the biopharmaceutical industry. As the licenced products are generic products, management
believes that these licenced products would be able to generate revenue and future cash
flows for a period of up to 20 years.
Product prices were assumed to be constant based on management‟s current estimate of the
prices, which was based on an analysis of the market price trends in the industry.
All assumptions are in line with management‟s understanding of the current economic
conditions, and the business environment in the pharmaceutical industry and countries in
which the Group operates.
Pre-tax discount rates of 12.2% (2009 : 12.5% to 22.5%) per annum were applied in
determining the recoverable amounts of the licences. In addition to the risk free rate of
return, management has considered additional risk factors such as market risk, execution
risk and industry risk. The pre-tax discount rates of 12.2% (2009 : 12.5% to 22.5%) per
annum is the Company‟s weighted average cost of capital.
The values assigned to the key assumptions represent management‟s assessment of future
trends in the Group‟s manufacturing and distribution of biopharmaceutical products
business and are based on both external sources and internal sources (historical data).
For licenses and development costs of SciLinTM
, the recoverable amount estimated by
management using the discounted cash flow model disclosed in Note 3(d).
The carrying amounts of the Group and the Company‟s intangible assets are disclosed in
Note 12 to the financial statements.
For
per
sona
l use
onl
y

56
Impairment loss for licence and development costs of Sci-B-VacTM
The directors and management consider that, in arriving at the above estimates, they have made
the best assessment they can, taking into account the conditions prevailing at December 31, 2010
and current information available to them, including a conservative estimate its net realisable
value.
At the reporting date, the Sci-B-VacTM licence is presented as held-for-sale following the
decision to dispose these assets and focus on recombinant human insulin as its core product and
investing in the development of insulin-related products. Based on the estimated value to sell, the
management is of the opinion that the carrying amounts of the Group and the Company‟s licences
and development costs relating to Sci-B-VacTM is higher than its recoverable amount. As a
result, an impairment loss of US$2,730,000 was recognised to profit or loss for the year ended
December 31, 2010.
(c) Impairment of subsidiaries
The Company maintains impairment losses at a level considered adequate to provide for potential
non-recoverability of investment in subsidiaries. The level of allowance is evaluated by the
Company on the basis of factors that affect the recoverability of the investments. These factors
include, but are not limited to, the activities and financial position of the entities and market
factors. The Company reviews and identifies balances that are to be impaired on a continuous
basis. The amount and timing of recorded expenses for any period would differ if the Company
made different judgement or utilised different estimates. An increase in the Company‟s
impairment losses would increase the Company‟s recorded other operating expenses and decrease
the carrying value of investment in subsidiaries. The carrying amount of the investments in
subsidiaries are reflected in Note 16.
Assessment of recoverability of investment in SciGen BioPharma Private Ltd
In determining whether the investment in SciGen BioPharma Private Ltd is impaired requires an
estimation of the value-in-use. The value-in-use requires the management to estimate the future
cash flows expected to arise from the subsidiary and a suitable discount rate of 12.2%
(2009 : 12.5% to 22.5%) per annum in order to calculate the present value. The calculation of the
value in use of the investment in India facility was based on the publicly available and third party
data like demographics data of UN Statistics Division or diabetes prevalence data of International
Diabetes Federation, IDF Diabetes Atlas 2010 as well as management assumptions. The market
model is based on the development of the number of patients per each market which are derived
from data on population, diabetes prevalence, patients diagnosed and treated, plus share of treated
with human and analogs insulin. The market value is based on the market volume of units sold as
well as its price per unit and the growth rates. The assumed sales per market is based on the
assumed market shares in each year and every market at the level which take into account current
presence of the insulin product on the market, competitive environment, targeted market share and
competitive strength of the potential distributor which can be a Big Pharma company or local
distributor.
For
per
sona
l use
onl
y

57
Sensitivity Analysis on the non-current asset of the Group and the Company
Detailed sensitivity analysis has been carried out and management is confident that the carrying
amount of the non-current assets will be recovered in full. These non-current assets include:
i. The non-current assets of the Group totaling US$21,560,000 comprising of the property,
plant and equipment amounting to US$13,280,000 (Note 11) and intangible assets which
represent licences amounting to US$8,280,000 (Note 12); and
ii. The non-current assets of the Company totaling US$32,440,000 comprising of the
investment in a subsidiary amounting to US$24,160,000 (Note 16) and intangible assets
which represent licences amounting to US$8,280,000 (Note 12).
The management closely monitored, and adjustments will be made in future periods, if future
market activity indicates that such adjustments are appropriate. Should the assumed volume of
units sold by the Group decrease by 5% the impairment loss will increase by US$2,410,000
period. There is no impairment loss required for the Group if the assumed volume of units sold by
the Group increases by 5%.
Impairment loss on loans due from SciGen (I.L.) Ltd and transfer to assets held for sale
At the reporting period, the investment in SciGen (I.L.) Ltd is transferred to assets held for sale
following the decision aimed at focusing on recombinant human insulin as the Group‟s core
product and investing in the development of insulin-related products. Based on management‟s
assessment of conservative estimate of the potential sale transaction price, an impairment loss of
approximately US$6,080,000 (2009 : US$13,310,000) have been recognised to profit or loss
during the year.
(d) Useful lives of property, plant and equipment
The carrying amount of the property, plant and equipment is depreciated on a straight-line basis
over the remaining useful life of each property, plant and equipment. Management reviews and
revises the estimates of the remaining useful life and residual values of the property, plant and
equipment at the end of each reporting period based on their age and condition at that
time. Changes in the way the property, plant and equipment are used and other factors (such as
market or technological factors) could impact the useful life and residual values of the property,
plant and equipment, therefore future depreciation charges could be revised. Any changes in the
useful life and residual values of the property, plant and equipment would impact the depreciation
charges and consequently affect the Group‟s and the Company‟s results.
During the year, there were no changes in useful lives or residual values of the Group‟s property,
plant and equipment.
For
per
sona
l use
onl
y

58
(e) Assessment of recoverability of debts
The assessment of the recoverability of debts of the Group and the Company is based on the on-
going evaluation of collectability and ageing analysis of outstanding debts and on management‟s
estimate of the ultimate realisation of these debts, including credit worthiness and the past
collection history of each debtor. Management has evaluated the recovery of these debts based on
each estimate and is confident that the allowance for doubtful debts, where necessary is adequate.
The carrying amounts of trade and other receivables at the end of the reporting period are
disclosed in Note 8 to the financial statements.
(f) Allowance for inventories
Management reviews the inventory age listing on a periodic basis to identify aged inventory. This
review involves comparison of the carrying value of the inventory items with the respective net
realisable values. The purpose is to ascertain whether an allowance is required to be made in the
financial statements for any obsolete and slow-moving items as well as write-downs of
inventories to net realisable values. In addition, physical counts on all inventories are carried out
on a periodic basis in order to determine whether an allowance is required to be made in respect
of any obsolete and defective inventories identified. Management is satisfied that adequate
allowance for obsolete and slow-moving inventories has been made in the financial statements.
The carrying amount of inventories is disclosed in Note 9 to the financial statements.
(g) Share application costs in subsidiary
SciGen BioPharma Pvt Ltd (“SciGen BioPharma”), incorporated in India, a wholly-owned
subsidiary of the Company. SciGen BioPharma received several tranches of remittances from the
Company since 2006, without share allotment being made against the funds received.
In order to comply with the provision of Reserve Bank of India (“RBI”), SciGen BioPharma has
filed the relevant forms with RBI for the allotment of shares in November 2009 and April 2010.
In view of the late submission of the share application forms, SciGen BioPharma is liable to a
penalty, payable to RBI. Based on the prevailing practices and matters dealt with by RBI, the
Management assessed the penalty at 5% of the sum involved. An accrual of US$1,032,000 (2009 :
US$1,000,000) in respect of the penalty is recognised in the statement of financial position of the
Group at the end of the reporting period. Management is of the view that the amount provided in
the financial statements of the Group as at the end of the reporting period is adequate and based
on best estimate to settle the obligation to RBI, if any. Additional penalty may be payable.
However, no additional provision has been made in the financial statements, as it is currently
impracticable to determine the amount of liability, if any, arising for future potential penalty.
For
per
sona
l use
onl
y

59
(h) Deferred tax assets valuation
At the end of the reporting period, the Group and the Company recognised deferred tax assets amounting to US$7,540,000 and US$7,366,000 respectively. The deferred tax assets are recognised for unused tax losses and some temporary tax differences to the extent that it is probable that taxable profit will be available against which the losses can be utilised. Management judgement is required to dertermine the amount of deferred tax assets that can be recognised based upon the likely timing and level of future taxable profits together with future tax planning strategies. The Company has expected profits from the ultimate holding company for a contract with fixed annual sale for the next seven years with projected net profit of US$53 million. Management is of the view that the recognition of deferred tax assets are appropriate.
4 FINANCIAL INSTRUMENTS, FINANCIAL RISKS AND CAPITAL RISKS MANAGEMENT a) Categories of financial instruments The following table sets out the financial instruments as at the end of the reporting period: Group Company 2010 2009 2010 2009 US$‟000 US$‟000 US$‟000 US$‟000 Financial assets Loans and receivables (including cash and cash equivalents) 5,555 7,589 3,154 5,410 Financial liabilities Amortised cost 102,819 96,973 98,050 92,115 b) Financial risk management policies and objectives Risk management is integral to the whole business of the Group. The Group has a system of
controls in place to create an acceptable balance between the cost of risks occurring and the cost of managing the risks. The management continually monitors the Group‟s risk management process to ensure that an appropriate balance between risk and control is achieved. Risk management policies and systems are reviewed regularly to reflect changes in market conditions and the Group‟s activities.
The Audit Committee oversees how management monitors compliance with the Group‟s risk
management policies and procedures and reviews the adequacy of the risk management framework in relation to the risks faced by the Group. The Group‟s activities expose it to a variety of financial risks, including the effects of changes in foreign currency exchange rates and interest rates. The Group does not hold or issue derivative financial instruments for speculative purposes.
There has been no change to the Group‟s exposure to these financial risks or the manner in which
it manages and measures the risk.
For
per
sona
l use
onl
y

60
(i) Foreign exchange risk management
The Group transacts business in various foreign currencies and therefore is exposed to
foreign exchange risk. The Group manages its exchange risk by monitoring the movements
in exchange rate regularly. The Group does not enter into any forward contracts to hedge
its exposure to movement in exchange rate.
At the end of the reporting period, the carrying amounts of monetary assets and monetary
liabilities denominated in currencies other than the respective group entities‟ functional
currency are as follows: Group Company
Assets Liabilities Assets Liabilities 2010 2009 2010 2009 2010 2009 2010 2009
US$‟000 US$‟000 US$‟000 US $‟000 US$‟000 US$‟000 US$‟000 US$‟000
United States dollars - 417 743 - - - -
Singapore dollar 284 227 448 218 284 227 448 218
Australian dollar 24 29 4 - 24 29 4
Hong Kong dollars - 15 - - - 15 -
Euro - - 975 11 - - 11 11
Philippine Peso - 81 - - - 81 - -
Foreign currency sensitivity
The sensitivity rate used when reporting foreign currency risk to key management personnel
is 10%, which is the change in foreign exchange rate that management deems reasonably
possible which will affect outstanding foreign currency denominated monetary items at year
end.
If the relevant foreign currency strengthens by 10% against the functional currency of the
each group entity, profit and loss will increase (decrease) by:
Group Company
2010 2009 2010 2009
US$‟000 US$‟000 US$‟000 US$‟000
United States dollars (74) 42 - -
Singapore dollar (16) 1 (16) 1
Australian dollar 2 3 2 3
Hong Kong dollar - 2 - 2
Euro (98) (1) (1) (1)
Philippine Peso - 8 - 8
If the relevant foreign currency weakens by 10% against the functional currency of the
company, there would be an equal and opposite impact on the profit or loss.
(ii) Interest rate risk management
Interest rate risk refers to the risk experienced by the company as a result of the fluctuation
in interest rate.
For
per
sona
l use
onl
y

61
The Group‟s exposure to changes in interest rates relates primarily to its interest-bearing
financial liabilities. Interest rate risk is managed by the Group on an on-going basis with
the primary objective of limiting the extent to which net interest expense could be affected
by an adverse movement in interest rates.
Summary quantitative data of the Group‟s and the Company‟s interest-bearing financial
instruments can be found in section (iv) of the Note.
Interest rate risk
The Group has substantial borrowings with variable interest rates and is therefore exposed
to interest rate risk. This arises primarily from borrowings denominated in United States
dollars. The Group does not use derivative financial instruments to hedge its interest rates.
Sensitivity analysis
At the reporting date, the Group and the Company has a floating rate loan from the ultimate
holding company of US$73,727,000 (2009 : US$71,127,000). A change of 100 basis points
in interest rates at the reporting date would (increase)/decrease loss by the amounts shown
below. This analysis assumes that all other variables remain constant. Profit or loss
100 bp 100 bp
increase decrease
US$'000 US$'000
Group and Company
2010
Variable rate loans from ultimate holding company (737) 737
2009
Variable rate loans from ultimate holding company (711) 711
(iii) Credit risk management
Credit risk refers to the risk that counterparty will default on its contractual obligations
resulting in financial loss to the Group.
The Group‟s maximum exposure to credit risk in the event that the counterparties fail to
perform their obligations in relation to each class of recognised financial assets, is the
carrying amount of these assets as indicated in the statements of financial position.
It is the Group‟s policy to transact with creditworthy counterparties. Therefore, the Group
does not expect to incur material credit losses on its financial assets or other financial
instruments.
For
per
sona
l use
onl
y
62
Concentration of credit risk exist when changes in economic, industry or geographical
factors similarly affect the group of counterparties whose aggregate credit exposure is
significant in relation to the Group‟s total credit exposure.
The Group has a credit policy in place which establishes credit limits for customers and
monitors their balances on an ongoing basis. Credit evaluations are performed on all
customers requiring credit over a certain amount. If the customers are independently rated,
these ratings are used. Otherwise, the credit quality of customers is assessed after taking
into account its financial position and past experience with the customers. The Group does
not require collateral in respect of trade and other receivables.
The Group establishes an allowance for impairment that represents its estimate of incurred
losses in respect of trade and other receivables. The main components of this allowance are
a specific loss component that relates to individually significant exposures, and a collective
loss component established for groups of similar assets in respect of losses that have been
incurred but not yet identified. The collective loss allowance is determined based on
historical data of payment statistics for similar financial assets.
The allowance account in respect of trade and other receivables is used to record
impairment losses unless the Group is satisfied that no recovery of the amount owing is
possible. At that point, the financial asset is considered irrecoverable and the amount
charged to the allowance account is written off against the carrying amount of the impaired
financial asset.
Trade receivables consist of a large number of customers, spread across diverse industries
and geographical areas. Management is of the view that there is no concentration of credit
risk. Further details of credit risks on trade and other receivables are disclosed in
Note 8.
Cash and fixed deposits are held with creditworthy financial institutions.
(iv) Liquidity risk management
The Group and the Company maintains sufficient cash and cash equivalents and internally
generated cash flows to finance their activities. As at December 31, 2010, the Group and the
Company has available cash and fixed deposits totalling to US$3,926,000
(2009 : US$4,889,000) to finance its operations. The Group is dependent on its ultimate
holding company for continued financial support.
The Group and the Company‟s financial assets and liabilities are substantially short-term in
nature, except for loans and borrowings as disclosed in Note 18 to the financial statements.
For
per
sona
l use
onl
y

63
Liquidity and interest risk analyses
Non-derivative financial liabilities
The following tables detail the remaining contractual maturity for non-derivative financial
liabilities. The tables have been drawn up based on the undiscounted cash flows of
financial liabilities based on the earliest date on which the Group and the Company can be
required to pay. The table includes both interest and principal cash flows. The adjustment
column represents the possible future cash flows attributable to the instrument included in
the maturity analysis which is not included in the carrying amount of the financial liability
on the statement of financial position.
Group Weighted
average On demand
effective or within Within
interest rate 1 year 1 to 5 years Adjustment Total
% US$‟000 US$‟000 US$‟000 US$‟000
2010
Fixed interest rate loans 11.79 10 2 (1) 11
Variable interest rate loans 1.35 - 85,565 (4,468) 81,097
Non-interest bearing - 4,735 16,976 - 21,711
4,745 102,543 (4,469) 102,819
2009
Fixed interest rate loans 11.79 9 10 (2) 17
Variable interest rate loans 1.28 - 78,136 (987) 77,149
Non-interest bearing - 19,807 - - 19,807
19,816 78,146 (989) 96,973
Company Weighted
average On demand
effective or within Within
interest rate 1 year 1 to 5 years Adjustment Total
% US$‟000 US$‟000 US$‟000 US$‟000
2010
Variable interest rate loans
from ultimate
holding company 1.35 - 85,565 (4,468) 81,097
Non-interest bearing - 1,688 15,265 - 16,953
1,688 100,830 (4,468) 98,050
2009
Variable interest rate loans
from ultimate
holding company 1.28 - 78,136 (987) 77,149
Non-interest bearing - 14,966 - - 14,966
14,966 78,136 (987) 92,115
For
per
sona
l use
onl
y
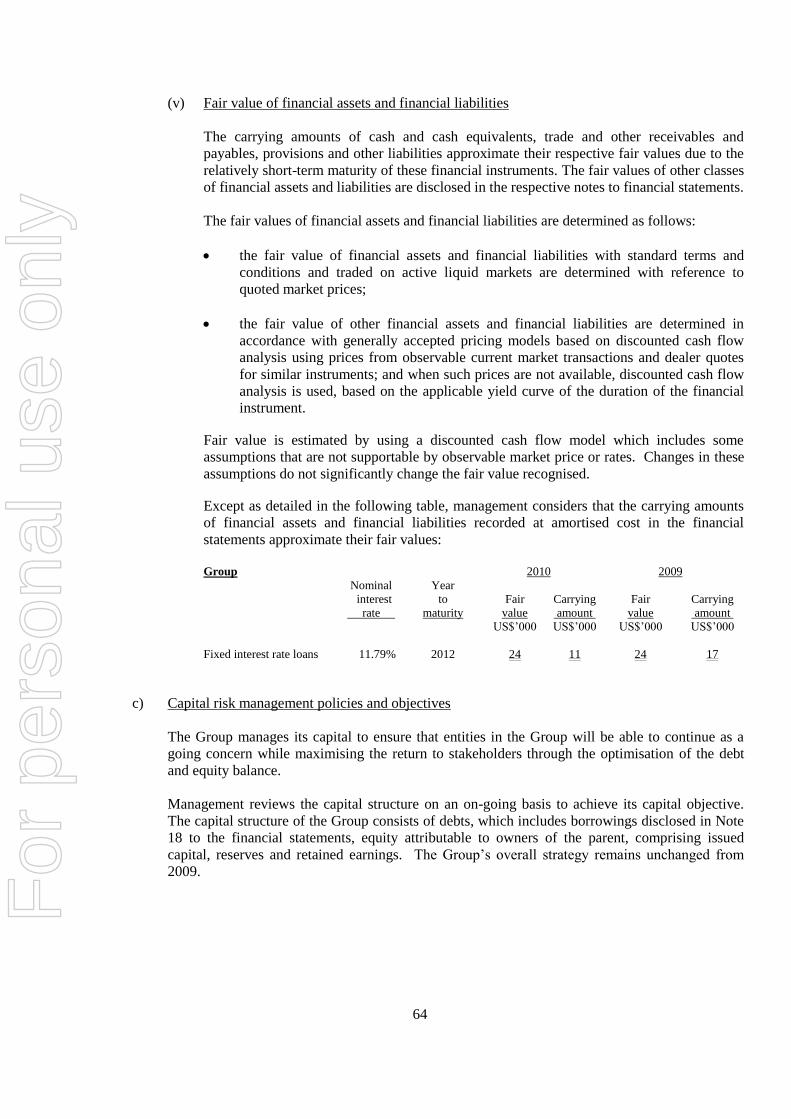
64
(v) Fair value of financial assets and financial liabilities
The carrying amounts of cash and cash equivalents, trade and other receivables and
payables, provisions and other liabilities approximate their respective fair values due to the
relatively short-term maturity of these financial instruments. The fair values of other classes
of financial assets and liabilities are disclosed in the respective notes to financial statements.
The fair values of financial assets and financial liabilities are determined as follows:
the fair value of financial assets and financial liabilities with standard terms and
conditions and traded on active liquid markets are determined with reference to
quoted market prices;
the fair value of other financial assets and financial liabilities are determined in
accordance with generally accepted pricing models based on discounted cash flow
analysis using prices from observable current market transactions and dealer quotes
for similar instruments; and when such prices are not available, discounted cash flow
analysis is used, based on the applicable yield curve of the duration of the financial
instrument.
Fair value is estimated by using a discounted cash flow model which includes some
assumptions that are not supportable by observable market price or rates. Changes in these
assumptions do not significantly change the fair value recognised.
Except as detailed in the following table, management considers that the carrying amounts
of financial assets and financial liabilities recorded at amortised cost in the financial
statements approximate their fair values:
Group 2010 2009
Nominal Year
interest to Fair Carrying Fair Carrying
rate maturity value amount value amount
US$‟000 US$‟000 US$‟000 US$‟000
Fixed interest rate loans 11.79% 2012 24 11 24 17
c) Capital risk management policies and objectives
The Group manages its capital to ensure that entities in the Group will be able to continue as a
going concern while maximising the return to stakeholders through the optimisation of the debt
and equity balance.
Management reviews the capital structure on an on-going basis to achieve its capital objective.
The capital structure of the Group consists of debts, which includes borrowings disclosed in Note
18 to the financial statements, equity attributable to owners of the parent, comprising issued
capital, reserves and retained earnings. The Group‟s overall strategy remains unchanged from
2009.
For
per
sona
l use
onl
y

65
5 HOLDING COMPANY AND RELATED COMPANY TRANSACTIONS The Company is a subsidiary of Bioton S.A., incorporated in Poland, which is also its ultimate holding
company. Related companies refer to members of the ultimate holding company‟s Group of companies. Some of the Group‟s transactions and arrangements are between members of the ultimate holding
company‟s group and the effect of these on the basis determined between the parties is reflected in these financial statements. The intercompany balances are unsecured, interest free and repayable on demand unless otherwise stated.
Transactions between subsidiaries have been eliminated on consolidation. Transactions with the
ultimate holding company during the year are disclosed below. Group and Company 2010 2009 US$'000 US$'000
Ultimate holding company Purchases of goods 2,740 3,206 Profit sharing on sales of insulin in People‟s Republic of China 137 - Proceeds of loan from ultimate holding company 2,600 9,500
6 OTHER RELATED PARTY TRANSACTIONS Related parties are entities with common direct or indirect shareholders and/or directors. Parties are
considered to be related if one party has the ability to control the other party or exercise significant influence over the other party in making financial and operating decisions.
Some of the Company‟s transactions and arrangements are with related parties and the effect of these on
the basis determined between the parties are reflected in these condensed consolidated interim financial statements.
Compensation of directors and key management personnel
Remuneration and retirement benefits paid/payable to directors and key management personnel are as follows:
Group Company 2010 2009 2010 2009 US$‟000 US$‟000 US$‟000 US$‟000
Short-term employee benefits 1,750 1,712 1,262 1,213 Termination benefits - 2,836 - 2,836 Post-employment benefits 123 92 23 26 1,873 4,640 1,285 4,075
The remuneration and retirement benefits paid/payable to directors for year ended December 31, 2009
include the termination benefits of US$2.8 million payable to an ex-director of the Company whose appointment was terminated on June 29, 2009.
For
per
sona
l use
onl
y
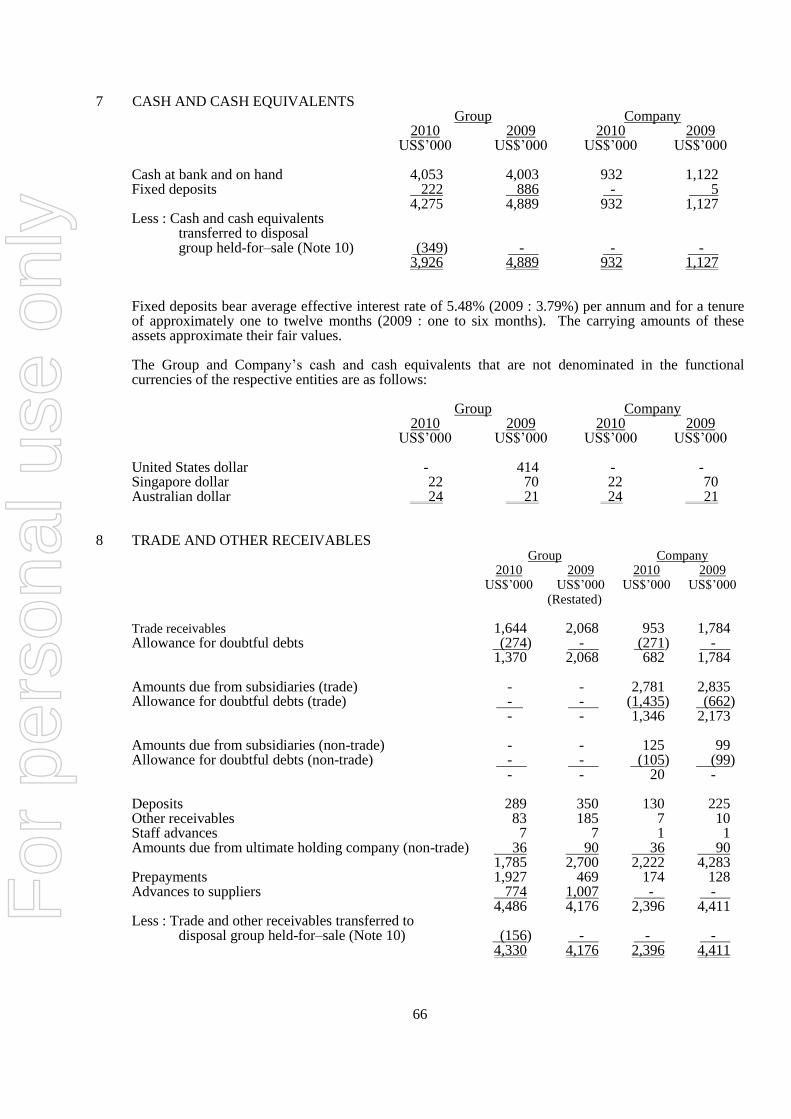
66
7 CASH AND CASH EQUIVALENTS Group Company 2010 2009 2010 2009 US$‟000 US$‟000 US$‟000 US$‟000 Cash at bank and on hand 4,053 4,003 932 1,122 Fixed deposits 222 886 - 5 4,275 4,889 932 1,127 Less : Cash and cash equivalents transferred to disposal group held-for–sale (Note 10) (349) - - - 3,926 4,889 932 1,127 Fixed deposits bear average effective interest rate of 5.48% (2009 : 3.79%) per annum and for a tenure
of approximately one to twelve months (2009 : one to six months). The carrying amounts of these assets approximate their fair values.
The Group and Company‟s cash and cash equivalents that are not denominated in the functional
currencies of the respective entities are as follows: Group Company 2010 2009 2010 2009 US$‟000 US$‟000 US$‟000 US$‟000 United States dollar - 414 - - Singapore dollar 22 70 22 70 Australian dollar 24 21 24 21 8 TRADE AND OTHER RECEIVABLES Group Company 2010 2009 2010 2009 US$‟000 US$‟000 US$‟000 US$‟000 (Restated) Trade receivables 1,644 2,068 953 1,784 Allowance for doubtful debts (274) - (271) - 1,370 2,068 682 1,784 Amounts due from subsidiaries (trade) - - 2,781 2,835 Allowance for doubtful debts (trade) - - (1,435) (662) - - 1,346 2,173 Amounts due from subsidiaries (non-trade) - - 125 99 Allowance for doubtful debts (non-trade) - - (105) (99) - - 20 - Deposits 289 350 130 225 Other receivables 83 185 7 10 Staff advances 7 7 1 1 Amounts due from ultimate holding company (non-trade) 36 90 36 90 1,785 2,700 2,222 4,283 Prepayments 1,927 469 174 128 Advances to suppliers 774 1,007 - - 4,486 4,176 2,396 4,411 Less : Trade and other receivables transferred to disposal group held-for–sale (Note 10) (156) - - - 4,330 4,176 2,396 4,411
For
per
sona
l use
onl
y

67
The non-trade amounts due from subsidiaries and ultimate holding company are unsecured, interest-free and are repayable on demand.
The average credit period on sales of goods is 60 days (2009 : 60 days). No interest is charged on the
trade receivables. Allowances for doubtful debts are recognised against trade receivables based on estimated irrecoverable amounts from the sale of goods, determined by reference to past default experience.
In determining the recoverability of a trade or other receivable the Group considers any change in the credit quality of the trade or other receivable from the date credit was initially granted up to the end of the reporting period. The Group‟s primary exposure to credit risk arises through its trade receivables. Concentration of credit risk relating to trade receivables is limited due to the Group‟s many varied customers. These customers are internationally dispersed, engaged in a wide spectrum of pharmaceutical product distribution activities and sell in a variety of end markets. The Group‟s historical experience in the collection of accounts receivable falls within the recorded allowances. Due to these factors, management believes that no additional credit risk beyond the amounts provided for collection losses is inherent in the Group‟s trade receivables.
The maximum exposure to credit risk for trade receivables due from third parties at the reporting date
(by geographical region) is: Group Company 2010 2009 2010 2009 US$‟000 US$‟000 US$‟000 US$‟000 India - 764 - 764 Vietnam - 460 - 460 Thailand 185 174 184 174 Philippines 379 326 379 326 Australia 338 155 - - Korea 349 81 - - Others 119 108 119 60 1,370 2,068 682 1,784 The Group‟s most significant customer accounts for US$379,000 (2009 : US$764,000) of the trade
receivables carrying amount as at December 31, 2010. The table below is an analysis of trade receivables as at December 31: Group Company 2010 2009 2010 2009 US$‟000 US$‟000 US$‟000 US$‟000 (Restated) Not past due and not impaired 1,075 1,265 473 1,109 Past due but not impaired (i) 295 803 209 675 1,370 2,068 682 1,784 Impaired receivables - collectively assessed (ii) 274 - 271 - Less: Allowance for impairment (274) - (271) - - - - - Total trade receivables, net 1,370 2,068 682 1,784
For
per
sona
l use
onl
y

68
Group Company 2010 2009 2010 2009 US$‟000 US$‟000 US$‟000 US$‟000 (Restated)
(i) Aging of receivables that are past due but not impaired: Past due for 0 to 30 days 169 648 87 581 Past due for 31 to 120 days 126 95 122 83 Past due for more than 120 days - 60 - 11 295 803 209 675
(ii) These amounts are stated before any deduction for impairment losses. Movement in the allowance for doubtful debts: Group Company 2010 2009 2010 2009 US$‟000 US$‟000 US$‟000 US$‟000 Balance at beginning of the year - - - - Increase in allowance recognised in profit or loss (Note 24) 274 - 271 - Balance at end of the year 274 - 271 -
The Group and Company‟s trade and other receivables that are not denominated in the functional currencies of the respective entities are as follows:
Group Company 2010 2009 2010 2009 US$‟000 US$‟000 US$‟000 US$‟000 United States dollar - 3 - - Singapore dollar 262 157 262 157 Australian dollar - 8 - 8 Hong Kong dollars - 15 - 15 Philippine Peso - 81 - 81 9 INVENTORIES Group Company 2010 2009 2010 2009 US$‟000 US$‟000 US$‟000 US$‟000 Raw materials and packing materials 541 454 - - Work-in-progress - 277 - - Finished goods 2,688 1,905 189 130 3,229 2,636 189 130 Less : Inventories transferred to disposal group held-for–sale (Note 10) (2,150) - - - 1,079 2,636 189 130
For
per
sona
l use
onl
y

69
10 ASSETS CLASSIFIED AS HELD-FOR-SALE
The assets and liabilities of the Company‟s subsidiary in Israel, SciGen (I.L.) Ltd and the Sci-B-Vac™
licences and development costs in SciGen Ltd specifically identified and used for the development of
SciGen (I.L) Ltd‟s products (collectively known as the “Net Assets”) are presented as assets and
liabilities held-for-sale respectively, following the decision to dispose these net assets and focus on
recombinant human insulin as its core product and investing in the development of insulin-related
products, which is the global strategy of the ultimate holding company (Note 5).
An impairment loss of US$6.1 million and US$2.7 million have been accounted for the property, plant
and equipment of SciGen (I.L.) Ltd and the related Sci-B-Vac™ licences and development costs
respectively, which is based on conservative estimate of the transaction price. The impairment loss has
been recognised in the profit or loss for the year ended December 31, 2010.
The lease prepayment held in the Company‟s subsidiary in the People‟s Republic of China, Hefei-
SciGen-Bioton Biopharmaceutical Company Ltd recorded as assets classified as held for sale as at
December 31, 2009 at carrying value of US$1.1 million was sold in third quarter of 2010.
(a) The total assets of the disposal group classified as held-for-sale are as follows :
Group Company
Note 2010 2009 2010 2009
US$‟000 US$‟000 US$‟000 US$‟000
Property, plant and equipment 11 - 1,450 - -
Less: Impairment loss - (1,408) - -
Lease prepayment 13 - 1,009 - -
Investment in SciGen (I.L.) Ltd 16 - - 8,079 -
Licence and patents 12 3,623 - 3,573 -
Property, plant and equipment 11 4,522 - - -
Inventories 9 2,150 - - -
Trade and other receivables 8 156 - - -
Cash and cash equivalents 7 349 - - -
Total assets classified as held-for-sale 10,800 1,051 11,652 -
(b) The total liabilities of the disposal group classified as held-for-sale are as follows :
Group Company
Note 2010 2009 2010 2009
US$‟000 US$‟000 US$‟000 US$‟000
Trade and other payables 17 800 - - -
For
per
sona
l use
onl
y

70
11 PROPERTY, PLANT AND EQUIPMENT Plant Office furniture
Land and and and Office Motor Construction
buildings machinery fittings equipment vehicles in progress Total
US$‟000 US$‟000 US$‟000 US$‟000 US$‟000 US$‟000 US$‟000
Group
Cost:
At January 1, 2008 4,430 2,983 4,258 736 232 23,919 36,558
Additions - 235 585 126 - 17,165 18,111
Write-offs - - (21) (4) - (1) (26)
Correction of errors (Note 31) (1,216) - - - - (2,209) (3,425)
Translation differences (335) (170) (7) (42) (8) (4,391) (4,953)
At December 31, 2008 (restated) 2,879 3,048 4,815 816 224 34,483 46,265
Additions 17 35 631 42 47 7,663 8,435
Write-offs - (12) (82) (55) (51) (1,850) (2,050)
Transfer to non-current
assets held-for–sale (Note 10) - - - - - (1,450) (1,450)
Transfer to lease prepayment
(Note 13) (481) - - - - - (481)
Correction of errors (Note 31) (14) - - - - (1,834) (1,848)
Translation differences 74 35 11 24 3 772 919
At December 31, 2009 (restated) 2,475 3,106 5,375 827 223 37,784 49,790
Additions - 192 195 112 6 1,659 2,164
Disposals - - (3) (12) (13) - (28)
Reclassifications 7,288 12 1,280 - - (8,580) -
Transfer to non-current
assets held-for-sale (2,597) (2,407) (6,780) (510) (43) (14,276) (26,613)
Translation differences 139 177 365 48 9 1,804 2,542
At December 31, 2010 7,305 1,080 432 465 182 18,391 27,855
Accumulated depreciation and impairment losses:
At January 1, 2008 32 101 43 157 37 - 370
Depreciation charge
for the year 46 91 31 67 34 - 269
Correction of errors (Note 31) (46) 374 14 34 14 - 390
Disposals - - (4) (3) - - (7)
Translation differences (21) (13) (2) (23) (2) - (61)
At December 31, 2008 (restated) 11 553 82 232 83 - 961
Depreciation charge
for the year - 173 433 104 1 - 711
Correction of errors (Note 31) 6 160 10 8 7 (547) (356)
Impairment losses 1,994 1,157 2,361 234 42 11,180 16,968
Write-offs - - (19) (49) (24) - (92)
Transfer to lease prepayment
(Note 13) (26) - - - - - (26)
Translation differences 2 4 6 17 2 - 31
At December 31, 2009 (restated) 1,987 2,047 2,873 546 111 10,633 18,197
Depreciation charge
for the year 225 267 873 172 33 - 1,570
Impairment losses - 451 1,397 46 - 4,186 6,080
Disposals - - (1) (11) (13) - (25)
Transfer to non-current
assets held for sale (2,132) (2,111) (5,280) (490) (43) (12,035) (22,091)
Translation differences 149 104 283 46 5 745 1,332
At December 31, 2010 229 758 145 309 93 3,529 5,063
For
per
sona
l use
onl
y

71
Plant Office furniture
Land and and and Office Motor Construction
buildings machinery fittings equipment vehicles in progress Total
US$‟000 US$‟000 US$‟000 US$‟000 US$‟000 US$‟000 US$‟000
Carrying amount:
At January 1, 2009 2,868 2,495 4,733 584 141 34,483 45,304
At December 31, 2009 488 1,059 2,502 281 112 27,151 31,593
At December 31, 2010 7,076 322 287 156 89 14,862 22,792
During the current financial year, retrospective restatement of errors were made in 2008 for the following categories of property, plant and equipment :
(i) Land and buildings : Reversal of revaluation surplus US$1,216,000 (ii) Construction in progress : Correction of capitalised costs US$2,209,000
During the current financial year, retrospective restatement of errors were made in 2009 was made for the following categories of property, plant and equipment :
(i) Land and buildings : Correction in value in land premium US$14,000 (ii) Construction in progress : Correction of capitalised costs US$1,834,000
Assets transferred to non-current assets held-for-sale with a carrying value of US$4,522,000 relate to property, plant and equipment of a subsidiary in Israel (Note 10).
Plant Office furniture and and Office machinery fittings equipment Total US$‟000 US$‟000 US$‟000 US$‟000 Company Cost: At January 1, 2009 18 190 138 346 Additions - - 5 5 Disposals - (83) (54) (137) At December 31, 2009 18 107 89 214 Additions - 1 20 21 Disposals - (1) (9) (10) At December 31, 2010 18 107 100 225 Accumulated depreciation: At January 1, 2009 18 43 88 149 Depreciation for the year - 17 22 39 Write-offs - (19) (48) (67) At December 31, 2009 18 41 62 121 Depreciation for the year - 11 18 29 Write-offs - (1) (8) (9) At December 31, 2010 18 51 72 141 F
or p
erso
nal u
se o
nly
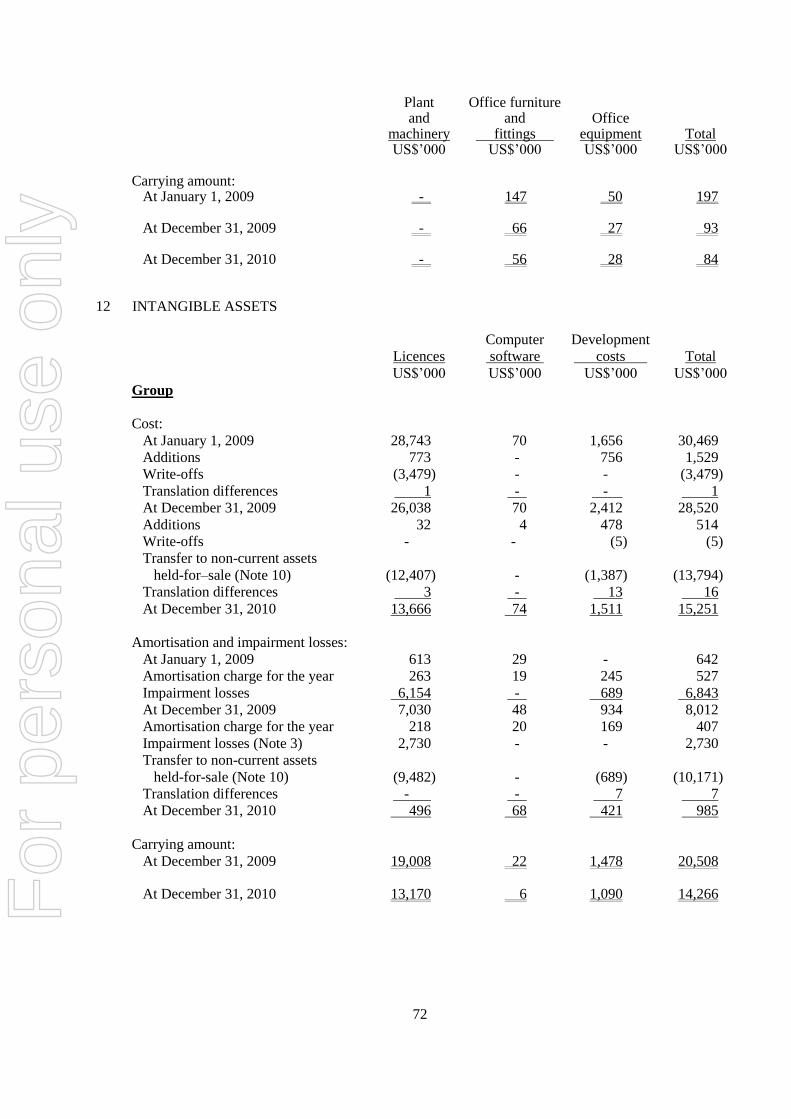
72
Plant Office furniture and and Office machinery fittings equipment Total US$‟000 US$‟000 US$‟000 US$‟000 Carrying amount: At January 1, 2009 - 147 50 197
At December 31, 2009 - 66 27 93
At December 31, 2010 - 56 28 84 12 INTANGIBLE ASSETS
Computer Development
Licences software costs Total
US$‟000 US$‟000 US$‟000 US$‟000
Group
Cost:
At January 1, 2009 28,743 70 1,656 30,469
Additions 773 - 756 1,529
Write-offs (3,479) - - (3,479)
Translation differences 1 - - 1
At December 31, 2009 26,038 70 2,412 28,520
Additions 32 4 478 514
Write-offs - - (5) (5)
Transfer to non-current assets
held-for–sale (Note 10) (12,407) - (1,387) (13,794)
Translation differences 3 - 13 16
At December 31, 2010 13,666 74 1,511 15,251
Amortisation and impairment losses:
At January 1, 2009 613 29 - 642
Amortisation charge for the year 263 19 245 527
Impairment losses 6,154 - 689 6,843
At December 31, 2009 7,030 48 934 8,012
Amortisation charge for the year 218 20 169 407
Impairment losses (Note 3) 2,730 - - 2,730
Transfer to non-current assets
held-for-sale (Note 10) (9,482) - (689) (10,171)
Translation differences - - 7 7
At December 31, 2010 496 68 421 985
Carrying amount:
At December 31, 2009 19,008 22 1,478 20,508
At December 31, 2010 13,170 6 1,090 14,266
For
per
sona
l use
onl
y

73
Computer Development
Licences software costs Total
US$‟000 US$‟000 US$‟000 US$‟000
Company
Cost:
At January 1, 2009 28,679 68 1,603 30,350
Additions 773 - 424 1,197
Write-offs (3,479) - - (3,479)
At December 31, 2009 25,973 68 2,027 28,068
Additions - - 235 235
Transfer to non-current assets
held-for-sale (Note 10) (12,307) - (1,387) (13,694)
At December 31, 2010 13,666 68 875 14,609
Amortisation and impairment losses:
At January 1, 2009 613 27 - 640
Amortisation charge for the year 263 19 - 282
Impairment losses 6,154 - 689 6,843
At December 31, 2009 7,030 46 689 7,765
Amortisation charge for the year 168 20 163 351
Impairment losses (Note 3) 2,730 - - 2,730
Transfer to non-current assets
held-for–sale (Note 10) (9,432) - (689) (10,121)
At December 31, 2010 496 66 163 725
Carrying amount:
At December 31, 2009 18,943 22 1,338 20,303
At December 31, 2010 13,170 2 712 13,884
Included in the above development costs of the Group and the Company are clinical trial and regulatory
compliance costs.
In December 31, 2009, licences for SciFeronTM
, SciTropinTM
and ScilocyteTM
amounting to
approximately US$3.5 million were written off as the company was not proceeding with the commercial
production for these products. In December 31, 2010, development costs amounting to US$5,000 were
written-off in relation to development cost of a subsidiary in India (Note 16).
The intangible assets included above have finite useful lives, over which the assets are amortised. The
amortisation period for development costs incurred is on average 5 to 15 years. Computer software is
amortised over their estimated useful lives of 3 years, and licences is amortised over an average of
8 to 15 years. The remaining useful life of the intangible assets on average is 14 years.
The amortisation expense has been included in the line item “Amortisation of intangible assets” in the
profit or loss. F
or p
erso
nal u
se o
nly

74
Type of licences in respect of biologics
Cost Cost
2010 2009
US$’000 US$’000 Duration of licences
Rights to market and distribute (i):
- Sci-B-VacTM - 8,283 10 - 20 years from the date of first
- SciLinTM 1,118 1,118 approval for sales in specified group
countries or from the date of
repayment.
1,118 9,401
Rights to use technology to establish
large scale production facility (ii):
- Sci-B-VacTM - - 4,089 10 - 20 years from the date of
- SciLinTM 4,267 4,267 approval in the licensed territory.
4,267 8,356
Right to use design plans to construct
large scale production facilities 8,281 8,281 10 - 20 years from the completion of
construction of the facilities.
13,666 26,038
(i) Some of the licences to market and distribute require the Company to obtain the relevant
regulatory approvals in countries specified in the agreements within a specified period of time,
failing which the licence agreements can be terminated. The countries are largely within the Asia
Pacific region.
(ii) The licence with the right to use technology requires the Company to erect and operate a facility
or use a Contract Manufacturer Organisation with a minimal production capacity.
13 LEASE PREPAYMENT
Group Company
2010 2009 2010 2009
US$‟000 US$‟000 US$‟000 US$‟000
(Restated)
Cost:
At January 1 980 1,389 - -
Additions - 119 - -
Transfer from property, plant and
equipment (Note 11) - 481 - -
Transfer to non-current assets held for sale
(Note 10) - (1,009) - -
Translation difference 31 - - -
At December 31 1,011 980 - -
For
per
sona
l use
onl
y
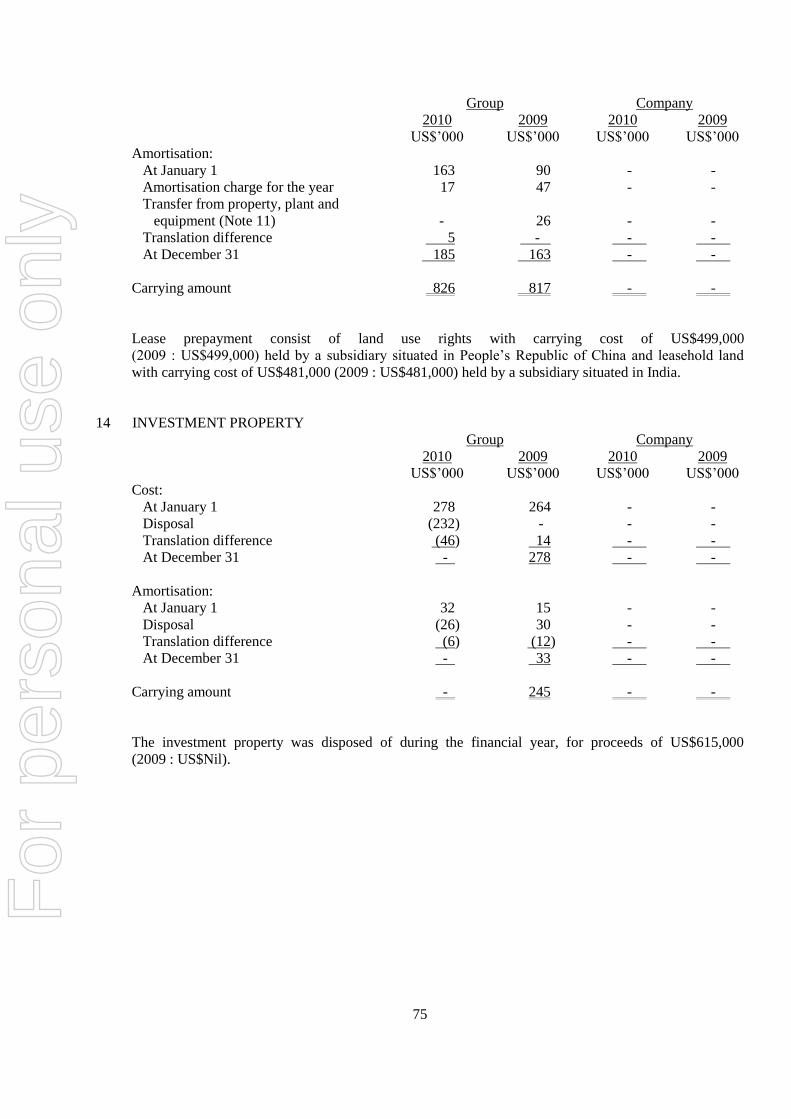
75
Group Company
2010 2009 2010 2009
US$‟000 US$‟000 US$‟000 US$‟000
Amortisation:
At January 1 163 90 - -
Amortisation charge for the year 17 47 - -
Transfer from property, plant and
equipment (Note 11) - 26 - -
Translation difference 5 - - -
At December 31 185 163 - -
Carrying amount 826 817 - -
Lease prepayment consist of land use rights with carrying cost of US$499,000
(2009 : US$499,000) held by a subsidiary situated in People‟s Republic of China and leasehold land
with carrying cost of US$481,000 (2009 : US$481,000) held by a subsidiary situated in India.
14 INVESTMENT PROPERTY
Group Company
2010 2009 2010 2009
US$‟000 US$‟000 US$‟000 US$‟000
Cost:
At January 1 278 264 - -
Disposal (232) - - -
Translation difference (46) 14 - -
At December 31 - 278 - -
Amortisation:
At January 1 32 15 - -
Disposal (26) 30 - -
Translation difference (6) (12) - -
At December 31 - 33 - -
Carrying amount - 245 - -
The investment property was disposed of during the financial year, for proceeds of US$615,000
(2009 : US$Nil).
For
per
sona
l use
onl
y
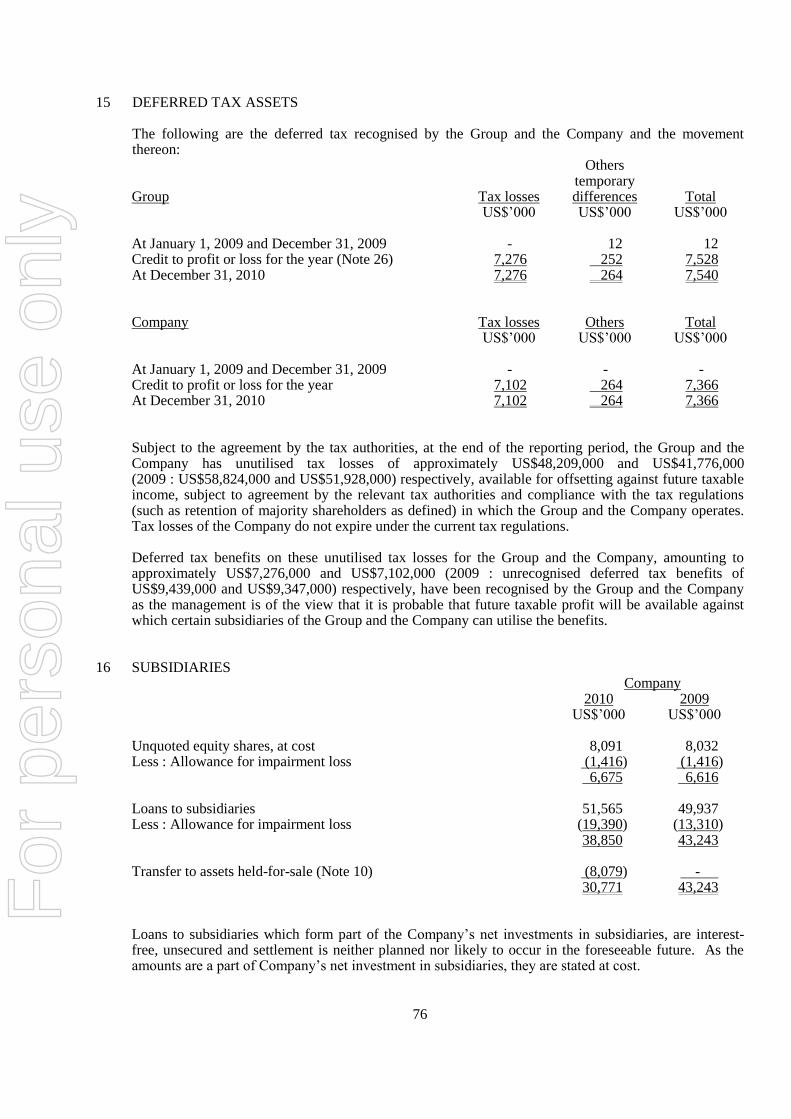
76
15 DEFERRED TAX ASSETS The following are the deferred tax recognised by the Group and the Company and the movement
thereon: Others temporary Group Tax losses differences Total
US$‟000 US$‟000 US$‟000 At January 1, 2009 and December 31, 2009 - 12 12 Credit to profit or loss for the year (Note 26) 7,276 252 7,528 At December 31, 2010 7,276 264 7,540
Company Tax losses Others Total US$‟000 US$‟000 US$‟000 At January 1, 2009 and December 31, 2009 - - - Credit to profit or loss for the year 7,102 264 7,366 At December 31, 2010 7,102 264 7,366
Subject to the agreement by the tax authorities, at the end of the reporting period, the Group and the Company has unutilised tax losses of approximately US$48,209,000 and US$41,776,000 (2009 : US$58,824,000 and US$51,928,000) respectively, available for offsetting against future taxable income, subject to agreement by the relevant tax authorities and compliance with the tax regulations (such as retention of majority shareholders as defined) in which the Group and the Company operates. Tax losses of the Company do not expire under the current tax regulations.
Deferred tax benefits on these unutilised tax losses for the Group and the Company, amounting to approximately US$7,276,000 and US$7,102,000 (2009 : unrecognised deferred tax benefits of US$9,439,000 and US$9,347,000) respectively, have been recognised by the Group and the Company as the management is of the view that it is probable that future taxable profit will be available against which certain subsidiaries of the Group and the Company can utilise the benefits.
16 SUBSIDIARIES Company 2010 2009 US$‟000 US$‟000 Unquoted equity shares, at cost 8,091 8,032 Less : Allowance for impairment loss (1,416) (1,416) 6,675 6,616 Loans to subsidiaries 51,565 49,937 Less : Allowance for impairment loss (19,390) (13,310) 38,850 43,243 Transfer to assets held-for-sale (Note 10) (8,079) - 30,771 43,243
Loans to subsidiaries which form part of the Company‟s net investments in subsidiaries, are interest-free, unsecured and settlement is neither planned nor likely to occur in the foreseeable future. As the amounts are a part of Company‟s net investment in subsidiaries, they are stated at cost.
For
per
sona
l use
onl
y

77
Proportion of
Country of ownership
of incorporation interest and
Name of subsidiary and operations voting power held Principal activities
2010 2009
% %
SciGen (Australia) Pty Ltd (1) Australia 100 100 Sales and distribution
SciGen Korea Ltd (1) Republic of Korea 100 100 Sales and distribution
SciGen (I.L.) Ltd (2) State of Israel 100 100 Manufacturing, sales
and distribution
Hefei-SciGen-Bioton People‟s Republic of China 52 52 Manufacturing, sales
Biopharmaceutical Company Ltd (3) and distribution
SciGen BioPharma Private Ltd (2) Republic of India 100 100 Manufacturing, sales
and distribution
SciGen (Beijing) Biotechnology Co., People‟s Republic of China 100 100 Sales and distribution
Ltd (1)
(1) Not required to be audited in accordance with the laws of country of incorporation, but audited for
Group consolidation purposed only by Deloitte & Touche LLP.
(2) Audited by overseas practices of Deloitte & Touche Tohmatsu Limited for Group consolidation
purposes only.
(3) Audited by overseas practices of Deloitte & Touche Tohmatsu Limited.
17 TRADE AND OTHER PAYABLES Group Company
2010 2009 2010 2009
US$‟000 US$‟000 US$‟000 US$‟000
(Restated)
Accrued interest payable to ultimate
holding company (Note 5) 7,370 6,022 7,370 6,022
Trade payables to outside parties 994 870 475 435
Short-term portion of obligations to licensors - 195 - 195
Amounts due to ultimate holding
company (trade) (Note 5) 12,814 10,139 12,814 10,139
Amounts due to a subsidiary (non-trade)
(Note 5) - - 271 204
Amounts due to ultimate holding company
(non-trade) (Note 5) 3,605 1,297 2,641 1,297
Other payables 2,119 1,852 294 280
Accrued employee benefits 52 1,794 15 1,388
Accrued operating expenses 2,927 3,250 443 1,028
Advances from customers - 410 - -
29,881 25,829 24,323 20,988
Less : amount due for settlement after 12
months (7,370) (6,022) (7,370) (6,022)
Less : Trade and other payables transferred to
disposal group held-for-sale (Note 10) (800) - - -
Amount due for settlement within 12 months 21,711 19,807 16,953 14,966
For
per
sona
l use
onl
y

78
The average credit period on purchase of goods is 60 days (2009 : 60 days). No interest is charged on trade and other payables.
The non-current accrued interest payable to ultimate holding company comprises the loan interest payable to the ultimate holding company which is due for repayment on December 31, 2015. The non-current accrued interest payable is stated at amortised cost. The difference between the fair value and the carrying value is recognised in profit and loss. The fair value was determined based on discounted expected future principal cash flows, discounted at the effective interest rate of 1.33% (2009 : 1.76%) per annum at the reporting date. These amounts were subsequently measured at amortised cost using
the effective interest rate method. Non-trade amounts due to a subsidiary (Note 16) and related parties (Note 5) are unsecured, interest-
free and are repayable on demand. The Group and Company‟s trade and other payables that are not denominated in the functional
currencies of the respective entities are as follows: Group Company 2010 2009 2010 2009 US$‟000 US$‟000 US$‟000 US$‟000
Singapore dollar 448 218 448 218 Australian dollar 4 - 4 - Euro 975 11 11 11
18 LOANS AND BORROWINGS
Group Company 2010 2009 2010 2009 US$‟000 US$‟000 US$‟000 US$‟000 Loans from ultimate holding company (Note 5) 73,727 71,127 73,727 71,127
Secured bank loans 11 17 - - Convertible debenture 743 - - - Amounts due for settlement after 12 months 74,481 71,144 73,727 71,127 The loans from ultimate holding company were made on normal commercial terms and conditions and
bear interest of LIBOR 3 months + 1% (2009 : LIBOR 3 months + 1%) per annum. The loans and interests are due for repayment on December 31, 2015.
The bank loans are secured on property, plant and equipment with a carrying amount of US$26,000
(2009 : US$30,000) (Note 11).
On December 22, 2010, convertible debenture was issued to Anglo-Gulf Ltd (“Anglo-Gulf”) amounting
to US$750,000, at fixed rate of 6% per annum, pursuant to the investment agreement signed with the
Company. The investment agreement between the Company and Anglo-Gulf was for the issue and
allotment of new shares in SciGen BioPharma Pvt. Ltd.(“SciGen BioPharma”), which is 100% owned
by the Company and operating in India. This transaction involves a cash injection of US$8 million by
Anglo-Gulf for 49.99% interest in the equity of SciGen BioPharma. The date for conversion of the
debenture to equity is the earlier of March 31, 2012 or the date of injecting the final tranche of US$8
million.
For
per
sona
l use
onl
y

79
The weighted average effective interest rates per annum relating to borrowings at the reporting dates for
the Group and Company are as follows:
Group Company
2010 2009 2010 2009
% % % %
Secured bank loans 11.79 11.79 - -
Loans from ultimate holding company 1.35 1.28 1.35 1.28
Convertible debenture 6.00 - - -
Management estimates the fair value of the Group and the Company‟s borrowings, by discounting their
future cash flows at the market rate to be as follows:
Group Company
2010 2009 2010 2009
US$‟000 US$‟000 US$‟000 US$‟000
Secured bank loans 12 19 - -
Loans from ultimate holding company 85,565 78,136 85,565 78,136 Convertible debenture 795 - - -
The Group loans and borrowings that are not denominated in the functional currencies of the respective entities are as follows:
Group Company 2010 2009 2010 2009 US$‟000 US$‟000 US$‟000 US$‟000 United States dollar 743 - - - 19 SHARE CAPITAL Group and Company 2010 2009 2010 2009 Number of ordinary shares US$‟000 US$‟000 („000) („000) Issued and fully paid up: At beginning and end of year 552,270 552,270 42,530 42,530 The Company has one class of ordinary shares which carry one vote per share, has no par value and
carries a right to dividend as and when declared by the company.
For
per
sona
l use
onl
y

80
20 TRANSLATION RESERVES Group Company 2010 2009 2010 2009 US$‟000 US$‟000 US$‟000 US$‟000 Foreign currency translation reserve 1,313 (1,051) - -
The foreign currency translation reserve comprises foreign exchange differences arising from the translation of the financial statements of foreign operations whose functional currencies are different from the functional currency of the Company, and the exchange differences on foreign currency loans to subsidiaries, which form part of the Group‟s net investment in foreign operations.
21 REVENUE Group 2010 2009 US$'000 US$'000 Sales of goods 12,369 11,251 22 OTHER INCOME Group 2010 2009 US$'000 US$'000 Rental income from investment property - 18 Others 525 233 525 251 Investment property was disposed of in January 2010. 23 OTHER OPERATING EXPENSES Group 2010 2009 US$'000 US$'000 Advertising and promotional expenses 1,655 2,065 Professional and consultancy fees 884 778 Travel and entertainment expenses 565 557 Insurance premium 310 256 Rental expenses 582 537 Regulatory and clinical research expenses 236 182 Administrative and communication expenses 1,454 2,369 Statutory compliance fee 146 1,153 Storage and distribution expenses 438 282 Property tax and license fees 57 600 Others 845 127 7,172 8,906
For
per
sona
l use
onl
y

81
24 LOSS FOR THE YEAR The following items have been included in arriving at loss from operating activities before income tax: Group 2010 2009 US$'000 US$'000 Allowance for doubtful debts 274 - Bad debts written back - (5) Gain on disposal of property, plant and equipment (1) - Gain on disposal of investment property (407) - Gain on disposal of asset held-for-sale (3) - Operating lease expenses 570 645 Auditors‟ remuneration 146 153 Employee benefits expense (including directors‟ remuneration) Contributions to defined contribution plans, included in staff costs 28 26 Others 6,115 7,165 25 FINANCE INCOME AND EXPENSE Group 2010 2009 US$'000 US$'000 Interest income received/receivable from: - banks 46 22 Unrealised exchange gain - 513 Finance income 46 535
Interest expense paid/payable to: - banks (25) (31) - ultimate holding company (1,472) (1,414) - other entities (55) - (1,552) (1,445) Unrealised exchange loss (299) - Finance expenses (1,851) (1,445) 26 INCOME TAX CREDIT Group 2010 2009 US$'000 US$'000 Current year 64 (19) Deferred tax expense (Note 15) (7,528) (70) Total income tax credit (7,464) (89)
For
per
sona
l use
onl
y
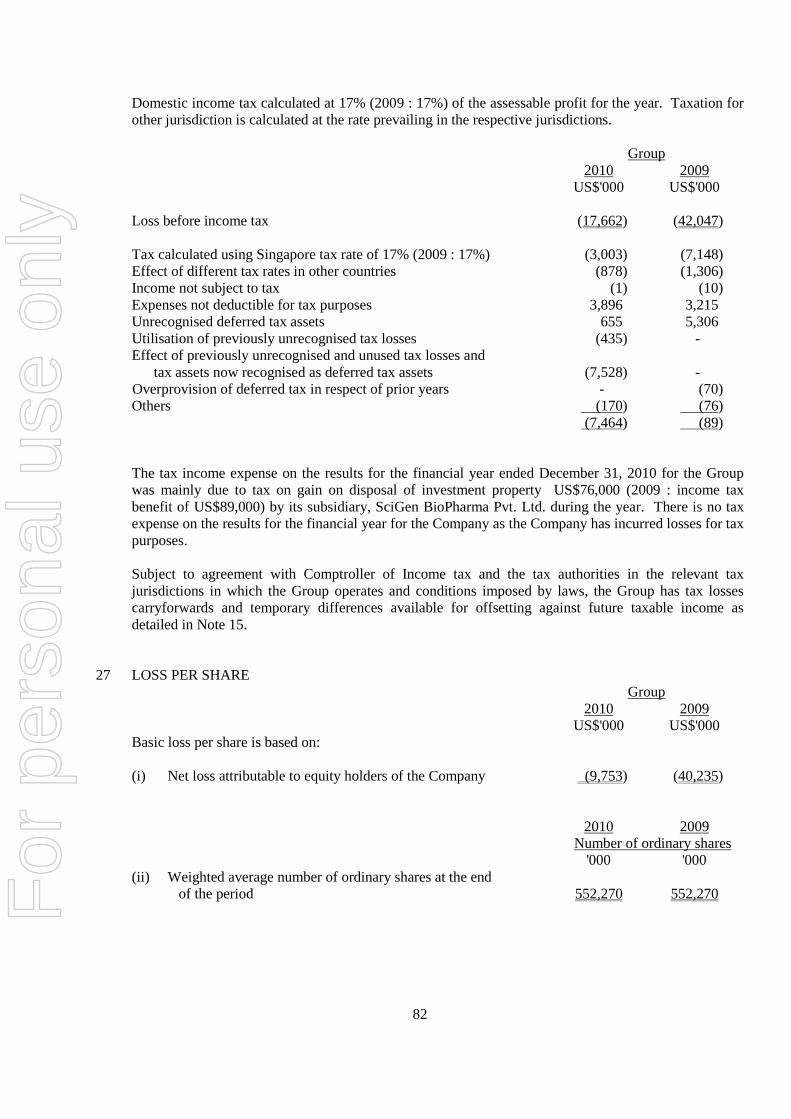
82
Domestic income tax calculated at 17% (2009 : 17%) of the assessable profit for the year. Taxation for
other jurisdiction is calculated at the rate prevailing in the respective jurisdictions.
Group
2010 2009
US$'000 US$'000
Loss before income tax (17,662) (42,047)
Tax calculated using Singapore tax rate of 17% (2009 : 17%) (3,003) (7,148)
Effect of different tax rates in other countries (878) (1,306)
Income not subject to tax (1) (10)
Expenses not deductible for tax purposes 3,896 3,215
Unrecognised deferred tax assets 655 5,306
Utilisation of previously unrecognised tax losses (435) -
Effect of previously unrecognised and unused tax losses and
tax assets now recognised as deferred tax assets (7,528) -
Overprovision of deferred tax in respect of prior years - (70)
Others (170) (76)
(7,464) (89)
The tax income expense on the results for the financial year ended December 31, 2010 for the Group
was mainly due to tax on gain on disposal of investment property US$76,000 (2009 : income tax
benefit of US$89,000) by its subsidiary, SciGen BioPharma Pvt. Ltd. during the year. There is no tax
expense on the results for the financial year for the Company as the Company has incurred losses for tax
purposes.
Subject to agreement with Comptroller of Income tax and the tax authorities in the relevant tax
jurisdictions in which the Group operates and conditions imposed by laws, the Group has tax losses
carryforwards and temporary differences available for offsetting against future taxable income as
detailed in Note 15.
27 LOSS PER SHARE
Group
2010 2009
US$'000 US$'000
Basic loss per share is based on:
(i) Net loss attributable to equity holders of the Company (9,753) (40,235)
2010 2009
Number of ordinary shares
'000 '000
(ii) Weighted average number of ordinary shares at the end
of the period 552,270 552,270 For
per
sona
l use
onl
y
83
28 SEGMENT INFORMATION
Segment information is presented in respect of the Group‟s geographical segments. The reportable segment presentation is based on the Group‟s management and internal reporting structure, used for its strategic decision-making purposes. Intersegment pricing is determined on mutually agreed terms. The Group determines and presents operating segments based on the information that internally is provided to the Chief Executive Officer (“CEO”), who is the Group‟s chief operating decision maker. An operating segment is a component of the Group that engages in business activities from which it may earn revenues and incur expenses, including revenues and expenses that relate to transactions with any of the Group‟s other components. An operating segment‟s operating results are reviewed regularly by the CEO to make decisions about resources to be allocated to the segment and assess its performance, and for which discrete financial information is available. The accounting policies of the reportable segments are the same as the Group‟s accounting policies described in Note 2. Segment results, assets and liabilities include items directly attributable to a segment as well as those that can be allocated on a reasonable basis. Unallocated items comprise mainly investments (other than the investment property) and related revenue, loans and expenses, corporate assets and head office expenses. Segment capital expenditure is the total cost incurred during the year to acquire property, plant and equipment, and intangible assets other than goodwill. The Group‟s reportable segments are as follows: Singapore The home country of the parent entity which is also the main operating entity. The areas of operation are principally corporate office functions and sales and marketing. Australia Includes sales and marketing activities. India Includes sales and marketing and manufacturing activities. Korea Includes sales and marketing activities. Thailand Includes sales and marketing activities. Israel Includes sales and marketing and manufacturing activities. Vietnam Includes sales and marketing activities. Philippines Includes sales and marketing activities. China Includes sales and marketing and manufacturing activities. Others Comprises operations carried on in Indonesia and Pakistan. None of these segments meets any of the quantitative thresholds for determining reportable segments in 2010 or 2009. Major customers Revenue from two customers, namely from Vietnam and Thailand, represent approximately US$3,895,000 (2009 : US$2,496,000 and US$1,730,000 from India and Thailand respectively) of the Company‟s total revenue.
For
per
sona
l use
onl
y

84
Information regarding the Group‟s reportable segments is presented below.
Singapore Australia India Korea Thailand Israel Vietnam Philippines China Others Unallocated Total
US$‟000 US$‟000 US$‟000 US$‟000 US$‟000 US$‟000 US$‟000 US$‟000 US$‟000 US$‟000 US$‟000 US$‟000
For year ended Dec 31, 2010
Revenue
Sales to external customers 2 4,868 - 1,668 2,213 164 1,682 1,351 - 421 - 12,369 Inter-segment sales 2,553 (1,346) - (1,207) - - - - - - - -
Total sales revenue 2,555 3,522 - 461 2,213 164 1,682 1,351 - 421 - 12,369
Results
EBITDA (24) 1,281 (691) 71 298 (9,100) 268 243 (631) 231 (5,809) (13,863) Depreciation & amortisation - (41) (111) (7) - (1,169) - (2) (282) - (382) (1,994)
Interest expense - 79 (9) 29 - (367) - (1) (1) - (1,581) (1,851)
Interest income - 29 10 - - - - - 7 - - 46 (24) 1,348 (801) 93 298 (10,636) 268 240 (907) 231 (7,772)
Loss from operating activities
before income tax (17,662) Income tax expense 7,464
Loss for the year (10,198)
Non-controlling interest 445 Loss attributable to equity holders 9,753
Singapore Australia India Korea Thailand Israel Vietnam Philippines China Others Unallocated Total
US$‟000 US$‟000 US$‟000 US$‟000 US$‟000 US$‟000 US$‟000 US$‟000 US$‟000 US$‟000 US$‟000 US$‟000
As at Dec 31, 2010
Segment Assets
Total non-current assets - 374 13,744 20 - - - 3 9,777 - 13,966 37,884
Deferred tax assets - 174 - - - - - - - - 7,366 7,540
Total current assets 2 1,629 3,515 1,250 184 7,227 4 494 838 119 4,873 20,135 Segment assets 2 2,177 17,259 1,270 184 7,227 4 497 10,615 119 26,205 65,559
Segment liabilities
Segment liabilities - (122) (3,642) (102) (55) (800) - (100) (2,409) - (97,132) (104,362)
* EBITDA – Earnings before interest, Taxation, Depreciation and Amortisation
For
per
sona
l use
onl
y

85
Singapore Australia India Korea Thailand Israel Vietnam Philippines China Others Unallocated Total
US$‟000 US$‟000 US$‟000 US$‟000 US$‟000 US$‟000 US$‟000 US$‟000 US$‟000 US$‟000 US$‟000 US$‟000
For year ended Dec 31, 2010
Other segment information
Capital expenditure on property,
plant and equipment (“PPE”)/
intangible assets (“IA”) - 311 381 5 - 152 - - 1,571 - 258 2,678
Material non-cash items Impairment losses on PPE - - - - - (6,080) - - - - - (6,080)
Impairment losses on IA - - - - - - - - - - (2,730) (2,730)
Write-off of IA - - (5) - - - - - - - - (5)
For
per
sona
l use
onl
y

86
Singapore Australia India Korea Thailand Israel Vietnam Philippines China Others Unallocated Total
US$‟000 US$‟000 US$‟000 US$‟000 US$‟000 US$‟000 US$‟000 US$‟000 US$‟000 US$‟000 US$‟000 US$‟000
For year ended Dec 31, 2009
Revenue
Sales to external customers 10 3,937 2,553 879 1,673 - 1,074 1,017 - 108 - 11,251
Inter-segment sales 2,198 (1,873) - (325) - - - - - - - -
Total sales revenue 2,208 2,064 2,553 554 1,673 - 1,074 1,017 - 108 - 11,251
Results EBITDA (9) 1,198 (6,476) (237) 219 (14,521) 202 136 (3,570) (44) (16,533) (39,635) Depreciation & amortisation - (26) (466) (4) - (641) - (3) (47) - (317) (1,504)
Interest expense - (1) (14) - - (17) - (3) - - (1,410) (1,445)
Interest income - 459 (12) (40) - 140 - - 6 - (98) 535 (9) 1,630 (6,968) (201) 219 (15,039) 202 130 (3,611) (44) (18,358)
Loss from operating activities
before income tax (42,049) Income tax expense 89
Loss for the year (41,960)
Non-controlling interest 1,725 Loss attributable to equity holders (40,235)
Singapore Australia India Korea Thailand Israel Vietnam Philippines China Others Unallocated Total
US$‟000 US$‟000 US$‟000 US$‟000 US$‟000 US$‟000 US$‟000 US$‟000 US$‟000 US$‟000 US$‟000 US$‟000
As at Dec 31, 2009
Segment Assets Total non-current assets - 96 13,312 21 - 11,115 - 3 8,218 - 20,398 53,163
Deferred tax assets - - - - - 12 - - - - - 12
Total current assets - 2,070 2,807 464 174 2,648 462 429 2,057 76 1,565 12,752 Segment assets - 2,166 16,119 485 174 13,775 462 432 10,275 76 21,963 65,927
Segment liabilities
Segment liabilities - (124) (3,277) (80) (23) (793) (362) (50) (1,512) - (90,807) (97,028)
* EBITDA - Earnings before interest, Taxation, Depreciation and Amortisation
For
per
sona
l use
onl
y

87
Singapore Australia India Korea Thailand Israel Vietnam Philippines China Others Unallocated Total
US$‟000 US$‟000 US$‟000 US$‟000 US$‟000 US$‟000 US$‟000 US$‟000 US$‟000 US$‟000 US$‟000 US$‟000
For year ended Dec 31, 2009
Other segment information
Capital expenditure on property,
plant and equipment (“PPE”)/
intangible assets (“IA”) - 34 2,234 17 - 3,559 - - 2,919 - 1,202 9,965
Material non-cash items Impairment losses on PPE - - (3,420) - - (13,000) - - (1,408) - - (17,828)
Write-off of PPE - - - - - - - - (1,850) - (110) (1,960)
Impairment losses on IA - - - - - - - - - - (6,842) (6,842)
Write-off of IA - - - - - - - - - - (3,479) (3,479)
For
per
sona
l use
onl
y

88
29 COMMITMENTS
Commitments not reflected in the financial statements at the reporting date are as follows:
(a) Operating lease commitments
The Group as lessee
Group
2010 2009
US$ US$
Minimum lease payments under
operating leases recognised as an
expense in the year 570 645
The Group leases a number of offices under operating leases. The leases typically run for an initial
period of 1 to 5 years with an option to renew the lease after that date. Lease payments are usually
revised when the leases are renewed to reflect market rentals.
At December 31, 2010, the Group and the Company have commitments for future minimum lease
payments under non-cancellable operating leases as follows:
Group Company
2010 2009 2010 2009
US$‟000 US$‟000 US$‟000 US$‟000
Within 1 year 482 575 176 282
After 1 year but within 5 years 370 235 255 13
852 810 431 295
The Group as lessor
The Group leased out its investment property which has been disposed during the year. Operating
lease rentals are receivable as follows;
Group Company
2010 2009 2010 2009
US$‟000 US$‟000 US$‟000 US$‟000
Within 1 year - 3 - -
After 1 year but within 5 years - - - -
- 3 - -
For
per
sona
l use
onl
y

89
(b) Capital commitments
Group Company
2010 2009 2010 2009
US$‟000 US$‟000 US$‟000 US$‟000
Capital expenditure contracted
but not provided for in the
financial statements is as follows:
Acquisition of property,
plant and equipment 6,200 6,200 - -
This capital commitment will be funded from the US$8 million capital injection by Anglo-Gulf.
30 EVENTS AFTER THE REPORTING PERIOD
On March 3, 2011, the Board of Directors announced the resignation of Mr. Martin Cooper as Director
and Chief Financial Officer (“CFO”) of the Company. In replacement, the Board of Directors have
appointed Mr. Adam Aleksandrowicz as the CFO and Director of the Company. Mr. Aleksandrowicz also
serves as the Chief Financial Officer and member of the Managing Board of Bioton S.A., the ultimate
holding company.
On March 22, 2011, the Board of Directors announced the resignation of Mr. Ryszard Krzysztof Krauze
as a Director and Chairman of the Company. Mr Krauze will continue to serve as the Chairman of the
Supervisory Board of Bioton S.A., the ultimate holding company, of the Company. In replacement, Mr
Slawomir Ziegert is appointed as the Chairman and Chief Executive Officer of the Company.
31 RETROSPECTIVE RESTATEMENT OF ERRORS
Certain restatements have been made to the prior year‟s financial statements to correct the following errors
to for a subsidiary in India:
(a) Adjust for incorrect capitalisation of cost as construction-in-progress
(b) Reverse revaluation of land
(c) Adjust for the use of incorrect depreciation rates
(d) Reclass of lease arrangement from finance lease to operating lease
(e) Adjust for error in accrued expenses relating to land transfer fee
As a result, certain line items have been amended in the consolidated statement of financial position,
consolidated statement of comprehensive income, consolidated statement of changes in equity and
consolidated statement of cash flows and the related notes to the financial statements. Comparative
figures have been adjusted to conform to the current year‟s presentation.
For
per
sona
l use
onl
y
90
The items in consolidated statement of financial position as at December 31, 2008 were restated as
follows:
Previously After
Note reported restatement
US$‟000 US$‟000
Property, plant and equipment a 49,119 45,304
Accumulated losses b (34,351) (38,166)
Notes:
(a) Correction of Construction-In-Progress capitalised in prior years (US$-2,209,000), reversal of
revaluation surplus of land (US$-1,216,000), correction of depreciation rates used by a subsidiary
(US$-390,000).
(b) Correction of Construction-In-Progress capitalised in prior years (US$-2,209,000), reversal of
revaluation surplus of land (US$-1,216,000), correction of depreciation rates used by a subsidiary
(US$-390,000).
The items in consolidated statement of financial position as at December 31, 2009 were restated as
follows:
Previously After
Note reported restatement
US$‟000 US$‟000
Property, plant and equipment c 37,355 31,593
Lease prepayments d 362 817
Trade and other receivables e 4,165 4,176
Accumulated losses f (71,388) (76,801)
Trade and other payables g (19,691) (19,807)
Notes:
(c) Correction of Construction-In-Progress capitalised in prior years (US$-4,043,000), reversal of
revaluation surplus of land (US$-1,216,000), correction of depreciation rates used by a subsidiary
(US$-581,000), reclassification of leasehold prepayment (US$-455,000), difference in land
premium (US$-14,000), reversal of impairment loss overstated (US$547,000)
(d) Reclassification of leasehold prepayment (US$455,000)
(e) Correction of prepayment balances (US$11,000)
(f) Correction of Construction-In-Progress capitalised in prior years (US$-4,043,000), reversal of
revaluation surplus of land (US$-1,216,000), correction of depreciation rates used by a subsidiary
(US$-581,000), difference in land premium (US$-14,000), accruals for land transfer fees (US$-
111,000), correction of gratuity provision (US$-6,000), reversal of impairment loss overstated
(US$547,000), correction of prepayment (US$11,000)
(g) Correction of accruals and gratuity balances (US$-116,000)
The restatements have resulted in an increase in net loss of 2009 by US$1,598,000, and was restated in
the consolidated statement of comprehensive income for the year ended December 31, 2009.
For
per
sona
l use
onl
y

91
The items in consolidated statement of comprehensive income for the year ended December 31, 2009
were restated as follows:
Previously After
Note reported restatement
US$‟000 US$‟000
Purchases h (6,058) (6,076)
Staff cost i (7,186) (7,192)
Depreciation of property, plant
and equipment j (710) (901)
Amortisation of intangible assets k (282) (527)
Impairment loss on property,
plant and equipment l (18,376) (17,829)
Other expenses m (7,219) (8,904)
Basic loss per share (6,996) (7,285)
Notes:
(h) Reclassification of freight charges to purchases of goods (US$-18,000)
(i) Understatement of gratuity balances (US$-6,000)
(j) Understatement of depreciation expense in prior year due to error in use of depreciation rates by a
subsidiary (US$-191,000)
(k) Understatement of amortisation expense in prior year for development costs (US$-245,000)
(l) Reversal of impairment loss overstated (US$547,000).
(m) Error in capitalisation of Construction-In-Progress in prior years (US$-1,834,000), difference in
land premium (US$-14,000), under-accruals for land transfer fees (US$-111,000), under-
capitalisation of development costs (US$245,000), correction of prepayment balances
(US$11,000), reclassification of freight charges to purchases (US$18,000)
The restatements have resulted in a decrease in total equity attributable to equity holders by
US$5,413,000 in 2009, and was restated in the consolidated statement of changes in equity.
The item in consolidated statement of changes in equity as at December 31, 2009 was restated as
follows:
Previously After
Note reported restatement
US$‟000 US$‟000
Total equity attributable to equity holders n (29,909) (35,322)
Notes:
(n) Correction of Construction-In-Progress capitalised in prior years (US$-4,043,000), reversal of
revaluation reserves (US$-1,216,000) correction of depreciation rates used by a subsidiary (US$-
581,000), difference in land premium (US$-14,000), accruals for land transfer fees (US$-
111,000), correction of gratuity provision (US$-6,000), reversal of impairment loss overstated
(US$547,000), correction of prepayment (US$11,000).
For
per
sona
l use
onl
y

Shareholder information
The shareholder information set out below was applicable as at 28 February 2011.
On-market buy-back
There is no current on-market buy-back.
Distribution of equity securities
Analysis of numbers of equity securities by size of holding:
Ordinary shares
No. of Shares
No. of shareholders
1 - 1,000 62,329 120
1,001 - 5,000 238,668 97
5,001 - 10,000 454,962 59
10,001 - 100,000 7,234,902 203
100,001 and over 544,279,459 57
552,270,320 536
There were 207 holders of less than a marketable parcel of ordinary shares.
Equity security holders
The names of the twenty largest holders of quoted equity securities are listed below:
Ordinary shares
Number
held
Percentage of
issued shares
1 BIOTON S.A. 527,786,735 95.57%
2 JP MORGAN NOMINEES AUSTRALIA LIMITED
<CASH INCOME A/C> 2,055,760 0.37%
3 HSBC CUSTODY NOMINEES (AUSTRALIA)
LIMITED 1,777,729 0.32%
4 MR BERNARD STAUNTON <THE STAUNTON
SUPER A/C> 1,109,038 0.20%
5 CITICORP NOMINEES PTY LIMITED 663,125 0.12%
6 DR ANDREW TAN 597,455 0.11%
7 BEDEL & SOWA CORP PTY LTD 500,000 0.09%
8 MR CHARLES BRUCE LEIBOWITZ 476,486 0.09%
9 R MALA PTY LTD <SUPERFUND A/C> 450,000 0.08%
10 TRUGANINI PTY LTD 449,538 0.08%
11 DANKAB PTY LTD <DANKAB P/L SUPER FUND
A/C> 415,582 0.08%
12 MR RAYMOND JOHN GASKELL 408,500 0.07%
13 MR PAUL ANTHONY OCKELFORD 374,943 0.07%
14 MR RONALD JAMES WITNEY 285,000 0.05%
15 RBC GLOBAL SERVICES AUSTRALIA
NOMINEES PTY LIMITED 254,732 0.05%
For
per
sona
l use
onl
y
Ordinary shares
Number
held
Percentage of
issued shares
16 MR ARTHUR MORRIS & MRS RAEWYN MORRIS
& MR CHRIS HOCQUARD <THE NILOC A/C> 225,000 0.04%
17 MR MARK CHAPMAN 224,399 0.04%
18 MR ANTHONY RONALD BIERRE 214,943 0.04%
19 MR BRUCE KENNETH LOCKETT & MR ROGER
MICHAEL KENNEDY & MR CYNRIC REX
TEMPE-CAMP <MRS ELAINE TEMPE-CAMP
A/C>
209,225 0.04%
20 DINABLE PTY LTD <EBERHARD SUPER FUND
A/C> 208,580 0.04%
538,686,770 97.54%
Substantial shareholders
Substantial holder in the Company is set out below:
Number
held
Percentage of
issued shares
Ordinary shares:
Bioton S.A. 527,786,735 95.57%
Voting rights
The voting rights attached to each class of equity securities are set out below:
(a) Voting shares
On a show of hands every member present at a meeting in person or by proxy shall
have one vote and upon a poll each share shall have one vote.
(b) Options
No voting rights.
For
per
sona
l use
onl
y
SCIGEN LTD AND ITS SUBSIDIARIES
REPORT OF THE DIRECTORS AND FINANCIAL STATEMENTS
C O N T E N T S
PAGE
Corporate directory 1 - 2
Report of the directors 3 - 20
Statement of directors 21
Corporate governance statement 22 - 31
Independent auditors‟ review report 32 - 34
Statements of financial position 35
Consolidated statement of comprehensive income 36
Statement of changes in equity 37 - 38
Consolidated statement of cash flows 39
Notes to the financial statements 40 - 91
EQCR-MGR/3019054-4007611-FS01/NPH/AMCM/WOWS/NTGN
For
per
sona
l use
onl
y

SCIGEN LTD AND ITS SUBSIDIARIES (Registration No. 199805796R)
REPORT OF THE DIRECTORS
AND FINANCIAL STATEMENTS
YEAR ENDED DECEMBER 31, 2010
For
per
sona
l use
onl
y