executive overcon dence and securities class actions...there is an accruals-reversal after the seo,...
TRANSCRIPT

Executive overconfidence and securities class actions∗
Suman Banerjee†
Mark Humphery-Jenner‡
Vikram Nanda§
Mandy Tham¶
This version: 14th December, 2014
Abstract
Securities class actions (SCAs) harm the subject firm’s product market position andresult in disciplinary actions against the CEO. This raises the question of why execu-tives engage in conduct that gives rise to a SCA. We propose one explanation: executiveoverconfidence, which could cause an executive to recklessly, or intentionally, make im-prudently overconfident statements or fail to disclose negative information. We show thatexecutive overconfidence increases SCA-likelihood, which is worsened by managerial en-trenchment, but ameliorated by improved governance (following SOX) and a reductionin risk-taking incentives (following SFAS 123R). CEO overconfidence influences the like-lihood of a post-SCA CEO turnover.
JEL Classification Codes: G23, G32, G34Keywords: Overconfidence, Securities Class Actions, Governance
∗We thank the seminar participants at Chinese University of Hong Kong, Nanyang Technological Univer-sity, University of Adelaide, University of Hong Kong, University of Otago, Queensland University of Tech-nology and University of Washington Seattle. We also benefited from comments received at the 3rd Forumon Global Financial Stability and Prosperity (2014), and the Conference on Asia-Pacific Financial Markets(2014). This paper additionally benefited from comments from from Murillo Campello, Jean Canil, JeffersonDuarte, Jon Karpoff, Taejin Kim, Chen Lin, Stephan Siegel, Robert Tumarkin, Cong Wang, Alfred Yawson,and Bohui Zhang.
†University of Wyoming. E-mail: [email protected]‡UNSW Business School, UNSW Australia. Tel: +61 2 9385 5853. E-mail: [email protected]§Rutgers University. Tel: 404-769-4368. E-mail: [email protected]¶Nanyang Business School, Nanyang Technological University, Singapore.Tel:+65-67906049. Email:

Executive overconfidence and securities class actions
Abstract
Securities class actions (SCAs) harm the subject firm’s product market position andresult in disciplinary actions against the CEO. This raises the question of why execu-tives engage in conduct that gives rise to a SCA. We propose one explanation: executiveoverconfidence, which could cause an executive to recklessly, or intentionally, make im-prudently overconfident statements or fail to disclose negative information. We show thatexecutive overconfidence increases SCA-likelihood, which is worsened by managerial en-trenchment, but ameliorated by improved governance (following SOX) and a reductionin risk-taking incentives (following SFAS 123R). CEO overconfidence influences the like-lihood of a post-SCA CEO turnover.
JEL Classification Code: G23, G32, G34Keyword: CEO Overconfidence, Over-investment, Risk-taking, Quality of Investment,SOX

1 Introduction
Securities class actions have serious repercussions for firms and for executives. Firms that
are sued often suffer in the product market (Johnson et al., 2014; Karpoff et al., 2008b) and
have worse access to capital (Autore et al., 2014). Executives of these firms are exposed to
disciplinary actions (Humphery-Jenner, 2012; Karpoff et al., 2008a). This begs the question
of why an executive would risk such consequences. We propose one potential explanation:
executive overconfidence. Overconfidence can cause executives to make imprudently positive
statements and, anticipating favorable developments, to embellish financial reports – thereby
exposing the firm to the risk of a securities class action. Overconfident CEOs can also fail
to disclose negative developments, believing that future positive outcomes will offset such
negative news. We suggest that CEO overconfidence is one, albeit not the only, driver of
conduct leading to securities class actions.
Overconfident executives have, by definition, an overly positive view of their ability and
of their company’s prospects. This would manifest in the overconfident executive making
excessively optimistic public statements about the company, or failing to disclose negative
information in a timely manner (believing that they might be able to rectify this period of
poor performance). Indeed, this is the logic behind the commonly used media-based measures
of overconfidence (see e.g., Hirshleifer et al., 2012). However, should those statements prove
to be falsely optimistic, the company risks becoming subject to a 10b-5 securities class action
(SCA) in which shareholders sue for loss or damage arising by reason of relying on such
information when purchasing stock. Exacerbating the risk of a class action lawsuit is that
excessive optimism with regard to future performance could make the executives less concerned
about shading their financial statements.
Our objective is to analyze whether, and in what circumstances, overconfident CEOs and
non-CEO executives expose their companies to SCAs. For our analysis, we use a firm-year
panel dataset from 1996-2012. We identify SCA-events using the Stanford Securities Class
Action Clearinghouse (SCAC). We use option-based measures of overconfidence, focusing on
1

the HOLDER67 measure (as in Malmendier et al., 2011), which classifies managers as over-
confident if they refrain from exercising deep in-the-money (here 67% in-the-money) options.
The underlying logic is that an executive’s personal wealth is often undiversified, so a rational
executive would not hold deep in the money options. Recognizing the previously documented
link between option-compensation and litigation-risk (Denis et al., 2006; Peng and Roell,
2008); and thus, the possibility of spurious correlation, we also check that the results are
robust to news-based measures of overconfidence, and examine the role of exogenous changes
in option-compensation for overconfident CEOs following SFAS 123R.
We first hypothesize and show that overconfident CEOs and executives expose their com-
panies to SCAs. We examine the role of CEO overconfidence within a regression framework
similar to that in Kim and Skinner (2012). These regressions utilize two-digit industry and
year fixed effects, and control for other factors that might influence litigation-risk. Nonethe-
less, we also check that the results hold when using firm fixed effects and using different
industry-definitions.1 Our results indicate that overconfident CEOs’ firms are about 25%
more likely to be subject to a SCA than are other firms.2 Further, the overconfidence of
non-CEO executives increases the likelihood of a SCA and is in addition to the effect of CEO
overconfidence. This evidence is consistent with the idea that overconfident executives are also
more likely to expose their firms to a SCA by, for instance, making overly positive predictions
about the firm that are not realized.
We then analyze a particular corporate event around which overconfidence might manifest
itself: a seasoned equity offering (‘SEO’). SEOs are events around which managers may fear
a law suit, and potentially, attempt to reduce litigation-risk through under-pricing and/or
1Requiring firm fixed effects significantly reduces the sample-size as many firms are sued only once or arenever sued. Consequently, the main reported regressions use industry and year effects.
2This result comes from the marginal effects associated with the coefficient on CEO HOLDER67 in Table3. Table 2 indicates that 4.5% of the non-overconfident observations feature a SCA (i.e., the litigation-riskof non-overconfident managers is 4.5%). The marginal effect on CEO HOLDER67 in Column 4 of Table 3is 0.01. Thus, overconfident managers increase litigation risk by one percentage point to around 5.5%, aftercontrolling for other corporate characteristics. The increase in litigation likelihood is higher when focusing onthe marginal effect on CEO HOLDER67 in Column 4 of Table 3, which is 0.17. This represents an increasein litigation likelihood to around 6.2% for overconfident managers from around 4.5% for non-overconfidentmanagers.
2

accounting actions.3 Overconfident CEOs are expected to overvalue their firms, leading them
to issue stock only if they have a particularly positive view on the potential uses of the
cash from the SEO. This suggests that overconfident CEOs would be more likely to make
excessively, and recklessly, positive statements when undertaking a SEO. The statements
could also be intentionally fraudulent if the CEO has an excessively positive view of the firm’s
longer-term prospects. The CEO may, for instance, be willing to conceal negative information
in the (overconfident) belief that future performance would be strong enough to off-set it.
Consistent with expectations, we find that firms with overconfident CEOs are more likely to
be sued than are other firms, following a poorly performing SEO.
We next test the role of corporate governance in mitigating (or worsening) the impact of
CEO overconfidence. We examine both proxies for poor governance (i.e., the Gompers et al.
(2003) index of ‘anti-takeover provisions’) and an exogenous shock to governance (i.e., the
passage of the Sarbanes-Oxley Act of 2002 (SOX)). We hypothesize and show that the im-
proved monitoring following the passage of SOX moderates the impact of CEO overconfidence
on SCAs. SOX significantly increased monitoring and disclosure, importantly forcing firms to
have a majority independent board and a fully independent audit-committee, and requiring
the CEO to personally sign-off on the firm’s accounts. These changes would be expected
to both improve corporate governance and expose the CEO to a wider range of independent
view-points (thereby helping to moderate overconfident CEOs’ views). Conversely, entrenched
overconfident CEOs, as proxied by a preponderance of anti-takeover provisions (ATPs), are
more likely to be sued (than are their non-overconfident counterparts).
Incentive contracts further influence the impact of overconfidence on SCA-likelihood. Com-
pensating overconfident CEOs with option-based contracts has the potential to exacerbate the
impact of overconfidence, encouraging overconfident CEOs to take yet more risks. Such ad-
3Prior literature indicates that SEOs are one potential flash-point for shareholder litigation, especially ifthere is an accruals-reversal after the SEO, or an apparent performance-decline after the SEO (DuCharmeet al., 2004). Prior literature has argued that CEOs may attempt to manipulate earnings around SEOs inorder to avoid a sharp decline in earnings after the SEO; and thus, to mitigate the possibility of a law suit(Rangan, 1998). Law-suit avoidance is one argued explanation for underpricing in some SEOs (Ghosh et al.,2000).
3

ditional risks could increase the likelihood that an overconfident CEO’s company is sued.
We find supportive evidence from the passage of SFAS 123(R). SFAS 123(R) is an exoge-
nous shock to compensation contracts: It made option-compensation less attractive to firms,
thereby leading to a significant reduction in option-compensation (Hayes et al., 2012). We
find that, following SFAS 123(R), there is a relative decline in the likelihood of overconfident
CEOs’ companies being sued under a SCA, as compared with those of other CEOs.
CEO overconfidence has some impact on post-SCA CEO turnover. Overconfident CEOs
are more likely to leave their companies following a SCA than are other CEOs. Overconfident
CEOs exposed to a SCA are also more likely to leave their companies than are their non-
litigated counterparts. However, the impact of CEO overconfidence on post-SCA turnovers is
concentrated in the set of non-entrenched CEOs. Specifically, overconfident CEOs that were
internally appointed are no more likely to be fired following a SCA than are other CEOs,
implying that the “insider” CEOs are more insulated from disciplinary action.
We take steps to mitigate econometric concerns that might otherwise influence a study of
this type. These include (but are not limited to) the following. We examine the role of two ex-
ogenous events (SOX and SFAS 123R) in moderating the impact of CEO overconfidence. We
expect both SOX and SFAS 123R to have a disproportionately greater effect on overconfident
CEOs’ litigation-likelihood: SOX because the actions of overconfident CEOs, more than other
CEOs, are likely to be moderated as a result of greater external monitoring and oversight;
SFAS 123R because overconfident CEOs, with the higher probabilities they assign to good
outcomes, are likely to be more sensitive to risk-taking incentives. We do find that both exoge-
nous events disproportionately affect overconfident CEOs, consistent with expectations. This
tends to suggest that our results do not merely reflect endogeneity between SCA-likelihood
and CEO overconfidence. Subsequently, these tests help to address identification-concerns,
especially when coupled with the finding that overconfidence is moderated by other corpo-
rate characteristics in a manner consistent with expectations. We also undertake measures
to address sample selection issues, including propensity score matching techniques. Further,
4

we ensure that the results are robust to alternative measures of managerial overconfidence,
including news-based measures (per Hirshleifer et al., 2012) and trading-based measures (per
Kolasinski and Li, 2013). The results are also robust to ‘adjusting’ the overconfidence measure
for the firm’s stock-performance.
The results contribute to the literature in several ways. First, we expand upon the prior
SCA-literature by highlighting the influence of executives’ behavioral characteristics (such as
CEO overconfidence) on the likelihood of a SCA. Second, we provide additional evidence on
the effect of SOX and corporate governance on both the impact of CEO overconfidence and
the likelihood of SCAs. Third, we highlight the characteristics of CEOs that influence post-
SCA disciplinary action, and explore further the circumstances in which CEOs are disciplined
following a SCA. This provides additional context to the prior finding that firms tend to
discipline CEOs following financial misstatements (see e.g., Karpoff et al., 2008a).
The structure of this paper is as follows. Section 2 both discusses the prior literature
and presents the hypotheses. Section 3 describes the data and presents summary statistics.
Section 4 presents the multivariate regression analysis that examines the relationship between
executive overconfidence and SCAs. Section 5 concludes.
2 Hypotheses
A securities class action arises if the company, or an employee thereof, makes a materially
falsely positive statement (or erroneously omits negative information) and shareholders sub-
sequently suffer loss or damage by reason of relying on this misstatement. The shareholders
typically do not need to prove that they relied on the misstatement (as the court assumes that
they relied on the efficiency of the markets, which implicitly impounds all statements relating
to the company).4 Instead, it is generally sufficient for shareholders to prove that there is
a false statement and that they purchased the shares after such a false statement. Thus, a
4This presumption of reliance originated in Basic Inc. v. Levinson. In June 2014, the United StatesSupreme Court upheld the validity of this presumption in Halliburton Co. v. Erica P. John Fund, Inc.
5

10b-5 SCA typically arises after one of the company’s executives makes a positive statement
that the company fails to actualize, or presents a positive prediction that fails to materialize.
The plaintiff must also establish scienter, which is essentially that the defendant intentionally,
or recklessly, misled the market.5 The following sub-sections discuss the relationship between
overconfidence and the likelihood of a SCA.
2.1 Overconfidence and SCAs in general
We propose that overconfident executives are more likely to make such falsely positive state-
ments. This is for at least four reasons:
First, as indicated, overconfident CEOs tend to over-estimate projects’ returns and under-
estimate projects’ risks. Additionally, as stated above, if the CEO makes a falsely positive
statement (i.e., when promoting the firm’s projects) and is reckless as to whether that state-
ment is correct, then the firm can be liable for a SCA. Since making imprudently overconfident
statements increases the chance of the CEO being found to be reckless, we expect that overcon-
fident CEOs increase the likelihood of a SCA. Indeed, a track-record of overconfident behavior
would help to establish a case that the CEO’s statements were not merely ‘negligent’ (which
would be insufficient to establish scienter), but were reckless.6 We expect the above logic to
apply mutatis mutandis to overconfident non-CEO executives.
Second, overconfident CEOs tend to over-invest (Malmendier and Tate, 2005, 2008). How-
ever, such investments often perform poorly (Kolasinski and Li, 2013; Malmendier and Tate,
2008), whereupon overconfident managers tend to adopt less conservative accounting practices,
post-pone loss recognition (Ahmed and Duellman, 2013), and engage in earnings smoothing
5For a discussion of scienter requirements see for example Bolger (1980). While the courts initially requiredthe plaintiff to establish that the defendant intentionally mislead the market (i.e., by making a statement thathe/she knew to be false), since Ernst & Ernst v. Hochfelder 425 U.S. 185 at 193 (1976), courts have acceptedthat it is sufficient to establish that the defendant acted recklessly (Bolger, 1980; Donelson and Prentice, 2012;Walker and Seymour, 1998). Further, Donelson and Prentice (2012) argue that PSLRA is premised on thesufficiency of establishing scienter by showing the defendant CEO was reckless.
6Courts have acknowledged that it is difficult to establish direct proof that the CEO intended to misleador was reckless (Clarke v. United States, 132 F.2d 538, 540-41 (9th Cir. 1943)). Instead, the court willoften determine scienter as “a matter of inference from circumstantial evidence” (Herman & MacLean v.Huddleston, 459 U.S. 375, 390 n.30 (1983).).
6

(Bouwman, 2014) and financial misstatements (Schrand and Zechman, 2012). Subsequently,
Laux and Stocken (2012) present a theoretical model in which they argue that optimistic man-
agers are more likely to (potentially inadvertently) misrepresent their investment prospects.
Relatedly, McTier and Wald (2011) indicate that over-investment (albeit, not necessarily in-
volving overconfident CEOs), tends to be associated with increased litigation-risk.
Third, overconfident CEOs tend to have miscalibrated perceptions of the risk and return
associated with investments (Ben-David et al., 2013). Thus, an overconfident CEO is more
likely to believe (incorrectly) that the company will perform well enough that they will not
be caught if they make a financial misstatement, or even if they are caught, the firm’s stock
price will not decline such that shareholders suffer a loss and instigate a Rule 10b-5 suit. Such
beliefs appear to translate into overconfident CEOs producing less conservative accounting
statements (Ahmed and Duellman, 2013). Overconfident CEOs also appear to fail to learn
from their failure to meet such optimistic forecasts (Chen et al., Forthcoming). Thus, the
overconfident CEOs’ optimistic beliefs could result in recklessly optimistic representations as
to the firm’s future prospects.
Fourth, overconfident CEOs are more likely to omit negative information than are non-
overconfident CEOs. A SCA can arise following the firm’s failure to disclose negative informa-
tion. An overconfident CEO, almost by definition, is more confident about his/her ability to
rectify such negative outcomes. Thus, they would be slower to recognize negative information,
giving rise to a SCA.
The foregoing reasons suggest that overconfident CEOs are more likely to make recklessly,
or intentionally, falsely positive statements. Such actions, would then expose the firm to a
SCA. Further, Overconfident, non-CEO senior executives, will exhibit similar tendencies and
may likewise expose the firm to a SCA.
Hypothesis 1. Companies with overconfident CEOs are more likely to be subject to a secu-
rities class action.
Hypothesis 2. Companies with overconfident senior, non-CEO, executives are more likely to
7
be subject to a securities class action.
2.2 SEOs, overconfidence, and litigation
We next explore one particular event around which firms are often typically considered to
be especially wary of litigation: the issuance of equity. Equity offerings are particularly
prone to precipitate law suits, especially if there appears to be a performance-decline after
the SEO (DuCharme et al., 2004). This can encourage managers to attempt to ward off
such law suits through actions such as under-pricing the SEO (Ghosh et al., 2000). We test
whether overconfident CEOs are more prone to expose their companies to SCAs around such
events than are other CEOs. As indicated above, we expect overconfident CEOs to be more
likely to make positive statements that fail to materialize (and for such representations to be
sufficiently reckless to establish scienter). This is likely to have a greater impact around a
major corporate announcement, such as a SEO, around which there is a significant release
of information and that has the potential to dilute the holdings of existing shareholders and
reduce shareholder wealth if there is no off-setting value-creating investment. Reflecting this,
the theoretical model in Laux and Stocken (2012) suggests that overconfident CEOs are likely
to make misstatements when raising capital, reflecting their overly optimistic views about
the firm’s investment-prospects. DuCharme et al. (2004) indicate that misstatements around
SEOs (as evidenced by the need to undertake accruals reversals) significantly increase the
likelihood of a SCA. Thus, we expect that overconfident CEOs are more likely to be sued
following a SEO than are other CEOs. However, we also expect that litigation-risk will reduce
if the market responds more favorably to the SEO. Thus, we make the following predictions.
Hypothesis 3. Overconfident CEOs are more likely to be sued following a SEO than are other
CEOs.
Hypothesis 4. The likelihood that an overconfident CEO is sued following a SEO (relative
to that of other CEOs) decreases if the stock market responds relatively more positively to the
SEO announcement.
8

2.3 Governance
Improvements in internal governance should reduce the likelihood that an overconfident CEO’s
company is sued. Monitoring by non-CEO executives and directors can mitigate the likelihood
of securities fraud in general (Choi et al., 2013; Khanna et al., 2013). Higher quality boards
are also associated with improved disclosure-quality (Reeb and Zhao, 2013). Additionally,
one way to attenuate the impact of a CEO’s behavioral biases is by improving independent
oversight and exposing the CEO to a more diverse set of view-points. The Sarbanes-Oxley
Act of 2002 (SOX) was enacted in response to corporate scandals that connoted both un-
ethical behavior and CEO hubris. The passage of SOX represents an exogenous shock to
internal corporate governance, forcing companies to adopt a majority-independent board and
a completely independent audit committee.
There are at least three key aspects of SOX that would be expected to mitigate the impact
of CEO overconfidence on SCA-likelihood. First, SOX would force an overconfident CEO
to consider the alternative view-points when making decisions, thereby attenuating his/her
tendency to make reckless statements. Second, SOX increases oversight, creating more checks
and balances over financial statements. For instance, Duarte et al. (2014) argue that SOX
reduces the discretion that insiders have as evidenced by (inter alia) restrictions on extracting
wealth from minority shareholders, implying that SOX would reduce an overconfident CEO’s
discretion to act on their biases when making investments. This increase in oversight could,
in and of itself, lead to a reduction in misreporting.7 Third, SOX forces CEOs to sign-off on
financial reports, presumably forcing CEOs to reflect more upon the company’s true financial
state. Thus, while there is some evidence that SOX does not per se reduce litigation likelihood
(see e.g., Malm and Mobbs, 2014), we expect that it could do so in companies that could benefit
from additional independent oversight and monitoring. That is, we expect that after SOX,
overconfident CEOs’ companies are less likely to be sued than before SOX. We capture the
prediction in the following hypothesis.
7Dimmock and Gerken (2014) suggest that improvements in SEC oversight significantly reduced misreport-ing in the hedge fund sector.
9

Hypothesis 5. SOX reduces the likelihood that an overconfident CEO’s company is subject
to a SCA.
Managerial entrenchment is likely to exacerbate the impact of CEO overconfidence on
the likelihood of a SCA. After a SCA, managers tend to become susceptible to disciplinary
actions, such as a loss of compensation and a worsening of job prospects (Humphery-Jenner,
2012; Karpoff et al., 2008a). Ordinarily, the risk of disciplinary action would cause a CEO
to exercise caution when issuing statements about investment prospects, even if the CEO is
otherwise overconfident. However, if the CEO is entrenched (i.e., due to a preponderance of
anti-takeover provisions), then it is likely that the CEO would exercise less caution. Thus, we
expect that overconfident CEOs that are entrenched are more likely to be subject to a SCA.
A core aspect of managerial entrenchment is the presence of anti-takeover provisions
(ATPs). ATPs insulate managers from the market for corporate control, which would other-
wise function to discipline them for poor performance. ATPs are associated with lower firm
value (Bebchuk et al., 2009; Gompers et al., 2003), and worse performance when making in-
vestments such as takeovers (Harford et al., 2012; Masulis et al., 2007). It is true that prior
evidence documents only a weak relationship between measures of anti-takeover protection
and takeover-deterrence (Bates et al., 2008); however, a preponderance of ATPs is still as-
sociated with worse governance and oversight (see e.g., Harford et al., 2012), suggesting a
degree of ‘entrenchment’ from discipline in general. Therefore, given our expectation that
poor governance worsens the impact of CEO overconfidence on SCA-likelihood, we expect
entrenchment to increase the likelihood that an overconfident CEO’s firm is subject to a SCA.
This leads to our next hypothesis.
Hypothesis 6. Managerial entrenchment, as proxied by a preponderance of anti-takeover
provisions, increases the likelihood that an overconfident CEO is subject to a securities class
action.
10
2.4 Overconfidence, compensation, and SCAs
Compensation contracts are likely to influence the likelihood that an overconfident CEO ex-
poses the company to a SCA. Peng and Roell (2008) suggest that options-based compensation
can be associated with increased litigation likelihood. This reflects both the increased risk-
taking that option compensation encourages, and managers’ increased tendencies to manipu-
late stock prices. In particular, risk taking by overconfident CEOs is likely to be exacerbated
by option-based incentives. It follows, therefore, that a reduction in the option-based incentive
to take risk is likely to result in a greater reduction in SCA-likelihood for overconfident CEOs.
We capture the reduction in risk-taking incentives by examining an exogenous shock to
option-compensation, as manifested by the passage of SFAS 123(R). SFAS 123(R) came into
effect in December 2005. It changed the way companies could expense options. Prior to
SFAS 123(R), companies could expense options at their intrinsic value. This advantaged
companies because they often granted at-the-money options, which they could treat as having
no intrinsic value prior to SFAS 123(R). However, after SFAS 123(R), companies had to record
option compensation at fair value, making options less attractive to companies (see e.g., Hayes
et al., 2012). Thus, we anticipate that the passage of SFAS 123(R) will reduce, to a relatively
greater extent, the likelihood that an overconfident CEO’s company is sued. Thus, we state
the following hypothesis.
Hypothesis 7. An exogenous reduction in option-based compensation will reduce the likelihood
that an overconfident CEO’s company is sued.
2.5 Post-SCA disciplinary action
We expect that overconfident CEOs are more likely to be disciplined following a SCA. SCAs,
and corporate frauds in general, tend to reduce shareholder wealth: they often involve a
reputational penalty for the firm (Karpoff and Lott, 1993), which can have negative product
market implications (Johnson et al., 2014; Karpoff et al., 2008b). Subsequently, firms might
seek to discipline managers that expose them to such penalties. Prior literature suggests
11
that securities fraud can result in disciplinary action against executives (Aharony et al., 2014;
Humphery-Jenner, 2012; Karpoff et al., 2008a). To the extent that securities fraud following
overconfident CEOs’ misstatements is more directly attributable to that CEO, we would
expect overconfident CEOs to be more likely to be fired than other CEOs. We would also
expect that a SCA would increase the likelihood that an overconfident CEO is fired. Thus,
we make the following prediction.
Hypothesis 8. Overconfident CEOs who are subject to a SCA are more likely to be fired than
are other CEOs.
We expect that overconfident CEOs with more ‘power’ and/or ‘connections’ are less likely
to be fired. Khanna et al. (2013) and Choi et al. (2013) argue that the CEO’s ties to other
executives and to the board exacerbate the likelihood of corporate fraud. They suggest that the
more accommodating directors/executives engage in less effective monitoring and oversight.
By parity of reasoning, a CEO who is more entrenched with the board is less likely to be
disciplined by that board. Specifically, if the CEO was an internal candidate (as opposed to
an external appointee), then he/she is more likely to be entrenched vis-a-vis the board, so
would be less likely to be dismissed following a SCA. We would also expect that CEOs in firms
that are more entrenched (as proxied by a preponderance of ATPs) would be less likely to be
disciplined as the boards in those firms would be less sensitive to external market pressure.
Thus, we predict the following:
Hypothesis 9. Overconfident CEOs that are more entrenched are relatively less likely to be
dismissed following a SCA.
3 Data
We create a firm-year panel data-set in which to examine the likelihood that a firm is subject
to a securities class action in a given year. We start with the set of all companies in the
12

CRSP/Compustat universe. We then match this data with executive-level data from Execu-
comp, which we use to identify if the CEO is overconfident. Subsequently, we obtain data on
whether the firm is subject to a SCA in each year by collecting such data from the Stanford
Securities Class Action Clearing House (SCAC). We further collect data to compute various
control variables that prior literature has used when examining litigation-likelihood (see e.g.
Kim and Skinner, 2012). Relatively few of the firms in our sample are sued more than once.
The exact number of repeat-defendants varies across model specifications (i.e., with the con-
trol variables that we require), being between 174 and 194 observations out of a sample of
over 22,000 observations involving 1,375 law suits. The results are robust to eliminating such
repeat SCA-targets from the sample.8 In the reported models, we follow Kim and Skinner
(2012), and use firm and two-digit industry fixed effects. However, in Section 4.7 we check
that the results are robust to using firm fixed effects and to industry-definition.
We use option-based measures of overconfidence. In robustness tests, we also check that the
results are robust to news-based measures of overconfidence. The idea behind option-based
measures of overconfidence is that a CEO’s personal wealth is undiversified, with his/her
human capital being tied to his/her company. Consequently, a rational CEO would exer-
cise his/her options as and when they vest. An overconfident CEO would hold options,
especially deep in the money options, for an extended period. We capture this by collect-
ing data on the number and value of the CEO’s vested options. We start by constructing
the CONFIDENCE measure as “average-value-per-option/average-strike-price” (as per Mal-
mendier et al., 2011), where the average-value-per-option is the total value of the CEO’s
option-holdings (Execucomp: opt unex exer val) scaled by the number of such options (Ex-
ecucomp: opt unex exer num). The average-strike-price is the firm’s stock price at the end
of the fiscal year (CRSP: prcc f) less the value-per option.9 We then construct two indicator
variables: CONFIDENCE TOPQ is an indicator that equals one if the CEO’s CONFIDENCE
variable is in the top quartile of all CEO’s in that year. HOLDER67 is the Malmendier et al.
8We discuss these results in detail in the robustness section.9This computation works on the idea that the value per option is roughly St−X, where St is the prevailing
stock price at time t and X is the strike price. Thus, the average strike price is roughly X = St − (St −X)
13
(2011) HOLDER67 measure (computed using publicly available data), which is an indicator
that equals one if the CONFIDENCE variable is at least 0.67 on at least two occasions (in
which case HOLDER67 equals one from the first time that CONFIDENCE is at least 0.67).
The HOLDER67 measure has some advantages in this context over other measures of
overconfidence. The LONGHOLDER measure (which essentially looks at the CEO’s decision
whether to exercise options in their last year of life) and the Kolasinski and Li (2013) trading-
based measure both rely on CEOs’ decisions vis-a-vis trading in options and stock. However,
Bradley et al. (2014) highlight that CEOs may exercise options (and by parity-of-reasoning,
trade stock) around SCA filings. Thus, in this context, such trading/exercise based measures
may reflect other decisions rather than just CEO overconfidence. Nonetheless, in robustness
tests (see Section 4.7 ) we ensure that the results are robust to using both media-based and
Kolasinski and Li (2013) trading-based measures of overconfidence.
In order to analyze the relationship between CEO overconfidence, SEOs, and SCAs, we
also collect data on secondary offerings. The data is from SDC Platinum. We also compute
the CAR following the SEO using data from CRSP. The CAR is the cumulative abnormal
return over the period 30 days to 360 days after the SEO. The CAR is based on an OLS
estimation of the market model computed over the prior year.
When analyzing the relationship between entrenchment, overconfidence and the likelihood
of a SCA, we measure managerial entrenchment by collecting data on the firm’s anti-takeover
provisions (ATPs) from IRRC/RiskMetrics. We can obtain data from 1990 onwards for a
sub-set of the firms (IRRC/RiskMetrics does not cover all firms in our sample). We con-
struct both the Bebchuk et al. (2009) EINDEX and the Gompers et al. (2003) GINDEX.
IRRC/RiskMetrics significantly changes their reporting after 2006, making it inaccurate to
compute a GINDEX for observations after 2006, using post-2006 data. Thus, for all post-2006
observations, we back-fill the GINDEX with the value for the most recent prior year. Further,
as IRRC/RiskMetrics does not report ATPs in all years, especially early in the sample, for
missing years we back-fill data from the most recent prior year (as per Masulis et al., 2007).
14

The sample composition by year is in Table 1. The table indicates that the sample size
is relatively stable over time. Approximately half of the CEOs in the sample are overconfi-
dent (i.e., have HOLDER67 equal to one). This is similar to the proportion of overconfident
CEOs in prior studies using this measure (see e.g., Malmendier and Tate, 2005, 2008; Mal-
mendier et al., 2011). Around 65% of all law suits involve overconfident CEOs (i.e., if the
company is sued, then it is around 1.8 times as likely that the CEO is overconfident than
non-overconfident). The proportion of suits that involve overconfident CEOs fluctuates over
time.
[Table 1 about here]
The summary statistics are in Table 2. We report statistics for the full sample and for the
sub-samples of companies run by overconfident CEOs. The summary statistics are relatively
standard and are consistent with expectations. Interesting results in Panel A are that there is a
significant negative stock-price run-up before the announcement of a SCA. The negative run-up
is more severe for companies run by overconfident CEOs. Overconfident CEOs’ companies are
also more likely to be sued and to suffer more negative long-run post-SCA returns. There are
some significant differences between overconfident CEOs’ firms and non-overconfident CEOs’
firms (viz Panel C). Interestingly, the level of anti-takeover provisions (ATPs) is approximately
similar for both overconfident and non-overconfident firms (the Gompers et al. (2003) index
is between 9.1 and 9.4, on average for both the overconfident and non-overconfident firms).
In robustness tests (described below) we take steps to mitigate any concern that the results
merely reflect systemic differences between overconfident CEOs’ firms and non-overconfident
CEOs’ firms.
[Table 2 about here]
4 Analysis
This section presents the multivariate regression analysis. We begin by analyzing the rela-
tionship between CEO and non-CEO executive overconfidence and SCAs. We then explore
15
the relationship between overconfidence, SEOs and SCAs. Next, we explore how governance,
entrenchment, and CEO compensation can moderate the relationship between overconfidence
and SCAs, with improved governance helping to mitigate the impact of CEO overconfidence.
Finally, we explore whether overconfident CEOs are more likely to be disciplined (as proxied
by them leaving the company) following a SCA.
4.1 Executive overconfidence and the likelihood of a SCA
We begin by testing the hypothesis that overconfident CEOs’ firms are more likely to be sued.
We analyze the relation between CEO overconfidence and litigation likelihood in Table 3. The
control variables are based on the models in Kim and Skinner (2012, Table 7, Table 8). The
regression models in Table 3, and in subsequent tables, are logit regressions with year and
SIC two-digit industry fixed effects (as per Kim and Skinner, 2012). The year fixed effects
help to mitigate the impact of legal changes over time, such as PSLRA, that can influence
SCA-likelihood (see e.g., Choi et al., 2009). The industry fixed effects help to address prior
evidence that industry-conditions can influence fraud-propensity (Wang and Winton, 2014;
Wang et al., 2010). If we use firm and year fixed effects, we obtain qualitatively similar
results to those in Table 3. This tends to suggest that our results are not merely capturing
a ‘firm’ effect and that changing the level of CEO-confidence at a given firm can result in a
change in SCA-likelihood. However, the sample size falls to around 5,000 observations (from
around 20,000) observations as many companies never experience a SCA, and many companies
experience only one SCA.
The important finding in Table 3 is that CEO overconfidence is significantly and positively
related to the likelihood of the company being sued, supporting Hypothesis 1. This result is
economically significant. Table 2 indicates that 4.5% of non-overconfident CEOs are subject
to a SCA. The marginal effect associated with CEO HOLDER67 in Column 4 of Table 3
indicates that overconfident managers are one percentage point more likely to be sued than
are non-overconfident CEOs. This represents an increase in litigation risk of nearly 25% for
16

overconfident CEOs relative to non-overconfident CEOs (after controlling for other corporate
characteristics).
The coefficients on the control variables are largely consistent with expectations and with
prior literature (see e.g., Choi, 2006; Field et al., 2005; Kim and Skinner, 2012). Insider trading
is not significantly related to SCA-likelihood. This is consistent with prior findings that there
is little abnormal insider trading prior to SCAs (Niehaus and Roth, 1999). Institutional
ownership is positively related to SCA-likelihood. This likely reflects the role of institutional
investors in monitoring firms (and disciplining firms for misconduct), especially in light of
SCA-reforms that emphasize the presence of a lead plaintiff (i.e., an institutional investor)
to pursue the case (Perino, 2012, 2014). It is also consistent with prior evidence that some
institutional shareholders tend to pay lower attorney-fees when litigating (Choi et al., 2011).
Firms that raise equity tend to be more likely to be sued. This is unsurprising given the
prior evidence on litigation (or at least companies’ fears thereof) around equity issuance. The
relationship between stock-returns and SCAs is unsurprising. Firms with lower stock returns
and more volatile stock returns are more likely to be sued (as in Arena and Julio, 2011; Choi,
2006; Gande and Lewis, 2009; Jones and Weingram, 1996). Both results are consistent with
the idea that a 10b-5 case will be successful only if the shareholder suffered a loss after they
purchased the stock. This is easier to show if the stock price decreases.
Corporate fundamentals are also related to litigation-likelihood. Larger firms are more
likely to be sued, likely representing the fact that larger firms have more assets with which to
meet any litigation payout. Similarly firms with higher ROA and sales growth are more likely
to be sued. This is consistent with prior evidence that large cash holdings can render firms
vulnerable to litigation-like disputes with unions (Klasa et al., 2009). Conversely, higher levels
of PP&E reduce SCA-likelihood (after controlling for the firm’s asset-size). This would reflect
the fact that PP&E cannot be easily converted into cash in order to meet a litigation-payout,
making the company a less attractive target.
[Table 3 about here]
17

We next examine the relationship between non-CEO executive overconfidence and the
likelihood of a SCA. We analyze the overconfidence of all executives for the firm in execucomp
(TEAMHOLDER67, in Table 4, Panel A), non-CEO executives (OTHER EXEC HOLDER67,
in Table 4, Panel B), senior executives (SR HOLDER67, in Table 4, Panel C), and junior
executives (JR HOLDER67, in Table 4, Panel D). the main finding is that the overconfidence
of the overall team (i.e., Panel A), non-CEO executives (i.e., Panel B) and senior executives
(i.e., Panel C) significantly increases the likelihood of a SCA. However, the overconfidence
of junior executives (i.e., Panel D) does not. This result likely reflects the fact that it is
mainly senior executives who are involved is high-level decision making (and associated press-
statements). The results support the predictions in Hypothesis 2.
[Table 4 about here]
4.2 CEO overconfidence, SEOs, and SCAs
We anticipate that overconfident CEOs are more likely to be sued following a SEO than
are other CEOs. We expect (in Hypothesis 3) that because overconfident CEOs have a more
positive view of their firms’ prospects, they are more likely to make positive statements around
SEOs that subsequently are not met. We capture this by examining whether overconfident
CEOs are more likely to be sued following a SEO than are other CEOs. We further look at
the sub-set of firms that do conduct SEOs, and examine the impact of the market’s reaction
on SCA-likelihood (following our prediction in Hypothesis 4). To do this, we collect data on
SEOs from the SDC new issues database. We also calculate the cumulative abnormal return
(CAR) following the SEO over the period of 30 to 360 days after the SEO. The CAR is based
on an OLS estimation of the market model over the prior trading year.
The results are in Table 5. Columns 1-2 examine the impact of the firm undertaking a SEO
in year t− 1. Columns 1-2, indicate that overconfident CEOs are not more likely to be sued
following a SEO than are other CEOs. However, Columns 3-6 show that a relatively positive
stock market reaction to the SEO significantly reduces the likelihood that an overconfident
18
CEO is sued. Columns 5-6 further require that there is no overlap between the SEO return-
period and the SCA announcement. The results suggest that if the market reacts more
positively (or at least less negatively) to the SEO-announcement, then the overconfident CEO
is less likely to be sued than would otherwise be the case. One possible explanation for this
result is that the impact of CEO overconfidence depends on how the market responds to the
SEO. That is, we conjecture that it is mainly in those cases where the overconfident CEO
has made positive statements (which fail to materialize), and the SEO subsequently under-
performs, that the firm is sued. This is consistent with the notion that law suits are less likely
when investors are favorably disposed to the SEO – and the manager may not feel the need
to make overly positive statements to persuade investors about the firm’s prospects.
[Table 5 about here]
4.3 SOX, CEO confidence and the likelihood of a SCA
We expect that SOX ameliorates the impact of managerial overconfidence on SCA-likelihood
(Hypothesis 5). We analyze this by interacting the CEO-overconfidence measures with a
POSTSOX dummy that equals one if the observation post-dates SOX and equals zero other-
wise (i.e., is equal to one if the observation occurs in 2002 or later). When examining SOX,
we restrict the sample to be six years on either side of SOX (i.e., 1996-2008). We use a
POSTSOX indicator, rather than splitting the sample by whether the firm was previously
compliant with SOX’s governance provisions, because SOX impacted even compliant firms
through (inter alia) requiring CEOs to personally sign-off on financial reports, by increasing
audit-stringency, and by enhancing internal controls (see e.g., Arping and Sautner, 2013). Put
differently, SOX could improve governance both through its board-compliance provisions and
through the increased SEC/regulatory oversight.10
The results are in Table 6. The coefficient on the POSTSOX dummy is positive and
significant, potentially suggesting that the climate of increased scrutiny was associated with
10For example, related work indicates that SEC oversight significantly improved hedge fund governance andreporting (Dimmock and Gerken, 2014).
19

an increase in litigiousness. This finding is consistent with the results vis-a-vis securities
litigation in Malm and Mobbs (2014). The CEO overconfidence variables remain positively
associated with SCA-likelihood. The interaction terms of the POSTSOX dummy with the
overconfidence measures are negative and usually statistically significant. They are also larger
in magnitude than are the coefficients on the POSTSOX dummy. This implies that whereas
SOX was associated with an increase in litigation in general, SOX appears to have reduced
litigation-risk for firms run by overconfident managers, relative to firms run by other CEOs.
This is likely because the increased monitoring through improved internal governance reduced
the capacity of overconfident CEOs to make misstatements, and the requirement on CEOs to
personally certify financial statements forced overconfident CEOs to reflect on the realism of
their overconfident beliefs. The results are consistent with the prediction in Hypothesis 5.
The results are unlikely to suffer from biases vis-a-vis firms being exempt from SOX as our
sample comprises only Execucomp (i.e., S&P 1500) companies whereas SOX exemptions apply
only to small companies.11 Further, the SOX results are unlikely to merely reflect an increase
in litigation following the dot-com crash: the reported models include industry effects and we
obtain qualitatively similar results (unreported) if we exclude ‘high tech’ firms or IT firms as
defined following Loughran and Ritter (2004). Further, the regressions include industry fixed
effects, which would mitigate the impact of the dot-com crash as any related litigation would
concentrate in particular industries.
[Table 6 about here]
We supplement the results in Table 6 by examining subsamples of firms from before and
after SOX. In Table 7, we split the sample into the pre-SOX period (1996-2001) and the
post-SOX period (2002-2008) and examine the impact of CEO overconfidence on litigation
likelihood. The core finding is that whereas overconfidence significantly increases litigation-
risk in the pre-SOX period, it only insignificantly does so in the post-SOX period (after
including the full set of controls). This suggests a significant change in the impact of CEO
11For example, the exemption from Section 404(b) applies only to companies with a market capitalizationof under $75 million.
20

overconfidence around SOX.
[Table 7 about here]
We further explore the extent to which the results vary with whether the firm complied
with SOX’s board-independence and audit-committee independence requirements prior to its
passage. As indicated above, board compliance is not the only avenue through which SOX
could influence manager behavior – SOX was associated with improvements in auditing and
reporting as well. Nonetheless, we obtain data on the firm’s directors from RiskMetrics. We
then determine if the firm was compliant with SOX before its passage (as evidenced by a
majority independent board and an independent audit chair). We then split the sample into
compliant and non-compliant groups. When undertaking the analysis we restrict the sample
to six years either side of SOX (1998-2006). We report the results for this split in Table 8.
Panels A and B look at the compliant and non-compliant sub-samples. The main finding is
that the results vis-a-vis the interaction term are more statistically significant for the non-
compliant sub-sample (though the interaction is not significant in all models). None of the
interaction terms are statistically significant for the compliant sub-sample. This provides some
suggestive evidence that the impact of SOX mainly concentrates in the set of firms that were
non-compliant (i.e., that were most impacted by its passage).
[Table 8 about here]
4.4 Managerial entrenchment, CEO confidence and the likelihood
of a SCA
We expect that overconfident CEOs that are more entrenched will have a higher litigation risk
than will those that are not entrenched (see Hypothesis 6). We report results that focus on
the Gompers et al. (2003) GINDEX and an indicator that equals one if the GINDEX is in the
top quartile (i.e., above 11). We obtain similar results when using the Bebchuk et al. (2009)
EINDEX. As indicated in Table 2, the level of managerial entrenchment is approximately
equal, on average, for both overconfident and non-overconfident firms.
21

The results are in Table 9. We suppress control variables for brevity. However, Columns
1-4 contain the control variables from Columns 1-4 of Table 3, respectively. The key finding is
that if the firm is entrenched, then an overconfident entrenched CEO is more likely to be sued
than is a non-overconfident one. We report regressions that focus on an GINDEX TOPQ, an
indicator that equals one if the GINDEX is in the top quartile. The results are qualitativley
similar if we use the continuous variable (GINDEX) or the Bebchuk et al. (2009) EINDEX.
Entrenchment itself is associated with a reduced likelihood of a SCA. This likely reflects
the ‘quiet life’ theory behind entrenchment, whereby entrenched managers take advantage
of their insulated position to shirk and reduce risk (Bertrand and Mullainathan, 2003; Low,
2009), thereby reducing the chances for risk-induced failure and reducing the likelihood of
a SCA. However, overconfident CEOs off-set this effect, with overconfident CEOs increasing
the likelihood of a SCA in entrenched companies. This suggests that compared with non-
overconfident CEOs, overconfident CEOs, are more likely to exploit their entrenched position
to engage in additional risk-taking.
[Table 9 about here]
4.5 Compensation, CEO confidence and the likelihood of a SCA
The hypothesis (in Hypothesis 7) is that compensation structures can influence the impact of
CEO overconfidence on litigation-likelihood. Specifically, we expect that overconfident CEOs
that are incentivized to take risk will be more likely to be sued. We examine this empirically
by analyzing an exogenous reduction in option compensation following SFAS 123R using the
POSTFAS indicator (an indicator that equals one if the observation is in 2005 or later).
By changing the accounting-rules relating to option-compensation, SFAS 123R reduced the
attractiveness of paying CEOs with options and resulted in a significant reduction in option
compensation (Hayes et al., 2012).Thus, we anticipate that the passage of SFAS 123R will
be associated with a greater reduction in litigation-likelihood for overconfident CEOs than
for other CEOs. However, we would expect this effect only for the sub-group of CEOs with
22

relatively high levels of option-compensation.
The results are in Table 10 and are consistent with expectations. We split the sample
into the set of CEOs whose option intensity (i.e., portion of compensation paid in the form
of options) is in the top quartile. We find that SFAS 123R is associated in a reduction in
the likelihood of a SCA only for the set of overconfident CEOs with high levels of option
compensation. That is, while CEO HOLDER67(t-1)*POSTFAS is negative and significant in
the high-option-compensation sub-sample, it is insignificant with the low-option-compensation
sub-sample. These results suggest that adjusting CEOs’ compensation contracts could reduce
the likelihood that an overconfident CEO contributes to the occurrence of a SCA.
[Table 10 about here]
4.6 Post-SCA disciplinary action
We anticipate that overconfident CEOs who experience a SCA are more likely to leave the
company after the SCA than are their non-litigated counterparts (Hypothesis 8). When we
explore this, we look at all CEO turnovers (not conditioned on the stated reason for the
departure). This is because it is plausible that a CEO might ‘decide’ to retire early after
losing the support of the board, making it unclear precisely whether the turnover is forced
or voluntary. To the extent that the analysis captures some voluntary turnovers, this would
make it more difficult to find a relationship between SCAs, overconfidence and turnover.
The results support our predictions. In unreported tests, we do find that a SCA is positively
related to CEO turnover (as in Aharony et al., 2014; Humphery-Jenner, 2012; Karpoff et al.,
2008a). In Table 11 we report the interaction of the SUED indicator with CEO HOLDER67.
There are several interesting findings. First, in Columns 1-4, if the firm has not experienced a
SCA, then overconfident CEOs are less likely to leave the company. However, after we control
for GINDEX in Columns 5-8, CEO overconfidence is generally insignificantly related to CEO
turnover. Conversely, if the firm has an overconfident CEO, then he/she is significantly more
likely to leave the company if there is a SCA.
23
Second, if the firm has experienced a SCA, then it is mainly the overconfident CEOs that
are subsequently removed. That is, the coefficient on the SUED(t) indicator is negative and
significant whereas the interaction CEO HOLDER67(t-1)*SUED(t) is positive and significant
and of slightly larger magnitude. This suggests that boards consider the nature of their CEOs
when deciding whether to remove them after a SCA. That is, firms are more likely to hold
overconfident CEOs responsible for the SCA.
[Table 11 about here]
We further explore which overconfident CEOs are more vulnerable to post-SCA disciplinary
action. We do this by splitting the sample into the set of CEOs that were internally appointed
and the set of CEOs that were externally appointed. The internally appointed ones are more
likely to be insiders, with greater power (vis-a-vis the board) and greater entrenchment. We
then analyze whether overconfident CEOs that are entrenched are less likely to be removed
following a SCA than are other CEOs. We present the results in Table 12. Columns 1,2,5,6
analyze the impact of SCAs on the removal of CEOs that were internally appointed (i.e., where
the individual that was CEO at the time of the SCA was internally appointed). Columns
3,4, and 7,8 do likewise for externally appointed CEOs. The results are consistent with
our predictions: overconfident CEOs that were internally appointed are no more likely to be
disciplined than other CEOs. By contrast, overconfident CEOs that were externally appointed
are significantly more likely to be disciplined than are other CEOs.
[Table 12 about here]
We additionally split the sample by whether the company is entrenched as proxied by the
firm’s GINDEX. We define entrenched companies as those for which the firm’s GINDEX is at
least 10 (per Masulis et al., 2007). The results are in Table 13. Columns 1-4 of Table 13 contain
the control variables from Columns 1-4 of Table 11, respectively. The main finding is that in
non-entrenched companies (i.e., with GINDEX ≤ 10), overconfident CEOs are more likely to
be removed following a SCA, whereas in entrenched companies they are not. This suggests
that stronger corporate governance plays a key role in disciplining overconfident CEOs.
24

[Table 13 about here]
4.7 Addressing alternative explanations and robustness tests
Media-based measures of overconfidence: The main reported models use the option-
based measure of overconfidence. However, prior literature does show that there is a rela-
tionship between compensation-structures and litigation-risk (see e.g., Peng and Roell, 2008).
This raises the possibility that option-based measures of overconfidence merely reflect the
impact of the CEO’s compensation structure. We argue that this is unlikely to be the case
because (1) the option-based measures of overconfidence are derived from the CEO’s behavior
vis-a-vis those options, not merely from the receipt of options per se, and (2) we also find that
the impact of option-compensation on litigation-likelihood is separate and distinct from the
impact of overconfidence. Specifically, when analyzing SFAS 123R, we find that a reduction in
option-compensation (following the accounting-rule change) reduces the impact of overconfi-
dence on litigation-likelihood, implying that it has a separate (albeit complementary) impact
from overconfidence. Nonetheless, we check that the results are robust to alternative measures
of overconfidence.
An alternative way of measuring overconfidence is through media-based measures (per
Hirshleifer et al., 2012). We ensure the results are robust to a ‘net news’ measure. We construct
this measure by hand-collecting news-based data between 2000 and 2006 from Factiva. To
do this, we search for newspaper reports that refer to the CEO as ‘confident’, ‘optimistic’,
‘positive’ (for confident news) as opposed to reports that refer to the CEO as ‘not confident’,
‘not optimistic’, ‘not positive’, or ‘cautions’ (for non-confident news). We then construct a ‘net
news’ measure as the number of confident reports less the number of non-confident reports.
We report the baseline models using the media-based measure in Table 14.12 The results are
qualitatively similar to the reported results: overconfident CEOs are more likely to be subject
to a SCA than are other CEOs.
12In unreported tests, we find that the results are qualitatively similar if we twice-lag the media-measure tofurther obviate any concern about feedback between the SCA and the single-lagged media-measure.
25

[Table 14 about here]
Systematic differences and panel models: We also ensure that the results are robust
to modeling technique. One concern is that there might be systematic differences between
companies that are subject to a SCA and those that are not sued. We mitigate this by
using propensity score matching techniques. We present these results, in additional to panel
regressions, in Table 15. For brevity, we only report the results for one model specification.
Columns 1-6 use different propensity score techniques. Columns 1-3 match firms with
overconfident CEOs to firms with non-overconfident CEOs. Column 1 contains a first-stage
regression that predicts the likelihood that the firm has an overconfident CEO (as a function
of firm-characteristics). Column 2 matches the control sample of non-overconfident firms with
the set of overconfident firms as follows. We obtain the set of propensity scores from Column
1. Next we construct a distribution of propensity scores for the set of overconfident firms.
Then we identify the 10th percentile cut-off. Finally, we estimate the regression (in Column
2) omitting any non-overconfident firm whose propensity score lies below this 10th percentile
cut-off. In Column 3 we undertake one-to-four nearest neighbor matching. This functions by
running the aforementioned first-stage model and obtaining the propensity scores from that
model. The second-stage then retains the treatment firm and the nearest four control firms
(which have the smallest difference in propensity score with the treatment firms). Columns
4-6 follow a similar process but matches sued firms with non-sued firms. In all cases we
find that overconfident managers’ firms are more likely to be sued. We obtain similar results
(unreported for brevity) if we undertake one-to-one matching (instead of one-to-four matching)
or if we use a different percentile cut-off instead of the 10th percentile (e.g., the results are
robust to using the 5th and 15th percentiles).
In Column 7, we report a regression that uses firm and year fixed effects. Using firm fixed
effects significantly reduces the sample size. Nonetheless, our baseline results hold if we use
firm fixed effects.
[Table 15 about here]
26

Ranking of ‘senior’ and ‘junior’ executives: The models in Table 4 split the executives
into ‘senior’ and ‘junior’ executives based on the executives’ titles. An alternative way to split
executives is based on their salary. We do this by identifying the four highest remunerated
executives (as compared with the other executives) at each firm. We then re-run the models
from Table 4 but use the Top 4/Non-Top 4 split. We report the results in Table 16. The
results are qualitatively similar to those in Table 4. Specifically, while the overconfidence of
both the ‘senior’ (i.e., top 4) and ‘junior’ executives are individually associated with SCAs (see
Panels A and B), this is mainly due to the overconfidence of the top 4 remunerated executives
(see Panel C).
[Table 16 about here]
Kolasinski and Li (2013) type measure of overconfidence: We also ensure that the
results are robust to using a Kolasinski and Li (2013) type measure of CEO overconfidence.
They define an overconfident CEO to be one who purchases stock in his/her own company and
then loses money on that purchase. We address this by identifying all CEO stock-purchases
in the Thomson Reuters insider trading filings. We identify if the CEO purchased stock in
year t− 1 (where year t is the year from which the SCA-indicator dates). We then calculate
the return that the CEO earned on that purchase over the following two years (500 trading
days). We define the confidence-measure as the return earned on these repurchases. This
is a continuous variable and we restrict attention to situations where the CEO did purchase
stock, as a mere non-purchase could be due to either a lack of overconfidence or to financial
constraints.
The results are in Table 17. The main finding is that the coefficient on the CEO stock
return measure is negative and significant. This indicates that if the CEO purchases stock
and the firm subsequently performs poorly (i.e., the CEO is more overconfident), then the
firm is more likely to be sued. This result is consistent with those in the main regressions.
[Table 17 about here]
Option-based overconfidence and firm performance: One concern is that option-
27

based measures of overconfidence increase with the firm’s performance; and thus, the HOLDER67
measure might merely proxy for other extraneous market movements. The aforementioned
media-based measure of overconfidence at least partially mitigates this. Nonetheless, we also
address this concern by using a ‘residual’ measure of CEO overconfidence. We define the Resid-
ual CEO HOLDER67 (t-1) variable as the residual from the regression CEO HOLDER67 (t-1)
= α + βRETURN (t-1) + ε. This Residual CEO HOLDER67 (t-1) would capture the portion
of CEO overconfidence that does not merely reflect stock returns. We report the results in
Table 18. The results are qualitatively similar to those previously reported. Further, for the
SEO-results, we ensure (in unreported tests) that the results hold when using a HOLDER67
measure constructed using the CEO’s option holdings from prior to the SEO event.
[Table 18 about here]
Endogeneity concerns, including the issue of whether CEOs make false state-
ments to increase the value of their option-holdings: One possible concern is that the
HOLDER67 option-based measure of overconfidence is premised on the CEO holding options
that are at least 67% in the money. However, if the CEO pumps the stock to increase the
share price, then it would also increase the value of those options and could lead to those
options becoming at least 67% in the money. Thus, the conduct leading to the SCA might
create the appearance of the CEO intentionally holding highly in the money options (when in
fact it was an indirect consequence of the misstatement).
We argue that endogeneity is unlikely to drive the results: (1) The options must be at
least 67% in the money in at least two separate years, minimizing the chance of the CEO
making false statements that merely indirectly inflate the value of the options. (2) The
results are qualitatively similar if we use media-based measures of overconfidence, which are
not subject to this criticism (see above and Table 14). (3) Prior literature shows that such
risk-taking tendencies (as connoted by such measures as HOLDER67) tend to derive from
genetic characteristics (Cesarini et al., 2009; Cronqvist and Siegel, 2013)13 and/or early life
13Cesarini et al. (2009) examine sets of twins and argue that genetics explains between 16% and 34% ofan individual’s overconfidence. Cronqvist and Siegel (2013) suggest that genetic differences can explain up
28

experiences (Bernile et al., 2014; Malmendier et al., 2011).14 (4) It is often the case that
‘informed’ traders short the company’s stock (or manufacture a short position) prior to SCAs
(Blau and Tew, 2014), which would imply that CEOs should endeavour to exercise any options
prior to the SCA: That is, the prospect of a SCA would not cause the CEO to hold in the
money options.
Nonetheless, in unreported tests, we take additional steps to mitigate these endogeneity
concerns. First, the results are qualitatively similar if we exclude any situation where the firm
is subject to two SCAs. This excludes any situation where the CEO could have pumped the
stock price twice (rending the CEO overconfident according to the HOLDER67 definition).
Thus, it excludes possible situations where the conduct giving rise to the SCA also inflated
the stock price and created the appearance of overconfidence.
Second, we obtain qualitatively similar results if we measure overconfidence based on the
CEO’s conduct after year t. In this case, it would be necessary for the options to be at
least 67% in the money on two occasions after the SCA, meaning that the falsely positive
misstatement cannot have driven the value of the options.
Third, in unreported tests, we obtain qualitatively similar results if we omit any situation
where the CEO would have ‘inflated’ the stock price in order to exercise his/her options. The
underlying concern is that the CEO might ‘hype’ the stock, which would give rise to the SCA
and also give rise to the appearance of options that are more valuable (causing the CEO to
appear to be overconfident). We address this by excluding from the sample any situation
where the CEO exercises options in year t or t− 1, when the SCA was in year t. The results
for these tests are qualitatively similar to the reported results.
Repeat law suit targets: The results are robust to addressing the issue of firms being
to 45% of the variation in investment biases in individual investors. However, life experiences can moderatethe impact of genetic characteristics. Similarly, Cronqvist et al. (2014) argue that genetic-characteristics alsoexplain home ownership choice (which suggests that genetic-characteristics could also explain risk-taking ininvestment in general).
14Specifically, Bernile et al. (2014) show that CEO risk-taking tendencies are associated with early lifeexperiences in surviving natural disasters. Similarly, Malmendier et al. (2011) show that early-life experiences,such as growing up in the Great Depression, or having military experience, are associated with the degree ofmanagerial overconfidence and influence corporate risk-taking tenencies.
29

sued repeatedly. In the ‘raw’ SCA data (i.e., set of SCAs for all firms before restricting the
sample to the set of firms with relevant company-level variables), there are 2559 lawsuits
against 2089 unique firms, of which 329 unique firms were sued more than once. In the
data, 256 lawsuits (from 106 unique firms) overlapped in class periods. In percentage terms,
256/2559 = 10% of lawsuits overlap in class periods; 106/329=32.2% of firms with multiple
lawsuits overlap in class periods; 106/2089 =5.07% of unique firms that were litigated in
overlapping class periods. In our sample (i.e., that requires control variables), removing firms
that are sued more than once results in only a loss of between 174 and 194 observations
(depending on the controls required) from an overall sample of 1375 litigation-observations.
The regression results are robust to omitting these observations. We report the regressions in
Table 19. The main finding is that the results are qualitatively similar in these regressions:
CEO overconfidence remains significantly and positively associated with the likelihood of a
SCA.
[Table 19 about here]
Does CEO overconfidence merely represent an aggressive ‘corporate’ culture?
One concern is that aggressive corporations, which are more likely to be subject to a SCA due
to the culture of risk-taking, seek overconfident CEOs, meaning that the overconfidence/SCA
relationship merely reflects other corporate factors. We argue that this is unlikely to be a
concern. First, we control for corporate characteristics, including corporate risk (as prox-
ied by stock return volatility). Second, Table 4 and Table 16 mitigate this concern. The
overconfidence-level of junior executives captures the nature of the firm’s corporate culture;
an aggressive firm will also hire more overconfident junior executives. However, the overcon-
fidence of junior executives is not significantly related to SCA-likelihood after controlling for
the overconfidence of senior executives (i.e., decision-makers), which is significantly related
to SCA likelihood. Thus, it is unlikely that CEO overconfidence merely captures another
corporate trait. Third, as indicated above, the results are robust to including firm fixed ef-
fects, which control for unobserved firm-related factors, which would include any particularly
30

aggressive and persistent corporate culture.
Are overconfident CEOs merely more likely to be detected rather than to
make false statements? An alternative explanation for the baseline results in Table 3 is
that overconfident CEOs are more likely to be detected (rather than being more likely to
make false statements).We argue that this is unlikely to be the case for at least three reasons.
First, this alternative ‘detection-likelihood’ story would not explain the results we find in
relation to the impact of SOX, managerial entrenchment, and compensation on the likelihood
that an overconfident CEO is sued. That is, the moderating effects that we document help
to cross-validate the relationship between overconfidence and SCA likelihood. Second, the
detection-likelihood story pre-supposes some difference in corporate-characteristics that leads
overconfident CEOs’ firms to be more likely to be sued. However, as indicated in Table 15,
the results survive propensity score matching techniques, which aim to mitigate the impact
of such differences. Third, as indicated in Table 15, the results in Table 3 hold after including
firm fixed effects, which implicitly control for any such firm-level factors that would correlate
with detection-likelihood.
CEO inattention and the option-based measure of overconfidence: One possible
concern with the option-based measures of overconfidence relates to CEO inattention. Specif-
ically, if a CEO holds relatively few options, then he/she might hold well in the money options
because the value of exercising them is low and the CEO might simply ignore them. We argue
that this is unlikely to drive the results given that they are robust to using the media-based
measure of overconfidence (see Table 14). Nonetheless, in unreported results we check that
the findings hold if we exclude from the sample any CEO whose option-holdings (i.e., value of
vested but unexercised options) are in the bottom quartile of the sample for that year. The
results are qualitatively similar in this sub-sample.
Litigation success and frivolous law suits – are the results merely reflect of
overconfident CEOs being easy targets for nonsense suits: One concern is that an
overconfident CEO, who makes many positive comments, is an easy target for a frivolous/non-
31

meritorious law suit. We mitigate this concern by hand collecting data on whether the litiga-
tion is found in favor of the plaintiff or of the defendant (i.e., the company). We then create
a “Successful SCA” indicator that equals one if the firm is sued in year t and that litigation
is subsequently successful and equals zero otherwise. The results are in Table 20 and indicate
that overconfident CEOs are also more likely to be subject to a successful law suit, suggesting
that frivolous law suits do not drive our results.
[Table 20 about here]
CEO gender and board gender diversity: We check that the results do not merely
reflect a CEO-gender effect. Levi et al. (2014) argue that female CEOs are less overconfident
than are male CEOs, leading to fewer takeover bids and more value-creation in those bids.
However, Adams and Ragunathan (2013) argue that female directors are not per se associated
with lower risk taking. Whichever is the case, we check that our results are robust to con-
trolling for CEO gender and interacting an indicator for whether the CEO is female with the
overconfidence measure. The results are unreported for brevity. Only 1.7% of the observations
in our sample feature a female CEO. We find little relationship between CEO gender and the
likelihood of a SCA. The impact of CEO overconfidence on litigation-risk varies slightly across
CEO gender: overconfident female CEOs are less likely to be sued than are overconfident male
CEOs. This is potentially consistent with female CEOs being more prudent than male CEOs
(as per Levi et al., 2014). However, the result is only weakly significant and there are rela-
tively few female CEOs in the sample, making it difficult to draw strong conclusions from the
results. Similarly, we find that board gender diversity is not statistically significantly related
to litigation likelihood.
CEO age: CEO age is arguably associated with corporate risk taking, with younger
CEO being associated with riskier corporate policies (see e.g., Kim, 2013; Serfling, 2014). In
unreported tests, we also analyze whether the results are robust to controlling for CEO age, or
indicators for whether the CEO is over 50, 60, or 65. CEO age is generally negatively related
to litigation-likelihood (however, the statistical significance of the coefficient is sensitive to the
32
set of control variables used). Controlling for these measures of CEO age does not qualitatively
change the relationship between CEO overconfidence and litigation-likelihood.
Year and industry effects: The reported results include year and two-digit SIC industry
fixed effects and cluster standard errors by firm (per Kim and Skinner, 2012). The results are
robust to clustering by year, industry, or both. Clustering by year produces smaller standard
errors than does clustering by firm. The results are also robust to how we define industry,
also holding if we use three-digit or four-digit SIC classifications.
5 Conclusion
This paper analyzes the impact of CEO overconfidence on the likelihood of a securities class ac-
tion. By definition, overconfident CEOs tend to overestimate the potential payoffs of projects
and underestimate their risks. This would result in overconfident CEOs’ statements being
reckless and falsely positive, thereby exposing the company to a 10b-5 securities class action.
We hypothesize and show that overconfident CEOs’ firms are more likely to be sued via a
SCA. Furthermore, the likelihood of a SCA increases following a poorly performing SEO. That
is, overconfident CEOs are more likely to be sued following a poorly performing SEO than are
other CEOs. Additionally, improved governance mitigates the impact of overconfidence on
SCA-likelihood. Specifically, overconfident CEOs have a less severe impact on SCA-likelihood
following SOX and in companies with fewer anti-takeover provisions.
We also find that overconfident CEOs are more likely to be disciplined following a SCA.
In particular, if the company is subject to a SCA, then overconfident CEOs are more likely to
lose their jobs in the following two years than are other CEOs. However, CEO entrenchment
reduces this likelihood: Specifically, overconfident CEOs that were internally appointed are
no more likely to be fired than are non-overconfident CEOs.
This paper contributes to both the literature on CEO overconfidence and on securities
regulation. We demonstrate another avenue through which CEO overconfidence can under-
mine shareholder wealth (exposing the company to a SCA). This highlights the need for
33

shareholders to be cautious when interpreting statements given by overconfident CEOs. The
paper also contributes to the regulation-literature by exploring an additional antecedent to
financial-misstatements (CEOs’ behavioral biases).
34

References
Adams, R. B., Ragunathan, V., 2013. Lehman sisters. Working paper.URL http://dx.doi.org/10.2139/ssrn.2380036
Aharony, J., Liu, C., Yawson, A., 2014. Corporate litigation and executive turnover. WorkingPaper, University of Adelaide.
Ahmed, A. S., Duellman, S., 2013. Managerial overconfidence and accounting conservatism.Journal of Accounting Research 51 (1), 1–30.
Altman, E. I., 1968. Financial ratios, discriminant analysis, and the prediction of corporatebankruptcy. Journal of Finance 23, 589–609.
Arena, M., Julio, B., 2011. Litigation risk, cash holdings, and corporate investment. WorkingPaper.
Arping, S., Sautner, Z., 2013. Did the Sarbanes-Oxley Act of 2002 make firms less opaque?evidence from analyst earnings forecasts. Contemporary Accounting Research 30 (3), 1133–1165.
Autore, D. M., Hutton, I., Peterson, D. R., Smith, A. H., 2014. The effect of securitieslitigation on external financing. Journal of Corporate Finance 27, 231–250.
Bates, T. W., Becher, D. A., Lemmon, M. L., March 2008. Board classification and manage-rial entrenchment: Evidence from the market for corporate control. Journal of FinancialEconomics 87 (3), 656–677.
Bebchuk, L., Cohen, A., Ferrell, A., 2009. What Matters in Corporate Governance? Reviewof Financial Studies 22 (2), 783–827.
Ben-David, I., Graham, J. R., Harvey, C. R., 2013. Managerial miscalibration. QuarterlyJournal of Economics 128 (4), 1547–1584.
Bernile, G., Bhagwat, V., Rau, P. R., 2014. What doesn’t kill you will only make you morerisk-loving: Early-life disasters and ceo behavior. Working Paper.
Bertrand, M., Mullainathan, S., 2003. Enjoying the quiet life? corporate governance andmanagerial preferences. Journal of Political Economy 111 (5), 1043–1075.
Blau, B. M., Tew, P. L., 2014. Short sales and class-action lawsuits. Journal of FinancialMarkets.
Bolger, J. P., 1980. Recklessness and the rule 10b-5 scienter standard after hochfelder. FordhamLaw Review 48 (5), 817–837.
Bouwman, C. H. S., 2014. Managerial optimism and earnings smoothing. Journal of Bankingand Finance 41 (1), 283–303.
Bradley, D., Cline, B. N., Lian, Q., 2014. Class action lawsuits and executive stock optionexercise. Journal of Corporate Finance.
35

Cesarini, D., Johannesson, M., Lichtenstein, P., Wallace, B., 2009. Heritability of overconfi-dence. Journal of the European Economic Association 7 (2-3), 617–622.
Chen, G., Crossland, C., Luo, S., Forthcoming. Making the Same Mistake All Over Again:CEO Overconfidence and Corporate Resistance to Corrective Feedback. Strategic Manage-ment Journal.
Choi, J. J., Li, Y., Zhang, J., 2013. Can Monitoring by Non-CEO Executives Reduce theLikelihood of Corporate Fraud? Working Paper, Temple University.
Choi, S. J., 2006. Do the merits matter less after the private securities litigation reform act?Journal of Law, Economics, and Organization 23 (3), 598–626.
Choi, S. J., Johnson-Skinner, D. T., Pritchard, A. C., 2011. The price of pay to play insecurities class actions. Journal of Empirical Legal Studies 8 (4), 650–681.
Choi, S. J., Nelson, K. K., Pritchard, A. C., 2009. The Screening Effect of the Private SecuritiesLitigation Reform Act. Journal of Empirical Legal Studies 6 (1), 35–68.
Cronqvist, H., Munkel, F., Siegel, S., 2014. Genetics, homeownership, and home locationchoice. Journal of Real Estate Finance and Economics 48 (1), 79–111.
Cronqvist, H., Siegel, S., 2013. The genetics of investment biases. Working Paper.URL http://dx.doi.org/10.2139/ssrn.2009094
Denis, D. J., Hanouna, P., Sarin, A., 2006. Is there a dark side to incentive compensation?Journal of Corporate Finance 12 (3), 467–488.
Dimmock, S. G., Gerken, W. C., 2014. Regulatory oversight and return misreporting by hedgefunds. Working Paper.
Donelson, D. C., Prentice, R. A., 2012. Scienter pleading and rule 10b-5: Empirical analysisand behavioral implications. Case Western Reserve Law Review 63 (2), 441–509.
Duarte, J., Kong, K., Young, L. A., Siegel, S., 2014. The Impact of the Sarbanes-Oxley Acton Shareholders and Managers of Foreign Firms. Review of Finance 18 (1), 417–455.
DuCharme, L. L., Malatesta, P. H., Sefcik, S. E., 2004. Earnings management, stock issues,and shareholder lawsuits. Journal of Financial Economics 71 (1), 27–49.
Field, L., Lowry, M., Shu, S., 2005. Does disclosure deter or trigger litigation? Journal ofAccounting and Economics 39 (39), 487–507.
Gande, A., Lewis, C. M., 2009. Shareholder-initiated class action lawsuits: Shareholder wealtheffects and industry spillovers. Journal of Financial and Quantitative Analysis 44 (4), 823–850.
Ghosh, C., Nag, R., Sirmans, C. F., 2000. The Pricing of Seasoned Equity Offerings: Evidencefrom REITs. Real Estate Economics 28 (3), 363–384.
36

Gompers, P., Ishii, J., Metrick, A., 2003. Corporate Governance and Equity Prices. QuarterlyJournal of Economics 118 (1), 107–155.
Harford, J., Humphery-Jenner, M. L., Powell, R. G., 2012. The sources of value destructionin acquisitions by entrenched managers. Journal of Financial Economics 106 (2), 247–261.
Hayes, R. M., Lemmon, M., Qiu, M., 2012. Stock options and managerial incentives for risktaking: Evidence from fas 123r. Journal of Financial Economics 105, 174–190.
Hirshleifer, D., Low, A., Teoh, S. H., 2012. Are Overconfident CEOs Better Innovators?Journal of Finance 67 (4), 1457–1498.
Humphery-Jenner, M. L., 2012. Internal and external discipline following securities class ac-tions. Journal of Financial Intermediation 21 (1), 151–179.
Johnson, W. C., Xie, W., Yi, S., 2014. Corporate fraud and the value of reputations in theproduct market. Journal of Corporate Finance 25, 16–39.
Jones, C. L., Weingram, S. E., 1996. The Effects of Insider Trading, Seasoned Equity Offerings,Corporate Announcements, Accounting Restatements, and SEC Enforcement Actions on10b-5 Litigation Risk. Working Paper, Stanford University.
Karpoff, J. M., Lee, D. S., Martin, G. S., 2008a. The consequences to managers for financialmisrepresentation. Journal of Financial Economics 88, 193–215.
Karpoff, J. M., Lee, D. S., Martin, G. S., 2008b. The cost to firms of cooking the books.Journal of Financial and Quantitative Analysis 43, 581–612.
Karpoff, J. M., Lott, J. R., 1993. The reputational penalty firms bear for committing criminalfraud. Journal of Law and Economics 36, 757–802.
Khanna, V., Kim, E. H., Lu, Y., 2013. Ceo connectedness and corporate frauds. WorkingPaper.
Kim, I., Skinner, D. J., 2012. Measuring securities litigation risk. Journal of Accounting andEconomics 53 (1-2), 290–310.
Kim, S., 2013. The acquisitiveness of youth: CEO age and acquisition behavior. Journal ofFinancial Economics 108 (1), 250–273.
Klasa, S., Maxwell, W. F., Ortiz-Molina-Hernan, 2009. The strategic use of corporate cashholdings in collective bargaining with labor unions. Journal of Financial Economics 92 (3),421–442.
Kolasinski, A. C., Li, X., 2013. Do Strong Boards and Trading in Their Own Firm’s StockHelp CEOs Make Better Decisions? Evidence from Corporate Acquisitions by OverconfidentCEOs. Journal of Financial and Quantitative Analysis 48 (4), 1173–1206.
Laux, V., Stocken, P. C., 2012. Managerial reporting, overoptimism, and litigation risk. Jour-nal of Accounting and Economics 53 (3), 577–591.
37

Levi, M., Li, K., Zhang, F., 2014. Director gender and mergers and acquisitions. Journal ofCorporate Finance.
Loughran, T., Ritter, J., 2004. Why Has IPO Underpricing Changed Over Time? FinancialManagement 33 (3), 5–37.
Low, A., 2009. Managerial risk-taking behavior and equity-based compensation. Journal ofFinancial Economics 92 (3), 470–490.
Malm, J., Mobbs, H. S., 2014. Independent directors and corporate litigation. Working paper,University of Alabama.
Malmendier, U., Tate, G., 2005. CEO overconfidence and corporate investment. Journal ofFinancial Economics 60 (6), 2661–2700.
Malmendier, U., Tate, G., 2008. Who makes acquisitions? CEO overconfidence and the mar-ket’s reaction. Journal of Financial Economics 89, 20–43.
Malmendier, U., Tate, G., Yan, J., 2011. Overconfidence and early-life experiences: The effectof managerial traits on corporate financial policies. Journal of Finance 66 (5), 1687–1733.
Masulis, R., Wang, C., Xie, F., 2007. Corporate Governance and Acquirer Returns. Journalof Finance 62 (4), 1851–1889.
McTier, B. C., Wald, J. K., 2011. The causes and consequences of securities class actionlitigation. Journal of Corporate Finance 17 (3), 649–665.
Niehaus, G., Roth, G., 1999. Insider trading, equity issues, and ceo turnover in firms subjectto securities class action. Financial Management 28, 52–72.
Peng, L., Roell, A., 2008. Executive pay and shareholder litigation. Review of Finance 12 (1),141–184.
Perino, M., 2012. Institutional activism through litigation: An empirical analysis of publicpension fund participation in securities class actions. Journal of Empirical Legal Studies9 (2), 368–392.
Perino, M. A., 2014. Cambridge Handbook of Institutional Investment and Fiduciary Duty.Cambridge University Press, Ch. Have Institutional Fiduciaries Improved Securities ClassActions? A Review of the Empirical Literature on the PSLRA’s Lead Plaintiff, pp. 146–158.
Rangan, S., 1998. Earnings management and the performance of seasoned equity offerings.Journal of Financial Economics 50 (1), 101–122.
Reeb, D. M., Zhao, W., 2013. Director capital and corporate disclosure quality. Journal ofAccounting and Public Policy 32 (4), 191–212.
Schrand, C. M., Zechman, S. L. C., 2012. Executive overconfidence and the slippery slope tofinancial misreporting. Journal of Accounting and Economics 53 (1-2), 311–329.
38

Serfling, M. A., 2014. CEO age and the riskiness of corporate policies. Journal of CorporateFinance 25, 251–273.
Walker, R. H., Seymour, J. G., 1998. Recent judicial and legislative developments affectingthe private securities fraud class action. Arizona Law Review 40 (3), 1003–1037.
Wang, T., Winton, A., 2014. Product market interactions and corporate fraud. Working Paper,University of Minnesota – Twin Cities.
Wang, T., Winton, A., Yu, X., 2010. Corporate Fraud and Business Conditions: Evidencefrom IPOs. Journal of Finance 65 (6), 2255–2292.
39

Appendix: Variables
Variable Definition
CEO HOLDER67 The CEO’s HOLDER67 value computed in the same way toin Malmendier et al. (2011). This is an indicator that equalsone from the first time that the CEO holds options that are(on average) at least 67% in the money if the CEO does so onat least two occaisions. We use Execucomp data to obtain ameasure for how in the money the options are on average. Wefirst create a measure of the extent to which the options arein-the-money, defined as Average value per option/Numberof options, where the Average value per option is the esti-mated value of the vested optiosn scaled by the number ofsuch options. We then scale this ‘in-the-moneyness’ variableby the average strike price for the options, which we proxyas S − (S − X) = Stock price at the end of the fiscal year(in CRSP/Compustat: prcc f) - the avera average value peroption (computed as indicated previously).
TEAM HOLDER67 The average Holder67 measure for all executives at the firmin that year. We compute the Holder67 measure for non-CEOexecutives in the same way as we compute CEO HOLDER67.
OTHER EXECHOLDER67
The average Holder67 measure for all non-CEO executives atthe firm in that year. We compute the Holder67 measure fornon-CEO executives in the same way as we compute CEOHOLDER67.
SENIOR HOLDER67 The average Holder67 measure for all senior executives atthe firm in that year. We compute the Holder67 measure fornon-CEO executives in the same way as we compute CEOHOLDER67. We define senior executives as any executivewith the title (in Execucomp) of CEO, CFO, COO, President,Chairman/woman, and executives whose title includes theword ‘chief’.
JUNIOR HOLDER67 The average Holder67 measure for all junior executives atthe firm in that year. We compute the Holder67 measure fornon-CEO executives in the same way as we compute CEOHOLDER67. We define junior executives as any non-seniorexecutive.
NYSE An indicator that equals one if the firm trades on the NewYork Stock Exchange.
LNASSET The natural log of the firm’s book assets (Compustat: at).ROA The firm’s return on assets, defined as its net income scaled
by its assets.
40

SALES GROWTH The sales growth in year t−1 is the sales in year t−1 less thesales in year t− 2 all scaled by the assets at the beginning ofyear t− 1.
R&D The R&D expense (Compustat: xrd) scaled by the beginning-of-year assets.
PP&E The firms property, plant and equipment scaled by its assets.MB The firm’s market value of equity at the end of the fiscal year
(Compustat: prcc f × csho) scaled by its book value of equity.RETURN The firm’s market adjusted stock return over the year (with
stock return data from CRSP).SKEW The skewness of the firm’s stock return over the yearRETURN STD DEV The standard deviation of the daily stock return over the
year.TURNOVER The trading volume for the year scaled by the number of
shares outstanding at the beginning of the year.INST The percentage of shares that institutional investors hold.
The institutional-holding data is from the Thomson 13F fil-ings. If the firm does not appear in the filings, we deem it tohave zero institutional holdings.
EQUITY PROCEEDS The amount of capital that the firm raises via equity issuancesin that year scaled by the firm’s assets.
DEBT PROCEEDS The amount of capital that the firm raises via debt in thatyear scaled by the firm’s assets.
INSIDER TRADING The insider trading figure for year t− 1 is the average insiderinsider sales (net of purchases) for years t−1 and t−2 scaledby the firm’s revenue.
INSIDER HOLDING The average of all insider share holdings scaled by the totalshares outstanding.
IND WC The industry average working capital accruals (current assetsless current liabilities) scaled by the total assets.
IND ALTMAN Z The industry average Altman (1968) Z score.SUED An indicator that equals one if the firm was subject to a se-
curities class action. The data is from the Stanford SecuritiesClass Action Clearinghouse (SCAC).
POSTSOX An indicator that equals one if the observation is after theSarbanes-Oxley Act of 2002 (i.e. if the observation is in 2002or later).
POSTFAS An indicator that equals one if the observation is after FAS123R (i.e. the observation is in 2005 or later).
GINDEX The firm’s Gompers et al. (2003) index of 24 anti-takeoverprovisions.
GINDEX TOPQ An indicator that equals one if the firm’s GINDEX is in thetop quartile (corresponding to a GINDEX of greater than 11).
SHROWN The CEO’s percentage share ownership.
41
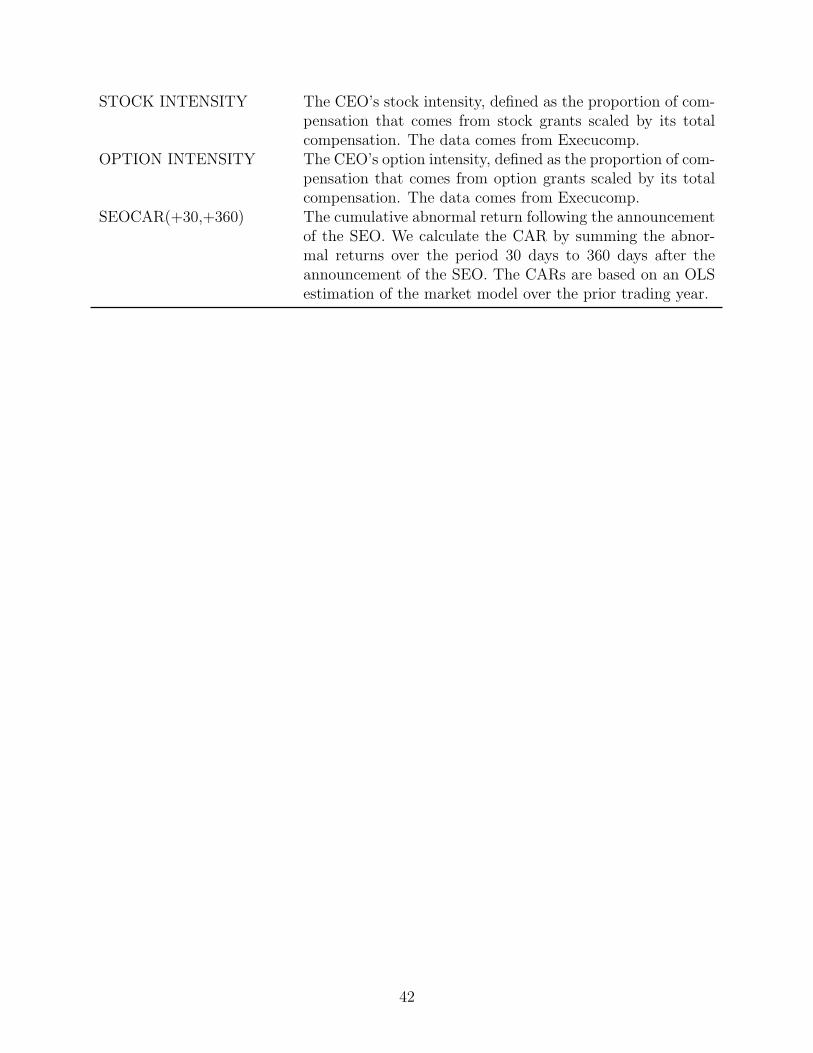
STOCK INTENSITY The CEO’s stock intensity, defined as the proportion of com-pensation that comes from stock grants scaled by its totalcompensation. The data comes from Execucomp.
OPTION INTENSITY The CEO’s option intensity, defined as the proportion of com-pensation that comes from option grants scaled by its totalcompensation. The data comes from Execucomp.
SEOCAR(+30,+360) The cumulative abnormal return following the announcementof the SEO. We calculate the CAR by summing the abnor-mal returns over the period 30 days to 360 days after theannouncement of the SEO. The CARs are based on an OLSestimation of the market model over the prior trading year.
42

Tables
Table 1: Sample Distribution by Year
This table contains the sample composition by year. We define overconfident CEOs as those for which HOLDER67 equals one(HOLDER67 is defined in the variable appendix). We identify law suits using the Stanford Securities Class Action Clearinghouse(SCAC).
Year #CEO #Overconfident CEO # Lawsuits filed #Overconfident CEO %Lawsuits involvinginvolved in lawsuits overconfident CEOs
1996 1125 505 14 9 64.2861997 1135 578 38 29 76.3161998 1183 676 57 46 80.7021999 1234 720 93 65 69.8922000 1300 742 105 78 74.2862001 1355 786 129 98 75.9692002 1339 746 124 81 65.3232003 1384 715 119 81 68.0672004 1419 763 111 73 65.7662005 1395 803 87 52 59.7702006 1378 796 76 46 60.5262007 1398 798 104 63 60.5772008 1509 805 99 53 53.5352009 1498 731 71 37 52.1132010 1475 691 73 37 50.6852011 1417 676 48 23 47.9172012 1329 631 27 17 62.963
Total 22873 12162 1375 888 64.582
43

Tab
le2:
SummaryStatistics
This
table
conta
insth
esu
mm
ary
statistics.
Thevariable
definitionsare
inth
evariable
Appendix.
Full
Sam
ple
Over-confidentCEOs
Non-O
ver-confidentCEOs
Mean
Median
Std
Dev
Mean
Median
Std
Dev
Mean
Median
Std
Dev
PanelA:Litigation
variables
SUED
indicato
r0.060
0.238
0.000
0.073
0.260
0.000
0.045
0.208
0.000
Litigation
firm
long-run
cumulative
abnor-
malre
turn
sLCAR(+
10,+360)(%
)-2
8.431
221.691
-14.998
-37.041
161.524
-20.723
-18.722
273.812
-9.339
Litigation
firm
pre
-runup
CAR(-360,0)(%
)-3
4.980
256.839
-19.751
-35.854
188.056
-19.691
-33.996
316.958
-19.765
PanelB:ConfidenceM
easu
resand
CEO
chara
cte
ristics
CEO
Hold
er6
7in
dicato
r0.532
0.499
1.000
TEAM
Hold
er6
7in
dicato
r0.789
0.408
1.000
SR
Hold
er67
indicato
r0.786
0.411
1.000
JR
Hold
er67
indicato
r0.667
0.471
1.000
CEO
Sto
ck
Inte
nsity
0.131
0.202
0.000
0.118
0.198
0.000
0.147
0.205
0.000
CEO
Option
Inte
nsity
0.300
0.272
0.261
0.327
0.287
0.294
0.269
0.251
0.232
CEO
Share
sowned
0.018
0.038
0.003
0.022
0.041
0.005
0.013
0.034
0.002
CEO
age(y
ears)
60.770
8.706
61.000
61.396
8.427
61.000
60.056
8.958
60.000
CEO
Turn
over(in
t+1
and
t+2)
0.071
0.257
0.000
0.065
0.256
0.000
0.078
0.269
0.000
Inte
rnalCEO
indicato
r0.311
0.463
0.000
0.316
0.465
0.000
0.306
0.461
0.000
Female
CEO
indicato
r0.019
0.138
0.000
0.012
0.110
0.000
0.028
0.164
0.000
Netn
ews
3.089
2.260
2.817
4.075
2.210
4.221
1.754
1.521
1.503
PanelC:Firm
Variables
Altman-Z
4.922
6.413
3.508
6.122
7.483
4.152
3.579
4.589
2.961
Assets
(mns)
8695.599
20992.480
1679.331
8088.222
19834.200
1560.185
9384.651
22214.420
1841.269
Debtpro
ceeds(n
et)
0.011
0.084
0.000
0.015
0.085
0.000
0.006
0.083
0.000
Equity
pro
ceeds(n
et)
-0.004
0.093
0.000
-0.004
0.098
0.000
-0.005
0.085
0.000
FPS
0.282
0.450
0.000
0.311
0.463
0.000
0.249
0.432
0.000
Goodwill
0.097
0.134
0.029
0.101
0.138
0.028
0.094
0.129
0.029
Govern
anceIn
dex
(Gin
dex)
9.307
2.631
9.000
9.117
2.667
9.000
9.511
2.577
10.000
InsiderHold
ing
0.016
0.053
0.002
0.018
0.054
0.003
0.014
0.051
0.001
InsiderTra
din
g0.020
0.108
0.002
0.027
0.120
0.003
0.012
0.092
0.001
Institutionalownership
(INST)
0.552
0.560
0.640
0.569
0.529
0.671
0.532
0.594
0.608
Mark
et-to
-book
(MB)
3.209
3.652
2.204
3.715
3.924
2.647
2.630
3.219
1.843
NYSE
Indicato
r0.626
0.484
1.000
0.603
0.489
1.000
0.652
0.476
1.000
POSTFAS
indicato
r0.498
0.500
0.000
0.487
0.500
0.000
0.511
0.500
1.000
POSTSOX
indicato
r0.679
0.467
1.000
0.670
0.470
1.000
0.690
0.463
1.000
PP&E
0.262
0.230
0.192
0.245
0.228
0.173
0.281
0.232
0.219
Retu
rn(t-1
)-0
.001
0.037
0.000
0.003
0.038
0.003
-0.006
0.036
-0.004
Retu
rnsk
ewess
(t-1
)0.173
0.791
0.150
0.168
0.785
0.146
0.178
0.767
0.155
Retu
rnstd
dev
(t-1
)0.107
0.071
0.090
0.109
0.072
0.092
0.105
0.070
0.087
ROA
0.032
0.138
0.044
0.047
0.120
0.055
0.014
0.154
0.033
R&D
0.030
0.064
0.000
0.032
0.066
0.000
0.028
0.062
0.000
Salesgro
wth
0.071
0.213
0.053
0.101
0.212
0.076
0.036
0.209
0.030
Turn
over(t-1
)2.042
2.164
1.453
2.276
2.448
1.637
1.777
1.749
1.262
US
incorp
ora
ted
0.981
0.138
1.000
0.978
0.147
1.000
0.984
0.126
1.000
Work
ing
capital(W
C)
0.220
0.206
0.195
0.238
0.212
0.216
0.199
0.197
0.174
PanelD:Oth
erVariables
BID
DER
indicato
r(t-1
)0.305
0.460
0.000
0.329
0.470
0.000
0.277
0.447
0.000
TARGET
indicato
r(t-1
)0.062
0.241
0.000
0.070
0.254
0.000
0.054
0.225
0.000
SEO
indicato
r(t-1
)0.056
0.230
0.000
0.061
0.240
0.000
0.050
0.219
0.000
Mean
bid
der
cumulative
abnorm
al
retu
rns
BCAR
(-10,+
1)(%
)0.110
8.040
-0.001
0.148
8.291
0.094
0.060
7.704
-0.239
44

Mean
Targ
et
cumulative
abnorm
al
retu
rns
TCAR
(-10,+
1)(%
)0.139
7.812
-0.080
-0.028
7.892
0.075
0.382
7.695
-0.253
Mean
SEO
cumulative
abnorm
al
retu
rns
TCAR
(+10,+
360)(%
)-4
5.108
97.647
-29.089
-50.272
100.008
-35.622
-37.956
93.905
-23.629
BETA
1.260
0.661
1.170
1.328
0.669
1.227
1.182
0.643
1.103
MSE
0.025
0.013
0.021
0.025
0.013
0.022
0.024
0.014
0.020
PanelE:In
dustry
Variables
IND
Altman-Z
-23.614
65.932
-0.349
IND
Assets
(mns)
6859.480
13367.350
1707.560
IND
Debtpro
ceeds(n
et)
-0.026
0.678
0.022
IND
Equity
pro
ceeds(n
et)
0.148
0.420
0.091
IND
Goodwill
0.067
0.048
0.056
IND
MB
6.269
6.996
4.041
IND
PP&E
0.249
0.182
0.184
IND
ROA
-1.196
2.680
-0.313
IND
R&D
0.097
0.145
0.019
IND
Salesgro
wth
-0.360
1.809
0.012
IND
WC
-1.497
3.476
-0.127
45
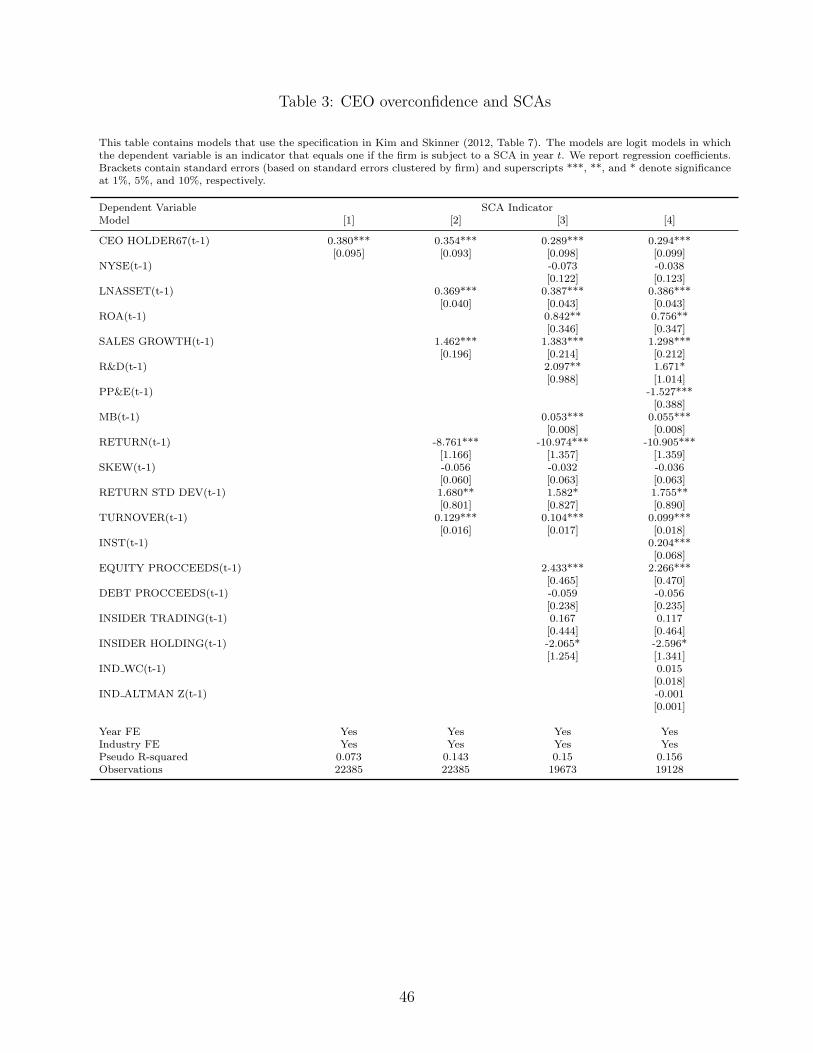
Table 3: CEO overconfidence and SCAs
This table contains models that use the specification in Kim and Skinner (2012, Table 7). The models are logit models in whichthe dependent variable is an indicator that equals one if the firm is subject to a SCA in year t. We report regression coefficients.Brackets contain standard errors (based on standard errors clustered by firm) and superscripts ***, **, and * denote significanceat 1%, 5%, and 10%, respectively.
Dependent Variable SCA IndicatorModel [1] [2] [3] [4]
CEO HOLDER67(t-1) 0.380*** 0.354*** 0.289*** 0.294***[0.095] [0.093] [0.098] [0.099]
NYSE(t-1) -0.073 -0.038[0.122] [0.123]
LNASSET(t-1) 0.369*** 0.387*** 0.386***[0.040] [0.043] [0.043]
ROA(t-1) 0.842** 0.756**[0.346] [0.347]
SALES GROWTH(t-1) 1.462*** 1.383*** 1.298***[0.196] [0.214] [0.212]
R&D(t-1) 2.097** 1.671*[0.988] [1.014]
PP&E(t-1) -1.527***[0.388]
MB(t-1) 0.053*** 0.055***[0.008] [0.008]
RETURN(t-1) -8.761*** -10.974*** -10.905***[1.166] [1.357] [1.359]
SKEW(t-1) -0.056 -0.032 -0.036[0.060] [0.063] [0.063]
RETURN STD DEV(t-1) 1.680** 1.582* 1.755**[0.801] [0.827] [0.890]
TURNOVER(t-1) 0.129*** 0.104*** 0.099***[0.016] [0.017] [0.018]
INST(t-1) 0.204***[0.068]
EQUITY PROCCEEDS(t-1) 2.433*** 2.266***[0.465] [0.470]
DEBT PROCCEEDS(t-1) -0.059 -0.056[0.238] [0.235]
INSIDER TRADING(t-1) 0.167 0.117[0.444] [0.464]
INSIDER HOLDING(t-1) -2.065* -2.596*[1.254] [1.341]
IND WC(t-1) 0.015[0.018]
IND ALTMAN Z(t-1) -0.001[0.001]
Year FE Yes Yes Yes YesIndustry FE Yes Yes Yes YesPseudo R-squared 0.073 0.143 0.15 0.156Observations 22385 22385 19673 19128
46
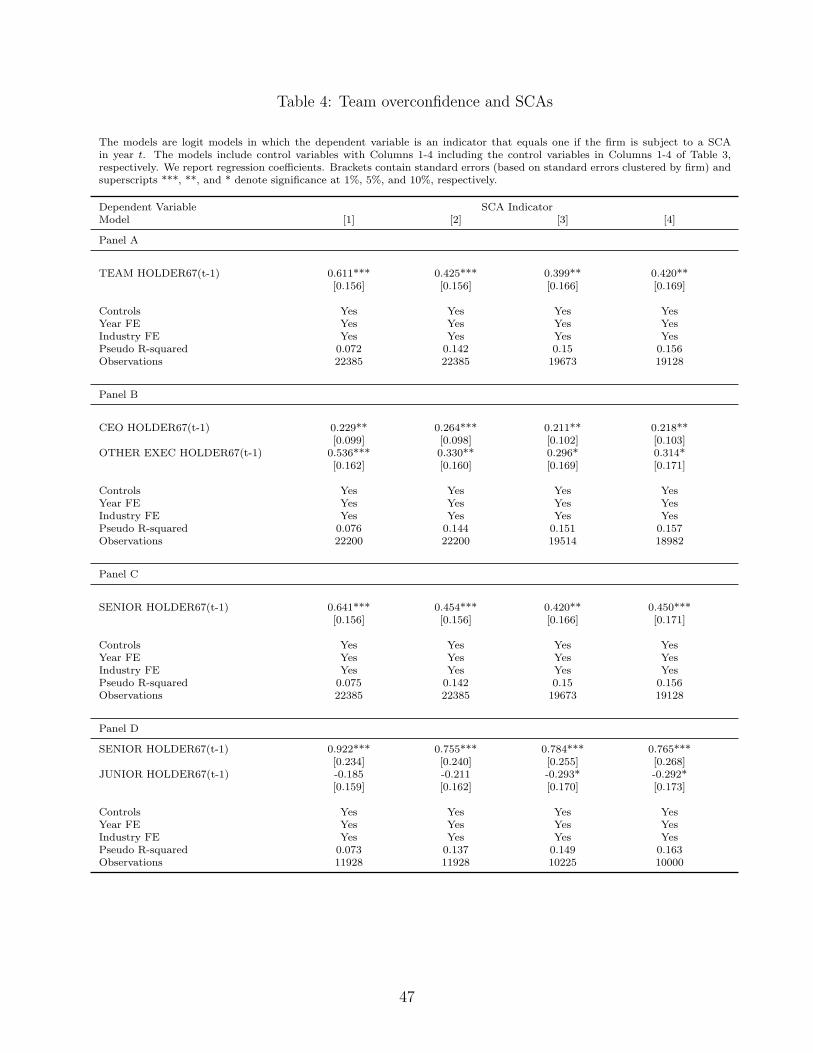
Table 4: Team overconfidence and SCAs
The models are logit models in which the dependent variable is an indicator that equals one if the firm is subject to a SCAin year t. The models include control variables with Columns 1-4 including the control variables in Columns 1-4 of Table 3,respectively. We report regression coefficients. Brackets contain standard errors (based on standard errors clustered by firm) andsuperscripts ***, **, and * denote significance at 1%, 5%, and 10%, respectively.
Dependent Variable SCA IndicatorModel [1] [2] [3] [4]
Panel A
TEAM HOLDER67(t-1) 0.611*** 0.425*** 0.399** 0.420**[0.156] [0.156] [0.166] [0.169]
Controls Yes Yes Yes YesYear FE Yes Yes Yes YesIndustry FE Yes Yes Yes YesPseudo R-squared 0.072 0.142 0.15 0.156Observations 22385 22385 19673 19128
Panel B
CEO HOLDER67(t-1) 0.229** 0.264*** 0.211** 0.218**[0.099] [0.098] [0.102] [0.103]
OTHER EXEC HOLDER67(t-1) 0.536*** 0.330** 0.296* 0.314*[0.162] [0.160] [0.169] [0.171]
Controls Yes Yes Yes YesYear FE Yes Yes Yes YesIndustry FE Yes Yes Yes YesPseudo R-squared 0.076 0.144 0.151 0.157Observations 22200 22200 19514 18982
Panel C
SENIOR HOLDER67(t-1) 0.641*** 0.454*** 0.420** 0.450***[0.156] [0.156] [0.166] [0.171]
Controls Yes Yes Yes YesYear FE Yes Yes Yes YesIndustry FE Yes Yes Yes YesPseudo R-squared 0.075 0.142 0.15 0.156Observations 22385 22385 19673 19128
Panel D
SENIOR HOLDER67(t-1) 0.922*** 0.755*** 0.784*** 0.765***[0.234] [0.240] [0.255] [0.268]
JUNIOR HOLDER67(t-1) -0.185 -0.211 -0.293* -0.292*[0.159] [0.162] [0.170] [0.173]
Controls Yes Yes Yes YesYear FE Yes Yes Yes YesIndustry FE Yes Yes Yes YesPseudo R-squared 0.073 0.137 0.149 0.163Observations 11928 11928 10225 10000
47

Table 5: SCAs following SEOs
This table contains regressions that examine the likelihood of a SCA following a SEO, especially by an overconfident CEO. The models are logitmodels in which the dependent variable is an indicator that equals one if the firm is subject to a SCA in year t. Columns 1-2 contain the fullsample of firms. Columns 3-4 restrict the sample to the set of firms that conduct a SEO in year t − 1. Columns 5-6 further restrict the sampleto require that that SEO alsonot be within 400 days of the subsequent SCA (in order to prevent any overlap between the SEO and the SCA). Wereport regression coefficients. Brackets contain standard errors (based on standard errors clustered by firm) and superscripts ***, **, and * denotesignificance at 1%, 5%, and 10%, respectively.
Dependent Variable SCA IndicatorSample Full Sample SEO in year t − 1 SEO in year t − 1
and no overlap with SCA[1] [2] [3] [4] [5] [6]
CEO HOLDER67(t-1) 0.343*** 0.287*** 0.473 0.536 0.341 0.258[0.111] [0.102] [0.538] [0.405] [0.737] [0.561]
SEO(t-1 ) 0.076 0.141[0.365] [0.286]
CEO HOLDER67(t-1)*SEO(t-1) 0.013 0.093[0.407] [0.335]
SEOCAR(+30,+360) -0.243 -0.205 0.265 0.083[0.340] [0.206] [0.447] [0.327]
CEO HOLDER67(t-1)*SEOCAR(+30,+360) -0.566* -0.457* -0.767* -0.737**[0.350] [0.263] [0.455] [0.370]
NYSE(t-1) -0.084 -0.033 1.363** 1.278*** 1.598** 1.326**[0.135] [0.122] [0.593] [0.446] [0.712] [0.644]
LNASSET(t-1) 0.348*** 0.388*** 0.306 0.293** 0.287 0.116[0.047] [0.043] [0.192] [0.144] [0.252] [0.228]
WC(t-1) -0.193 0.911 1.895[0.414] [1.614] [2.028]
ROA(t-1) 0.421 0.752** 1.537 2.552** 2.717 3.814**[0.324] [0.348] [1.102] [1.157] [1.801] [1.907]
SALES GROWTH(t-1) 1.138*** 1.333*** 1.492** 1.364* 3.223** 3.288***[0.209] [0.210] [0.753] [0.777] [1.343] [1.266]
R&D(t-1) 1.213 1.585 6.812** 7.655*** -0.222 3.146[1.032] [1.052] [3.038] [2.732] [5.310] [4.042]
GOODWILL(t-1) -0.617 -0.555 -4.341** -5.487*** -6.587** -6.302**[0.484] [0.445] [1.722] [1.928] [3.292] [2.643]
PP&E(t-1) -1.894*** -1.680*** -1.978 -2.284* -1.487 -2.74[0.452] [0.408] [1.764] [1.211] [2.067] [1.692]
ALTMAN Z(t-1) 0.013* 0.057** 0.016[0.007] [0.028] [0.046]
MB(t-1) 0.047*** 0.054*** 0.078 0.128** 0.338*** 0.370***[0.008] [0.008] [0.048] [0.059] [0.096] [0.088]
RETURN(t-1) -9.889*** -10.952*** -8.644** -9.573*** -14.671*** -13.725***[1.464] [1.350] [3.606] [3.229] [5.278] [4.995]
SKEW(t-1) -0.016 -0.035 0.003 -0.066 0.041 0.098[0.070] [0.063] [0.305] [0.236] [0.361] [0.321]
RETURN STD DEV(t-1) 1.07 1.714** 5.138* 3.367 8.243** 4.587[0.716] [0.873] [2.864] [2.206] [4.101] [3.695]
TURNOVER(t-1) 0.069*** 0.097*** 0.220*** 0.232*** 0.186** 0.200***[0.017] [0.018] [0.051] [0.044] [0.082] [0.075]
INST(t-1) 0.184** 0.205*** -0.077 -0.142 0.084 -0.018[0.072] [0.069] [0.217] [0.216] [0.491] [0.452]
EQUITY PROCCEEDS(t-1) 1.880*** 2.067*** -8.792*** -5.944*** -9.338*** -8.201***[0.510] [0.512] [2.235] [1.773] [3.523] [2.830]
DEBT PROCCEEDS(t-1) 0.008 -0.032 0.478 0.529 0.369 0.643[0.263] [0.232] [0.782] [0.611] [1.094] [0.862]
INSIDER TRADING(t-1) 0.138 0.071 0.494 0.715 1.641* 1.829**[0.462] [0.468] [0.790] [0.553] [0.922] [0.905]
INSIDER HOLDING(t-1) -2.358* -2.643** -7.122*** -5.843** -9.918* -8.473*[1.422] [1.347] [2.764] [2.421] [5.248] [4.328]
IND WC(t-1) 0.013 -0.073 -0.217[0.018] [0.076] [0.151]
IND ALTMAN Z(t-1) -0.001 -0.001 0.004[0.001] [0.003] [0.007]
INTERCEPT -19.855*** -8.910*** -5.889** -20.683*** -5.679 -20.461***[0.763] [0.640] [2.717] [2.685] [3.605] [3.858]
Industry and year FE Yes Yes Yes Yes Yes YesPseudo R-squared 0.144 0.157 0.334 0.296 0.436 0.394Observations 16562 19129 546 743 389 536
48
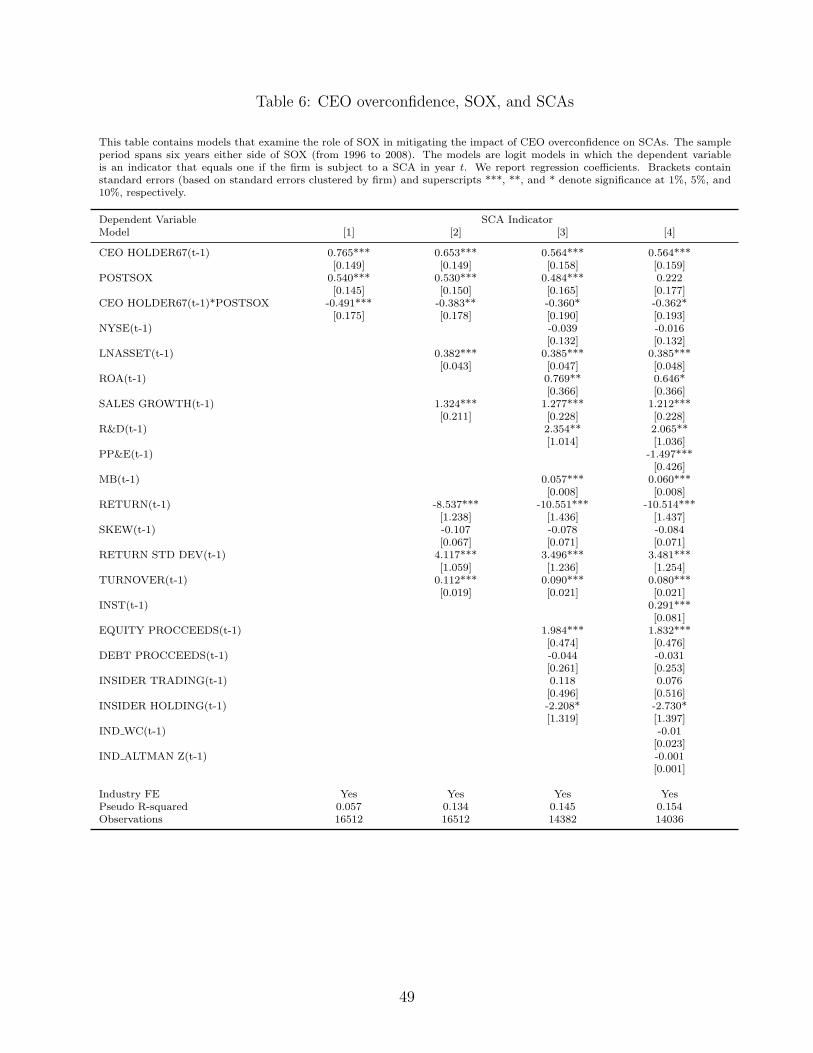
Table 6: CEO overconfidence, SOX, and SCAs
This table contains models that examine the role of SOX in mitigating the impact of CEO overconfidence on SCAs. The sampleperiod spans six years either side of SOX (from 1996 to 2008). The models are logit models in which the dependent variableis an indicator that equals one if the firm is subject to a SCA in year t. We report regression coefficients. Brackets containstandard errors (based on standard errors clustered by firm) and superscripts ***, **, and * denote significance at 1%, 5%, and10%, respectively.
Dependent Variable SCA IndicatorModel [1] [2] [3] [4]
CEO HOLDER67(t-1) 0.765*** 0.653*** 0.564*** 0.564***[0.149] [0.149] [0.158] [0.159]
POSTSOX 0.540*** 0.530*** 0.484*** 0.222[0.145] [0.150] [0.165] [0.177]
CEO HOLDER67(t-1)*POSTSOX -0.491*** -0.383** -0.360* -0.362*[0.175] [0.178] [0.190] [0.193]
NYSE(t-1) -0.039 -0.016[0.132] [0.132]
LNASSET(t-1) 0.382*** 0.385*** 0.385***[0.043] [0.047] [0.048]
ROA(t-1) 0.769** 0.646*[0.366] [0.366]
SALES GROWTH(t-1) 1.324*** 1.277*** 1.212***[0.211] [0.228] [0.228]
R&D(t-1) 2.354** 2.065**[1.014] [1.036]
PP&E(t-1) -1.497***[0.426]
MB(t-1) 0.057*** 0.060***[0.008] [0.008]
RETURN(t-1) -8.537*** -10.551*** -10.514***[1.238] [1.436] [1.437]
SKEW(t-1) -0.107 -0.078 -0.084[0.067] [0.071] [0.071]
RETURN STD DEV(t-1) 4.117*** 3.496*** 3.481***[1.059] [1.236] [1.254]
TURNOVER(t-1) 0.112*** 0.090*** 0.080***[0.019] [0.021] [0.021]
INST(t-1) 0.291***[0.081]
EQUITY PROCCEEDS(t-1) 1.984*** 1.832***[0.474] [0.476]
DEBT PROCCEEDS(t-1) -0.044 -0.031[0.261] [0.253]
INSIDER TRADING(t-1) 0.118 0.076[0.496] [0.516]
INSIDER HOLDING(t-1) -2.208* -2.730*[1.319] [1.397]
IND WC(t-1) -0.01[0.023]
IND ALTMAN Z(t-1) -0.001[0.001]
Industry FE Yes Yes Yes YesPseudo R-squared 0.057 0.134 0.145 0.154Observations 16512 16512 14382 14036
49
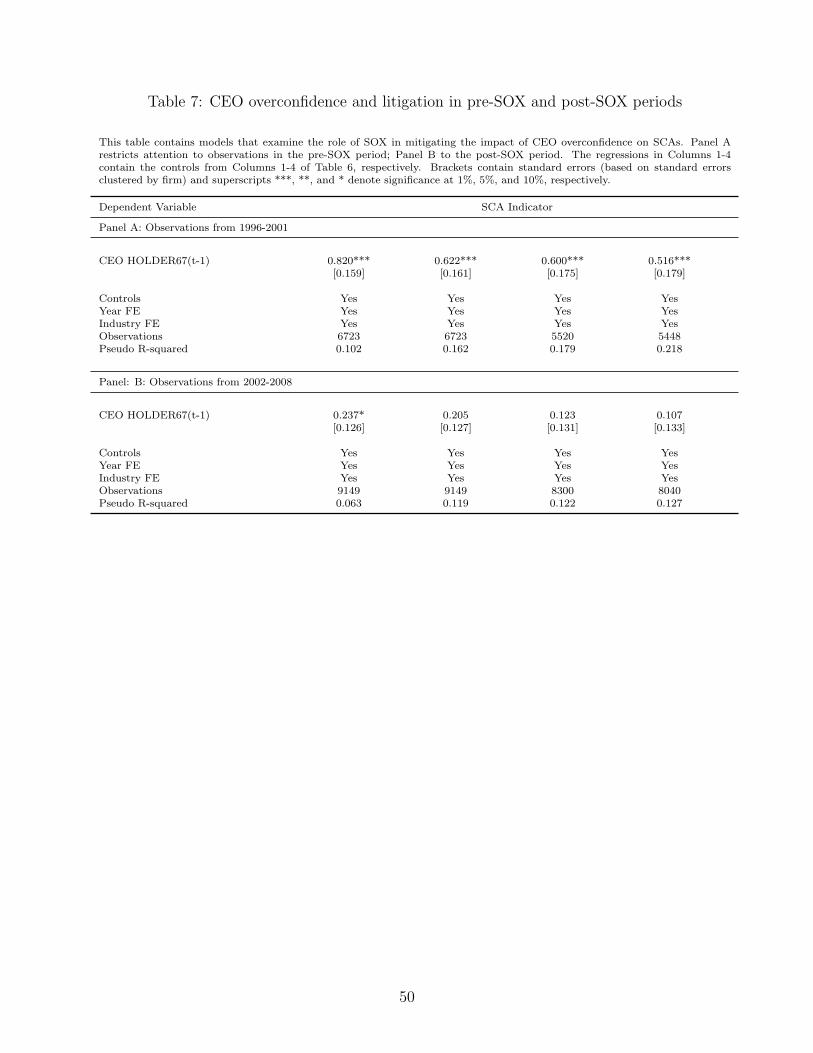
Table 7: CEO overconfidence and litigation in pre-SOX and post-SOX periods
This table contains models that examine the role of SOX in mitigating the impact of CEO overconfidence on SCAs. Panel Arestricts attention to observations in the pre-SOX period; Panel B to the post-SOX period. The regressions in Columns 1-4contain the controls from Columns 1-4 of Table 6, respectively. Brackets contain standard errors (based on standard errorsclustered by firm) and superscripts ***, **, and * denote significance at 1%, 5%, and 10%, respectively.
Dependent Variable SCA Indicator
Panel A: Observations from 1996-2001
CEO HOLDER67(t-1) 0.820*** 0.622*** 0.600*** 0.516***[0.159] [0.161] [0.175] [0.179]
Controls Yes Yes Yes YesYear FE Yes Yes Yes YesIndustry FE Yes Yes Yes YesObservations 6723 6723 5520 5448Pseudo R-squared 0.102 0.162 0.179 0.218
Panel: B: Observations from 2002-2008
CEO HOLDER67(t-1) 0.237* 0.205 0.123 0.107[0.126] [0.127] [0.131] [0.133]
Controls Yes Yes Yes YesYear FE Yes Yes Yes YesIndustry FE Yes Yes Yes YesObservations 9149 9149 8300 8040Pseudo R-squared 0.063 0.119 0.122 0.127
50

Table 8: Litigation and SOX, by SOX compliance
This table contains models that examine the role of SOX in mitigating the impact of CEO overconfidence on SCAs. The sampleperiod spans six years either side of SOX (from 1996 to 2008). The models are logit models in which the dependent variableis an indicator that equals one if the firm is subject to a SCA in year t. We report regression coefficients. The regressions inColumns 1-4 contain the controls from Columns 1-4 of Table 6, respectively. Panel A contains restricts attention to the set of‘compliant’ firms, which we define as firms with a majority independent board and an independent audit chair. Panel B focuseson the sub-sample of non-compliant firms. Brackets contain standard errors (based on standard errors clustered by firm) andsuperscripts ***, **, and * denote significance at 1%, 5%, and 10%, respectively.
Dependent variable SCA Indicator
[1] [2] [3] [4]
Panel A: Compliant Subsample
CEO HOLDER67(t-1) 1.107** 0.805* 0.624 0.807[0.477] [0.463] [0.506] [0.523]
POSTSOX -0.720* -0.667 -0.563 -0.573[0.433] [0.410] [0.451] [0.477]
CEO HOLDER67(t-1)*POSTSOX -0.724 -0.417 -0.313 -0.524[0.503] [0.486] [0.534] [0.562]
Controls Yes Yes Yes YesYear FE Yes Yes Yes YesIndustry FE Yes Yes Yes YesPseudo R-squared 0.109 0.18 0.191 0.205Observations 3293 3293 3099 2984
Panel B: Non-Compliant Subsample
CEO HOLDER67(t-1) 0.762*** 0.537*** 0.441** 0.438**[0.178] [0.180] [0.191] [0.193]
POSTSOX 0.569*** 0.531** 0.526** 0.249[0.206] [0.218] [0.235] [0.248]
CEO HOLDER67(t-1)*POSTSOX -0.603** -0.421* -0.407 -0.414[0.246] [0.253] [0.272] [0.277]
Controls Yes Yes Yes YesYear FE Yes Yes Yes YesIndustry FE Yes Yes Yes YesPseudo R-squared 0.05 0.115 0.14 0.144Observations 9079 9079 8059 7917
51

Table 9: Managerial entrenchment, CEO overconfidence, and SCAs
This table contains models that examine the relationship between CEO overconfidence, managerial entrenchment and litigation-likelihood. The models are logit models in which the dependent variable is an indicator that equals one if the firm is subjectto a SCA in year t. GINDEX is the Gompers et al. (2003) index of 24 ATPs. GINDEX TOPQ is an indicator that equalsone if the firm’s GINDEX score is in the top quartile (corresponding to a GINDEX of greater than 11). The models includecontrol variables with Columns 1-4 including the control variables in Columns 1-4 of Table 3, respectively. We report regressioncoefficients. Brackets contain standard errors (based on standard errors clustered by firm) and superscripts ***, **, and * denotesignificance at 1%, 5%, and 10%, respectively.
Dependent Variable SCA IndicatorModel [1] [2] [3] [4]
CEO HOLDER67(t-1) 0.251** 0.210* 0.157 0.155[0.115] [0.114] [0.121] [0.124]
GINDEX TOPQ(t-1) -0.558** -0.537** -0.458* -0.433*[0.235] [0.235] [0.252] [0.252]
CEO HOLDER67(t-1)* GINDEX TOPQ(t-1) 0.537** 0.518* 0.486* 0.458[0.272] [0.275] [0.291] [0.293]
Controls Yes Yes Yes YesYear FE Yes Yes Yes YesIndustry FE Yes Yes Yes YesPseudo R-squared 0.081 0.154 0.162 0.167Observations 16522 16522 14839 14494
52
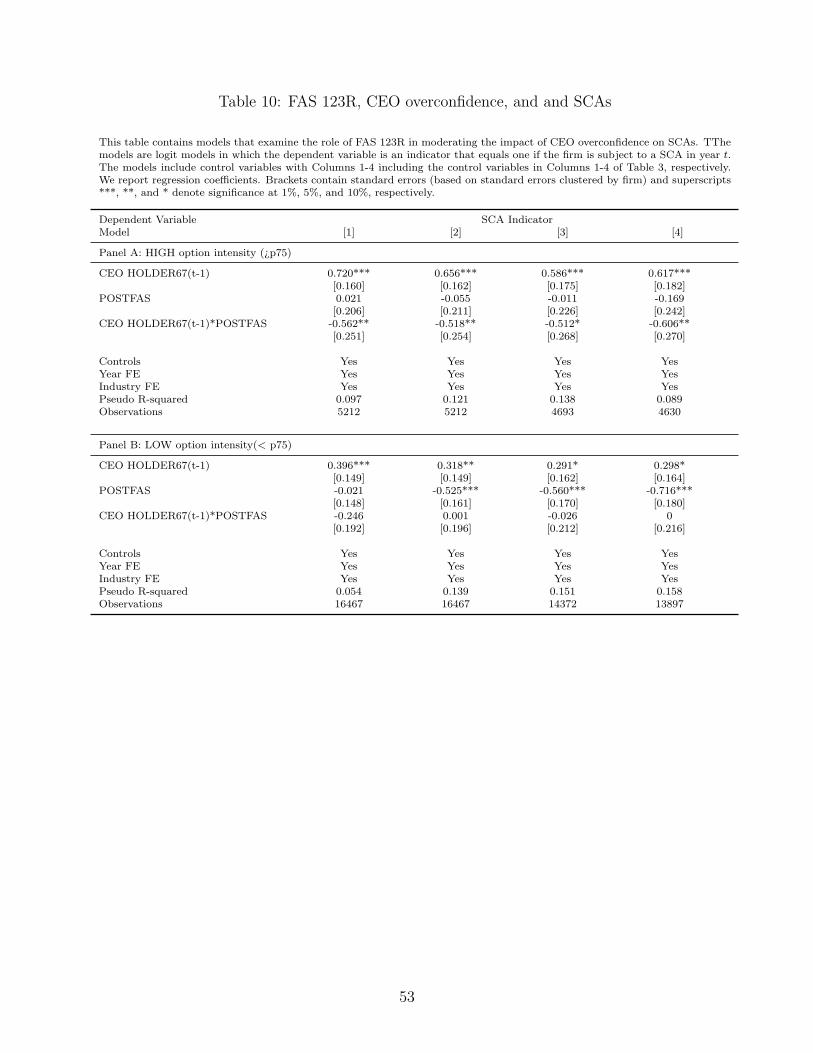
Table 10: FAS 123R, CEO overconfidence, and and SCAs
This table contains models that examine the role of FAS 123R in moderating the impact of CEO overconfidence on SCAs. TThemodels are logit models in which the dependent variable is an indicator that equals one if the firm is subject to a SCA in year t.The models include control variables with Columns 1-4 including the control variables in Columns 1-4 of Table 3, respectively.We report regression coefficients. Brackets contain standard errors (based on standard errors clustered by firm) and superscripts***, **, and * denote significance at 1%, 5%, and 10%, respectively.
Dependent Variable SCA IndicatorModel [1] [2] [3] [4]
Panel A: HIGH option intensity (¿p75)
CEO HOLDER67(t-1) 0.720*** 0.656*** 0.586*** 0.617***[0.160] [0.162] [0.175] [0.182]
POSTFAS 0.021 -0.055 -0.011 -0.169[0.206] [0.211] [0.226] [0.242]
CEO HOLDER67(t-1)*POSTFAS -0.562** -0.518** -0.512* -0.606**[0.251] [0.254] [0.268] [0.270]
Controls Yes Yes Yes YesYear FE Yes Yes Yes YesIndustry FE Yes Yes Yes YesPseudo R-squared 0.097 0.121 0.138 0.089Observations 5212 5212 4693 4630
Panel B: LOW option intensity(< p75)
CEO HOLDER67(t-1) 0.396*** 0.318** 0.291* 0.298*[0.149] [0.149] [0.162] [0.164]
POSTFAS -0.021 -0.525*** -0.560*** -0.716***[0.148] [0.161] [0.170] [0.180]
CEO HOLDER67(t-1)*POSTFAS -0.246 0.001 -0.026 0[0.192] [0.196] [0.212] [0.216]
Controls Yes Yes Yes YesYear FE Yes Yes Yes YesIndustry FE Yes Yes Yes YesPseudo R-squared 0.054 0.139 0.151 0.158Observations 16467 16467 14372 13897
53

Table 11: CEO overconfidence, SCAs, and CEO turnover
The models are logit models in which the dependent variable is an indicator that equals one if the CEO in year t + 1 or t + 2 differs from that inyear t. We report regression coefficients. Brackets contain standard errors (based on standard errors clustered by firm) and superscripts ***, **,and * denote significance at 1%, 5%, and 10%, respectively.
Dependent Variable CEO turnover in year, t + 1 or t + 2Model [1] [2] [3] [4] [5] [6] [7] [8]
CEO HOLDER67(t-1) -0.287*** -0.196*** -0.181** -0.161** -0.277*** -0.197** -0.153* -0.128[0.069] [0.072] [0.077] [0.078] [0.079] [0.083] [0.087] [0.087]
SUED(t) -0.651** -0.665** -0.565* -0.490* -0.654** -0.665** -0.574* -0.52[0.273] [0.284] [0.294] [0.292] [0.303] [0.317] [0.323] [0.322]
CEO HOLDER67(t-1)*SUED(t) 0.938*** 0.919*** 0.798** 0.714** 0.837** 0.822** 0.771* 0.693*[0.341] [0.347] [0.360] [0.360] [0.384] [0.390] [0.399] [0.401]
GINDEX(t-1) 0.030** 0.013 0.016 0.015[0.015] [0.016] [0.017] [0.017]
NYSE(t-1) -0.112 -0.091 -0.072 -0.052[0.097] [0.097] [0.113] [0.113]
LNASSET(t-1) 0.054** 0.078*** 0.073** 0.058* 0.075** 0.072**[0.025] [0.029] [0.029] [0.030] [0.034] [0.034]
ROA(t-1) -0.432* -0.337 -0.529 -0.438[0.246] [0.242] [0.346] [0.334]
SALES GROWTH(t-1) -0.362** -0.303* -0.290* -0.352** -0.3 -0.289[0.143] [0.162] [0.160] [0.164] [0.186] [0.185]
R&D(t-1) -0.145 -0.108 0.089 0.085[0.753] [0.753] [1.007] [1.003]
PP&E(t-1) -0.043 0.034[0.275] [0.320]
MB(t-1) 0.003 0.002 -0.003 -0.004[0.010] [0.010] [0.012] [0.012]
RETURN(t-1) -1.037 -0.873 -0.749 -1.513 -1.454 -1.202[0.794] [0.867] [0.859] [0.980] [1.062] [1.049]
SKEW(t-1) 0.012 0.001 0.005 -0.009 -0.02 -0.013[0.043] [0.047] [0.048] [0.050] [0.054] [0.055]
RETURN STD DEV(t-1) 0.746 0.547 0.226 0.292 0.32 0.05[0.486] [0.550] [0.608] [0.658] [0.725] [0.795]
TURNOVER(t-1) -0.031 -0.029 -0.024 -0.046 -0.052 -0.041[0.028] [0.030] [0.029] [0.035] [0.038] [0.037]
INST(t-1) -0.515*** -0.495**[0.154] [0.215]
EQUITY PROCCEEDS(t-1) 0.205 0.227 0.612 0.618[0.509] [0.502] [0.819] [0.809]
DEBT PROCCEEDS(t-1) -0.042 0.002 -0.265 -0.221[0.204] [0.201] [0.250] [0.247]
INSIDER TRADING(t-1) -0.109 -0.067 -0.202 -0.18[0.379] [0.369] [0.469] [0.456]
INSIDER HOLDING(t-1) -0.363 -0.467 0.216 0.134[0.853] [0.872] [0.957] [0.968]
CEO SHARE OWNED(t-1) -8.396*** -9.135*** -9.261*** -7.272*** -7.827*** -7.957***[1.543] [1.639] [1.650] [1.807] [1.827] [1.835]
IND WC(t-1) 0.003 -0.013[0.024] [0.027]
IND ALTMAN Z(t-1) 0 0.001[0.001] [0.001]
Year FE Yes Yes Yes Yes Yes Yes Yes YesIndustry FE Yes Yes Yes Yes Yes Yes Yes YesPseudo R-squared 0.059 0.072 0.077 0.078 0.059 0.069 0.073 0.073Observations 18473 17909 15676 15287 13922 13500 12089 11840
54

Table 12: Post SCA turnover for internally versus externally appointed CEOs
This table contains regressions that examine the likelihood that the CEO is replaced following a SCA. The models are logit models in whichthe dependent variable is an indicator that equals one if the CEO in year t + 1 or t + 2 differs from that in year t. Columns 1,2,5,6 focus onthe sub-sample of CEOs (in year t) who were internally appointed to determine whether an internally appointed CEO is likely to be removed inyears t + 1 or t + 2. Columns 3,4,7,8 do similarly but for CEOs who were externally appointed. We report regression coefficients. Brackets con-tain standard errors (based on standard errors clustered by firm) and superscripts ***, **, and * denote significance at 1%, 5%, and 10%, respectively.
Dependent Variable CEO turnover in year t + 1, t + 2Internal CEO External CEO Internal CEO External CEO
VARIABLES [1] [2] [3] [4] [5] [6] [7] [8]
A: CEO HOLDER67(t-1) -0.240** -0.218** -0.108 -0.074 -0.196* -0.17 -0.13 -0.092[0.097] [0.098] [0.139] [0.140] [0.111] [0.111] [0.152] [0.154]
B: SUED(t) -0.455 -0.393 -0.771 -0.668 -0.576 -0.547 -0.622 -0.529[0.340] [0.340] [0.595] [0.592] [0.383] [0.385] [0.588] [0.584]
A*B 0.328 0.299 1.568** 1.416** 0.187 0.189 1.403** 1.247*[0.411] [0.412] [0.672] [0.672] [0.481] [0.484] [0.664] [0.662]
NYSE(t-1) -0.095 -0.079 -0.192 -0.162 -0.058 -0.041 -0.126 -0.106[0.115] [0.116] [0.179] [0.176] [0.137] [0.138] [0.203] [0.203]
LNASSET(t-1) 0.071** 0.065* 0.082 0.079 0.090** 0.086** 0.059 0.059[0.036] [0.036] [0.051] [0.050] [0.043] [0.043] [0.057] [0.057]
ROA(t-1) -0.556** -0.452* 0.144 0.151 -0.798** -0.666** 0.382 0.377[0.243] [0.239] [0.637] [0.634] [0.339] [0.331] [0.745] [0.746]
SALES GROWTH(t-1) -0.114 -0.085 -0.763*** -0.779*** -0.165 -0.132 -0.607** -0.620**[0.205] [0.203] [0.285] [0.281] [0.250] [0.248] [0.281] [0.280]
R&D(t-1) 0.148 0.222 -0.021 -0.066 0.447 0.498 -0.063 -0.038[0.862] [0.859] [1.560] [1.594] [1.161] [1.141] [1.910] [1.954]
PP&E(t-1) -0.128 0.033 -0.061 0.12[0.347] [0.471] [0.410] [0.526]
MB(t-1) 0.002 0.001 0.004 0.002 -0.002 -0.003 -0.004 -0.005[0.012] [0.012] [0.018] [0.018] [0.015] [0.015] [0.021] [0.021]
RETURN(t-1) 0.39 0.448 -4.521*** -4.208** -0.018 0.221 -4.918*** -4.516**[1.059] [1.048] [1.654] [1.649] [1.342] [1.317] [1.853] [1.850]
SKEW(t-1) 0.04 0.039 -0.07 -0.062 0.029 0.032 -0.102 -0.092[0.050] [0.050] [0.093] [0.096] [0.058] [0.058] [0.099] [0.102]
RETURN STD DEV(t-1) 0.411 0.08 0.44 0.18 0.429 0.14 -0.603 -0.756[0.599] [0.680] [1.397] [1.407] [0.727] [0.837] [1.657] [1.680]
TURNOVER(t-1) -0.005 -0.003 -0.121* -0.116* -0.048 -0.04 -0.047 -0.042[0.029] [0.029] [0.065] [0.065] [0.042] [0.041] [0.071] [0.073]
INST(t-1) -0.576*** -0.382 -0.654** -0.262[0.192] [0.254] [0.280] [0.282]
EQUITY PROCCEEDS(t-1) -0.03 -0.039 1.206 1.328 0.151 0.099 2.067 2.15[0.581] [0.570] [1.127] [1.133] [1.024] [1.003] [1.481] [1.488]
DEBT PROCCEEDS(t-1) -0.103 -0.08 0.205 0.242 -0.464 -0.441 0.225 0.251[0.247] [0.242] [0.375] [0.374] [0.312] [0.308] [0.437] [0.434]
INSIDER TRADING(t-1) -0.116 -0.094 0.108 0.22 -0.251 -0.273 0.208 0.298[0.446] [0.436] [0.528] [0.516] [0.580] [0.565] [0.801] [0.762]
INSIDER HOLDING(t-1) -0.174 -0.212 -1.165 -1.318 0.647 0.594 -0.313 -0.33[0.975] [0.950] [1.608] [1.839] [1.125] [1.069] [1.575] [1.787]
CEO SHARE OWNED (t-1) -8.448*** -8.766*** -12.948*** -12.840*** -7.654*** -7.965*** -10.206** -10.093**[1.823] [1.835] [4.015] [3.970] [2.151] [2.148] [4.038] [3.985]
IND WC(t-1) -0.027 0.099* -0.051* 0.082[0.027] [0.059] [0.030] [0.061]
IND ALTMAN Z(t-1) 0.001 -0.003 0.003* -0.004[0.001] [0.002] [0.002] [0.003]
GINDEX(t-1) 0.009 0.006 0.033 0.036[0.021] [0.021] [0.030] [0.030]
Industry and year FE Yes Yes Yes Yes Yes Yes Yes YesPseudo R-squared 0.077 0.078 0.073 0.075 0.077 0.079 0.07 0.071Observations 10423 10155 4446 4386 7714 7561 3777 3728
55

Table 13: Post SCA turnover for CEOs at high GINDEX and low GINDEX companies
This table contains regressions that examine the likelihood that the CEO is replaced following a SCA. The models arelogit models in which the dependent variable is an indicator that equals one if the CEO in year t + 1 or t + 2, differsfrom that in year t. Each of Columns 1-4 contains the control variables from Columns 1-4 of Table 11, respectively.The models also include industry and year fixed effects. We report regression coefficients. Brackets contain standard errors(based on standard errors clustered by firm) and superscripts ***, **, and * denote significance at 1%, 5%, and 10%, respectively.
Dependent Variable CEO Turnover in Year t+ 1, t+ 2
VARIABLES [1] [2] [3] [4]
Sample Low GINDEX (GINDEX ≤ 10)
CEO HOLDER67(t-1) -0.310*** -0.218** -0.205* -0.188*[0.097] [0.103] [0.108] [0.109]
SUED(t) -0.849** -0.851** -0.850** -0.790**[0.371] [0.394] [0.399] [0.396]
CEO HOLDER67(t-1)*SUED(t) 0.854* 0.827* 0.831* 0.803*[0.475] [0.487] [0.495] [0.482]
Controls, industry and year FE Yes Yes Yes YesPseudo R-squared 0.04 0.055 0.061 0.059Observations 8486 8255 7365 7130
Sample High GINDEX (GINDEX > 10)
CEO HOLDER67(t-1) -0.172 -0.124 -0.039 -0.006[0.133] [0.139] [0.148] [0.149]
SUED(t) -0.252 -0.277 -0.125 -0.085[0.549] [0.563] [0.601] [0.609]
CEO HOLDER67(t-1)*SUED(t) 0.855 0.889 0.78 0.64[0.671] [0.668] [0.705] [0.731]
Controls, industry and year FE Yes Yes Yes YesPseudo R-squared 0.07 0.078 0.08 0.083Observations 4502 4321 3871 3840
56

Table 14: Media-based measures of overconfidence
This table contains regressions that examine the likelihood of a SCA using media-based measures of CEO overconfidence. Themodels are logit models in which the dependent variable is an indicator that equals one if the firm is subject to a SCA in year t.We report regression coefficients. Brackets contain standard errors (based on standard errors clustered by firm) and superscripts***, **, and * denote significance at 1%, 5%, and 10%, respectively.
Dependent Variable SCA Indicator[1] [2] [3]
NETNEWS(t-1) 0.135*** 0.109*** 0.107***[0.035] [0.038] [0.038]
NYSE(t-1) 0.222 0.233[0.193] [0.191]
LNASSET(t-1) 0.361*** 0.346*** 0.348***[0.061] [0.064] [0.064]
ROA(t-1) 1.458* 1.14[0.765] [0.761]
SALES GROWTH(t-1) 1.393*** 1.598*** 1.540***[0.435] [0.488] [0.485]
R&D(t-1) 4.007** 3.719*[1.915] [1.975]
PP&E(t-1) -0.855[0.696]
MB(t-1) 0.049*** 0.050***[0.015] [0.015]
RETURN(t-1) -12.678*** -14.905*** -14.274***[2.017] [2.232] [2.235]
SKEW(t-1) -0.121 -0.107 -0.114[0.089] [0.095] [0.096]
RETURN STD DEV(t-1) 1.354 0.882 1.006[1.672] [1.733] [1.728]
TURNOVER(t-1) 0.156*** 0.139*** 0.128***[0.034] [0.034] [0.034]
INST(t-1) 0.239**[0.103]
EQUITY PROCCEEDS(t-1) 0.952 0.606[1.073] [1.098]
DEBT PROCCEEDS(t-1) 0.068 0.083[0.398] [0.394]
INSIDER TRADING(t-1) 0.552 0.606[0.594] [0.591]
INSIDER HOLDING(t-1) -2.589 -2.494[2.966] [2.843]
IND WC(t-1) -0.043[0.049]
IND ALTMAN Z(t-1) 0.003[0.003]
INTERCEPT -18.913*** -19.756*** -19.774***[0.923] [0.990] [1.124]
Industry and year FE Yes Yes YesPseudo R-squared 0.148 0.16 0.161Observations 3345 3078 2986
57
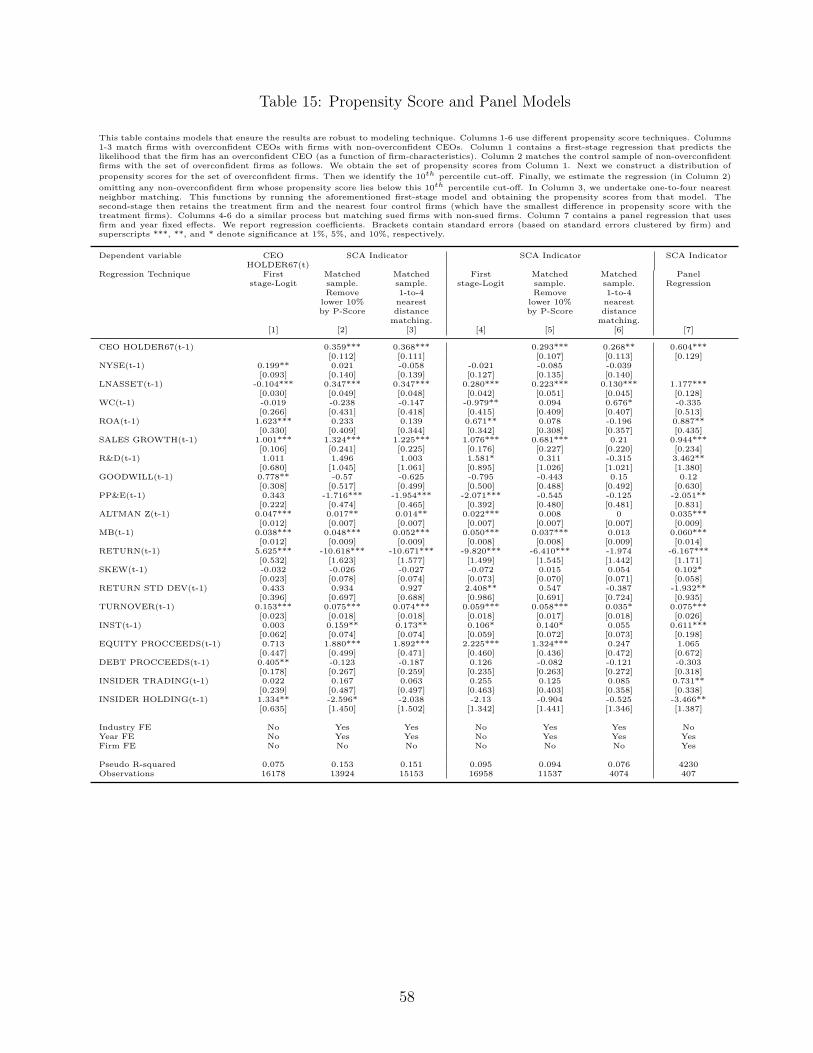
Table 15: Propensity Score and Panel Models
This table contains models that ensure the results are robust to modeling technique. Columns 1-6 use different propensity score techniques. Columns1-3 match firms with overconfident CEOs with firms with non-overconfident CEOs. Column 1 contains a first-stage regression that predicts thelikelihood that the firm has an overconfident CEO (as a function of firm-characteristics). Column 2 matches the control sample of non-overconfidentfirms with the set of overconfident firms as follows. We obtain the set of propensity scores from Column 1. Next we construct a distribution of
propensity scores for the set of overconfident firms. Then we identify the 10th percentile cut-off. Finally, we estimate the regression (in Column 2)
omitting any non-overconfident firm whose propensity score lies below this 10th percentile cut-off. In Column 3, we undertake one-to-four nearestneighbor matching. This functions by running the aforementioned first-stage model and obtaining the propensity scores from that model. Thesecond-stage then retains the treatment firm and the nearest four control firms (which have the smallest difference in propensity score with thetreatment firms). Columns 4-6 do a similar process but matching sued firms with non-sued firms. Column 7 contains a panel regression that usesfirm and year fixed effects. We report regression coefficients. Brackets contain standard errors (based on standard errors clustered by firm) andsuperscripts ***, **, and * denote significance at 1%, 5%, and 10%, respectively.
Dependent variable CEOHOLDER67(t)
SCA Indicator SCA Indicator SCA Indicator
Regression Technique Firststage-Logit
Matchedsample.Remove
lower 10%by P-Score
Matchedsample.1-to-4nearestdistancematching.
Firststage-Logit
Matchedsample.Remove
lower 10%by P-Score
Matchedsample.1-to-4nearestdistancematching.
PanelRegression
[1] [2] [3] [4] [5] [6] [7]
CEO HOLDER67(t-1) 0.359*** 0.368*** 0.293*** 0.268** 0.604***[0.112] [0.111] [0.107] [0.113] [0.129]
NYSE(t-1) 0.199** 0.021 -0.058 -0.021 -0.085 -0.039[0.093] [0.140] [0.139] [0.127] [0.135] [0.140]
LNASSET(t-1) -0.104*** 0.347*** 0.347*** 0.280*** 0.223*** 0.130*** 1.177***[0.030] [0.049] [0.048] [0.042] [0.051] [0.045] [0.128]
WC(t-1) -0.019 -0.238 -0.147 -0.979** 0.094 0.676* -0.335[0.266] [0.431] [0.418] [0.415] [0.409] [0.407] [0.513]
ROA(t-1) 1.623*** 0.233 0.139 0.671** 0.078 -0.196 0.887**[0.330] [0.409] [0.344] [0.342] [0.308] [0.357] [0.435]
SALES GROWTH(t-1) 1.001*** 1.324*** 1.225*** 1.076*** 0.681*** 0.21 0.944***[0.106] [0.241] [0.225] [0.176] [0.227] [0.220] [0.234]
R&D(t-1) 1.011 1.496 1.003 1.581* 0.311 -0.315 3.462**[0.680] [1.045] [1.061] [0.895] [1.026] [1.021] [1.380]
GOODWILL(t-1) 0.778** -0.57 -0.625 -0.795 -0.443 0.15 0.12[0.308] [0.517] [0.499] [0.500] [0.488] [0.492] [0.630]
PP&E(t-1) 0.343 -1.716*** -1.954*** -2.071*** -0.545 -0.125 -2.051**[0.222] [0.474] [0.465] [0.392] [0.480] [0.481] [0.831]
ALTMAN Z(t-1) 0.047*** 0.017** 0.014** 0.022*** 0.008 0 0.035***[0.012] [0.007] [0.007] [0.007] [0.007] [0.007] [0.009]
MB(t-1) 0.038*** 0.048*** 0.052*** 0.050*** 0.037*** 0.013 0.060***[0.012] [0.009] [0.009] [0.008] [0.008] [0.009] [0.014]
RETURN(t-1) 5.625*** -10.618*** -10.671*** -9.820*** -6.410*** -1.974 -6.167***[0.532] [1.623] [1.577] [1.499] [1.545] [1.442] [1.171]
SKEW(t-1) -0.032 -0.026 -0.027 -0.072 0.015 0.054 0.102*[0.023] [0.078] [0.074] [0.073] [0.070] [0.071] [0.058]
RETURN STD DEV(t-1) 0.433 0.934 0.927 2.408** 0.547 -0.387 -1.932**[0.396] [0.697] [0.688] [0.986] [0.691] [0.724] [0.935]
TURNOVER(t-1) 0.153*** 0.075*** 0.074*** 0.059*** 0.058*** 0.035* 0.075***[0.023] [0.018] [0.018] [0.018] [0.017] [0.018] [0.026]
INST(t-1) 0.003 0.159** 0.173** 0.106* 0.140* 0.055 0.611***[0.062] [0.074] [0.074] [0.059] [0.072] [0.073] [0.198]
EQUITY PROCCEEDS(t-1) 0.713 1.880*** 1.892*** 2.225*** 1.324*** 0.247 1.065[0.447] [0.499] [0.471] [0.460] [0.436] [0.472] [0.672]
DEBT PROCCEEDS(t-1) 0.405** -0.123 -0.187 0.126 -0.082 -0.121 -0.303[0.178] [0.267] [0.259] [0.235] [0.263] [0.272] [0.318]
INSIDER TRADING(t-1) 0.022 0.167 0.063 0.255 0.125 0.085 0.731**[0.239] [0.487] [0.497] [0.463] [0.403] [0.358] [0.338]
INSIDER HOLDING(t-1) 1.334** -2.596* -2.038 -2.13 -0.904 -0.525 -3.466**[0.635] [1.450] [1.502] [1.342] [1.441] [1.346] [1.387]
Industry FE No Yes Yes No Yes Yes NoYear FE No Yes Yes No Yes Yes YesFirm FE No No No No No No Yes
Pseudo R-squared 0.075 0.153 0.151 0.095 0.094 0.076 4230Observations 16178 13924 15153 16958 11537 4074 407
58

Table 16: Team overconfidence and SCAs: Execuitives ranked by salary
The models are logit models in which the dependent variable is an indicator that equals one if the firm is subject to a SCAin year t. The models include control variables with Columns 1-4 including the control variables in Columns 1-4 of Table 3,respectively. We report regression coefficients. Brackets contain standard errors (based on standard errors clustered by firm) andsuperscripts ***, **, and * denote significance at 1%, 5%, and 10%, respectively.
Dependent Variable SCA Indicator
Model [1] [2] [3] [4]
Panel A
Top4 EXEC HOLDER67(t-1) 0.573*** 0.373** 0.349** 0.369**[0.154] [0.152] [0.163] [0.164]
Controls Yes Yes Yes YesIndustry Fixed Effects Yes Yes Yes YesYear Fixed Effects Yes Yes Yes YesPseudo R-squared 0.074 0.131 0.135 0.14Observations 22264 22264 19579 19034
Panel B
Non-Top4 EXEC HOLDER67(t-1) 0.493*** 0.238** 0.205 0.167[0.122] [0.121] [0.126] [0.126]
Controls Yes Yes Yes YesIndustry Fixed Effects Yes Yes Yes YesYear Fixed Effects Yes Yes Yes YesPseudo R-squared 0.072 0.129 0.135 0.142Observations 18651 18651 16470 16062
Panel C
Top4 EXEC HOLDER67(t-1) 0.380** 0.331* 0.357* 0.415**[0.193] [0.197] [0.210] [0.206]
Non-Top4 EXEC HOLDER67(t-1) 0.311** 0.077 0.039 -0.02[0.146] [0.150] [0.153] [0.149]
Controls Yes Yes Yes YesIndustry Fixed Effects Yes Yes Yes YesYear Fixed Effects Yes Yes Yes YesPseudo R-squared 0.074 0.129 0.136 0.143Observations 18649 18649 16469 16061
59

Table 17: Kolasinski and Li (2013) type measures of overconfidence
This table contains regressions that examine the likelihood of a SCA using Kolasinski and Li (2013) measures of CEOoverconfidence. The models are logit models in which the dependent variable is an indicator that equals one if the firm is subjectto a SCA in year t. We report regression coefficients. Brackets contain standard errors (based on standard errors clustered byfirm) and superscripts ***, **, and * denote significance at 1%, 5%, and 10%, respectively.
Dependent Variable SCA Indicator[1] [2] [3] [4]
CEO stock purchase performance (t-1) -0.615*** -0.560*** -0.544*** -0.527***[0.092] [0.100] [0.108] [0.105]
NYSE(t-1) -0.288 -0.293[0.219] [0.212]
LNASSET(t-1) 0.392*** 0.475*** 0.440***[0.055] [0.058] [0.061]
ROA(t-1) -0.17 -0.212[0.406] [0.392]
SALES GROWTH(t-1) 0.789** 0.866** 0.851**[0.354] [0.343] [0.332]
R&D(t-1) 1.751 1.619[1.196] [1.189]
PP&E(t-1) -0.69[0.579]
MB(t-1) 0.012 0.011[0.014] [0.014]
RETURN(t-1) 2.734* 2.423 2.415[1.616] [1.997] [2.042]
SKEW(t-1) -0.12 -0.092 -0.062[0.087] [0.093] [0.096]
RETURN STD DEV(t-1) 2.367*** 2.153*** 2.087***[0.827] [0.738] [0.708]
TURNOVER(t-1) 0.061 0.03 0.027[0.109] [0.052] [0.029]
INST(t-1) 0.714**[0.310]
EQUITY PROCCEEDS(t-1) 0.514 0.594[0.628] [0.601]
DEBT PROCCEEDS(t-1) -0.017 0.151[0.353] [0.335]
INSIDER TRADING(t-1) 0.913** 0.904**[0.419] [0.409]
INSIDER HOLDING(t-1) -2.432* -1.887[1.456] [1.341]
IND WC(t-1) 0.054[0.046]
IND ALTMAN Z(t-1) -0.003[0.002]
Year FE Yes Yes Yes YesIndustry FE Yes Yes Yes YesPseudo R-squared 0.0736 0.132 0.149 0.158Observations 9395 9395 8753 8244
60
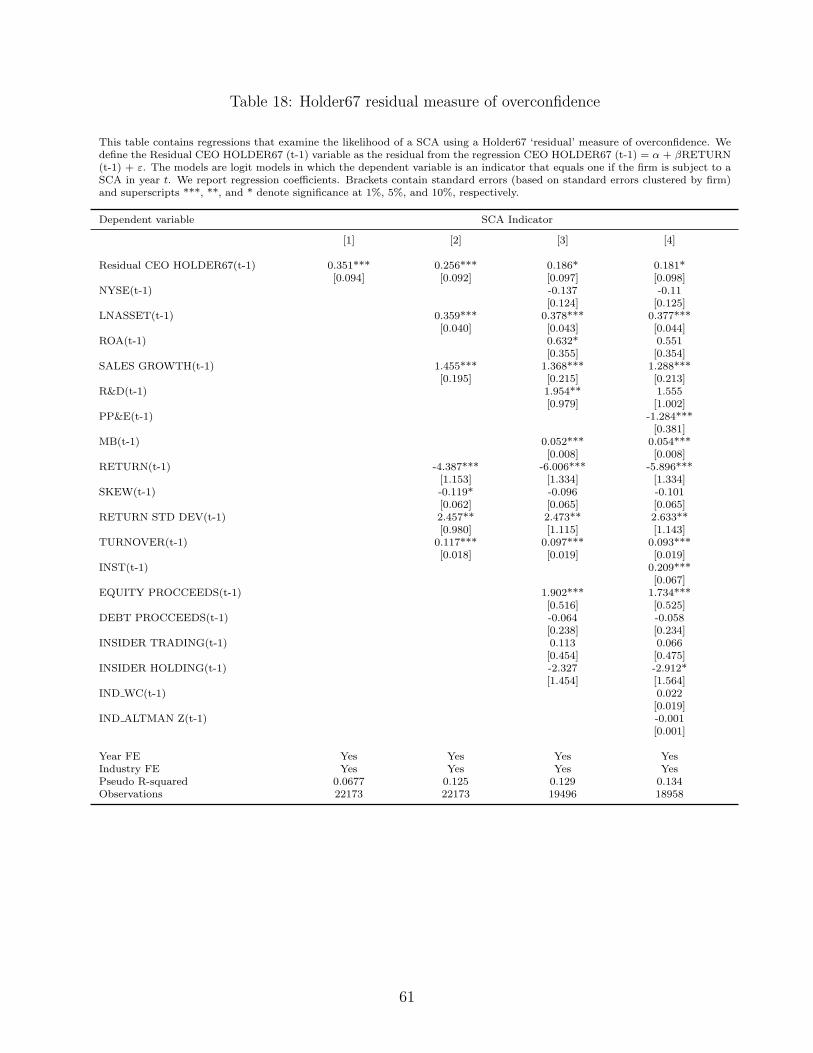
Table 18: Holder67 residual measure of overconfidence
This table contains regressions that examine the likelihood of a SCA using a Holder67 ‘residual’ measure of overconfidence. Wedefine the Residual CEO HOLDER67 (t-1) variable as the residual from the regression CEO HOLDER67 (t-1) = α + βRETURN(t-1) + ε. The models are logit models in which the dependent variable is an indicator that equals one if the firm is subject to aSCA in year t. We report regression coefficients. Brackets contain standard errors (based on standard errors clustered by firm)and superscripts ***, **, and * denote significance at 1%, 5%, and 10%, respectively.
Dependent variable SCA Indicator
[1] [2] [3] [4]
Residual CEO HOLDER67(t-1) 0.351*** 0.256*** 0.186* 0.181*[0.094] [0.092] [0.097] [0.098]
NYSE(t-1) -0.137 -0.11[0.124] [0.125]
LNASSET(t-1) 0.359*** 0.378*** 0.377***[0.040] [0.043] [0.044]
ROA(t-1) 0.632* 0.551[0.355] [0.354]
SALES GROWTH(t-1) 1.455*** 1.368*** 1.288***[0.195] [0.215] [0.213]
R&D(t-1) 1.954** 1.555[0.979] [1.002]
PP&E(t-1) -1.284***[0.381]
MB(t-1) 0.052*** 0.054***[0.008] [0.008]
RETURN(t-1) -4.387*** -6.006*** -5.896***[1.153] [1.334] [1.334]
SKEW(t-1) -0.119* -0.096 -0.101[0.062] [0.065] [0.065]
RETURN STD DEV(t-1) 2.457** 2.473** 2.633**[0.980] [1.115] [1.143]
TURNOVER(t-1) 0.117*** 0.097*** 0.093***[0.018] [0.019] [0.019]
INST(t-1) 0.209***[0.067]
EQUITY PROCCEEDS(t-1) 1.902*** 1.734***[0.516] [0.525]
DEBT PROCCEEDS(t-1) -0.064 -0.058[0.238] [0.234]
INSIDER TRADING(t-1) 0.113 0.066[0.454] [0.475]
INSIDER HOLDING(t-1) -2.327 -2.912*[1.454] [1.564]
IND WC(t-1) 0.022[0.019]
IND ALTMAN Z(t-1) -0.001[0.001]
Year FE Yes Yes Yes YesIndustry FE Yes Yes Yes YesPseudo R-squared 0.0677 0.125 0.129 0.134Observations 22173 22173 19496 18958
61

Table 19: Robustness to removing repeatedly sued firms
This table contains models that use the specification in Kim and Skinner (2012, Table 7) and that omit firms that are suedmore than once during the sample period. The models are logit models in which the dependent variable is an indicatorthat equals one if the firm is subject to a SCA in year t. We report regression coefficients. Brackets contain standard errors(based on standard errors clustered by firm) and superscripts ***, **, and * denote significance at 1%, 5%, and 10%, respectively.
Dependent Variable SCA IndicatorModel [1] [2] [3] [4]
CEO HOLDER67(t-1) 0.409*** 0.373*** 0.297*** 0.286***[0.098] [0.099] [0.103] [0.104]
NYSE(t-1) -0.097 -0.053[0.124] [0.125]
LNASSET(t-1) 0.315*** 0.330*** 0.332***[0.037] [0.039] [0.040]
ROA(t-1) 0.784** 0.690**[0.337] [0.335]
SALES GROWTH(t-1) 1.428*** 1.363*** 1.303***[0.195] [0.215] [0.215]
R&D(t-1) 1.791* 1.435[1.000] [1.025]
PP&E(t-1) -1.323***[0.394]
MB(t-1) 0.056*** 0.058***[0.008] [0.008]
RETURN(t-1) -8.495*** -10.947*** -10.895***[1.227] [1.430] [1.433]
SKEW(t-1) -0.036 -0.007 0[0.064] [0.067] [0.068]
RETURN STD DEV(t-1) 1.705** 1.473* 1.541*[0.861] [0.843] [0.862]
TURNOVER(t-1) 0.120*** 0.094*** 0.090***[0.016] [0.016] [0.017]
INST(t-1) 0.199***[0.069]
EQUITY PROCCEEDS(t-1) 2.380*** 2.257***[0.461] [0.464]
DEBT PROCCEEDS(t-1) -0.068 -0.105[0.251] [0.251]
INSIDER TRADING(t-1) 0.225 0.187[0.436] [0.454]
INSIDER HOLDING(t-1) -1.974 -2.455*[1.256] [1.340]
IND WC(t-1) 0.015[0.019]
IND ALTMAN Z(t-1) -0.001[0.001]
INTERCEPT -4.719*** -7.922*** -7.993*** -8.293***[0.891] [0.692] [0.670] [0.664]
Industry and year FE Yes Yes Yes YesPseudo R-squared 0.062 0.119 0.127 0.133Observations 22191 22191 19490 18954
62

Table 20: CEO overconfidence and successful SCAs
This table contains models that use the specification in Kim and Skinner (2012, Table 7) to test the relationship betweenCEO overconfidence and the likelihood of a successful SCA. The models are logit models in which the dependent variable is anindicator that equals one if the firm is subject to a SCA in year t and that law suit subsequently goes in favor of the plaintiff.We report regression coefficients. Brackets contain standard errors (based on standard errors clustered by firm) and superscripts***, **, and * denote significance at 1%, 5%, and 10%, respectively.
Dependent Variable Successful SCA IndicatorModel [1] [2] [3] [4]
CEO HOLDER67(t-1) 0.492*** 0.421*** 0.326** 0.299**[0.141] [0.145] [0.150] [0.152]
NYSE(t-1) -0.118 -0.071[0.207] [0.205]
LNASSET(t-1) 0.201*** 0.204*** 0.190***[0.059] [0.064] [0.066]
ROA(t-1) 0.019 -0.051[0.454] [0.445]
SALES GROWTH(t-1) 1.153*** 1.184*** 1.130***[0.264] [0.290] [0.288]
R&D(t-1) 0.657 0.291[1.436] [1.496]
PP&E(t-1) -1.502***[0.577]
MB(t-1) 0.046*** 0.048***[0.011] [0.011]
RETURN(t-1) -5.049*** -6.106*** -6.100***[1.528] [1.748] [1.752]
SKEW(t-1) -0.230** -0.189* -0.210*[0.107] [0.114] [0.116]
RETURN STD DEV(t-1) 0.469 0.129 -0.093[1.411] [1.593] [1.762]
TURNOVER(t-1) 0.090*** 0.056** 0.048*[0.022] [0.026] [0.029]
INST(t-1) 0.185*[0.102]
EQUITY PROCCEEDS(t-1) 1.843*** 1.752***[0.588] [0.589]
DEBT PROCCEEDS(t-1) -0.283 -0.273[0.350] [0.340]
INSIDER TRADING(t-1) 0.782* 0.796*[0.466] [0.483]
INSIDER HOLDING(t-1) -3.095 -4.265*[1.931] [2.339]
IND WC(t-1) 0.001[0.029]
IND ALTMAN Z(t-1) -0.002[0.001]
Year FE Yes Yes Yes YesIndustry FE Yes Yes Yes YesPseudo R-squared 0.0629 0.0912 0.0899 0.0967Observations 19479 19479 17075 16588
63