executive summary -...
TRANSCRIPT

July 2016
Economic value of Victoria's chicken meat industryFinal Report
Department of Economic Development, Jobs, Transport and Resources

This report has been prepared by:
RMCG135 Mollison Street, BENDIGO VIC 3550
PO Box 2410, BENDIGO DC VIC 3554
P: (03) 5441 4821E: [email protected]
W: www.rmcg.com.auABN: 35 154 629 943
Offices in Bendigo, Melbourne, Torquay, Warragul and Penguin (Tasmania)
Project Contact
Will HendersonM: 0420 588 940E: [email protected]
Document review and authorisationJob Number: 69-D-05
Doc. Version Final/Draft Date Author Reviewed by Quality check Release approved by Issued to
1.0 Draft 22 March 2016S. Fargher
W. Henderson
J. Morison
C. ThompsonP. Mawson C. Thompson K. Noonan
2.0 Final 09 June 2016S. Fargher
W. HendersonJ. Morison W. Henderson W. Henderson K. Noonan
2.1 Final 20 June 2016 W. Henderson NA NA W. Henderson K.Noonan
2.2 Final 26 JulyW. Henderson
J. MorisonNA NA W. Henderson K. Noonan
/tt/file_convert/5a7362f07f8b9ab6538e73ef/document.docx

Contents
Abbreviations 1
Executive summary 2
1 Introduction 51.1 This project.......................................................................................51.2 Scope...............................................................................................51.3 This report........................................................................................6
2 The chicken meat industry in Victoria 72.1 Global and national context..............................................................72.2 Victoria.............................................................................................8
3 Method 113.1 Overview of the method.................................................................113.2 Data collection................................................................................11
3.2.1 Primary production 113.2.2 Processing 11
3.3 Economic modelling.......................................................................123.4 Overview of economic concepts.....................................................12
3.4.1 Economic activity 123.4.2 Indicators of Economic activity 123.4.3 Categories of economic activity in the chicken meat supply
chain 133.5 Assumptions...................................................................................15
3.5.1 Geography 153.5.2 Expenditure 153.5.3 Regional production 16
4 Regional economic impact 174.1 Gross regional product...................................................................174.2 Employment...................................................................................17
5 Victorian economic impact 195.1 Primary production sector..............................................................195.2 Processing sector...........................................................................205.3 Chicken meat industry as a whole..................................................21
Appendix 1: Producer’s survey
Appendix 2: Processor’s survey
RMCG Environment | Water | Agriculture | Policy | Economics | Communities

Abbreviations
ABARES Australian Bureau of Agricultural and Resource Economics and Sciences
ABS Australian Bureau of Statistics
DEDJTR Victorian Department of Economic Development, Jobs, Transport and Resources
DEPI Former Victorian Department of Environment and Primary Industries (now DEDJTR)
FTE Full-time equivalent
GRP Gross regional product
GSP Gross state product
I-O Input-output
RISE Regional Industry Structure and Employment
SA2 Statistical Area 2
SA4 Statistical Area 4
VCMC Victorian Chicken Meat Council
RMCG Environment | Water | Agriculture | Policy | Economics | Communities Page 1

Executive summary
Introduction
The Department of Economic Development, Jobs, Transport and Resources (DEDJTR) engaged RMCG and EconSearch to estimate the economic value of the chicken meat industry in Victoria. Analysing the industry and its linkages across an economy can assist policy makers to understand the economic significance to Victoria and regions and assist with decisions that influence the productivity and profitability of the industry.
The chicken meat industry in Victoria
The Victorian chicken meat industry is clustered around three locations: Geelong, Bendigo, and the Mornington Peninsula. There are three main business forms in the sector:
1. A small number of very large producers who are vertically integrated from production, to processing and wholesale. There are four large processors in Victoria: Baiada Poultry, Ingham Enterprises, Turi Foods, and Hazeldene’s.
2. A large number of small contract growers, who own and operate the majority of the meat chicken growing farms. They grow out the chickens for the major processing companies. The processing companies provide day-old-birds, feed and support services to the growers. There are around 200 contract growers across Victoria.
3. A value adding sector that purchases dressed birds for further processing – boning and other value adding activities.
Method
The estimates of regional economic impact presented in this report are based on a combination of data collection and economic modelling:
Data collection. We surveyed chicken meat farmers and processors to understand at a detailed level the expenditure and production patterns in the industry. This was scaled up to industry level with secondary data from the Australian Bureau of Statistics.
Economic modelling. EconSearch’s input-output model, RISE (Regional Industry Structure and Employment), was used to convert expenditure estimates into estimates of economic impact.
Economic activity in this report is described by the following indicators:
Gross regional product (GRP): is a measure of the contribution of an activity to the regional economy. The direct GRP of an industry is measured as value of gross output (business revenue) less the cost of goods and services (including imports) used in producing the output.
Gross state product (GSP): is the same concept as GRP, however, it is applied to the state economy (Victoria).
FTE: is an indicator of employment and measures a worker's involvement in a project or industry activity. An FTE of 1.0 means that the person is equivalent to a full-time worker (40 hours per week), while an FTE of 0.5 signals that the worker is only half-time, i.e. 20 hours per week.
RMCG Environment | Water | Agriculture | Policy | Economics | Communities Page 2

Regional economic impact of the chicken meat industry
In 2014/15, the total contribution to GRP was $297 million in the Mornington Peninsula, $246 million in Geelong, and $176 million in Bendigo. The total employment contribution was 2,641 FTE jobs in the Mornington Peninsula, 2,079 FTE jobs in Geelong and 1,692 FTE jobs in Bendigo.
Table 0-1: Regional economic impact of the chicken meat industry
Measure Bendigo Geelong Mornington Peninsula
GRP, total ($m) 176 246 297
Share of region (%) 1.4 1.2 1.0
Employment, total (fte) 1,692 2,079 2,641
Share of region (%) 1.8 1.4 1.2
Comparisons are made with four other agricultural industries and their associated processing sectors: grains, pigs, grape and wine production, and dairy, as well as the tourism industry.
Table 0-2: Total economic contributions for selected industries in regional Victoria
Chicken meat a,b Grains a,b Porka,b Wine a,b Dairy a,b Tourism b
GRP ($m)Bendigo 176 630 80 80 830 410
Geelong 246 180 30 50 90 670Mornington Peninsula
297 70 30 70 370 530
Employment (fte)Bendigo 1,692 4,100 600 1,200 6,700 3,200Geelong 2,079 1,300 200 400 800 5,000Mornington Peninsula
2,641 500 200 800 3,800 4,300
a For each agricultural industry the estimates include both farming and processing activity in the region.b For both GRP and employment the estimates represent the sum of direct industry effects and the effects created
in flow-on industries.
Victoria-wide economic impact of the chicken meat industry
Primary production
In 2014/15, the primary production sector was responsible for the direct employment of an estimated 1,202 FTE jobs, with flow-on activities creating further employment of around 912 FTE jobs in Victoria. This created a total employment contribution of 2,114 FTE jobs. A contribution to GSP of $211 million was generated in Victoria in 2014/15 by the primary production sector; $86 million by the primary production sector directly, and $126 million generated in other sectors in the Victorian economy.
RMCG Environment | Water | Agriculture | Policy | Economics | Communities Page 3
Processing
In 2014/15, the processing sector was responsible for the direct employment of an estimated 3,615 FTE jobs, with flow-on activities creating further employment of around 2,999 FTE jobs in Victoria (Table 5.2). This created an additional 6,613 FTE jobs.
A contribution to GSP of $724 million was generated in Victoria in 2014/15 by the processing sector, $338 million by the processing sector directly and $386 million generated in other sectors in the Victorian economy.
Total industry
The chicken meat industry as a whole represents the combination of the economic impact of the primary production sector and the processing sector. In 2014/15, the Victorian chicken meat industry was responsible for the direct employment of an estimated 4,817 FTE jobs, with flow-on activities creating further employment of an estimated 3,910 FTE jobs. This resulted in a total employment contribution of 8,727 FTE jobs by the chicken meat industry in Victoria.
The total chicken meat industry-related GSP in Victoria was an estimated $935 million: $423 million generated by the chicken meat industry directly and $512 million generated in other sectors of the Victorian economy.
Table 0-3: Victoria-wide economic impact of the chicken meat industry
GSP ($m) Employment (FTE)
Direct impact
Primary production 86 1,202
Processing 338 3,615
Total direct 423 4,817
Flow on impact 512 3,910
Total impact 935 8,727
Share of state (%) 0.27 0.36
RMCG Environment | Water | Agriculture | Policy | Economics | Communities Page 4

1 Introduction
The Victorian chicken meat industry generates employment and economic output in regional and rural communities across the state. This includes the direct activity generated through the production of chickens on-farm, the downstream processing of chickens, and the flow-on activity the chicken meat industry creates in sectors such as transport, retail/wholesale trade, and health and agricultural services.
1.1 This project
The Department of Economic Development, Jobs, Transport and Resources (DEDJTR) engaged RMCG and EconSearch to estimate the economic value of the chicken meat industry at both the regional and state levels. This assessment considers the direct and flow-on economic contribution the industry makes to gross regional and state product and employment.
In 2015, the Victorian Chicken Meat Council (VCMC) released a strategy for the industry for the next 10 years. This strategy sets out VCMC’s view of potential growth for the chicken meat industry in Victoria, identifies a range of barriers to future development, and makes a number of recommendations for industry action.
There is a lack of information regarding the economic impact of the industry. In a recent Victorian Civil and Administrative Appeals Tribunal (VCAT) decision, VCAT noted that there was no independent economic or social assessment to quantify or verify the number of direct and indirect jobs and increased spending as claimed in the planning application.
Analysing the industry and its linkages across an economy can assist policy makers understand the economic significance to Victoria and regions within Victoria. In particular, it can assist with policy decisions that may impact the productivity of the industry and provide policy makers with an appreciation of the further impacts within the economy through disruptions to flow-on activity.
The purpose of this study is to provide an updated statement of the economic contribution of the chicken meat industry for each core chicken meat region in Victoria, and for Victoria as a whole. This will provide the Victorian chicken meat industry with greater certainty of the importance of the industry to regional economic activity and employment, as well as providing information that can be used to inform policy and decision-making relating to the chicken meat industry.
1.2 Scope
The scope of the project is as follows:
The production of chicken meat. The project excludes the production of eggs for retail sale, and other poultry meats such as turkey and duck meat.
Breeding and hatching activities undertaken by the major processors are included. The importation of genetic stock is not included. This is a relatively minor activity in employment terms and is carried out interstate.
Primary production that is undertaken on broiler farms.
Primary processing. The project includes processing for retail consumption undertaken by the major processors, for instance the impact includes Ingham’s further processing plant in Melbourne, but excludes retail sales of chicken meat products.
RMCG Environment | Water | Agriculture | Policy | Economics | Communities Page 5

Further processing. Processors who value-add to existing processed chickens are also included. This includes firms that buy whole processed birds and produce portions or crumbed products for retail. This part of the industry is made up of smaller firms with mostly less than 100 employees.
Flow-on impacts for Victoria only will be included; flow-on impacts for other states and jurisdictions were not estimated.
Retail and distribution are not included.
1.3 This report
The remainder of this report is structured as follows:
Section 2: The chicken meat industry in Victoria provides an overview of the industry in Victoria.
Section 3: Method provides a guide to the method and the key concepts involved in this economic study, including economic activity, key indicators and categories of economic activity in the chicken meat industry supply chain. This section also provides an introduction to economic impact modelling in addition to the data and assumptions applied for this study.
Section 4: Regional economic impact describes the economic impact in terms of employment and contribution to GRP for each core chicken meat industry region in Victoria.
Section 5: Victorian economic impact describes the economic impact in terms of employment and contribution to GRP for Victoria as a whole.
RMCG Environment | Water | Agriculture | Policy | Economics | Communities Page 6

2 The chicken meat industry in Victoria
2.1 Global and national context
The consumption of chicken meat in Australia has risen rapidly and is now by far the most consumed meat per person, with an annual consumption of 40kg per person.
Figure 2-1: Meat consumption in Australia27
1980
1983
1986
1989
1992
1995
1998
2001
2004
2007
2010
2013
0
5
10
15
20
25
30
35
40
45
POULTRYBEEFPIGSHEEP
Mea
t con
sum
ptio
n pe
r per
son
(kg)
The quantity of chicken meat consumed per person in Australia is only surpassed by US and Israel.
Figure 2-2: Meat consumption per person by country0
ISR
USAAUS
NZLOECD
RUSEU28
KORJP
NWLD
VNMPHL
IDN
IND
0
10
20
30
40
50
60
70
80
90
100
SHEEPPIGBEEFPOULTRY
Mea
t con
sum
ptio
n pe
r per
son
(kg)
27 Data source: OECD (2016), Meat consumption (indicator). doi: 10.1787/fa290fd0-en (Accessed on 02 June 2016)0 Data source: OECD (2016), Meat consumption (indicator). doi: 10.1787/fa290fd0-en (Accessed on 02 June 2016)
RMCG Environment | Water | Agriculture | Policy | Economics | Communities Page 7

2.2 Victoria
The Victorian chicken meat industry largely supplies the Victorian domestic market. The quantity of interstate and international trade is small, but growing, with Victorian being a net importer. Victoria produces around 21% (240,000 tonnes) of Australia’s chicken meat, down from a peak of 30% in 2003.
Figure 2-3: Chicken meat production by state019
7019
7319
7619
7919
8219
8519
8819
9119
9419
9720
0020
0320
0620
0920
1220
15 -
50,000
100,000
150,000
200,000
250,000
300,000
350,000
400,000
NSWVicQldRest
Chic
ken
mea
t pro
duce
d (to
nnes
)
The Victorian chicken meat industry is clustered around three locations: Geelong, Bendigo and the Mornington Peninsula. There are three main business forms in the sector:
1. A small number of very large producers who are vertically integrated from primary production, to processing and wholesale. There are four large processors in Victoria, Baiada Poultry, Ingham Enterprises, Turi Foods, Hazeldene’s, which collectively operate six processing facilities in Geelong, Bendigo, Mornington Peninsula and Melbourne. Processing plants employ large amounts of labour and thus are located near population centres.
2. A large number of small contract growers, who own and operate the majority of the meat chicken growing farms. They grow out the chickens for the major processing companies. The processing companies provide day-old-birds, feed and support services to the growers. The farms are independently owned, with the exception of some of Hazeldene’s farms, which are owned by the processor. There are around 200 contract growers across Victoria. Contract growers are generally located within 100km of the processing plant0.
In 2014/15 there were approximately 225 chicken meat farms in Victoria. With overall production of 131 million chickens, this means that average production per farm is 580,000 chickens per year. However, the average farm size is growing, with a typical new farm being considerably larger than the current average. A new farm typically has eight sheds holding approximately 40,000 chickens/each0, and can therefore produce 1,700,000 chickens per year over 5-6 batches.
3. There are smaller processors that purchase undressed chickens from larger processors’ growers. There are also a number of small companies that purchase dressed birds for further processing – boning and other value adding activities.
0 Source: ABS (2016) 7215.0 Livestock products, Australia0 ACMF (2013) Location of farms and processing plants (http://www.chicken.org.au/page.php?id=3)0 ACMF (2013) Growing meat chickens (http://www.chicken.org.au/page.php?id=6)
RMCG Environment | Water | Agriculture | Policy | Economics | Communities Page 8
The chicken meat supply chain includes the pre-production of inputs such as feed, on-farm production (breeding farms, hatcheries and broiler farms), and chicken meat processing and distribution.
The chicken meat supply chain is highly vertically integrated. Processors are fully or partially involved in all stages of production from feed mills, breeding farms, hatcheries and grow-out farms, through to the processing. The broiler farm work is contracted out to farmers (although Hazeldenes also own and operate farms). Generally speaking, processors supply feed and advice to growers to ensure the chickens are raised to the standard they require.
The chicken meat industry value chain and ownership is shown below in Table 2-4.
Table 2-4: Chicken meat supply chain and ownership
Activity Function Ownership
Feed mills Produce animal feed Small number of specialist feed mills/processors
Breeder farms Produce fertile eggs for growing on Aviagen/consortium of processing companies
Hatcheries Incubate fertile eggs until they hatch
Four large processors
Broiler farms Grow day old chicks to maturity Large number of small-medium enterprises. Growers are contracted by the four large processors. Some growing farms are also fully owned by processors.
Processing plants
Slaughter birds and prepare meat products for sale
Processors (large and small)
Further processing plants
Purchase dressed birds from the processors and value-add
Large number of small and medium companies. Some involvement by large processors
The location of Victorian processors and their grow-out farms is shown in Victorian supply chain is shown in Figure 2-4.
RMCG Environment | Water | Agriculture | Policy | Economics | Communities Page 9

Figure 2-4: Location of chicken meat farms and processing plants in Victoria
The number of farms and processing plants for each location is shown in Table 2-5.
Table 2-5: Location of primary production and processing0
Activity Broiler farms0 Processing plants
Geelong region 81 1
Bendigo region 54 1
Mornington Peninsula region 90 1
Melbourne region 0 3
0 The further processing (boning and value-adding) sector is not included in this table; this sector is located mostly in Melbourne.0 Estimate based on the regional split of production. Assumes that the average farm size in each region is the same.
RMCG Environment | Water | Agriculture | Policy | Economics | Communities Page 10

3 Method
3.1 Overview of the method
The estimates of regional economic impact presented in this report are based on a combination of data collection and economic modelling:
Data collection. We surveyed chicken meat farmers and processors to understand at a detailed level the expenditure and production patterns in the industry. This was scaled up to industry level with secondary data from the Australian Bureau of Statistics.
Economic modelling. EconSearch’s input-output model, RISE (Regional Industry Structure and Employment), was used to convert expenditure estimates into estimates of economic impact.
Further detail on the method is provided below.
3.2 Data collection
3.2.1 Primary production
Data on primary production were collected through the Australian Bureau of Statistics (ABS) and interviews.
ABS data included information on the overall scale of production for each region. Two main data items were used:
Gross value of production
Number of birds on hand at 30 June
Nine chicken meat farmers, who were broadly representative of the range of farmers in terms of size and location, were surveyed. The survey was used to gather more detailed information about primary production that is not already publicly available:
Enterprise-level production in terms of gross value and number of chickens produced
Breakdown of expenditure by business inputs
The geographic source of inputs (local region, Victoria-wide or outside Victoria)
The detailed information from the survey was scaled to the industry level using the ABS data on:
The number of chickens turned off from farms
The number of chickens processed by processors.
The quantity of chicken meat produced by processors.
3.2.2 Processing
Similarly with primary production, data on the processing sector were collected through interviews and ABS.
ABS data provided the overall scale of the industry. ABS data used were:
Number of chickens slaughtered
Quantity of chicken meat produced
RMCG Environment | Water | Agriculture | Policy | Economics | Communities Page 11

Value of poultry slaughtered
More detailed data collected through the processing survey included:
Enterprise-level production in terms of gross value and number of chickens slaughtered
Breakdown of expenditure by business area (hatchery, broiler farm or processor) and by business inputs associated with each business area
The geographic source of inputs (local region, Victoria or outside Victoria)
As with the primary production sector, the detailed information from the questionnaire was scaled to the industry level using the ABS data.
3.3 Economic modelling
The estimates of regional economic impact presented in this report use a model known as the RISE model (Regional Industry Structure and Employment). The RISE model has been developed by EconSearch over the past decade and is based on an extension of the conventional input-output method.
Input-output (I-O) models are widely used to assess the economic impact of existing or changing levels of economic activity0, such as regional agriculture. I-O models are available at the national, state and regional levels. The RISE model provides a comprehensive economic framework that is extremely useful in the resource planning process, particularly for regional economic impact applications0.
RISE models have been constructed for the Victorian Government at both a state and regional level. To assess the economic activity of the chicken meat industry in Victoria a RISE model was constructed for each of the core chicken meat regions and Victoria as a whole.
While this report demonstrates that significant economic impacts are associated with chicken meat-related activity, measurement of these impacts does not, per se, constitute an economic evaluation of the industry. Such an evaluation is possible only through a comprehensive cost-benefit analysis of the industry, which would include as one input the direct and indirect impacts of the industry as recorded in this study.
3.4 Overview of economic concepts
3.4.1 Economic activity
Economic activity indicators: the primary focus of this report is the generation of economic activity resulting from the chicken meat industry. The key economic activity indicators considered in the analysis are gross regional product (GRP) and employment. Gross state product (GSP) is used in place of GRP when discussing the economic activity of Victoria.
3.4.2 Indicators of Economic activity
Gross regional product (GRP): is a measure of the contribution of an activity to the regional economy. The direct GRP of an industry is measured as value of gross output (business revenue) less the cost of goods and services (including imports) used in producing the output. In other words, it can be measured as the sum of wages and profits0. It represents payments to the primary inputs of production (labour,
0 Called an ‘exogenous shock’ in economic modelling terminology.0 For this analysis RISE models were constructed for each core chicken meat Industry region in Victoria and for Victoria as a whole.0 Or more correctly, the sum of household income, gross operating surplus and gross mixed income minus payments to owner
managers and taxes less subsidies on products and production
RMCG Environment | Water | Agriculture | Policy | Economics | Communities Page 12

capital and land). Using GRP as a measure of economic impact avoids the problem of double counting that may arise from using value of output for this purpose.
Gross state product (GSP): is the same concept as GRP, however, it is applied to the state economy (Victoria).
FTE: is an indicator of employment and measures a worker's involvement in a project or industry activity. An FTE of 1.0 means that the person is equivalent to a full-time worker, while an FTE of 0.5 signals that the worker is only half-time.
3.4.3 Categories of economic activity in the chicken meat supply chain
A useful way to think about economic activity and economic impact (as measured by GRP and employment) is to refer to the supply chain.
Figure 3-5: Chicken meat industry supply chain
Broadly speaking, each economic indicator has four levels of economic impact across the economy. For example, with respect to employment:
1. Direct employment – this is employment in those firms, businesses and organisations that are directly engaged in chicken meat activity. Typically this will include:
a) Hatcheries
b) Breeding farms
c) Broiler farms
d) Processing firms
2. First round employment – refers to employment in firms that supply inputs and services to the ‘direct employment’ businesses, i.e. those categorised under #1 above.
a) Farm-input sectors including all inputs used by agriculture such as fertiliser, transport and storage services
b) Agricultural service sectors including grain growing and feed mill production
c) Packaging for chicken meat processing
d) Business support services
e) Other inputs.
3. Industrial-support employment – is the term applied to 'second and subsequent round' effects as successive waves of output increases occur in the economy to provide industrial support, as a response to the original chicken meat industry expenditure, i.e. the activity in sectors that provide goods and services to those businesses that supply directly to the chicken meat industry. This category excludes any employment associated with increased household consumption.
RMCG Environment | Water | Agriculture | Policy | Economics | Communities Page 13
Distribution and retail
Processing (includng boning
and furtherprocessing)
Broiler farmsHatcheriesBreeding farmsPre-production
(e.g. feed production)

4. Consumption-induced employment – is the term applied to those effects induced by increased household income associated with the original chicken meat industry expenditure. The expenditure of household income associated with all three categories of employment (direct, first round and industrial-support) will generate economic activity that will in itself generate jobs.
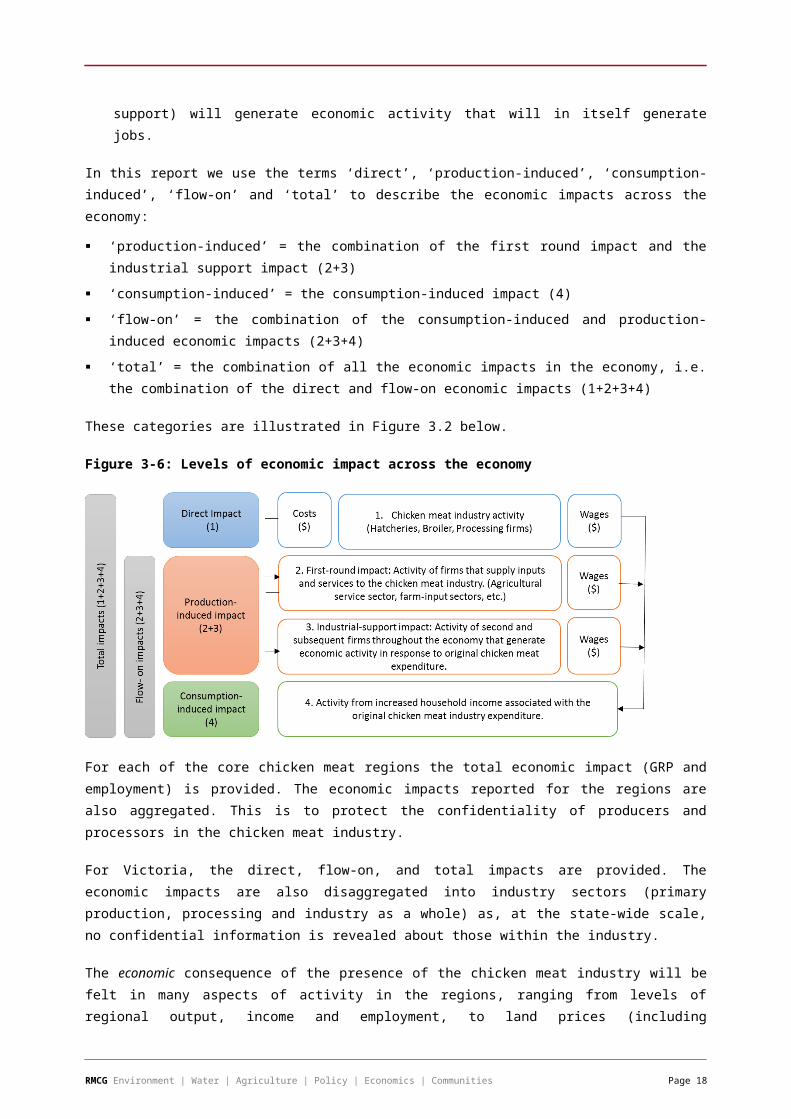
In this report we use the terms ‘direct’, ‘production-induced’, ‘consumption-induced’, ‘flow-on’ and ‘total’ to describe the economic impacts across the economy:
‘production-induced’ = the combination of the first round impact and the industrial support impact (2+3)
‘consumption-induced’ = the consumption-induced impact (4)
‘flow-on’ = the combination of the consumption-induced and production-induced economic impacts (2+3+4)
‘total’ = the combination of all the economic impacts in the economy, i.e. the combination of the direct and flow-on economic impacts (1+2+3+4)
These categories are illustrated in Figure 3.2 below.
Figure 3-6: Levels of economic impact across the economy
For each of the core chicken meat regions the total economic impact (GRP and employment) is provided. The economic impacts reported for the regions are also aggregated. This is to protect the confidentiality of producers and processors in the chicken meat industry.
For Victoria, the direct, flow-on, and total impacts are provided. The economic impacts are also disaggregated into industry sectors (primary production, processing and industry as a whole) as, at the state-wide scale, no confidential information is revealed about those within the industry.
The economic consequence of the presence of the chicken meat industry will be felt in many aspects of activity in the regions, ranging from levels of regional output, income and employment, to land prices (including residential, commercial and industrial land), house and building prices, local government rates, supply and demand of labour, demand and supply of urban infrastructure and so on. Unfortunately, fully comprehensive models that include all aspects of regional economic activity and economic phenomena have not been satisfactorily developed for impact analysis at a regional level in Australia.
Since this study is concerned solely with economic impact, it omits analysis of non-economic impacts of the industry such as social and environmental impacts.
RMCG Environment | Water | Agriculture | Policy | Economics | Communities Page 14

3.5 Assumptions
3.5.1 Geography
To produce regional results, the economic activity of the chicken meat industry in each core chicken meat region – Geelong, Bendigo and Mornington Peninsula – was mapped. Because the farms cluster around processing plants, it is reasonable to define the industry geography in this way.
Boundaries for the three chicken meat production regions were constructed from ABS poultry production data at the Statistical Areas Level 2 (SA2) level. As the poultry data included a variety of poultry species, known chicken meat region data at the LGA level were used to cross check the ABS data to ensure the regional boundaries were defined correctly. This chicken meat region data was sourced from DEDJTR.0
When determining the boundaries of each chicken meat region the aim was to keep the region tightly defined but, at the same time, include as much of the industry as possible. This trade-off meant that the locations of a small number of broiler farms were omitted because of their distance from the core group of farms in that region. To include the areas where these farms are located would have greatly expanded the economic region and thereby diluted the significance of the chicken meat industry.
The process was to include the activity of the “omitted” broiler farms as if they were located in the defined regions. This meant that a small percentage of the reported impacts would occur outside of the defined regions.
The LGAs that make up each region are shown in Table 3-6.
Table 3-6: Chicken meat region definitions
Geelong region Bendigo region Mornington Peninsula regionGolden Plains (S) Buloke (S) Baw Baw (S)Greater Geelong (C) Greater Bendigo (C) Cardinia (S)Melton (S) Greater Shepparton (C) Casey (C)Moorabool (S) Loddon (S) Frankston (C)Queenscliffe (B) Moira (S) Latrobe (C)Surf Coast (S) Northern Grampians (S) Mornington Peninsula (S)Wyndham (C) Strathbogie (S) Nillumbik (S)
Swan Hill (RC) Yarra Ranges (S)
3.5.2 Expenditure
The breakdown of primary producers’ and processors’ expenditure, collected through the primary production and processing surveys respectively0, was used to establish the expenditure costs in each region. In the survey, each producer and processor provided a breakdown of recurrent expenditures in their business. These data, together with Victorian chicken meat production figures, enabled estimation of itemised costs in each region. It was assumed that the sample was representative of businesses in the regions as a whole, enabling expenditure breakdown derived by the survey to be scaled up to the regional level.
0 Victorian Land Use Information System, location of broiler farms across Victoria0 The questionnaire used in the producers survey is reproduced in Appendix 1 and the processing survey is reproduced in Appendix
2.
RMCG Environment | Water | Agriculture | Policy | Economics | Communities Page 15

3.5.3 Regional production
The ABS chicken meat processing data were used to estimate the quantity of chickens produced in each chicken meat region. As little information was available on the movement of chickens between regions, it was assumed that the majority of chickens were produced in the regions in which they were processed. This assumption was based on information from processors, the strong vertical integration of the industry and the location of processing plants to hatcheries and broilers. Some information was also provided by processors about the percentage of chickens they sourced from outside Victoria. This information was used to estimate the quantity of chickens processed in Victoria that originated outside the state.
RMCG Environment | Water | Agriculture | Policy | Economics | Communities Page 16

4 Regional economic impact
This section reports on the economic impact of the chicken meat industry in the core production regions in Victoria: Bendigo, Geelong and Mornington Peninsula. The economic contribution of the chicken meat industry is reported for several economic indicators, namely contribution to GRP and employment. To protect the confidentiality of producers and processors results at the regional level are aggregated across the production and processing sectors. These aggregate figures also combine the direct contribution made by the chicken meat industry and the flow-on economic activity the industry creates in other parts of the economy (e.g. transportation, retail/wholesale trade and health services).
4.1 Gross regional product
The total contribution to GRP of an industry, including flow-on effects, is measured as value of output less imported goods and services used in producing the output, plus the effect of increased household income. In 2014/15, the total contribution to GRP was $176 million in Bendigo, which is 1.4% of the regional economy, $246 million (1.2%) in Geelong, and $297 million (1.0%) in the Mornington Peninsula as shown in (Table 4-7).
Table 4-7: Total contribution to GRP of the Victorian chicken meat industry, 2014/15
Bendigo Geelong Mornington Peninsula
Total GRP ($m)a 176 246 297Share of region (%) 1.4% 1.2% 1.0%
ᵃTotal GRP represents the combination of direct chicken meat industry effects and the effects created in flow-on industries.
Source: EconSearch analysis
The total contribution to GRP is a reflection of the output generated in the region which is directly related to the volume of chicken production that occurs within the region. As the Mornington Peninsula has a greater number of chickens produced and processed we would expect the region’s total contribution to GRP to be highest.
4.2 Employment
Employment is a measure of the net FTE jobs involved with an activity or industry to the region or state economy, in this case the chicken meat industry to core rural areas in Victoria. Employment is a key indicator of both regional economic activity and the welfare of regional households.
In 2014/15, the total employment impact was 1,692 FTE jobs in Bendigo, which is 1.8% of the regional employment, 2,079 FTE jobs (1.4%) in Geelong, and 2,641 FTE jobs (1.2%) in the Mornington Peninsula, and. The results are shown in (Table 4-8).
Table 4-8: Total employment impact of the Victorian chicken meat industry regions, 2014/15
Bendigo Geelong Mornington Peninsula
Total employmenta 1,692 2,079 2,641Share of region (%) 1.8% 1.4% 1.2%
RMCG Environment | Water | Agriculture | Policy | Economics | Communities Page 17

ᵃ Total employment represents the combination of direct chicken meat industry effects and the effects created in flow-on industries.
Source: EconSearch analysis
4.2.1 Industry Comparisons
To provide perspective on the impact the chicken industry has in Victoria’s regional economies, the estimates of GRP and employment were compared to the corresponding estimates for other sectors in the economy (Table 4-3).
Comparisons are made with four other agricultural industries and their associated processing sectors: grains, pigs, grape and wine production, and dairy, as well as the tourism industry.
Table 4-9: Total economic contributions for selected industries in regional Victoria
Chicken meat a,b Grains a,b Porka,b Wine a,b Dairy a,b Tourism b
GRP ($m)Bendigo 176 630 80 80 830 410
Geelong 246 180 30 50 90 670Mornington Peninsula
297 70 30 70 370 530
Employment (fte)Bendigo 1,692 4,100 600 1,200 6,700 3,200Geelong 2,079 1,300 200 400 800 5,000Mornington Peninsula
2,641 500 200 800 3,800 4,300
a For each agricultural industry the estimates include both farming and processing activity in the region.b For both GRP and employment the estimates represent the sum of direct industry effects and the effects created
in flow-on industries.
Some care should be taken when comparing the chicken meat industry estimates to the estimates presented for other industries. The estimates developed for the chicken meat industry are based on chicken industry survey data while the estimates for the remaining industries have been developed within the generalised RISE model database (which relies on a combination of published and modelled data). Consequently, more confidence can be expected in the chicken meat industry data in comparison to other industries.
RMCG Environment | Water | Agriculture | Policy | Economics | Communities Page 18

5 Victorian economic impact
The following section looks at the economic impact of the chicken meat industry for Victoria as a whole. At the Victorian scale it is possible to have more disaggregation without revealing any company-specific information. Consequently, the following data are split by sector (primary production and processing) and the economic contribution presented as the direct impact of the chicken meat industry, the flow-on impacts generated and the total impact within the economy (direct effects + flow-on effects).
5.1 Primary production sector
The primary production sector represents the pre-processing activity that occurs within the chicken meat industry. This includes the activity of breeder farms, hatcheries and grow-out (broiler) farms.
In 2014/15, the primary-production sector was responsible for the direct employment of an estimated 1,202 FTE jobs, with flow-on activities creating further employment of around 912 FTE jobs in Victoria. This created a total employment contribution of 2,114 FTE jobs.
A contribution to GSP of $211 million was generated in Victoria in 2014/15 by the primary-production sector: $86 million by the primary-production sector directly and $126 million generated in other sectors in the Victorian economy. These other sectors included professional, scientific and technical services, education and training, health and community services and retail trade.
The results for the primary production sector are shown in Table 5-10.
Table 5-10: Primary production economic impacts, Victoria, 2014/15
GSP ($m) Employment (fte)Direct impactPrimary production 86 1,202Flow on impacta
Personal & other services 11 159Retail trade 11 124Prof. scientific tech services 7 55Health & community services 5 49Education & training 5 48Wholesale trade 5 46Other food products 5 44Food & beverage services 3 42Road transport 3 31Construction services 2 21Pharma & other chem products 2 19Poultry 4 19Admin support services 2 19Finance 9 16Other agriculture 4 16Insurance & other financial services 3 15Electricity supply 3 14Cultural & recreational services 1 12Transport support & storage 2 12Communication services 3 11
RMCG Environment | Water | Agriculture | Policy | Economics | Communities Page 19
GSP ($m) Employment (fte)Otherb 37 141Total flow-onc 126 912Total impactc 211 2,114Share of state (%) 0.06% 0.09%
ᵃ Flow-on impacts of the top twenty sectors, defined by employment impact.
ᵇ The ‘other’ category reflects the aggregate flow-on impacts of the other 58 sectors in the 78 sector RISE model.
ᶜ Totals may not sum due to rounding.
5.2 Processing sector
The processing sector represents the processing activity that occurs within the chicken meat industry. This includes boning, further processing and distributing. It does not include the economic impact generated by retail trade, food service outlets and exports directly linked to the chicken meat industry.
In 2014/15, the processing sector was responsible for the direct employment of an estimated 3,615 FTE jobs, with flow-on activities creating further employment of almost 3,000 FTE jobs in Victoria (Table 5.2). This created a total employment contribution of 6,613 FTE jobs.
A contribution to GSP of $724 million was generated in Victoria in 2014/15 by the processing sector: $338 million by the processing sector directly and $386 million generated in other sectors in the Victorian economy. These other sectors included wholesale trade, retail trade, road transport services, administration support services and education and training.
Table 5-11: Processing sector economic impacts, Victoria, 2014/15
GSP ($m) Employment (fte)Direct impactChicken processing 338 3,615Flow on impacta
Personal & other services 59 860Retail trade 27 315Education & training 17 177Health & community services 16 177Prof. scientific tech services 21 165Food & beverage services 11 157Wholesale trade 18 155Road transport 15 132Construction services 6 87Admin support services 7 64Finance 30 56Insurance & other financial services 10 54Cultural & recreational services 4 45Communication services 10 39Transport support & storage 5 36Rental hiring real estate 9 32Motor vehicles and parts 2 32Other machinery & equipment 3 31Electricity supply 6 28Other food products 3 24Otherc 188 710
RMCG Environment | Water | Agriculture | Policy | Economics | Communities Page 20
GSP ($m) Employment (fte)Total flow-ond 386 2,999Total impactd 724 6,613Share of state (%) 0.21% 0.27%
ᵃ The direct value of output of chicken meat processing has been modified to exclude the farmgate value of chickens processed in the state. This has been done so the value of production attributed directly to chicken processing is shown and the value of production attributable to chicken primary production is excluded.
ᵇ Flow-on impacts of the top twenty sectors, defined by employment impact.
ᶜ The ‘other’ category reflects the aggregate flow-on impacts of the other 58 sectors in the 78 sector RISE model.
ᵈ Totals may not sum due to rounding.
5.3 Chicken meat industry as a whole
The chicken meat industry as a whole represents the combination of the economic impact of the primary production sector and the processing sector. In 2014/15, the Victorian chicken meat industry was responsible for the direct employment of an estimated 4,817 FTE jobs, with flow-on activities creating further employment of an estimated 3,910 FTE jobs. This resulted in a total employment contribution of 8,727 FTE jobs (0.36% of the jobs in Victoria) by the chicken meat industry in Victoria.
The total chicken meat industry-related GSP in Victoria was an estimated $935 million (0.27% of the Victorian economy): $423 million generated by the chicken meat industry directly and $512 million generated in other sectors of the Victorian economy (Table 5-12).
Table 5-12: Chicken meat industry economic impacts, Victoria, 2014/15
GSP ($m) Employment (fte) Household income ($m)
Direct impactPrimary production 86 1,202 35.0Chicken processing 338 3,615 166.3Total directa 423 4,817 201.3Flow-on impactb
Personal & other services 70 1,018 59.8Retail trade 37 439 28.4Health & community services 21 225 18.9Education & training 22 225 20.9Prof scientific tech services 29 220 25.5Wholesale trade 23 201 15.8Food & beverage services 13 199 10.4Road transport 18 163 12.9Construction services 8 108 7.6Admin support services 10 83 9.3Finance 39 72 10.0Insurance & other financial services 13 69 8.7Other food products 8 68 5.7Cultural & recreational services 5 57 3.2Communication services 13 49 4.9Transport support & storage 7 48 3.2Rental hiring real estate 12 42 5.6Electricity supply 8 42 2.8Pharma & other chem products 5 41 2.8
RMCG Environment | Water | Agriculture | Policy | Economics | Communities Page 21

GSP ($m) Employment (fte) Household income ($m)
Motor vehicles & parts 3 40 2.4Otherc 147 500 35.9Total flow-ona 512 3,910 294.6Total impacta 935 8,727 495.9Share of state (%) 0.27% 0.36% 0.25%
ᵃ Flow-on impacts of the top twenty sectors, defined by employment impact.
ᵇ Totals may not sum due to rounding.
ᶜ The ‘other’ category reflects the aggregate flow-on impacts of the other 58 sectors in the 78 sector RISE model.
5.4 Summary
The total chicken meat industry-related GSP in Victoria was an estimated $935 million: $423 million generated by the chicken meat industry directly and $512 million generated in other sectors of the Victorian economy.
Table 5-13: Victoria-wide economic impact of the chicken meat industry
GSP ($m) Employment (FTE)
Direct impact
Primary production 86 1,202
Processing 338 3,615
Total direct 423 4,817
Flow on impact 512 3,910
Total impact 935 8,727
Share of state (%) 0.27 0.36
RMCG Environment | Water | Agriculture | Policy | Economics | Communities Page 22

RMCG Environment | Water | Agriculture | Policy | Economics | Communities Page 23