executive summary - audiodevelopers reborn – a ... · web viewthe exact property lines aren’t...
TRANSCRIPT

Executive SummaryThis report documents the 3 methods used to assess the sound levels from vehicles used by the defendants, and it documents the results. The first method uses measurements from low cost sound meters that have been calibrated to verify their accuracy. The second method uses estimates from residents at different distances from the sound source. By measuring the distances on imagery with an appropriate scale, it is possible to assess the sound levels at the noise source. The final method is by using the sound level information provided by the manufacturer for the vehicle, and then calculating the sound levels at various distances. All three of these methods are valid ways to demonstrate that the noise from the vehicles exceeds the thresholds established by the state of Maryland for residential areas and that the defendants violated the provisions of COMAR 26.02.03.02.D.2, usually by at least 20dB-30dB. This report also addresses the health and safety issues and the “nuisance factor” that is a clear violation of the Declaration of the Minnetoska Property Owners Association.
Part 1: Measurement MethodsMost people with normal common sense can tell when noise levels from dirt bikes and ATV’s are “too loud” and are in violation of state regulations. However, the Minnetoska Property Owners Association (MPOA) needed to make definitive measurements and calculations to prove that the defendants exceeded the state thresholds, and to show how many property owners are affected by the violations. Three different methods were used to measure, estimate or calculate the sound levels. Each of these methods is described in sections a through c, below.
a) Noise Measurements with a MeterThe section on noise measurement in COMAR 26.02.03.02.D.3 specifies the use of a Type II sound level meter. The ANSI specification that defines the Type II sound level meter is ANSI S1.4-1971. Additional specifications related to measurement of transient sound signals are in ANSI S1.43, which was originally published in 1997 and last reaffirmed in 2007.
In the 45 years since the original specification was published, sound level meters have become a popular product, available from a wide range of vendors. In fact, searching Amazon for the string “sound level meters” returns over 2300 results, and over 250 results in the more constrained category of “Industrial and Scientific”. The Type I meters, with very high accuracy, are typically in the $1000 to $7000 range, whereas the less accurate Type II meters range from $15 to $1000. The wide difference in price range for Type II is due to certification. The low-cost Type II meters are designed to the Type II standard, but are not certified to meet the Type II requirements.
The MPOA elected to measure the dirt bike and ATV noise levels using meters that were designed to the Type II specification, and verified the compliance with Type II accuracy by using a properly calibrated Acoustical Calibrator. The calibration was verified at the laboratory at Scantek in Columbia, Maryland on August 17, 2017. Three different meters were used to measure the sound levels, and all three meters were shown to exceed the accuracy specified in the ANSI S1.4-1971 standard for Type II meters. Whereas the ANSI Type II specification requires an accuracy of plus or minus 1 dB for a sinusoidal input, all three meters were within plus or minus 0.4 dB for a 1KHz signal at 94dB:

Table 1: Sound Meter Calibration Results
Meter Response to 94dB calibration signal Error Type II accuracy1. “Generic” digital meter 93.5dB 0.5dB yes2. Logging-type meter 93.7dB to 93.8dB 0.25dB yes3. Radio Shack 33-2050 94dB 0dB yes
The Radio Shack meter required a 1” calibrator instead of the more common ½” fitting, so Scantek used two different two acoustical calibrators used to perform the accuracy assessment. Both acoustical calibrators were calibrated within the last month. The calibration certificates are available from the MPOA and are shown below as reduced images in the following two figures.
Figure 1: Calibration Certificate for the Acoustical Calibrator

Figure 2: Calibration Certificate Applicable to the Radio Shack Sound Level Meter
b) Noise Estimates by Comparison at Distant LocationsAnother approach used to determine compliance with Maryland state noise laws is to compare the noise to common activities at a distant location. Once the comparison is made, the noise at the source can be determined using a simple calculation.
This method uses the fact that sound energy propagates in all directions and as a result, sound intensity follows the inverse square law. Therefore, every doubling in distance will result in four times the attenuation. This relationship is shown below in Figure 3. Expressed in decibels, the sound will be attenuated by 6dB for every doubling in distance. This relationship is an idealization, because terrain features and vegetation can create echoes, reverberation and attenuation that cause variations in sound intensity1. However, for open areas such as the Minnetoska subdivision, the inverse square law provides a reasonably accurate estimate of sound intensity at the locations of interest.
1 Keith Attenborough, Kai Ming Li and Kirill Horoshenkov , Predicting Outdoor Sound, Taylor & Francis (2007).

Figure 3: Each Doubling in Distance Results in a 6dB Drop in Intensity
It should become clear how the inverse square law can be applied to sound measurement with an example. Figure 4 shows recent imagery of the Minnetoska subdivision that focuses on the Defendant’s residence (at the top) and the Davis residence (at the bottom, denoted with a map marker). The exact property lines aren’t shown on the imagery, but the plat shows the property lines extending up to the road that goes between the two residences. The scale for the imagery in the lower right shows that the two residences are approximately 200 feet from each other, and when the vehicles are driven near the road between the two properties, they are approximately 50 feet from the edge of the Davis property. Since the code of Maryland section 26.02.03.02.D.3 specifies that measurement “shall be conducted at points on or within the property line of the receiving property”, our measurement reference is 50 feet. As it turns out, sound measurements for dirt bikes are specified at 50ft (15 meters) in the SAE J331 noise measurement standard, so this reference point allows direct comparison to manufacturer’s noise data that are based on SAE J331.

Figure 4: Imagery Showing the Davis and Smith Residences
Xx shows the Minnetoska subdivision imagery zoomed out, with a scale marker of 200ft. Using the scale marker, it is easy to draw rings of equal sound level as predicted by the inverse square law. Since the rings are at equal sound levels, they are called isobels. As indicated, every doubling of distance from the 50ft point used as our reference results in another 6dB attenuation of sound intensity. The part of the Davis residence closest to the Smith residence is approximately 100 feet from the reference point, so any measurements taken at this part of the Davis residence will be approximately 12dB less than the measurement at the edge of the property line. Therefore, if the sound measurement is 85dB at that end of the Davis residence, it will measure 97dB at the reference point (85dB + 12dB).
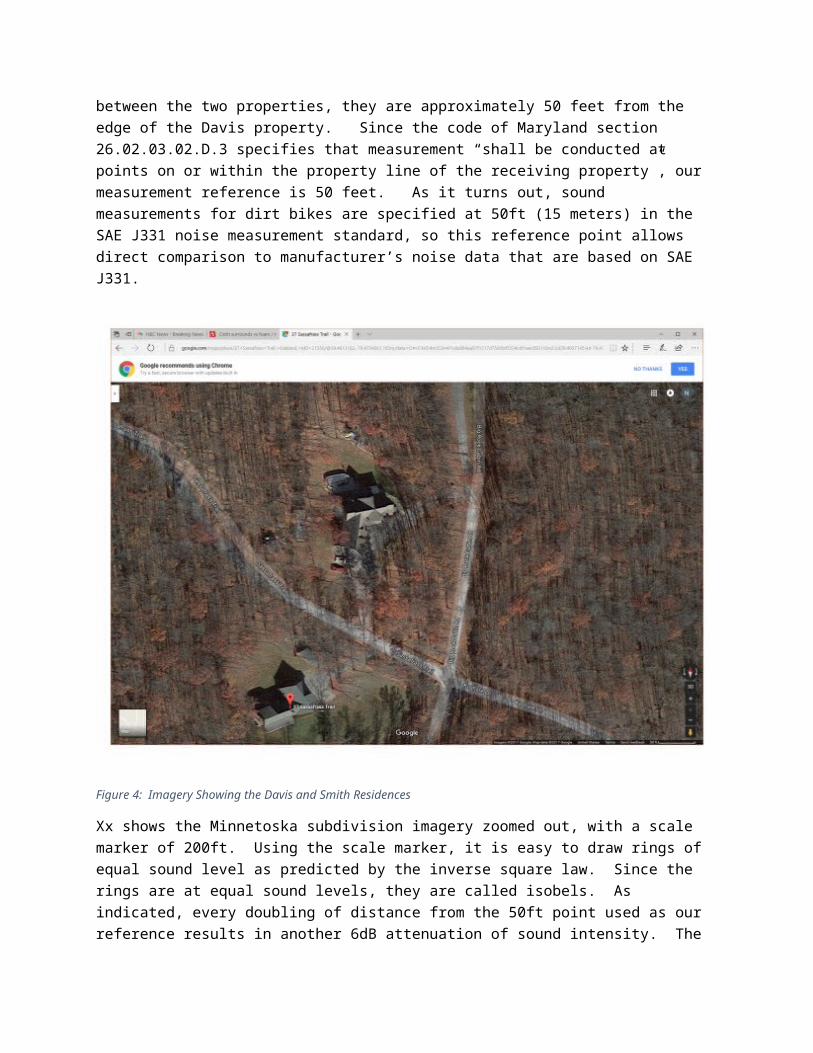
Figure 5: Imagery showing 6dB Isobels from the Reference Location
The convenience of this approach to measurement is evident when we consider the sound levels at more distant locations. At these larger distances, the sound from the dirt bikes will be in the 50dB to 70dB range, and most people are able to make estimates of these more common noise levels with good accuracy. There are many sound level reference charts that compare sound levels to human or machine noises, and one of those is shown in Figure 5.
For example, there is a residence in the lower right corner near the -42dB marker owned by one of the Board members, Eric Moyer. Eric has estimated the sound level at his residence as similar in volume to conversation at 1 meter, which means the sound is between 55dB and 65dB on his property. But since he is located near the -42dB isobel, the sound will be approximately 97dB to 107dB when measured at the edge of the Davis property.
This measurement method is also discussed in the Occupational Safety and Health Administration (OSHA) Technical Manual (TM), Appendix B, section B.6. The TM uses the “6dB for each doubling of distance” relationship to derive the following equation:
Lpd2 = Lpd1 + 20 * log(d1/d2),
where d1 is the original distance, d2 is the new distance, Lpd2 is the sound pressure level at the new distance, and Lpd1 is the sound pressure at the original distance. Applying this equation to the example of the sound level at the Moyer residence is straightforward. According to Google maps, the Moyer residence is approximately 3160 feet from the reference point, which is 50 feet from the vehicles. Using

3160 feet for d1, 50 feet for d1, and an estimate of 60dB on the Moyer property, the sound level at the reference point is:
60 + 20 * log(3160/50), or 96dB. This calculation is more accurate than the method using the Isobel rings, as the Google map application allows more accurate measurement of distances than the graphical approach using circle diameters that are multiples of the scale shown on the map.
Figure 6: Sound Levels of Common Noise Sources
c) Noise Estimates Based on Vehicle Noise SpecificationsThe final method for calculating noise within the Minnetoska subdivision is to simply obtain the noise specifications for each vehicle used on the Smith property. The plaintiffs have requested the make and model of each vehicle used on the defendant’s property through a Discovery request, and that data can be used with the previous method to calculate the noise levels at various distances. The Environmental Protection Agency has imposed noise standards for the sale of dirt bikes and other off-road vehicles, and the noise levels can be estimated using by referring to the EPA standards to which it complies.
The EPA standards and some state laws on which they are based, use the SAE J331 test procedure, which is a moving vehicle acceleration test. This test requires a properly designed and outfitted test track and … This testing and EPA certification is relevant for sound measurement in Minnetoska, as we can use the results of this test to determine sound level at any point in the subdivision, according to the inverse square law methodology discussed in the previous section.

The state of Maryland specifies the SAE J331 standard for use of off road vehicles on public land in COMAR 08.01.03.08, and the noise level limits are surprisingly low:
Noise level limits specified in COMAR 08.01.03.08 and the effective dates for enforcement are:
Vehicle Date of Manufacture Maximum Sound Level at 50 FeetMotorcycles and other ORV’s Before July 1, 1976 86 dB(A)
After July 1, 1976 84 dB(A)
SAE J331 can be used by manufacturers to characterize the vehicles, but it is not a test that is easily done “in the field” to test dirt bike noise levels. The field tests are typically done according to SAE J1259, which specifies an exhaust sound measurement at 20 inches (1/2 meter) at a specified RPM. These more common measurements are typically required to be in the 96 to 103dB range for modern vehicles. This measurement is not useful for assessing the worst-case sound levels in the Minnetoska subdivision as it does not capture the higher and obnoxious noise levels from revving the engine as the vehicle is driven on the defendant’s lot. However, by using the inverse square law to calculate the 50-foot sound pressure level from the 20-inch measurement, the J1287 test, if available, could be used to prove that the defendants violated the Maryland noise thresholds for residential areas.
Part 2: Measurement Resultsa) Results of direct measurements using a meterRather than measure the noise at the receiving property line per COMAR 26.02.03.02.D.2, all noise measurements using a meter were taken on the Davis residence, either on the back deck or through the kitchen window. It was judged too confrontational to stand on the property line in open sight, and there was simply no reason to do so since the distances were known.
The measurements during the spring and summer of 2015 yielded measurements exceeding of 85dB. As noted earlier, the noise was cyclical due to the defendants riding along a path that typically followed the Smith property perimeter. The measurements on the back deck ranged from 70dB to 90db, with a significant percentage of noise (around 25%) in the 85dB range. Applying the inverse square law, this measurement means that the sound level at the property line was approximately 97dB while the vehicles were driven nearby.
As noted elsewhere in the response to the Discovery Request, the sound levels decreased from 2015 to 2016, as did the durations. However, there were several occasions where maximum levels around 85dB were recorded in the Davis garage, and levels of 75dB were recorded on several occasions from inside the kitchen. 85dB inside the garage corresponds to sound pressure levels of 95-98dB at the property line, and 75dB corresponds to 85-88dB at the same measurement point. Obviously, these levels exceed the allowable threshold of 65dB by a large amount, and by enough to exceed the allowable noise level at several residences within the Minnetoska community.
It should be noted that these noise levels are not continuous, but rather periodic, in that they went up or down depending on the location of the dirt bikes on the track on the defendant’s property and depending on the way the dirt bike engine was revved as it passed. This periodic noise level can be seen in Figure 7, which is a chart of measurements taken on June 14, 2015 from inside the Davis residence. The samples were collected at 3 second intervals, so the chart shows about 5 minutes of activity. Since

the measurements were taken inside the house, the actual levels not as high as most other measurements, but what’s notable about this chart is the overall shape of the noise versus time. As shown, there are several peaks that are the result of the vehicle being driven around the dirt bike track. Obviously, the sound is loudest when the bikes are driven closest to the measurement point (the Davis residence). But some of the peaks are much higher than others, and this is due to the riders revving the engine. The combination of riding on a track and revving the engine results in a large difference between the maximum noise level and the minimum—the range is at least 25dB. To capture the revving and motion-dependent sound level, most readings were taken with the “slow” setting of the noise meter, using the “A” weighting as defined in the ANSI standard.
1 5 9 13 17 21 25 29 33 37 41 45 49 53 57 61 65 690
10
20
30
40
50
60
70
80
Series1
Figure 7: Representative noise "profile" over 5 minutes

b) Results of Noise Estimates by Comparison at Distant LocationsAs described in Part 1, the sound measurement method using comparisons or measurements at a distance requires knowing the distance from a 50-foot reference location. This distance can be determined using the measurement tool built into Google maps. Figure 8 shows the measurement to the Eisenhart residence—it is the white line in the figure. The markings on the line show that this distance is 581 feet.
Figure 8: Distance measurement to Eisenhart residence
The distances to other residences of homeowners who have complained about the noise are shown in Table 2. This table shows the distances to the property owners and the associated attenuation due to the inverse square law, using the OSHA formula described earlier. Where a sound measurement using a meter was available, it was listed in this table. The column labeled “sound comp” if the sound that was used as a comparison at that distance. Adding the attenuation factor to the sound level at a distance yields the estimated sound at a point 50 feet away from the source. As indicated, this method shows that the noise levels were exceeding the Maryland noise thresholds by a considerable amount—not only at the receiving property lines, but also inside property owner residences. For example, a noise level of 75dB inside a residence will drown out normal conversation and even make listening to a TV impossible.

Table 2: Distance measurements and estimated noise levels
C) Results of Noise Estimates by Evaluating dirt bike and ATV vendor dataThe third method to evaluate the noise levels requires analysis of the manufacturer’s EPA certifications or other noise data, along with assessing the impact of any exhaust modifications. The plaintiffs have requested the models and manufacturer’s data on all vehicles used in the last 3 years from the defendants, and expect to receive that information through the Discovery Request. The results of that analysis will be added to this report when that information has been provided. However, we do not expect that analysis to contradict the direct measurement or measurement at a distance information already provided.
Part 3: Health and Safety ImpactAs shown in previous sections of this report, the noise levels created by the defendants often exceeded levels in the mid-90dB range. The noise logs submitted as part of the Discovery Request show that these noise levels lasted for several hours at a time, particularly in the summer of 2015.
There are numerous studies that have resulted in charts of “safe” noise levels in the workplace, and at least one of those is prescribed by federal law (OSHA). The National Institute for Occupational Safety and Health (NIOSH) recommends a more conservative combination of noise levels and exposure to ensure not only hearing loss, but also protects other aspects of physical health. The NIOSH recommendation is a maximum duration of 1 hour for sounds at the 94dB level, with a doubling of the allowable duration for each drop in 3dB. However, on many weekends the defendants exceeded those levels.
But the goal of the Maryland noise standards for residential areas isn’t just protection of hearing and damage to the nervous system: it is to define noise levels that protect public health and welfare. This goal is stated clearly in the section on “Precepts” in the Title 26 Environmental Noise standards:
(1) It is known that noise above certain levels is harmful to the health of humans. Although precise levels at which all adverse health effects occur have not definitely
been ascertained, it is known that one's well-being can be affected by noise through loss of sleep, speech interference, hearing impairment, and a variety of other psychological and physiological factors. The establishment of ambient noise
standards, or goals, must provide margins of safety in reaching conclusions based on

available data which relate noise exposure to health and welfare effects, with due consideration to technical and economic factors.
The Minnetoska Board has dealt with the effects of excessive noise for the last 3 years, and has seen first-hand how residents get agitated, anxious and can even be driven to unlawful acts when these noise standards are violated on a regular basis, especially when the violations are well above the allowable standards. For example, one resident, who had successfully survived cancer treatment, stated to the Board that he would shoot one of the defendants and spend his last days in jail if the cancer had been untreatable. Nobody who heard this admission doubted that he would do it, as all the Board shares some of that frustration. Fortunately, nobody in the community has been shot and there haven’t been any unlawful responses. But the Board is concerned about the tensions and health hazards created by the noise violations, and feels a duty to protect the health and welfare of the Association by forcing the defendants to obey the noise laws.
Part 4: ConclusionsThree different methods were employed to determine beyond any doubt that the defendants exceeded the Maryland state noise threshold for residential-use areas, usually by an unhealthy amount. The 65dB threshold for daytime hours was exceeded by 20dB to 40dB, when measured on adjoining properties. These noise levels are enough to present a health and safety hazard, according to OSHA studies and exceeded the levels established by national guidelines for health and well-being. The violations are so excessive that every resident in the Minnetoska subdivision is exposed to a level that exceeds the threshold defined in Table 1 of COMAR 26.02.
Even when the defendants were using vehicles that had more “reasonable” noise output, the noise exceeded the allowable thresholds established by Maryland law, and were enough to upset, irritate and annoy residents in the Minnetoska subdivision. The noise levels were at a level that interfered with normal conversations and prevented homeowners from being able to enjoy music, television or other sounds unless the windows were closed.