executive summary moody’s mega math challenge 2014: lunch
TRANSCRIPT
Team 3377
Moody’s Mega Math Challenge 2014: Lunch Crunch Executive Summary
Along with educating children on proper nutrition, schools are also responsible for providing healthy daily lunches to students. Eating properly has been shown to not only improve health, but also enhance classroom performance and reduce incidences of disease. Recent legislative acts such as the Healthy, HungerFree Kids Act of 2010 have been instrumental in pushing schools to offer more nutritious menu options. However, there have been many obstacles in the implementation and success of the program. Students have shied away from new school lunches, arguing that the healthier options are not as tasty [7]. School districts also struggle to cover the rising expense of more nutritious foods with stretched budgets. Our job is to develop a mathematical model to optimize the affordability, taste, and nutrition of school meals. The first step in this process is to develop a method to calculate the calories a student needs at lunch. Current calorie calculators give recommended values for an entire day while our method returns a result that can be specified to lunchtime needs based on attributes such as amount of sleep, whether or not breakfast is eaten, time spent exercising in the morning and afternoon, when you eat lunch and dinner, frequency of snacking, and weight. Based on these parameters, we are able to calculate a person’s rate of calorie burn throughout various periods of a day and find the amount of calories they would need to consume at lunchtime. We then sought to determine what percentage of high school students are satisfied by standard school lunches given the calorie requirements calculated in the previous step. We ran our model on data from a sample of 11,458 high school students across the country in order to determine the distribution of lunchtime calorie needs. Given that a standard school lunch contains 850 calories, we then calculated the frequency at which the student’s caloric needs fell in a fixed range of values above or below 850 calories. We found that currently, only 37.9% of students would be satisfied. By analyzing the distribution our model returned, we found that a 1,050 calorie meal was a more optimum solution that would satisfy a greater number of students (49%). Finally, we established an ideal lunch meal for schools to offer to students based upon the recommendations of USDA’s MyPlate and what we observed to be the optimal number of calories to consume in order to satisfy the maximum percentage of students. Using data on foods available to a school and survey results showing how well students accept various foods, we were able to create an algorithm that generates meals that meet the USDA MyPlate requirement, have the necessary number of calories, and fit the available school budget. We then ranked these meals based on student acceptance to find the best meal choices, which would be wellreceived by students while still meeting dietary and budget requirements. Using localized survey results allows our model to be customized for schools in different geographical and socioeconomic situations.
199
Team 3377
Table of Contents
Introduction ................................................................................... Page 201
Part 1: Calculating Lunchtime Caloric Need ................................ Page 201
Part 2: The Average Lunch Meal ................................................. Page 208
Part 3: Cafeteria Meal Planning .....................................................Page 211
Strengths and Weaknesses .............................................................Page 216
Conclusions ................................................................................... Page 216
References ...................................................................................... Page 218
200

Team 3377
1. Introduction Schools across the United States are tasked with providing nutritious school lunches to students. A nutritious school lunch enables students to improve academic performance by allowing them to pay attention and stay focused in class. Additionally, a nutritious school lunch can promote healthier eating habits through the entire lifetime of many students. Finally, with lunch being such a large part of a student’s daily caloric intake, a healthy school lunch goes a long way in terms of fighting the country’s current obesity problem. However, providing a nutritious school lunch is not always easy. Schools must operate on a budget, and students often do not share the same dietary goals as the school district or federal government. Namely, students often tend to choose their meals based on taste and quantity. As such, in providing an optimal school lunch, schools are tasked with balancing three factors: affordability, taste, and nutrition.
1.1 Problem Restatement Given the importance of providing healthy yet satisfying lunches to students and compliance with the Healthy, HungerFree Kids Act of 2010, we have obliged to the USDA’s request to develop a mathematical model to solve the following problems: 1. Determine the number of calories a student needs at lunch based on certain physical attributes and lifestyle choices. Ex: height, weight, gender, activity level, amount of sleep, etc.
2. If the cafeteria serves a “standard school lunch” to each student, how many students will be left with their caloric needs unmet after lunch?
3. Given a school with a weekly budget of $6 per student to spend solely on food procurement, what lunch options would meet budget constraints and provide maximum satisfaction to students in terms of taste and caloric needs? How would options expand if the weekly budget were to increase by $1?
2. Part 1: Calculating Lunchtime Caloric Need
2.1 Analysis of the Problem Although there are a number of different methods for calculating total daily caloric burn (and consequently caloric input), such as the Institute of Medicine Estimated Energy Requirement (EER), which is the current standard for use in the United States, these methods only address calculating total daily caloric burn/intake. However, we are instead interested in evaluating specifically the caloric intake necessary at lunchtime, which must be some fraction of the total daily caloric input. Therefore, instead of calculating the total caloric input over a whole day, for example by using the EER, we must instead determine how many calories should be consumed just at lunchtime, based on some number of determinable factors. Since the calories consumed at lunchtime should be a fraction of the total calories
201
Team 3377
consumed over an entire day, we can consider factors that affect each part separately. Such factors that could affect the overall daily calorie burn include height, weight, age, gender, activity level, while factors affecting lunchtime caloric proportions could include factors such as meal schedules, snacking patterns, and the like.
2.2 Assumptions 1. Since this problem concerns meal plans for students in school, we assume that refers to elementary through high school students thus we are restricting our input ages from 618 years.
2. To calculate how different activities affect caloric requirements, we assume that during physical activity or sleep the rate of caloric burn holds constant over the entire period of activity.
3. Survey responses reflect daily habits that hold true on average. Although daily patterns are likely to vary, we assume the habits of each student will approach an average that will serve to provide an optimal, long term solution.
4. At each meal, an individual eats until he or she is fully satiated or until the food runs out. 5. We assume that the calories consumed at a meal are equivalent to the calories burned since the last full meal (minus any snacks consumed in the interim period). This is logical because, if we assume that at each meal an individual eats the amount necessary to bring them to a “full” status, the amount necessary at the following meal to return to the “full” status would be equivalent to that which was burned in the time since the last meal consumed.
6. The caloric consumption of an individual is equivalent to the number of calories burned per day. Although this is not strictly true (gaining weight = net positive caloric input, losing weight = net caloric deficit), the significance of this factor is relatively low at the age of highest growth rate (~12 yr), a student’s net caloric excess should be less than 100 calories/day to maintain a healthy growth rate [2].
2.3 Design of the Model Using assumptions #5 and #6 above, we can determine the number of calories that an individual must consume at each meal based on their previous meals and the number of calories burned since their last meal. To determine the number of calories burned over a certain time interval, we must consider the activity level of the individual, as this directly correlates to the calories burned. Using data from the Harvard Medical School, we find that the calories burned for a specific activity is proportional to the body weight of the individual, the time spent doing the activity, and some activity rate constant [6]. Given this data for various activities such as sleeping, sitting in class, and exercising, and information about the daily schedule of an individual, we can develop a graph of the function R(t) showing the rate of calories burned over an average day, shown in Figure 1 below.
202
Team 3377
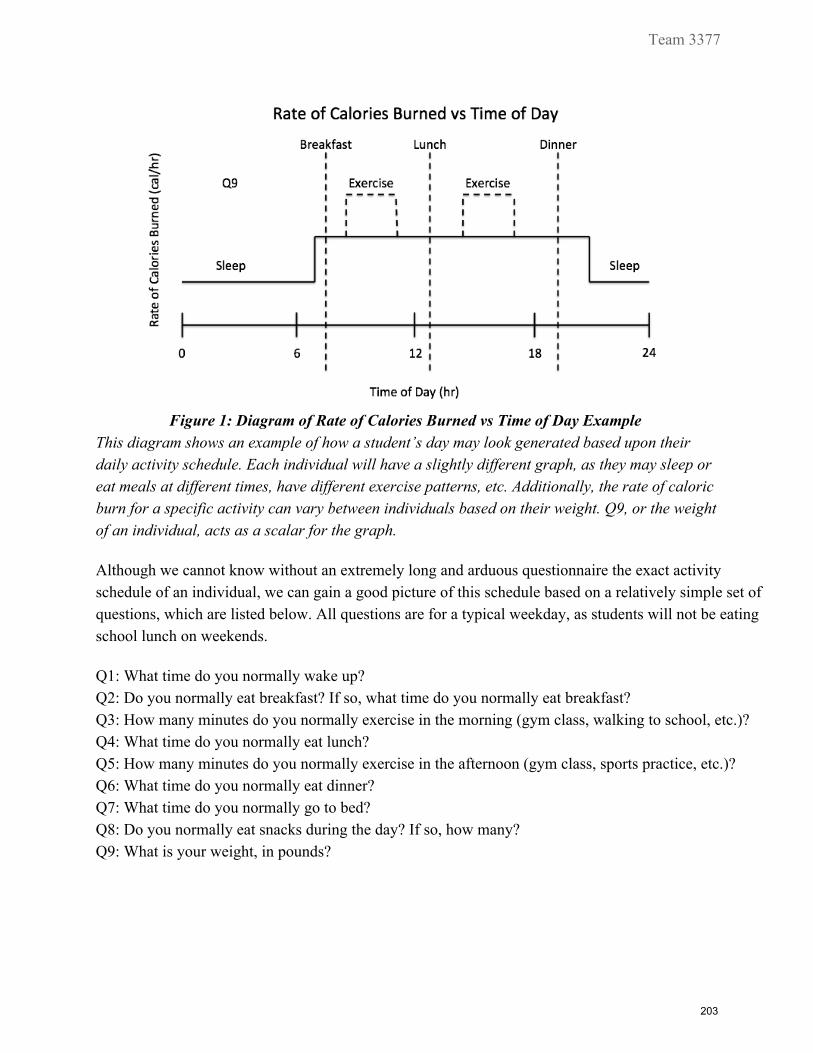
Figure 1: Diagram of Rate of Calories Burned vs Time of Day Example
This diagram shows an example of how a student’s day may look generated based upon their daily activity schedule. Each individual will have a slightly different graph, as they may sleep or eat meals at different times, have different exercise patterns, etc. Additionally, the rate of caloric burn for a specific activity can vary between individuals based on their weight. Q9, or the weight of an individual, acts as a scalar for the graph. Although we cannot know without an extremely long and arduous questionnaire the exact activity schedule of an individual, we can gain a good picture of this schedule based on a relatively simple set of questions, which are listed below. All questions are for a typical weekday, as students will not be eating school lunch on weekends. Q1: What time do you normally wake up? Q2: Do you normally eat breakfast? If so, what time do you normally eat breakfast? Q3: How many minutes do you normally exercise in the morning (gym class, walking to school, etc.)? Q4: What time do you normally eat lunch? Q5: How many minutes do you normally exercise in the afternoon (gym class, sports practice, etc.)? Q6: What time do you normally eat dinner? Q7: What time do you normally go to bed? Q8: Do you normally eat snacks during the day? If so, how many? Q9: What is your weight, in pounds?
203

Team 3377
Figure 2: Relation of Survey Questions to Mathematical Model This diagram shows how the questions in the survey influence the graph for example, survey question 1 determines where the sleeping activity level ends, question 3 determines the length of morning exercise, etc. Question 9 (“What is your weight?”) influences the graph because the rates of caloric burn are proportional to weight, scaling the rate of calories burned function.
To find the total calories burned throughout the day, and thus the number of calories that should be consumed per day, the function R(t) shown in Figure 1 is integrated (the integral of rate is equivalent to quantity) over time (in hours). The integral is then multiplied by the weight of the person (in pounds) in order to determine the total number of calories burned (the rate constants have units of calories/(hour*pound), so the result of the integral has units of calories/pound).
Since our rate equation R(t) is piecewise with constant values, the integral is equivalent to the area of the rectangles that can be drawn under the curve. As demonstrated in Figure 2, the rectangles are divided based on the changing activity states of an individual over the entire day, where the length in time of each activity state is determined by survey results.
204

Team 3377
where λs represents the rate of calorie burn while sleeping, λLA represents the rate while in a low activity state (sitting in class, playing video games, working on the computer, etc.), and λA represents the rate of calorie burn while doing physical activity (running, playing a sport, etc.). Of course, different physical activities can have different rates of calorie burn, but for simplicity we will only consider an average rate for a variety of physical activities. To determine the rate at which calories are burned by an individual during various activities, data from the Harvard Medical School was used. On average, while sleeping, an individual burns 0.2 cal/hr/lb, 0.83 cal/hr/lb during a low activity state, and 3.36 cal/hr/lb during a high activity state [6]. The time variables (Q1 ,Q3i , etc) are time values (represented in 24hour time format) relating to survey questions survey question 1 (“What time do you normally wake up?”) relates to variable Q1. In the survey we only asked for the duration of physical activity in the morning and afternoon and not the specific time, as the specific time is irrelevant to the result of the integral for our math, we simply assumed they occur directly after the meal they follow. The equation above returns the total number of calories burned over the entire day, but we are simply interested in the calories that must be consumed at lunchtime. To relate our rate function to the calories that must be consumed at lunchtime, we will reconsider assumption #5 (“We assume that the calories consumed at a meal are equivalent to the calories burned since the last full meal (minus any snacks consumed in the interim period)”). Thus, the amount of calories that must be consumed at lunchtime is the integral of our rate function, integrated just over the time since the previous meal. However, we must consider that the last meal eaten before lunch is not always breakfast as many high schoolers do not regularly eat this meal, and thus have not eaten since the night before. If a student eats breakfast, the calories that they must consume at lunchtime are given by:
However, if the student did not eat breakfast, they must consume a greater number of calories at lunchtime to make up for this deficit:
Since snacks partially make up the deficit of calories burned since the last meal, we subtract the number of calories of snacks eaten from the last meal when calculating the number of calories that must be consumed at lunch.
205

Team 3377
2.4 Justification and Testing of the Model In order to test and verify our method of calculating caloric need, we compared the results of our R(t) function integrated over the entire day (giving total calories burned) to the EER method of calculating calories (which is the method supported by the USDA). Since our method utilizes only data on activity levels throughout the day and weight, while the EER method uses minimal activity level data, opting to instead look at age, height, gender, and weight, we expect there to be some difference between these two methods. However, if the methods are relatively similar, that is a good indicator that our method is relatively accurate at calculating total daily caloric need. The EER method for students 918 years old can be evaluated as follows: Boys: ER 8.5 61.9 ge) A (26.7 eight) 903 eight))E = 8 − ( * A + P * ( *W + ( *H Girls: ER 35.3 30.8 ge) A (10 eight) 903 eight))E = 1 − ( * A + P * ( *W + ( *H Where PA is a physical activity indicator, weight is measured in kilograms and height is measured in meters [3]. The results of our comparison for a few random samples from our data set can be seen in Table 2 below. We used the appropriate EER equation (male/female) based on the gender information from the dataset for each student.
Subject Our Model (calories/day) EER (calories/day) Percent Error
1 3686.835 3095.701 19.10%
2 1222.931 1234.796 0.96%
3 1380.474 1581.693 12.72%
4 2218.507 2399.141 7.53%
Table 1: Sample of Data Set Analyzed Comparison of our suggested model to the EER in use currently with percent errors (using EER values as the “real” values) As seen above, our values are relatively similar to the EER values. Of course there is some deviation, which was expected as the data is evaluated in two significantly different ways, but overall we observe a good correlation. In fact, the average percent error between our model and the EER model, when averaged over the ~12,000 individuals in our data set, was 11.51%. For such different models, this is a remarkably close fit. Of course, in this analysis we are evaluating our function integrated over the entire day while again we are actually only interested in the lunchtime caloric need. However, considering assumption #5 to be
206
Team 3377
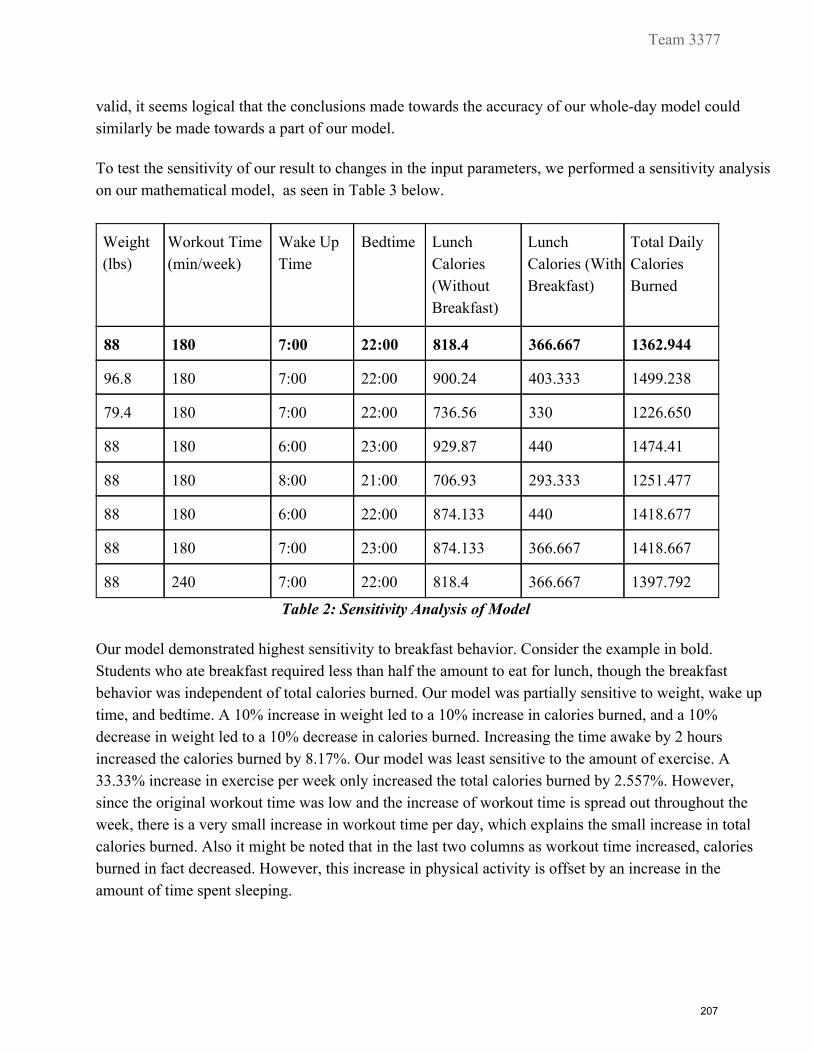
valid, it seems logical that the conclusions made towards the accuracy of our wholeday model could similarly be made towards a part of our model. To test the sensitivity of our result to changes in the input parameters, we performed a sensitivity analysis on our mathematical model, as seen in Table 3 below.
Weight (lbs)
Workout Time (min/week)
Wake Up Time
Bedtime Lunch Calories (Without Breakfast)
Lunch Calories (With Breakfast)
Total Daily Calories Burned
88 180 7:00 22:00 818.4 366.667 1362.944
96.8 180 7:00 22:00 900.24 403.333 1499.238
79.4 180 7:00 22:00 736.56 330 1226.650
88 180 6:00 23:00 929.87 440 1474.41
88 180 8:00 21:00 706.93 293.333 1251.477
88 180 6:00 22:00 874.133 440 1418.677
88 180 7:00 23:00 874.133 366.667 1418.667
88 240 7:00 22:00 818.4 366.667 1397.792
Table 2: Sensitivity Analysis of Model Our model demonstrated highest sensitivity to breakfast behavior. Consider the example in bold. Students who ate breakfast required less than half the amount to eat for lunch, though the breakfast behavior was independent of total calories burned. Our model was partially sensitive to weight, wake up time, and bedtime. A 10% increase in weight led to a 10% increase in calories burned, and a 10% decrease in weight led to a 10% decrease in calories burned. Increasing the time awake by 2 hours increased the calories burned by 8.17%. Our model was least sensitive to the amount of exercise. A 33.33% increase in exercise per week only increased the total calories burned by 2.557%. However, since the original workout time was low and the increase of workout time is spread out throughout the week, there is a very small increase in workout time per day, which explains the small increase in total calories burned. Also it might be noted that in the last two columns as workout time increased, calories burned in fact decreased. However, this increase in physical activity is offset by an increase in the amount of time spent sleeping.
207
Team 3377
3. Part 2: The Average Lunch Meal
3.1 Analysis of the Problem Although lunchtime meals are standardized to average caloric needs for students, there does not yet exist a single meal that can meet the requirements for every individual student. The caloric needs of students range widely. If meals are standardized to the “average” student, then three groups of students emerge resembling a Goldilocks scenario: one group of students does not obtain enough calories from the meal, one group consumes too many calories, and the final group has the appropriate caloric intake. We are interested in determining how many students will fall into each of these categories. 3.2 Assumptions 1. A student eating the standard school meal consumes the entire meal which contains the maximum caloric content as regulated by federal guidelines. The maximum caloric content of a high school lunch is 850 calories [7].
2. As long as the caloric consumption of a student at lunch is within 15% of their calculated need, their dietary needs will be considered to be satisfied. This is justified by the fact that a 15% variance in caloric intake from calculated need is able to maintain a person’s current weight [3]. It is undesirable to provide meals that under or overfeed students.
3.3 Design of the Model Based on the lunchtimecalorie calculator we designed in the Part 1, we can find the distribution of lunchtime caloric needs of high schoolers given a data set containing attributes that result from answers to our survey. Since we have not yet given out our survey and therefore do not yet have results of our own to analyze, we instead pulled data from the National Youth Physical Activity and Nutrition Study [1] that collected data from 11,458 participants from grades 912 across the nation about their physical attributes (height, weight, age, gender), the frequency at which they ate breakfast, and the rigor of their physical activity. Additionally, the distribution of sleep times for high school students was found and incorporated into the data set using probability distributions [4]. Below is a subset of the sample data that we based our calculations of lunchtime caloric need on.
208

Team 3377
Weight (lbs)
Days/Week Workout 60 min
Days/Week High Activity 20 min
Days/Week Eat Breakfast
Wake Up Time
Bedtime Total Calories Burned
195.593 6 6 1 6.169 26.441 4185.747
111.767 3 4 4 6.102 21.695 1950.074
207.567 1 2 4 5.831 23.864 3572.530
94.802 4 7 7 7.119 22.373 1671.269
Table 3: Sample of Data Set Analyzed
With this data, we were able to generate a frequency distribution of the lunchtime caloric needs of high schoolers in the United States. To determine the percentage of satisfied high schoolers, we find the frequency of high schoolers whose lunchtime caloric requirement fall between 723 and 978 calories (850 calories 15%) using Excel histogram functions.±
Figure 3
The above graph displays the frequency at which certain lunchtime caloric needs occur. The graph is split into population of students who eat or skip breakfast in the morning. The population average is 1049.7 calories and only 37.3% of all students will be satisfied by an 850 calorie lunch.
209

Team 3377
Figure 4
The charts show their respective graphs of lunchtime caloric need frequency distribution for students who skip (average: 1538.3 calories, stdev: 454.3 calories) or eat breakfast (average: 646.4 calories, stdev: 247.6 calories). For breakfast skippers, only 0.07% will be satisfied by an offering of 850 calories at lunch while 68% of breakfast eaters will be content. 3.4 Summary and Improvements Given the large sample size of this survey and its geographic scope, we can safely extrapolate our results from this data set to the general student population. After implementing our model, we found that the variable of whether or not a student has had breakfast in the morning was one of the biggest determinants of a student’s lunchtime calorie need. For the overall student population, only 37.9% of all students will be satisfied by the current standard lunch. If we split the population into those who consumed breakfast and those who didn’t, we find that breakfast eaters have a much higher satisfaction rate from their school lunch (68%) versus those who didn’t (0.07%). This is due to how in our model, if a student skipped their morning meal, their lunch will have to satisfy the extra caloric deficit that they accumulated overnight rather than just the deficit from when they woke up in the morning. Since only about a third of students normally eat breakfast, not considering these effects is a serious shortfall of current meal plans. If instead we have schools serve meals containing up to 1049 calories (the mean lunchtime need of all students, including those who do not eat breakfast), we will be able to satisfy 49% of all students using the 15% margin guideline. Seeing the large disparity between satiety in our populations who did and did not eat breakfast, the school can offer breakfast options if resources are available. Along with reducing the average calories required at lunch, it would also help students improve concentration in class. Alternatively, the school could provide differing lunch options for those who do and do not eat breakfast, allowing each group to better meet their needs. However, this requires more complex planning and execution, which could detract from its usefulness.
210
Team 3377
4. Part 3: Cafeteria Meal Planning
4.1 Analysis of the Problem In an ideal situation, nutritional needs will be the sole determinant of meal components. However, in an environment of resource scarcity and picky eaters, we need to consider budget constraints and food preferences along with nutrition. Given a $6 weekly food budget per student, we strive to develop a meal plan with recommendations on the amount of grains, fats, fruits, dairy, protein, and vegetables that should be offered. We view the budget constraint and USDA nutrition guideline as parameters that must be met in our recommended meal plan. What we optimize are the individual menu items that will be offered based upon indicated food preferences on a customized survey given to students in a specific area (school/district). This customized survey can be tailored to include different foods that are more available depending on the geographic location or socioeconomic standing of the school district. So given a set of menu options a school has, they will be able to use our model to determine the best options. In this section, we will present a model which can be applied to any school within a school district. Since different levels of schools have students of differing ages, each school level needs to tailor their meals to the caloric requirements of their students (as determined by our survey presented in Part 1). Since we do not yet have results to our survey, but have (in Part 2) found and analyzed a similar data set for a sample of high school students, we will use the results of this analysis to test the model we present in this section. However, if given survey results, this model could be applied to elementary and middle schools just as easily.
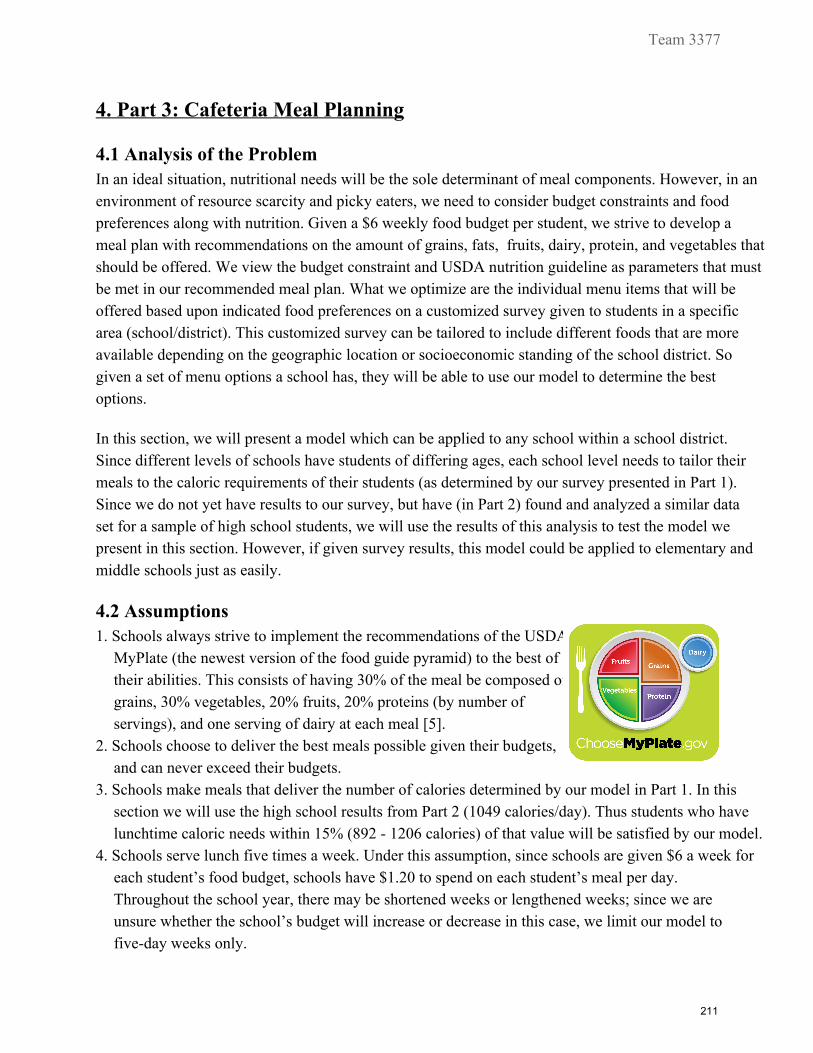
4.2 Assumptions 1. Schools always strive to implement the recommendations of the USDA MyPlate (the newest version of the food guide pyramid) to the best of their abilities. This consists of having 30% of the meal be composed of grains, 30% vegetables, 20% fruits, 20% proteins (by number of servings), and one serving of dairy at each meal [5].
2. Schools choose to deliver the best meals possible given their budgets, and can never exceed their budgets.
3. Schools make meals that deliver the number of calories determined by our model in Part 1. In this section we will use the high school results from Part 2 (1049 calories/day). Thus students who have lunchtime caloric needs within 15% (892 1206 calories) of that value will be satisfied by our model.
4. Schools serve lunch five times a week. Under this assumption, since schools are given $6 a week for each student’s food budget, schools have $1.20 to spend on each student’s meal per day. Throughout the school year, there may be shortened weeks or lengthened weeks; since we are unsure whether the school’s budget will increase or decrease in this case, we limit our model to fiveday weeks only.
211

Team 3377
5. It is possible to give fractional servings of every menu item. While this may present an issue for a few menu items (burgers), the large majority of foods can have servings easily split into fractions (think slicing pizza, scooping fruits and vegetables). For simplicity purposes, all menu items are assumed to be servable in fractional servings.
4.3 Design of the Model We based our model on the specification that schools must tailor their meals to meet several requirements. First, they must follow the most recent USDA requirements of meal category percentages based on the MyPlate requirements (30% grains, 30% vegetables, 20% fruits, 20% proteins (by servings), and 1 serving dairy). Second, they must make their meals have approximately the mean number of calories required by their students, as determined by the results of our model presented in Parts 1 and 2. For high school students, we found this value to be about 1050 calories, and we will use this in our evaluation of our model. The final requirement of our model is that the school meet the budgetary requirements $6/student/week. Since the goal of our model is to provide the optimal meals based on the three core requirements of nutrition, budget, and student acceptance, and since we have already fixed the nutrition and budget as requirements in our model (i.e. any solution that does not meet these requirements will be thrown out), the variable to optimize the meals by is logically that of student acceptance. Increasing student acceptance would also reduce the amount of food discarded due to disinterest. We do this as follows: Because of assumption #1, we know that, for the grains category,
.3 ervings ervings0 * S total = S grains
and similarly for each food category. Additionally, we know that
alories ervings alories ervings alories ..C total = S grains *C grain + S vegetables *C vegetable + .
where caloriesgrain is the calories/serving of a specific grain option and so on. If we substitute, we find that
.alories .3 ervings alories .3 ervings alories ..C total = 0 * S total *C grain + 0 * S total *C vegetable + .
Additionally, we know that
, or osts osts ervings ..C total = C grain * S grains + . osts osts .3 ervings ..C total = C grain * 0 * S total + .
where costs are given by serving.
212

Team 3377
Given a food in each food category for a specific meal and a caloric target, we can determine the necessary serving sizes for the food in each category, and using the cost/serving data, we can determine if the specific meal meets the budgetary requirements. Given a set of data containing a wide variety of different foods in each category, we can evaluate this function over every possible combination of foods (each possible meal) with one food per category. The meals that do not meet the budgetary requirements will be thrown out, while the meals meeting our nutrition and budgetary requirements are saved. Then, we simply need to determine which of these possible meals should be considered “best.” To choose the “best” meal choices out of every possible meal meeting our requirements, we must rank the meals based on our remaining unconsidered variable student acceptance. However, student acceptance ranges widely based on geographic location, age, socioeconomic status, etc. Therefore, it would be extremely difficult to pick a convincing student acceptance of a specific set of foods and attempt to apply it nationally. Instead, we choose to leverage the method we have used previously in this paper to survey the students. This time, we have a single question that will be repeated for each food option: “If served at student lunch, will you eat [Insert food option here]?”. This survey will return a set of percentages for each food option. To apply these student acceptances to ranking our meal choices, we will consider the percentage of students who will eat the entire meal as served which can be found by multiplying, for each food, the percentages of students who will eat that food together. For example,
.Eating Eating Eating Eating Eating Eating% meal = % chicken *% corn *% pasta *% apples *% yogurt This is a simple, yet powerful means of ranking the choices each food category is ranked with equal weight, and it is based on localized user feedback from the survey. This ranking will maximize the number of students who eat the entire meal, including foods from each category in the proper proportions. Of course, since the total probability is the product of a number of probabilities, the resulting probability of students eating the entire meal will likely be rather small however, this number is not specifically important as it is more importantly simply a measure of how well students will accept the meal compared to other choices.
4.4 Testing of the Model To test our model, we simulated an imaginary menu. For each menu item, we estimated the cost per serving, the amount of calories per serving, and the percentage of students that would eat that meal item. It should be noted that the actual results of this imaginary menu are not important this experiment is only run to show that our algorithm works as expected. Instead, each school should run this algorithm using the foods available in their area and the associated costs, and using the results from giving the
213
Team 3377
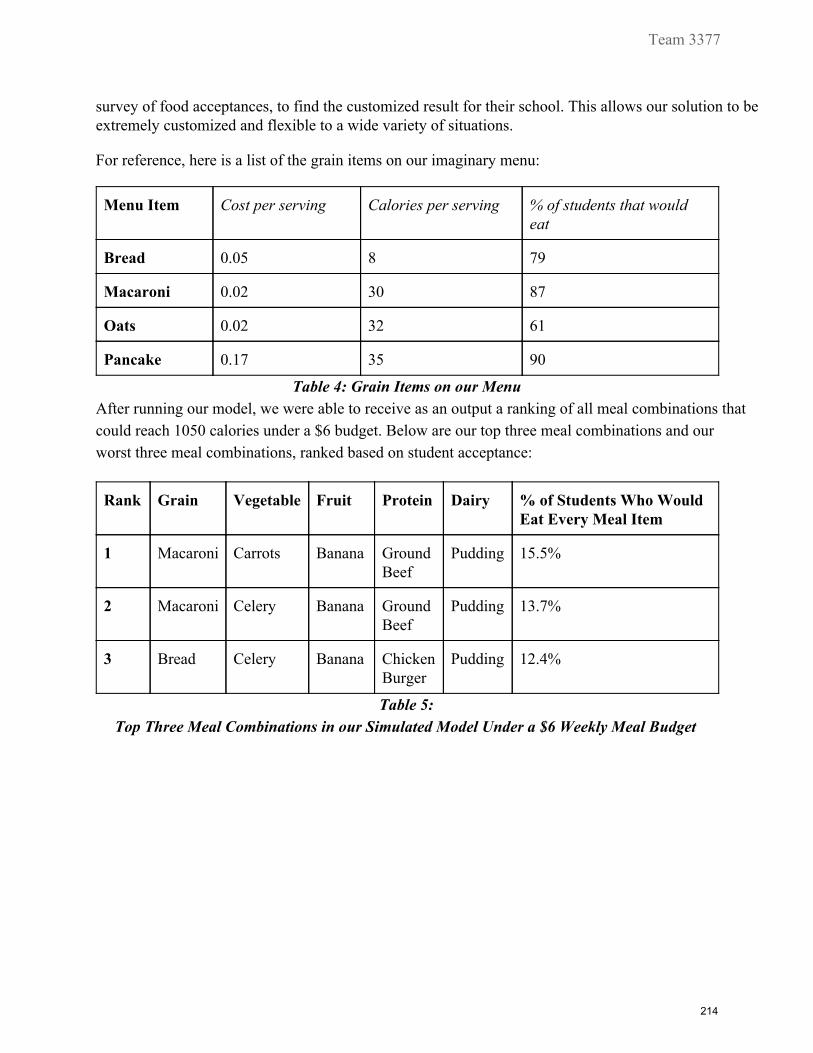
survey of food acceptances, to find the customized result for their school. This allows our solution to be extremely customized and flexible to a wide variety of situations. For reference, here is a list of the grain items on our imaginary menu:
Menu Item Cost per serving Calories per serving % of students that would eat
Bread 0.05 8 79
Macaroni 0.02 30 87
Oats 0.02 32 61
Pancake 0.17 35 90
Table 4: Grain Items on our Menu After running our model, we were able to receive as an output a ranking of all meal combinations that could reach 1050 calories under a $6 budget. Below are our top three meal combinations and our worst three meal combinations, ranked based on student acceptance:
Rank Grain Vegetable Fruit Protein Dairy % of Students Who Would Eat Every Meal Item
1 Macaroni Carrots Banana Ground Beef
Pudding 15.5%
2 Macaroni Celery Banana Ground Beef
Pudding 13.7%
3 Bread Celery Banana Chicken Burger
Pudding 12.4%
Table 5: Top Three Meal Combinations in our Simulated Model Under a $6 Weekly Meal Budget
214

Team 3377
Rank Grain Vegetable Fruit Protein Dairy % of Students Who Would Eat Every Meal Item
1 Oats Celery Banana Blackeye Beans
Milk 2.75%
2 Oats Celery Apple Blackeye Beans
Pudding 3.39%
3 Oats Celery Grapes Blackeye Beans
Pudding 3.72%
Table 6: Worst Three Meal Combinations in our Simulated Model Under a $6 Weekly Meal Budget
In the best meal, a combination of all the meal items would be eaten by 15.5% of the population. We also tested our model under $7 weekly meal budget per student. As expected, the top meal options “improved,” with 16.3% of students who would eat every item on the new ‘best’ meal.
Rank Grain Vegetable Fruit Protein Dairy % of Students Who Would Eat Every Meal Item
1 Macaroni Carrots Banana Chicken Burger
Ice Cream
16.3%
2 Pancake Carrots Banana Ground Beef
Pudding 16.1%
3 Macaroni Carrots Banana Chicken Burger
Pudding 16.0%
Table 7: Top Three Meal Combinations in our Simulated Model Under a $7 Weekly Meal Budget
It should be noted that our nutrition requirements were based only on meeting the MyPlate food category percentages and the caloric amounts found in Parts 1 and 2. Factors such as fat and sugar content were not considered in this model, explaining seemingly “unhealthy” food choices such as ice cream in our topranked meals. A final thing to note is that schools often do not serve just one meal option; it is not unusual for a school to give several options for each meal category. As a result, schools implementing our model would be able to satisfy even more students than our simulations indicate. Of course, we recommend that schools provide variety to students by serving a variety of the topranking meals, and not just the top two or three meals.
215

Team 3377
5. Strengths and Weaknesses Our model provides an excellent way for schools to evaluate the nutritional requirements of their students and to adapt their meals to fit these requirements. However, there are both strengths and weaknesses to our model. The strengths of our model include: 1. Our model specializes in determining the number of calories a student needs to consume for lunch, taking into account factors such as breakfast habits and snacking patterns that are often not considered in typical calorie calculators.
2. Our model can be easily customized to local regions using the included survey. 3. Our model is able to provide a set of meals to cafeterias that will be wellliked by students, while also meeting nutrition and budgetary restrictions. Additionally, since the data is locallysourced through a provided survey, students will benefit by feeling involved in the mealplanning process while cafeteria workers will benefit from being able to easily meet the needs of students.
Our model also contains several weaknesses as follows: 1. We assume that at each meal a student eats until they are fully satiated. However, due to time constraints a person might not always have enough time to consume as much as they’d like especially in the morning.
2. We also assume that rates of metabolic activity are constant in time periods as determined by our questionnaire. It would be conceivable that during some activities such as a workout, the metabolic rate will fluctuate. Additionally, eating and activity patterns may vary daytoday.
3. Our mealplanning algorithm does not currently handle multicategory foods such as pizza (pizza contains grains, vegetables, and dairy). With minimal additional work this could be incorporated, but was left out for simplicity.
4. Meal choices were made based on nutritious factors including MyPlate food category percentages and caloric needs but not based on considerations such as fat and sugar content.
A feature that is both a weakness and strength of our model is the extent of user input of data required in determining the optimum meal plan. On one hand, this allows our model to be highly tailored to regional preferences and availability of food. However, it does require the school or district to collect data describing calories and cost per serving information along with information regarding student food preferences.
6. Conclusion In our solution, we created a mathematical model that calculates the amount of calories that a student (ages 618 years) needs at lunch based off personal parameters such as amount of sleep, whether or not breakfast was consumed, time spent exercising in the morning and afternoon, lunch and dinner meal times, and frequency of snacking. These attributes were used to generate a function of the user’s metabolic rate over the day and caloric need at a certain point in time is calculated by finding the area
216

Team 3377
under the function from the point of their last meal until the desired time point. An error analysis comparing total caloric requirement calculated with our method and the Institute of Medicine Estimated Energy Requirement showed that the two calculations differed by only 11.51% which is negligible considering the differences in two methods and the fact that the EER calculated claimed a variance of 15%. We then applied our model to find the percentage of high school students who are satisfied with the current lunch offering by using calculator to determine a distribution of calorie needs and how well those needs matched up to the caloric content of a typical 850 calorie school lunch. We found that only 37.9% of students were satisfied and upon analyzing our distribution, we found that the optimum lunch offering would contain 1050 calories to satisfy 49% of the population. Caloric need was also greatly stratified based on whether or not the student ate breakfast. With this discovery, a novel option schools can offer is breakfast. This would improve the overall percentage of students who would be satisfied by lunch options and keep students focused on classroom content instead of their hunger. Finally we developed an algorithm to recommend meal plans to schools based on their budget, nutritional requirements, and student food preferences. What we have found in this undertaking is a way to make sure students have access to meals that make them healthy and happy for optimum school performance and the development of beneficial lifelong habits.
217

Team 3377
7. References 1. "Adolescent and School Health National Youth Physical Activity and Nutrition Study." Center
for Disease Control and Prevention. N.p., n.d. Web. 8 Mar 2014. <http://www.cdc.gov/healthyyouth/yrbs/nypans.htm>.
2. "AgeWeight Chart : Girls Age 2 20 Years." AgeWeight Chart : Girls Age 2 20 Years. Center of Disease Control and Prevention, 2008. Web. 08 Mar. 2014. <http://www.weightchart.com/age-weight-chart-girls-20years.aspx>.
3. "Institute of Medicine Estimated Energy Requirement ."GlobalRPH. N.p.. Web. 8 Mar 2014. <http://www.globalrph.com/estimated_energy_requirement.cgi>.
4. Kalenkoski, Charlene M., David C. Ribar, and Leslie S. Stratton. Research in Labor Economics. Ed. Solomon W. Polachek and Konstantinos Tatsiramos. Vol. 33. Bingley: Emerald, 2011. Print.
5. Moore, Caitlin. "Nutrition 101." Clemson University. N.p., n.d. Web. 8 Mar 2014. <http://www.clemson.edu/centers-institutes/sullivan/patients/nutrition101/>.
6. "New Releases." Calories Burned in 30 Minutes of Leisure and Routine Activities. Harvard Health Publications, July 2004. Web. 08 Mar. 2014. <http://www.health.harvard.edu/newsweek/Calories-burned-in-30-minutes-of-leisure-and-routine-activities.htm>.
7. Yee, Vivian. "No Appetite for GoodforYou School Lunches." NY Times . N.p., 05 Oct 2012. Web. 8 Mar 2014. <http://www.nytimes.com/2012/10/06/nyregion/healthier-school-lunches-face-student-rejection.html?pagewanted=all>.
218