executive summary of draft eia report tagoor laboratories
TRANSCRIPT

EXECUTIVE SUMMARY
OF
DRAFT EIA REPORT
OF
TAGOOR LABORATORIES PVT. LTD.
For
Proposed Bulk Drugs & Intermediates
Manufacturing Unit
AT
Sy No: 29, Tupakulagudem (V) Tallapudi (M),
West Godavari District, Andhra Pradesh
PREPARED BY
Rightsource Industrial Solutions Pvt. Ltd
Plot No: 203, H.No:5-36/203, Prashanthi Nagar,
IDA, Kukatpally, Hyderabad – 500072.
Ph: 040-65873137, 23070602, 23075699, 40126589.
Fax: 040-23070602. Mail: [email protected]
NABET Accreditation No. NABET/EIA/1518/SA 038

Executive Summary of Draft EIA Report Tagoor Laboratories Pvt. Ltd.
Prepared By Rightsource Industrial Solutions Pvt. Ltd. Page 1
1. INTRODUCTION
Tagoor Laboratories Pvt. Ltd (Formerly known as Vensub Laboratories Pvt.
Ltd.) proposed Bulk Drugs & Intermediates manufacturing unit at Sy No: 29,
Tupakulagudem (V), Tallapudi (M), West Godavari District, Andhra Pradesh.
The proposed project cost is about Rs. 42 Crores, which includes construction of the
buildings, equipment, machinery and greenbelt development.
The unit has obtained Environment Clearance vide EC order No. J-11011/401/2014-
IA-II (I) Dt: 01/08/2017 in the name of Vensub Laboratories Pvt. Ltd. The unit has
submitted the proposal for transfer of EC in the name of “Tagoor Laboratories Pvt.
Ltd” on 28/08/2017. The Environmental Clearance issued was revoked by
MoEF&CC on 25/04/2018, stating reason that “Not informing the name change prior
to submission/ issue of EC as the name was changed before EAC meeting.”
The proponent has submitted a fresh application in prescribed FORM-I along with
necessary enclosures for obtaining Terms of Reference to MoEF&CC, GOI, New
Delhi.
The project proposal has granted with Standard Terms of Reference vide F. No: J-
11011/368/2014-IA II (I) Dated on 04th Feb 2019, to carryout EIA Study. The
Environmental monitoring and analysis was carried out during the period of October
to December – 2018 and Draft EIA Report was prepared and submitted for Public
Consultation.
1.1. PROJECT DESCRIPTION
The salient features of the unit are furnished below.
TABLE 1: SALIENT FEATURES OF THE PROJECT
Project location Details
Latitude & Longitude Latitude: 17009’30.20” N Longitude: 81035’23.36” E
Climatic Conditions
Annual Max Temp is 42.7 0C Annual Min Temp is 14.6 0C Normal Annual Rainfall is 1100 mm (Source: IMD Climatalogical Normals, Nidadavolu 1981 - 2010)
Land acquired for the plant 11.80 Acres (47752.9 Sq. m)
Land use Industrial use

Executive Summary of Draft EIA Report Tagoor Laboratories Pvt. Ltd.
Prepared By Rightsource Industrial Solutions Pvt. Ltd. Page 2
2.0 PROCESS DESCRIPTION
The manufacturing process of Proposed Bulk Drugs & Intermediates consists of
chemical synthesis extending to stages of processing involving different type of
chemical reactions. Total production capacity of proposal will be 200 TPM. (Given in
Table 2). The unit will take adequate control measures for storage and handling of
Raw materials and cylinders with in factory premises.
Nearest Habitation Gopavaram Village - 1.43 Km (N)
Nearest Town Kovvur - 20 Km (SE)
Major urban Settlements Rajahmundry – 24 Km (SE)
State Highway National Highway Railway station Airport
State Highway No. 42 – 17 Km (W) (Koyyalgudem - Nallajerla) National Highway No. 16 – 26 Km (SE) (Rajahmundry – Anakapalle) Kovvur Railway Station – 22 Km (SE) Rajahmundry Airport - 24 Km (ESE)
Major Industries near the plant site
1. Andhra Sugar Limited (Chemical & Fertilizer Unit)
2. Whitefield Paper Mill Ltd. 3. Srinivasa Industries 4. Bio Ethanol Agro Industries Limited 5. Sri Lakshmi Industries 6. Sri Vijayalakshmi pulp & packing industry 7. Cardaphenol Industries
National Parks None within 10 Km radius
Wild life sanctuary None within 10 Km radius
Historical Places None within 10 Km radius
Water Bodies within 10 km radius
Tadipudi lift canal – 1.50 Km (S) Tank near Bhimolu – 2.65 Km (SW) River Godavari– 7.8 Km (E) Kovada Kalva - 6.25 Km (N) Polavaram Right Canal - 3.5 Km (WNW) Tank near Ramannapalem – 7.80 Km (N) Pendrala Kalva - 8.4 Km (NW) Kovvada Kalva Reservoir – 9.62 Km (NW)
Reserve Forest within 10 km radius
Fairly dense Jungle near Gopavaram - 1.2 Km (WNW) Dense Mixed Jungle near Hukumpet - 4.8 Km (NNW) Mixed Jungle near Rajampalem - 5.1 Km (NNW) Vinjaram RF -9.1 Km (NNW) Karakapadu RF – 9.4 Km (NW) Polavaram RF- 9.6 Km (N)

Executive Summary of Draft EIA Report Tagoor Laboratories Pvt. Ltd.
Prepared By Rightsource Industrial Solutions Pvt. Ltd. Page 3
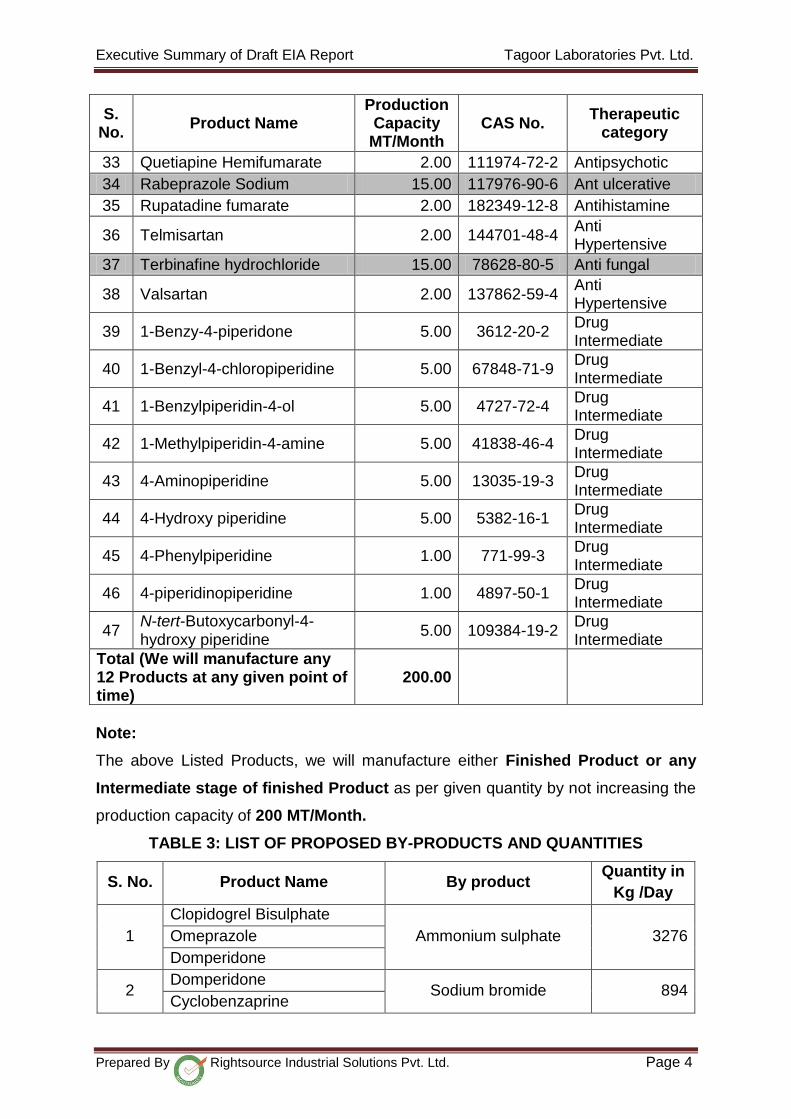
TABLE 2: LIST OF PROPOSED PRODUCTS AND QUANTITIES
S. No.
Product Name Production
Capacity MT/Month
CAS No. Therapeutic
category
1 Abacavir sulfate 2.00 188062-50-2 Anti HIV
2 Amitriptyline 10.00 549-18-8 Antidepressant
3 Atrovastatin Calcium 5.00 134523-03-8 Hypercholesterolemia
4 Bupropion 5.00 34841-39-9 Anti depressant
5 Carisoprodol 2.00 78-44-4 Muscle Relaxant
6 Clopidogrelbisulfate 5.00 135046-48-9 Antithrombotic
7 Cyclobenzaprine HCl 5.00 6202-23-9 Muscle relaxant
8 Cyproheptadine HCl 10.00 41354-29-4 Anti allergic
9 Desloratadine 5.00 100649-74-8 Antihistamine
10 Domperidone 30.00 57808-69-9 Anti emetic
11 Domperidone maleate 2.00 99497-03-7 Anti emetic
12 Donepezil HCl 1.00 12004-70-3 Alzheimer’s disease
13 Ebastine 5.00 90729-43-4 Anti allergic
14 Esomeprazole Sodium 3.00 161796-78-7 Anti ulcerative
15 Esomeprazole Magnesium trihydrate
3.00 217087-09-7 Anti ulcerative
16 Fexofenadine Hydrochloride 15.00 143439-40-8 Anti histamine
17 Haloperidol 2.00 52-86-8 Antipsychotic
18 Itopride Hydrochloride 2.00 122892-31-3 Antispasmodics
19 Itraconazole 10.00 84625-61-6 Antifungal
20 Ketrolac Tromethane 2.00 74103-07-4 Anti Inflammatory
21 Lansoprazole 10.00 103577-45-3 Ant ulcerative
22 Loperamide Hydrochloride 10.00 34552-83-5 Anti diarrhea agent
23 Losartan Potassium 15.00 124750-99-8 Anti Hypertensive
24 Nebivolol HCl 2.00 99200-09-6 Anti Hypertensive
25 Nortriptyline HCl 2.00 894-71-3 Anti depressant
26 Omeprazole 40.00 73590-58-6 Anti ulcerative
27 Omeprazole Sodium 2.00 95510-70-6 Ant ulcerative
28 Omeprazole Magnesium Dihydrate
2.00 95382-33-5 Ant ulcerative
29 Oxatomide 1.00 60607-34-3 Antihistamine
30 Pantoprazole Sodium Sesqui Hydrate
20.00 164579-32-2 Ant ulcerative
31 Pimozide 2.00 2062-78-4 Antipsychotic
32 Pregabalin 2.00 148553-50-8 Epileptic
Executive Summary of Draft EIA Report Tagoor Laboratories Pvt. Ltd.
Prepared By Rightsource Industrial Solutions Pvt. Ltd. Page 4
S. No.
Product Name Production
Capacity MT/Month
CAS No. Therapeutic
category
33 Quetiapine Hemifumarate 2.00 111974-72-2 Antipsychotic
34 Rabeprazole Sodium 15.00 117976-90-6 Ant ulcerative
35 Rupatadine fumarate 2.00 182349-12-8 Antihistamine
36 Telmisartan 2.00 144701-48-4 Anti Hypertensive
37 Terbinafine hydrochloride 15.00 78628-80-5 Anti fungal
38 Valsartan 2.00 137862-59-4 Anti Hypertensive
39 1-Benzy-4-piperidone 5.00 3612-20-2 Drug Intermediate
40 1-Benzyl-4-chloropiperidine 5.00 67848-71-9 Drug Intermediate
41 1-Benzylpiperidin-4-ol 5.00 4727-72-4 Drug Intermediate
42 1-Methylpiperidin-4-amine 5.00 41838-46-4 Drug Intermediate
43 4-Aminopiperidine 5.00 13035-19-3 Drug Intermediate
44 4-Hydroxy piperidine 5.00 5382-16-1 Drug Intermediate
45 4-Phenylpiperidine 1.00 771-99-3 Drug Intermediate
46 4-piperidinopiperidine 1.00 4897-50-1 Drug Intermediate
47 N-tert-Butoxycarbonyl-4-hydroxy piperidine
5.00 109384-19-2 Drug Intermediate
Total (We will manufacture any 12 Products at any given point of time)
200.00
Note:
The above Listed Products, we will manufacture either Finished Product or any
Intermediate stage of finished Product as per given quantity by not increasing the
production capacity of 200 MT/Month.
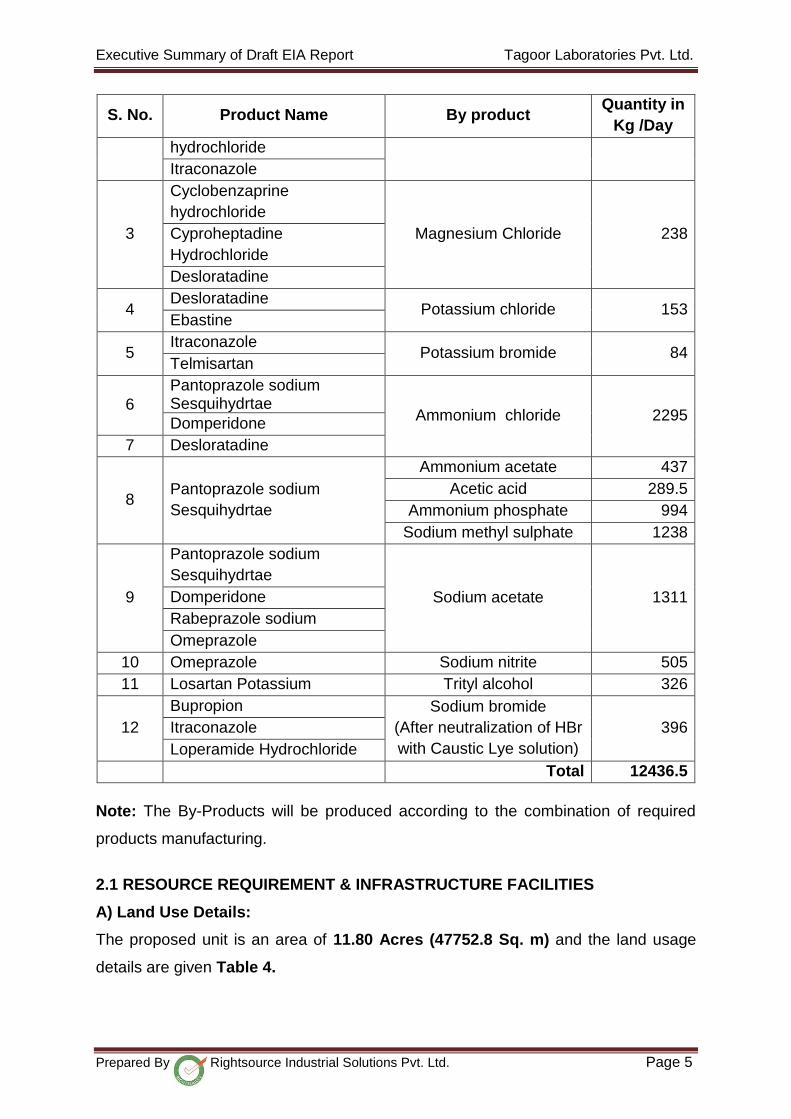
TABLE 3: LIST OF PROPOSED BY-PRODUCTS AND QUANTITIES
S. No. Product Name By product Quantity in
Kg /Day
1
Clopidogrel Bisulphate
Ammonium sulphate 3276 Omeprazole
Domperidone
2 Domperidone
Sodium bromide 894 Cyclobenzaprine
Executive Summary of Draft EIA Report Tagoor Laboratories Pvt. Ltd.
Prepared By Rightsource Industrial Solutions Pvt. Ltd. Page 5
S. No. Product Name By product Quantity in
Kg /Day
hydrochloride
Itraconazole
3
Cyclobenzaprine
hydrochloride
Magnesium Chloride 238 Cyproheptadine
Hydrochloride
Desloratadine
4 Desloratadine
Potassium chloride 153 Ebastine
5 Itraconazole
Potassium bromide 84 Telmisartan
6
Pantoprazole sodium Sesquihydrtae
Ammonium chloride 2295 Domperidone
7 Desloratadine
8 Pantoprazole sodium
Sesquihydrtae
Ammonium acetate 437
Acetic acid 289.5
Ammonium phosphate 994
Sodium methyl sulphate 1238
9
Pantoprazole sodium
Sesquihydrtae
Sodium acetate 1311 Domperidone
Rabeprazole sodium
Omeprazole
10 Omeprazole Sodium nitrite 505
11 Losartan Potassium Trityl alcohol 326
12
Bupropion Sodium bromide
(After neutralization of HBr
with Caustic Lye solution)
396 Itraconazole
Loperamide Hydrochloride
Total 12436.5
Note: The By-Products will be produced according to the combination of required
products manufacturing.
2.1 RESOURCE REQUIREMENT & INFRASTRUCTURE FACILITIES
A) Land Use Details:
The proposed unit is an area of 11.80 Acres (47752.8 Sq. m) and the land usage
details are given Table 4.

Executive Summary of Draft EIA Report Tagoor Laboratories Pvt. Ltd.
Prepared By Rightsource Industrial Solutions Pvt. Ltd. Page 6
TABLE 4: PROPOSED LAND USE DETAILS
S. No. DESCRIPTION AREA IN Sq. m AREA IN ACRES AREA IN %
1 Total Built up Area 10214.0 2.52 21.39
2 Green Belt Area 15899.0 3.93 33.29
3 Roads & Open Area 21639.8 5.35 45.32
TOTAL 47752.8 11.80 100
33.29 % of Land is allotted For Green Belt Development
B) Proposed Water Consumption Details
TABLE 5: PROPOSED WATER CONSUMPTION DETAILS
S. No Purpose Water input KLD
1 Process 133.46
2 Washings 10.00
3 Boiler make up 106.00
4 Cooling towers make up 242.00
5 Scrubbing system 10.80
6 Domestic 11.00
7 Gardening 12.00
Total 525.26
Recovered water 144.09 KLD from ZLD system is reused.
Water recovery from process 60.47 KLD is reused
Water recovery from Sodium bromide salt 0.685 KLD is reused.
Fresh water requirement = 525.26 – (144.09+60.47+0.685)
= 320.02 KLD
The fresh water of 320.02 KLD will be met from Godavari River.
The industry has obtained permission for drawl of 600 KLD from river Godavari by
Irrigation department vide proceeding No: CE/ GDS/ DWM/ OT1/ AEE1/ 61D dated:
14.02.2019.
C) Energy Requirement
Power requirement of proposed project will be made available through Andhra
Pradesh Southern Power Distribution Corporation Limited [APSPDCL]. The power
requirement of the project will be 2200 KVA.

Executive Summary of Draft EIA Report Tagoor Laboratories Pvt. Ltd.
Prepared By Rightsource Industrial Solutions Pvt. Ltd. Page 7
D) Utilities:
For generation of Steam, the industry proposed to use 6 TPH & 12 TPH Coal fired/
organic fuel briquette boilers. The fuel requirement is 63 MT/Day will be met from
local authorized sources.
The unit has proposed to install 2 Nos. x 1000 KVA DG sets, for usage during the
power failures.
The emission details are presented in Tables 7, 8 & 9.
TABLE 6: DETAILS OF UTILITIES
TABLE 7: STACK EMISSION CHARACTERISTIC DETAILS OF BOILERS
Particulars Units 12.0 TPH 6.0 TPH
Type of Fuel -- Indian Coal/ Organic
fuel briquette Indian Coal/ Organic
fuel briquette
Coal/ organic fuel briquette consumption
TPD 48 15
Ash Content % 35 35
Sulphur Content % 0.3 0.3
No. of Stacks No 1 1
Height of the stack m 36 30
Diameter of the stack m 0.6 0.45
Temperature of Flue Gas
oC 220 180
Velocity of Flue Gas m/s 20 18
Emission Rate
Particular Matter as PM (After APCE)
gm/sec 0.78 0.24
Sulphur dioxide gm/sec 2.67 0.83
Oxides of Nitrogen gm/sec 5.84 1.82
Control Equipment
Pollution control equipment
- Cyclone separator followed by suitable pack of Bag filters
S. No
Description Capacities
1 Coal fired/ organic fuel briquette boiler
6 TPH &12 TPH
2 Thermic Fluid Heater 2,00,000 Kcal/hr
3 D.G. Set 2 Nos. x 1000 KVA
4 Cooling Towers 5 x 500 TR & 5 x 200 TR
5 Electricity supply from APSPDCL.
2200 KVA
Fuel Consumption
6 Coal/ organic fuel briquette 63 TPD
7 Diesel 800 Liters/ Day

Executive Summary of Draft EIA Report Tagoor Laboratories Pvt. Ltd.
Prepared By Rightsource Industrial Solutions Pvt. Ltd. Page 8
TABLE 8: STACK EMISSION DETAILS FOR THERMIC FLUID HEATER
Particulars Units 2,00,000 kcal/hr.
Thermic fluid heater
Thermo pack Boiler Capacity Kcal/hr. 2,00,000
Type of Fuel -- Diesel
Stack Temperature Before Air preheater
oC 250
Stack Temperature After Air preheater
oC 180
Stack Height m 9.0
Fuel Consumption per Day TPD 0.75
Diameter m 0.30
TABLE 9: STACK EMISSION DETAILS OF PROPOSED DG SETS
Capacity in KVA
Emission of SPM in mg/Nm3
Emission Of SO2 in mg/Nm3
Emission of NOx
in mg/Nm3
Stack dia. in m
Flue Gas Temp. in
OC
Stack Height in m
Flue gas Velocity in m/sec.
1000 KVA 80 120 160 0.3 375 10 17
1000 KVA 80 120 160 0.3 375 10 17
E) Pollution Control Equipment:
i) Cyclone separator: The denser particles which are carried away by boiler flue
gases will get separated in the cyclone separator and collected in the bottom of the
cyclone separator at a definite interval.
ii) Bag Filter: The boiler flue gases from cyclone separator enter into pack of bag
filters, where particulate matter will be separated leaving as cake on bags surface.
They are cleared by shaking or vibrating by pulse jet causing the filter cake to be
loosened and to fall in the Hopper.
iii) Boiler Stack: The adequate stacks of height 36 mtrs & 30 mtrs will be provided
for pollutants (SO2, NOx, PM & CO) dispersed in a very large area so that ground
level concentration is within CPCB permissible limits.
iv) Scrubbers: Two scrubbers of 2-Stage are proposed to scrub the HCl, NH3 &
SO2. The packing media in the scrubber is 25 mm poly propylene rings.
3. BASELINE ENVIRONMENTAL STATUS
3.1 Study Area Included In Environmental Setting
Studies were carried out in about 10 km radius area from the site with respect to
meteorology, flora, fauna, land and socio-economies of the area. Further sampling
and analysis of air quality, water quality, noise level and soil quality were carried out.

Executive Summary of Draft EIA Report Tagoor Laboratories Pvt. Ltd.
Prepared By Rightsource Industrial Solutions Pvt. Ltd. Page 9
The air quality, water quality, noise level and soil quality in the study area is
evaluated based on this physical sampling and analysis.
The base line data were monitored during the study period of October – December
2018. The study team conducted site surveys and field experiments for gathering the
information on air quality, water quality, noise quality and soil quality.
3.2 CLIMATE OF THE STUDY AREA
A. Temperature:
During the study period the minimum and maximum temperatures were recorded as
17 ⁰C and 38 °C respectively.
B. Relative Humidity:
During study period at project site during study period, the relative humidity was
recorded as 70 %
C. Wind Pattern during Study Period
Dispersion of different air pollutants released into the atmosphere has significant
impacts on neighborhood air environment. The dispersion/dilution of the released
pollutant over a large area will result in considerable reduction of the concentration of
a pollutant. The dispersion in turn depends on the weather conditions like the wind
speed, wind direction, temperature, relative humidity, mixing height, cloud cover and
also the rainfall in the area.
Wind speed and direction data recorded during the study period is useful in
identifying the influence of meteorology on the air quality of the area. Wind roses on
sixteen sector basis have been drawn. Wind directions and wind speed frequency
observed during study period is given in Table 3.4 and wind rose diagrams was
given in Figure 3.2 (Chapter-3 in EIA Report)
The following observations can be made from the collected data;
Calm period is observed to be 3.71 % during the time of monitoring.
The predominant wind direction is NE & E.
Other than predominant wind directions wind was blowing in NE direction.
Average wind speed is 3.8 Km/hr.
Executive Summary of Draft EIA Report Tagoor Laboratories Pvt. Ltd.
Prepared By Rightsource Industrial Solutions Pvt. Ltd. Page 10
Mostly the wind speeds are observed in the wind rose are in the range of 3.6
– 5.7 Km/hr, 2.10 – 3.6 Km/hr and 0.5 – 2.1 Km/hr with frequency of
distribution percentages ranges from 0 to 15.4.
D. Rainfall
Rainfall during the Study Period at the Project Site is 28 mm. Normal annual rainfall
is 1100 mm. (Source: IMD Climatatological Normals, Nidadavolu 1981 - 2010)
3.3 SAMPLING LOCATION DETAILS
Total eight locations were selected for Base line status. Air, Water & Noise results
are presented in Table 10, 11 & 12 respectively.
3.4 AMBIENT AIR QUALITY
The ambient air monitoring was carried out for 24 hours a day, twice a week for 12
week per location in the study area. Ambient Air Quality Monitoring (AAQM) was
carried out at eight locations during period of October – December, 2018.
1. Particulate Matter (PM10)
The maximum, minimum, average and 98th percentile concentrations for PM10 were
recorded in the study area in the range of 41.5 – 70.5 μg/ m3. The maximum 98th
Percentile concentration is 70.3 μg/ m3 were recorded at Project location. The
concentrations of PM10 are well below the CPCB standard of 100 μg/ m3.
2. Particulate Matter (PM2.5)
The CPCB Standard for concentration of PM2.5 is 60 μg/ m3. The maximum,
minimum, average and 98th percentile concentrations for Particulate Matter (PM2.5)
monitored in the study area were 16.6 – 28.2 μg/m3 respectively. Highest 98th
percentile value is 28.1 μg/ m3 was at Project location. The concentration of PM2.5 is
well below the prescribed limit of 60 μg/ m3.
3. Sulphur Dioxide (SO2)
The Minimum, maximum, average and 98th percentile value of Sulphur dioxide in the
study area from the monitored data was in the range of 9.2 – 15.7 μg/ m3. Maximum
98th Percentile value of Sulpur dioxide is 15.6 μg/ m3 obtained at Project location.
The concentration of SO2 is well below the prescribed limit of 80 μg/ m3.

Executive Summary of Draft EIA Report Tagoor Laboratories Pvt. Ltd.
Prepared By Rightsource Industrial Solutions Pvt. Ltd. Page 11
4. Oxides of Nitrogen (NOx)
Ambient air quality status monitored for oxides of nitrogen in the study area were in
the range with maximum, minimum, average and 98th percentile values between
16.6 – 23.1 μg/ m3. The maximum 98th Percentile value is 23.0 μg/ m3 was prevailing
at the time of sampling at Project location. The concentration of NOX is well below
the prescribed limit of 80 μg/ m3.
5. Carbon Monoxide (CO)
The maximum, minimum, average and 98th percentile concentrations for Carbon
Monoxide (CO) monitored in the study area were 0.32 – 0.62 mg/m3 respectively.
Highest 98th Percentile value is 0.62 mg/ m3 was recorded at the Project location.
The concentration of CO is well below the prescribed limit of 2 mg/ m3
6. Ammonia (NH3)
The maximum, minimum, average and 98th percentile concentrations for Ammonia
(NH3) monitored in the study area were in the range of 21.9 – 28.4 μg/m3
respectively. Highest 98th percentile value is 28.3 μg/ m3 was recorded at Project
location. The concentration of NH3 is well below the prescribed limit of 400 μg/ m3.
7. Volatile Organic Compounds (VOCs)
Volatile Organic Compounds (VOCs) concentration in study area was found to be
Below Detectable Limit of 1 ppm.
The ambient air quality monitoring results indicates that the overall air quality in the
study area is within permissible standards prescribed by NAAQ Standards.

Executive Summary of Draft EIA Report Tagoor Laboratories Pvt. Ltd.
Prepared By Rightsource Industrial Solutions Pvt. Ltd. Page 11
TABLE 10: AAQ MONITORING RESULTS OF POST MONSOON SEASON
Code Name of Sampling Location
PM10 (µg/m3) PM2.5 (µg/m
3) SO2 (µg/m
3) NOX (µg/m
3) CO (mg/m
3) NH3 (µg/m
3)
Min Max 98th
Min Max 98th
Min Max 98th
Min Max 98th
Min Max 98th
Min Max 98th
A1 Project Site 58.7 70.5 70.3 23.5 28.2 28.1 13.0 15.7 15.6 20.4 23.1 23.0 0.43 0.62 0.62 25.7 28.4 28.3
A2 Gopavaram 48.4 63.4 62.9 19.4 25.4 25.2 10.8 14.1 14.0 18.2 21.5 21.4 0.33 0.58 0.58 23.5 26.8 26.7
A3 Bhimolu 42.5 57.4 56.8 17.0 23.0 22.7 9.4 12.8 12.6 16.8 20.2 20.0 0.42 0.60 0.60 22.1 25.5 25.3
A4 Rampalem 48.5 58.7 58.5 19.4 23.5 23.4 10.8 13.0 13.0 18.2 20.4 20.4 0.33 0.57 0.57 23.5 25.7 25.7
A5 Annadevarapeta 43.8 59.7 58.4 17.5 23.9 23.3 9.7 13.3 13.0 17.1 20.7 20.4 0.37 0.57 0.56 22.4 26.0 25.7
A6 Gajjaram 41.5 62.9 62.5 16.6 25.2 25.0 9.2 14.0 13.9 16.6 21.4 21.3 0.39 0.58 0.58 21.9 26.7 26.6
A7 Tupakulagudem 49.2 61.2 60.1 19.7 24.5 24.1 10.9 13.6 13.4 18.3 21.0 20.8 0.35 0.57 0.56 23.6 26.3 26.1
A8 Gutala 57.2 62.6 62.0 22.9 25.0 24.8 12.7 13.9 13.8 20.1 21.3 21.2 0.32 0.59 0.59 25.4 26.6 26.5
NAAQ Standards 100 60 80 80 2.0 400

Executive Summary of Draft EIA Report Tagoor Laboratories Pvt. Ltd.
Prepared By Rightsource Industrial Solutions Pvt. Ltd. Page 12
3.5 WATER QUALITY
Water sampling and subsequent analysis was carried out to determine both the
groundwater and surface water quality of the study area.
Ground water & Surface water samples were collected at 8 locations in the study
area. These samples were analyzed for physical and chemical parameters to
ascertain the Baseline status in the existing surface water and ground water bodies.
TABLE 11: WATER ANALYSIS RESULTS
S. No Parameters Ground water Surface water Min Max Min Max
1 pH 6.92 8.19 7.47 8.42 2 Total dissolved solids (mg/l) 292 565 162 1410 3 Total hardness (mg/l) 112.6 350 70 315 4 Chlorides (mg/l) 32.48 374.8 22 299
5 Fluoride (mg/l) <0.5 <0.5 <0.5 <0.5
6 Sulphates (mg/l) 15.13 66.34 1.2 194
Ground water samples collected was analyzed as per the Standard methods and
the water quality of the study area is found within the permissible limits of IS: 10500
- 2012
3.6 NOISE ENVIRONMENT
Noise level monitoring was carried out at eight locations during the period of
October – December 2018.
Daytime Noise Levels (Lday)
Industrial Zone: The day time noise level at the Project site was 68.3 dB (A), which
is well below the permissible limits of 75 dB (A).
Commercial Zone: The daytime noise levels in all the commercial locations were
observed to be in the range of 56.4 dB (A) to 62.3 dB (A). The noise levels at all the
locations were below the permissible limits of 65 dB (A).
Residential Zone: The daytime noise levels in all the residential locations were
observed to be in the range of 45.2 dB (A) to 51.2 dB (A). The noise levels at all the
locations were below the permissible limits of 55 dB (A).

Executive Summary of Draft EIA Report Tagoor Laboratories Pvt. Ltd.
Prepared By Rightsource Industrial Solutions Pvt. Ltd. Page 13
Night time Noise Levels (Lnight)
Industrial Zone: The night time noise level in the Project site was observed be 53.7
dB (A), which is well below the permissible limits of 70 dB (A).
Commercial Zone: The night time noise levels in all the commercial locations were
observed as 44.9 dB (A). The noise levels at all the locations were below the
permissible limits of 55 dB (A).
Residential Zone: The nighttime noise levels in all the residential locations were
observed to be in the range of 33.4 dB (A) to 36.8 dB (A). The noise levels were
below the permissible limits of 45 dB (A) in nighttime at all the locations.
TABLE 12: NOISE LEVELS OF THE STUDY AREA
S. No
Name of the
Location
Category of Area/zone
Day Time in Leq dB (A)
CPCB Standard Day Time
Night Time in Leq dB (A)
CPCB Standard
Night time
1. Project site Industrial 68.3 75 dB (A) 53.7 70dB (A)
2. Bhimolu Residential 45.7 55 dB (A) 33.4 45 dB (A)
3. Gopavaram Residential 46.2 55 dB (A) 36.4 45 dB (A)
4. Annadevarapeta Residential 45.2 55 dB (A) 36.8 45 dB (A)
5. Gopalapuram Commercial 56.4 65 dB (A) 44.9 55 dB (A)
6. Rampalem Residential 46.2 55 dB (A) 35.4 45 dB (A)
7. Tupakulagudem Residential 51.2 55 dB (A) 36.7 45 dB (A)
8. Gutala Residential 48.7 55 dB (A) 35.8 45 dB (A)
3.7 SOIL ENVIRONMENT
Based on the baseline data, the soil results were found to be normal.
3.8 LAND USE/ LAND COVER OF THE STUDY AREA
Land use / Land cover map is prepared by visual interpretation of high-resolution
satellite data (Satellite Imagery Acquisition: 15-Feb-2019) and with the help of
Survey of India Topographic maps on 1: 50,000 scale. One season data is used for
the delineation of different units. The units are confirmed by the ground truth/field
visits.

Executive Summary of Draft EIA Report Tagoor Laboratories Pvt. Ltd.
Prepared By Rightsource Industrial Solutions Pvt. Ltd. Page 14
TABLE 13: LAND USE / LAND COVER OF THE STUDY AREA
S. No LAND USE Area in Sq. km
Area in Percentage (%)
1 Built Up Land 24.396 7.6
2 Water Bodies 38.841 12.1
3 Forest 13.803 4.3
4 Crop Land 201.588 62.8
5 Waste Lands 42.372 13.2
Total 321 100
3.9 DEMOGRAPHIC AND SOCIO-ECONOMIC PROFILE
The total population of the study area is 2,17,634 in which male and female
population constitutes about 49.68 % and 50.32 % in the study area
respectively.
The literate male and female in the study area are 57,536 and 53,856 which
implies that the percentage of literacy rate is 53.22% with male and 49.18%
with female respectively.
In the study area the main and marginal workers are 97,882 (44.98%) and
8603 (3.95%) respectively of the total population while the remaining 1,11,149
(51.07%) constitutes non-workers
All the Villages, in the study area, are electrified – both for Domestic Purpose and
common facilities like, Street Lights, Public Water Pumping, etc. and also are
provided with Domestic Water.
4.0 IDENTIFICATION, PREDICTION & MITIGATION MEASURES
4.1 Expected Air Environment
A. PROCESS EMISSIONS DETAILS
The Predicted Process emissions are O2, CO2, SO2, H2, CH3Cl, HBr, N2, NH3 & HCl
which are liberated from manufacturing process of proposed products.
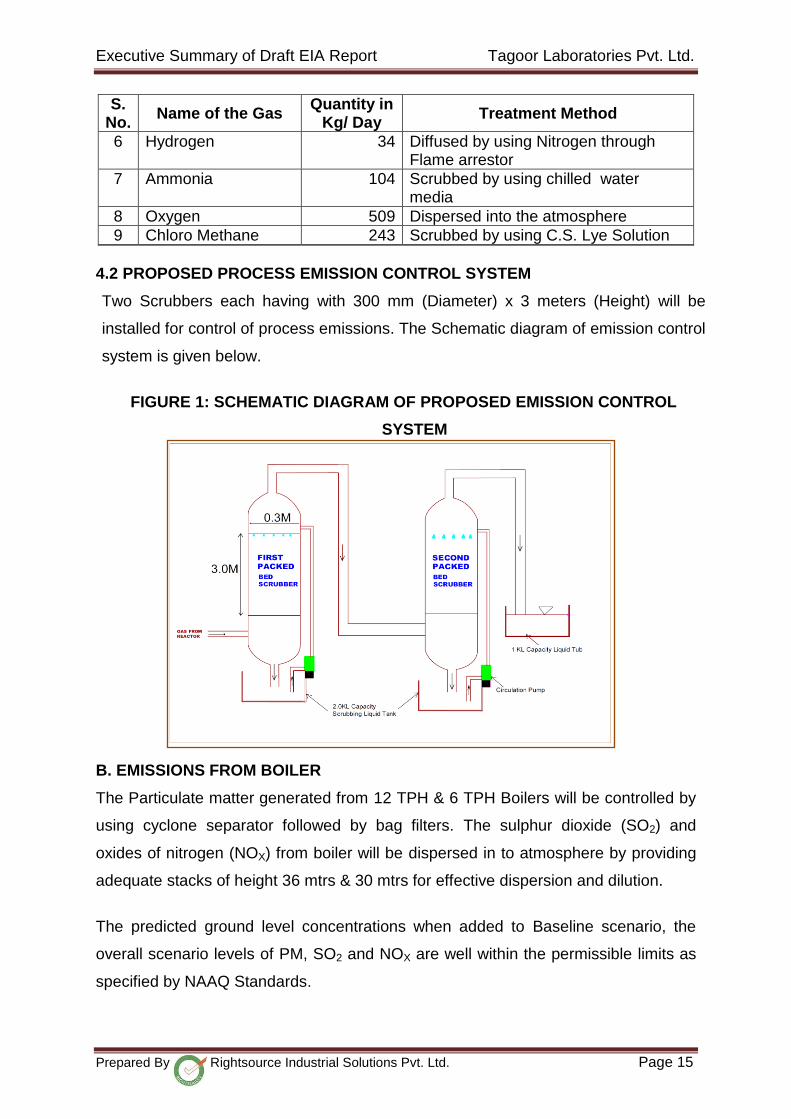
TABLE 14: PROCESS EMISSION DETAILS AND TREATMENT METHOD
S. No.
Name of the Gas Quantity in
Kg/ Day Treatment Method
1 Sulphur dioxide 1373 Scrubbed by using C.S.Lye Solution
2 Hydrogen chloride 579 Scrubbed by using chilled water media
3 Hydrogen Bromide 312 Scrubbed by using C. S. Lye solution
4 Nitrogen 45 Dispersed into the atmosphere
5 Carbon dioxide 863 Dispersed into the atmosphere
Executive Summary of Draft EIA Report Tagoor Laboratories Pvt. Ltd.
Prepared By Rightsource Industrial Solutions Pvt. Ltd. Page 15
S. No.
Name of the Gas Quantity in
Kg/ Day Treatment Method
6 Hydrogen 34 Diffused by using Nitrogen through Flame arrestor
7 Ammonia 104 Scrubbed by using chilled water media
8 Oxygen 509 Dispersed into the atmosphere
9 Chloro Methane 243 Scrubbed by using C.S. Lye Solution
4.2 PROPOSED PROCESS EMISSION CONTROL SYSTEM
Two Scrubbers each having with 300 mm (Diameter) x 3 meters (Height) will be
installed for control of process emissions. The Schematic diagram of emission control
system is given below.
FIGURE 1: SCHEMATIC DIAGRAM OF PROPOSED EMISSION CONTROL
SYSTEM
B. EMISSIONS FROM BOILER
The Particulate matter generated from 12 TPH & 6 TPH Boilers will be controlled by
using cyclone separator followed by bag filters. The sulphur dioxide (SO2) and
oxides of nitrogen (NOX) from boiler will be dispersed in to atmosphere by providing
adequate stacks of height 36 mtrs & 30 mtrs for effective dispersion and dilution.
The predicted ground level concentrations when added to Baseline scenario, the
overall scenario levels of PM, SO2 and NOX are well within the permissible limits as
specified by NAAQ Standards.

Executive Summary of Draft EIA Report Tagoor Laboratories Pvt. Ltd.
Prepared By Rightsource Industrial Solutions Pvt. Ltd. Page 16
TABLE 15: RESULTANT CONCENTRATIONS DUE TO
INCREMENTAL GLC's
Pollutant Maximum
Baseline
Concentration
Incremental
Concentrations due
to Proposed Project
Resultant
Concentration
NAAQ
Standards
PM (μg/m3) 70.3 1.50 71.8 100
SO2 (μg/m3) 15.6 2.62 18.22 80
NOx (μg/m3) 23.0 5.48 28.48 80
4.3 Expected Effluent Water Details
The waste water generation will be 177.36 KLD which is from Process, washings,
cooling tower bleed off, Boiler blow down, Scrubber and domestic usage. The
effluent generation and its HTDS & LTDS effluent details are given below.
TABLE 16: EXPECTED EFFLUENT GENERATION DETAILS
S. No. Purpose Effluent
Details KLD
1 Process 97.16
2 Washings 10.00
3 Boiler Blow down 15.00
4 Cooling towers Bleed off 34.00
5 Scrubbing system 11.20
6 Domestic 10.00
Total 177.36
TABLE 17: EXPECTED HTDS & LTDS EFFLUENT GENERATION DETAILS AND
TREATMENT METHOD
Unit HTDS KLD
LTDS KLD
Effluent Generation
in KLD Treatment Method
Process 62.88 34.28 97.16 HTDS: HTDS effluents sent to MEE system followed by Biological Treatment Plant (BTP). LTDS: LTDS effluents treated in BTP – RO Plant. RO Rejects to MEE System and RO permeate to reuse, Condensate from MEE to reuse and MEE concentrated to ATFD.
Washings 0.00 10.00 10.00
Boiler Blow down 0.00 15.00 15.00
Cooling towers Bleed off
0.00 34.00 34.00
Scrubbing system 11.20 0.00 11.20
Domestic 0.00 10.00 10.00
Total 74.08 103.28 177.36
Executive Summary of Draft EIA Report Tagoor Laboratories Pvt. Ltd.
Prepared By Rightsource Industrial Solutions Pvt. Ltd. Page 17
Effluent Treatment / Disposal: Zero Liquid Discharge (ZLD) concept consisting of
steam stripper, MEE system, ATFD, Biological Treatment and RO will be installed to
treat the effluents generated from plant and to reuse the treated water.
The MEE System with 150 KLD Capacity & RO system with 180 KLD Capacity will
be installed for treatment of effluents generated from plant operations.
4.4 Noise Environment
The main sources of noise pollution in the plant operations are Boiler, Reactors, DG
Set, compressors and other Noise generating units. Vehicular movements during
operation phase for loading / unloading of raw materials and finished products and
transporting activity may also increases the noise levels.
All the noise generating equipments like motors, gear boxes and compressors will be
regularly maintained with lubricating material to avoid noise generation. DG set will
be provided with acoustic enclosures. A thick greenbelt will be developed along the
periphery of the plant boundaries to minimize the noise pollution from the source.
4.5 Land Environment
The plant activities are unlikely to alter the land-use pattern in the project site. The
unit will take adequate measures for storage, handling and disposal of hazardous
waste. Hence, there will be no significant adverse impact on land environment.
4.6 Ecological Environment
Detailed flora and fauna studies were carried in the study area. As per baseline
studies, there are no endangered, threatened & protected plants and animal species
were recorded in the study area. Hence, no significant adverse impact is envisaged
on ecology.
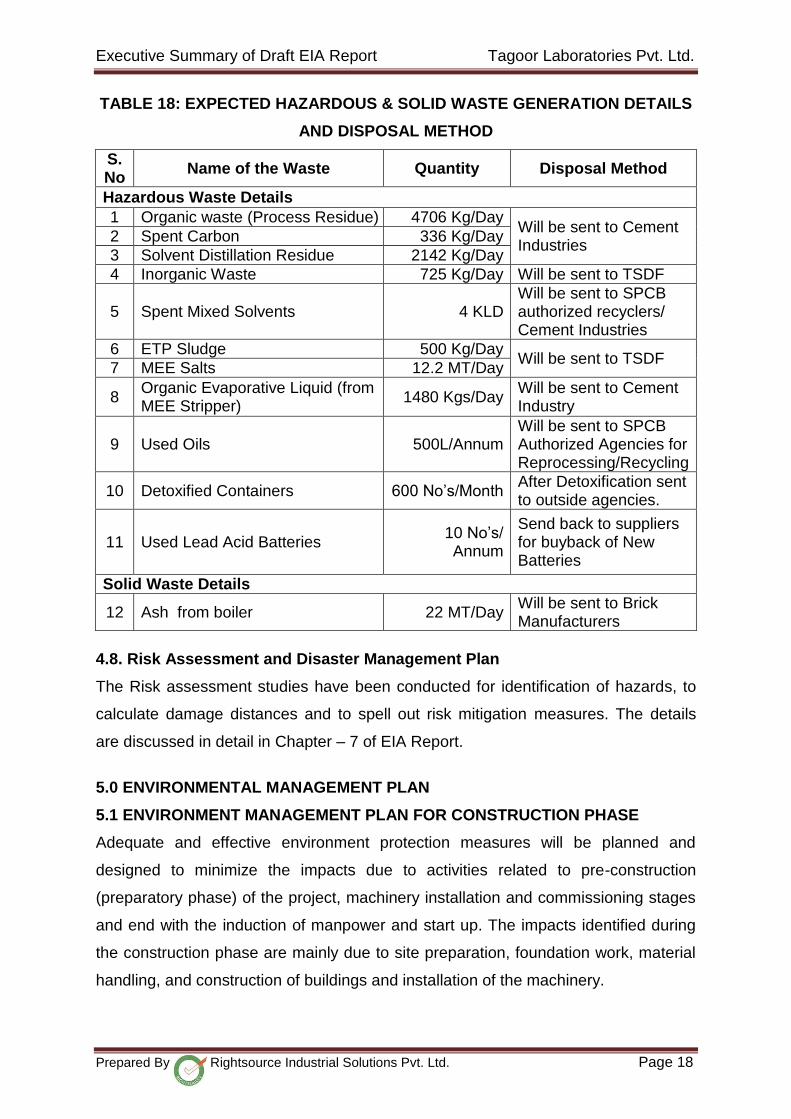
4.7 Expected Hazardous and Solid Waste Details
The Hazardous and Solid waste generated and disposal methods from proposed
project are given below.
Executive Summary of Draft EIA Report Tagoor Laboratories Pvt. Ltd.
Prepared By Rightsource Industrial Solutions Pvt. Ltd. Page 18
TABLE 18: EXPECTED HAZARDOUS & SOLID WASTE GENERATION DETAILS
AND DISPOSAL METHOD
S. No
Name of the Waste Quantity Disposal Method
Hazardous Waste Details
1 Organic waste (Process Residue) 4706 Kg/Day Will be sent to Cement Industries
2 Spent Carbon 336 Kg/Day
3 Solvent Distillation Residue 2142 Kg/Day
4 Inorganic Waste 725 Kg/Day Will be sent to TSDF
5 Spent Mixed Solvents 4 KLD Will be sent to SPCB authorized recyclers/ Cement Industries
6 ETP Sludge 500 Kg/Day Will be sent to TSDF
7 MEE Salts 12.2 MT/Day
8 Organic Evaporative Liquid (from MEE Stripper)
1480 Kgs/Day Will be sent to Cement Industry
9 Used Oils 500L/Annum Will be sent to SPCB Authorized Agencies for Reprocessing/Recycling
10 Detoxified Containers 600 No’s/Month After Detoxification sent to outside agencies.
11 Used Lead Acid Batteries 10 No’s/ Annum
Send back to suppliers for buyback of New Batteries
Solid Waste Details
12 Ash from boiler 22 MT/Day Will be sent to Brick Manufacturers
4.8. Risk Assessment and Disaster Management Plan
The Risk assessment studies have been conducted for identification of hazards, to
calculate damage distances and to spell out risk mitigation measures. The details
are discussed in detail in Chapter – 7 of EIA Report.
5.0 ENVIRONMENTAL MANAGEMENT PLAN
5.1 ENVIRONMENT MANAGEMENT PLAN FOR CONSTRUCTION PHASE
Adequate and effective environment protection measures will be planned and
designed to minimize the impacts due to activities related to pre-construction
(preparatory phase) of the project, machinery installation and commissioning stages
and end with the induction of manpower and start up. The impacts identified during
the construction phase are mainly due to site preparation, foundation work, material
handling, and construction of buildings and installation of the machinery.
Executive Summary of Draft EIA Report Tagoor Laboratories Pvt. Ltd.
Prepared By Rightsource Industrial Solutions Pvt. Ltd. Page 19
All possible care will be taken to reduce the noise levels due to construction activity.
Also, noise prone activities shall be restricted to the extent possible during night
particularly during the period of 10 PM to 6 AM in order to have minimum
environmental impact.
5.2 ENVIRONMENT MANAGEMENT PLAN FOR OPERATIONAL PHASE
A) Air Pollution Management
The industry will take measures for reduction of fugitive emissions emanating
out of process reactions by providing vent condensers.
Good ventilation will be provided to reduce the workroom concentrations.
Fugitive emissions will be reduced by providing vent condensers to the all the
reactors.
Adequate stacks of height of 36 & 30 meters will be provided to the 12 TPH &
6 TPH coal fired/ organic fuel briquette boilers.
Stack monitoring facilities for the periodic monitoring of the stack to verify the
compliance of the stipulated norms. Apart from this Cyclone Separator, Bag
filters will be provided to the boiler.
In order to minimize the air pollution, unit will develop greenbelt in and around
its premises.
B) Water Pollution Management
Effluent generated in the plant will be treated in Proposed ZLD system.
The industry is proposing to install a MEE System with 150 KLD capacity,
Biological Treatment system of 190 KLD and RO system with 180 KLD
capacities for treatment of 177.36 KLD effluents generated from plant
operations.
Total Water requirement is 525.26 KLD out of which 144.09 KLD recycled
water recovered from ZLD system, water recovery from process will be 60.47
KLD and 0.685 KLD water recovered from Sodium Bromide salt. The fresh
water of 320.02 KLD will be met from Surface Water source.
Unit is proposed to recharge ground water through roof water harvesting pits
in the project area and rain water harvesting pits outside plant area wherever
possible to balance the water table.
Executive Summary of Draft EIA Report Tagoor Laboratories Pvt. Ltd.
Prepared By Rightsource Industrial Solutions Pvt. Ltd. Page 20
Use of high-pressure hoses for cleaning the floor and process equipment to
reduce the amount of wastewater generated during washings.
C) Noise Pollution Management
Noise suppression measures such as enclosures, buffers and / or protective
measures will be provided, if required.
Extensive oiling, lubrication and preventive maintenance will be carried out for
the machineries and equipments to reduce noise generation.
Greenbelt Development.
D) Hazardous & Solid Waste Management
To reduce the quantity of solid / hazardous waste generation as well as possible
contamination of land (soil) due to spillages / leaks from the plant operations,
following Mitigation measures are proposed:
There will not be any leakages / spillage from the raw-materials storage.
The generated Hazardous waste will be stored on floor with suitable packing
and this dedicated area will be covered with the roof.
The records on quantity of hazardous waste generation and disposal will be
maintained for each category and possibilities will be explored for
minimization and reuse.
E) Green Belt
Greenbelt will be developed in an area of 3.93 Acres (15899 Sq. m). The industry will
spend 7.0 Lakhs as capital cost for planting of samplings. Lists of plants suitable for
greenbelt as per the local agro climatic conditions are given in the EIA Report.
F) Solvent Recovery
Solvents will be recovered up to 95% using distillation column and necessary cooling
condensers.
5.3 ENVIRONMENT MANAGEMENT CELL
Tagoor Laboratories Pvt. Ltd. will provide dedicated Environmental Management
Cell with experienced staff to look after the proper environmental management of the
plant including operation & maintenance of all pollution control facilities.

Executive Summary of Draft EIA Report Tagoor Laboratories Pvt. Ltd.
Prepared By Rightsource Industrial Solutions Pvt. Ltd. Page 21
5.4 ENVIRONMENT MONITORING PROGRAM
Regular monitoring of environmental parameters is of immense importance to
assess the status of environment during project operation. The regular monitoring
will be carried out with the MoEF&CC Registration / NABL Accredited Laboratory.
6. PROPOSED ROOF WATER HARVESTING
Roof top rainwater harvesting is one of the appropriate options for augmenting
ground water recharge/ storage in this industry.
The following table gives expected quantity of rain water harvesting using buildings
Roof top.
TABLE 19: AVAILABLE RAINWATER (ANNUAL) FOR HARVESTING
Description Area (m2) Rainfall
(m/Annum) Runoff
coefficient Total Rainwater
(m3/Annum)
Roof Area 10214 1.1 0.8 8988.3
Total available rainwater (in m3/annum) 8988
FIGURE 2: PROPOSED ROOF WATER HARVESTING STRUCTURE
7. EMP BUDGET
The unit has proposed for 255 Lakhs as capital cost and 61 Lakhs as recurring cost/
Annum for environment pollution control measures.

Executive Summary of Draft EIA Report Tagoor Laboratories Pvt. Ltd.
Prepared By Rightsource Industrial Solutions Pvt. Ltd. Page 22
TABLE 20: PROPOSED BUDGET FOR ENVIRONMENTAL MANAGEMENT PLAN
[EMP]
S.
No Particulars
Proposed
Capital Cost
(Rs. Lakhs)
Recurring
Cost/ Annum
(Rs. Lakhs)
1
Pollution Control Equipment
(Scrubbers, Cyclone separator, Bag filter,
Sampling port arrangements etc.,)
40.0 5.0
2 ZLD System
(MEE, RO, ETP system) 190.0 40.0
3 Rain Water Harvesting
(Roof top water harvesting collection pits) 6.0 1.0
4 Green Belt Development
(Plantation and Maintenance) 7.0 3.0
5 Health & Safety
(PPEs, Medical Surveillances Expenses etc.,) 12.0 6.0
6
Environmental Monitoring
(Air, Water, Noise, VOCs, Boiler Stack flue
gases, DG sets stack monitoring expenses
etc.,)
0.0 6.0
Total 255.0 61.0
8.0 SOCIO-ECONOMIC DEVELOPMENT
It is predicted that socio-economic impact due to this project will positively increase
the chance of more employment opportunities for local people. There are no
Resettlement and Rehabilitation issues involved in this project. The project
infrastructures will be of use to people of the area. The revenue of the village will be
definitely increased due to the proposed project.
9.0 PROJECT BENEFITS
Proposed project will result in considerable growth and upliftment of local community
in the nearby villages by providing the employment. The project will generate direct
and indirect employment to the nearby villages and the unavailable technical
persons will be recruited from outside.
10.0 CONCLUSION
Tagoor Laboratories Pvt. Ltd. has committed to implement all the pollution control
measures to protect the surrounding environment – adapting Zero-Liquid-Discharge
Executive Summary of Draft EIA Report Tagoor Laboratories Pvt. Ltd.
Prepared By Rightsource Industrial Solutions Pvt. Ltd. Page 23
System for all its Effluents, by controlling process emissions and Safe-Disposal of all
Solid Wastes – generated either as process wastes or packing wastes.
The project can definitely improve the regional, state and national economy.
Industrial growth is an indication of all-round Socio-Economic Development – by
generating local Employment and Business Opportunities. The implementation of
this project will definitely improve the physical and social infrastructure of the
surrounding area.