executive summary - the australia institute
TRANSCRIPT


Disclaimer: The Victoria Energy Policy Centre and Victoria University advise that the information contained in this
publication comprises general statements based on scientific research. The reader is advised and needs to be aware that such
information may be incomplete or unable to be used in any specific situation. No reliance or actions must therefore be made
on that information without seeking prior expert professional, scientific and technical advice. To the extent permitted by law,
the Victoria Energy Policy Centre and Victoria University (including its employees and consultants) exclude all liability to
any person for any consequences, including but not limited to all losses, damages, costs, expenses and any other
compensation, arising directly or indirectly from using this publication (in part or in whole) and any information or material
contained in it.
Publisher: Victoria Energy Policy Centre, Victoria University, Melbourne, Australia.
ISBN: 978-1-86272-827-1
DOI: 10.26196/e8b0-wa48
Citation: Mountain, B.R and Percy, S., 2021. “Inertia and System Strength in the National Energy Market: A report
prepared for The Australia Institute”. VEPC, Melbourne.
Authors’ affiliations: Professor Bruce Mountain is the Director of the Victoria Energy Policy Centre (VEPC) and Dr Steven
Percy is a Senior Research Fellow at VEPC

2
EXECUTIVE SUMMARY
This report has been prepared for the Australia Institute to provide advice to the Energy
Security Board’s Post-2025 redesign of the National Electricity Market (NEM). The terms
of reference require us to examine the arrangements for the provision of inertia and
system strength in the NEM. Inertia refers to the extent to which the power system resists
(in micro-second time scales) changes to demand and supply. System strength refers to
the extent to which a stable voltage waveform is maintained after disturbances to the
system, such as from a short circuit.
The issues that this paper examines have become a focus for the Energy Security Board
in the context of the expansion of renewable generation – which typically does not
provide inertia or act as a source of fault current or voltage (i.e. “grid forming”) – and
the expected future closure of synchronous generation typically obtained from thermal
(coal-fired) generation.
Is there evidence of degradation in system inertia?
Our analysis of the power system frequency measured at 4-second intervals shows that
excursions away from the target frequency (50 Hz) have gradually become wider.
However, comparing frequency excursions from the target of 50 Hz in the first half and
the second half of 2020 shows that the system frequency was closer to the target more
often in the second half after synchronous generators (in particular coal-fired electricity
generators) were required to restore the automatic generator controls that they had
gradually deactivated in previous years.
This suggests that the gradual widening of system frequency excursions is only partly
related to the expansion of non-synchronous renewable generation over the last decade.
The bigger factor explaining the degradation in frequency performance over the last few
years would seem to be coal generators' decisions to switch off their automatic generator
control systems. Nevertheless, in the longer term, as coal generators exit the power
system there will clearly be a need to replace the inertia contained in their rotating
masses.

3
Does the closure of synchronous generation provide cause for concern about the
supply of inertia in future?
Our study finds no cause for concern about the future supply of inertia. There are several
reasons for this.
• First, while the inertia contained in coal generators is large only a small amount
of it is usable: since the angular velocity of the grid is not meant to vary by more
than 0.5 Hz, only about 1% (0.5Hz/50Hz) of the inertia contained in the rotating
mass of is usable. Therefore while the closure of coal generator results in a large
reduction in inertia, in fact only a small amount of this inertia was ever usable.
Thus the amount of usable inertia that needs to be replaced in order to have the
same aggregate usable inertia is much smaller than the notional total inertia in
the system. Grid forming batteries, the most likely source of inertia to replace that
of coal, can provide all of their production irrespective of the power system
frequency. In addition, unlike coal generators, batteries’ inertia is not limited by
the kinetic energy of coal generators’ storage capacity. Whereas coal generators
are only able to provide an inertial response equal to its capacity for around three
seconds, batteries can provide this for far longer than the inertial response
needed. For these reasons, the planned 350 MW battery that will be developed
in Victoria by Energy Australia is likely to be able to provide at least three times
as much inertia as Energy Australia’s Yallourn coal-fired power station.
• Second, inertia is also provided by the inductance of the transmission system and
all AC motors on the demand side. This inertia remains even if synchronous
generators leave.
• Third, the aggregate inertia requirement on the power system is declining as
invert-based devices come to predominated in both the supply and demand of
electricity. In addition, modern inductive electrical devices have better control
systems and need ever less inertia to compensate for control system weaknesses.
These demand-side changes are reflected in AEMO’s changing estimates of
aggregate demand-side inertia.

4
Contemporary studies in Ireland find that a 50 MW battery provides a comparable inertia
response to a 550 MW coal generator. Furthermore even if batteries are not “grid-
forming” (and so not able to synthetically replicate the inertia of a rotating mass), their
speed of response (in fractions of a second) mean that they can increase supply (or reduce
demand) in a way that is very similar to the inertial response of a synchronous generator.
This is well documented in Australia in the performance of the Hornsdale battery when
the Heywood interconnector has failed and at other times. Similar characteristics will no
doubt also be demonstrated by the coming Victorian Big Battery when interconnectors
(or coal generators in Victoria) fail without prior warning.
In addition, inertia can easily be supplied by newly connecting wind and solar farms. In
both cases, technologies for this are well established already and we understand can be
retrofitted where needed.
For these reasons, in addition to the easy supply of inertia from traditional synchronous
condensers, there is every reason to be confident that alternatives to the inertia provided
by coal generators will be abundant, effective and inexpensive.
Supply, demand and institutional arrangements for the provision of inertia and
system strength
Inertia and system strength are public goods: they are almost always non-excludable
(users cannot be barred from the benefits of system strength or inertia if they refuse to
pay for them) and often non-rivalrous (the cost of providing them to a marginal user is
typically zero). As such, both inertia and system strength are most efficiently procured
centrally.
There are numerous factors that affect the desirable level of inertia on a power system,
and different ways of providing inertia. These factors include the robustness of
generation and demand to the rate and extent of frequency change; the amount of
frequency responsive demand or supply that is available to respond with greater delays
than inertia time-scales; the quality of control systems and the level of compliance of
producers with controls from the power system operator; the amount of synchronous
rotating mass on the system in generators and motors; the amount of artificially provided
5
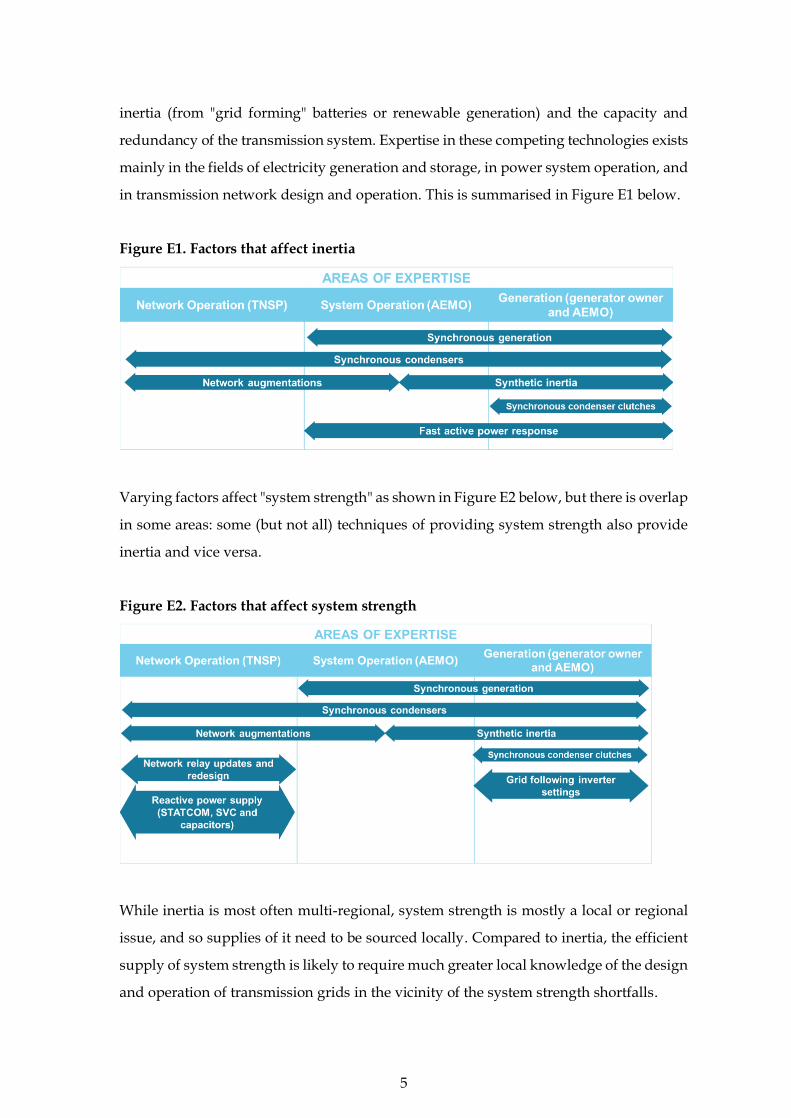
inertia (from "grid forming" batteries or renewable generation) and the capacity and
redundancy of the transmission system. Expertise in these competing technologies exists
mainly in the fields of electricity generation and storage, in power system operation, and
in transmission network design and operation. This is summarised in Figure E1 below.
Figure E1. Factors that affect inertia
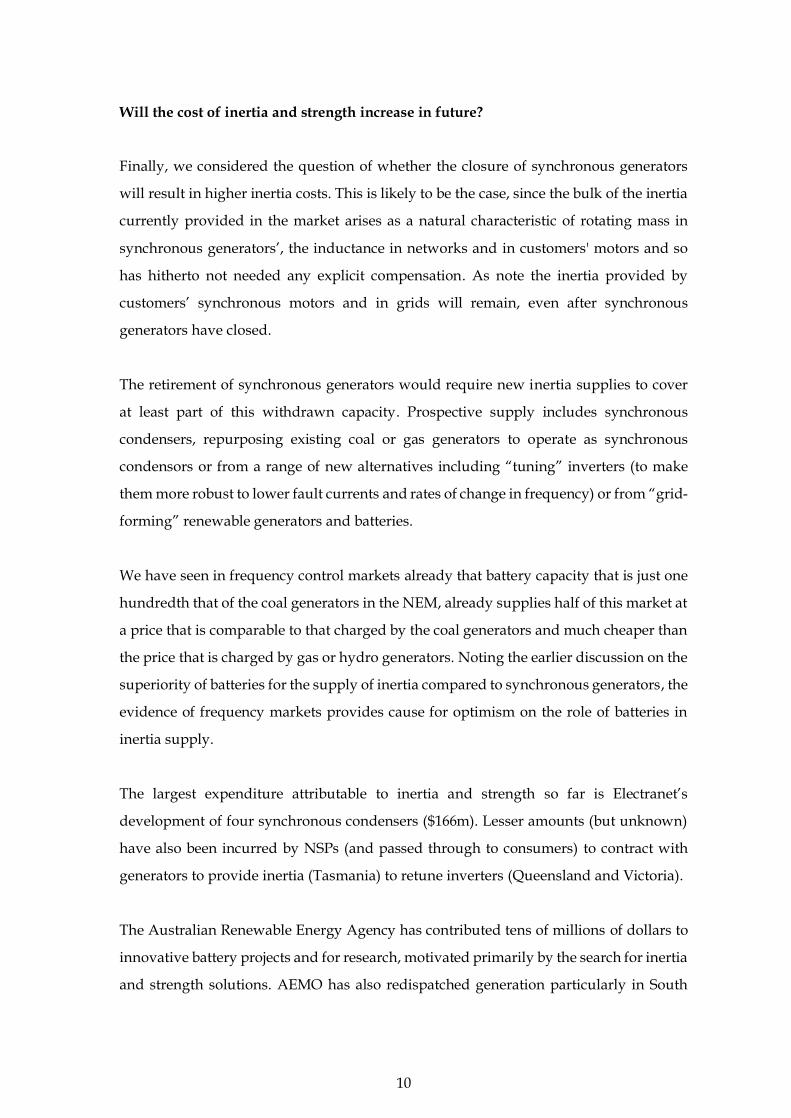
Varying factors affect "system strength" as shown in Figure E2 below, but there is overlap
in some areas: some (but not all) techniques of providing system strength also provide
inertia and vice versa.
Figure E2. Factors that affect system strength
While inertia is most often multi-regional, system strength is mostly a local or regional
issue, and so supplies of it need to be sourced locally. Compared to inertia, the efficient
supply of system strength is likely to require much greater local knowledge of the design
and operation of transmission grids in the vicinity of the system strength shortfalls.

6
There is rapid technology development in competing techniques to provide inertia and
system strength. While existing technologies can be re-purposed and synchronous
condensers have existed for more than a century, the provision of synthetic inertia from
inverter-based devices is likely to become increasingly common.
There is currently one "grid forming" battery (Dalrymple, in South Australia) that
provides system strength. A second, much bigger one, is under construction at the
Wallgrove substation in New South Wales and its developer (TransGrid) says it can
provide inertia and system strength services for a fraction of the cost of a synchronous
condenser1, which remains the most popular and well-understood approach to
providing inertia and system strength.
Institutional arrangements for inertia and system strength
Before 2017, there were no clear institutional arrangements for the provision of system
strength or inertia. The South Australian Energy and Resources Minister proposed a rule
change which would have made the Australian Energy Market Operator (AEMO)
responsible for their provision. However the Australian Energy Markets Commission
(AEMC) decided that AEMO's role should be limited to determining if there are (or will
be) inertia or strength shortfalls; that Network Service Providers (NSPs) be made
responsible for meeting those shortfalls; that AEMO be made responsible for assessing
whether NSPs' proposed solutions are valid; and that AEMO be responsible for operating
the assets the NSPs develop or procure.
In response to criticism of the arrangements it had developed, in late 2020, the AEMC
finalised a review of the “frameworks” for system strength. The essential outcome of this
review is that NSPs’ monopoly over the provision of system strength should be
expanded (the AEMC now suggests that NSPs should be allowed to “proactively” incur
1 Synchronous condensers are machines that resemble a synchronous generator or motor but they
do not have the ability to produce more energy than is contained in their rotating components.

7
expenditure to improve system strength). The AEMC also concluded that the “do no
harm” provision should allow connecting generators (that the NSP deems to be doing
harm) to pay a fee that the NSP determines. This fee should be based on the additional
system strength costs that the NSPs determine that their connection is deemed to incur.
Connecting generators can challenge this by requiring a specific study (which they will
be charged for) but the AEMC suggests that the outcome of this will almost always mean
even higher charges. The changes that the AEMC has recommended are not yet reflected
in changes to the Rules but we understand that the AEMC intends to do this soon in their
determination of a rule change application that TransGrid has submitted.
We argue that the current arrangements (and the AEMC’s recommendations of their
future variation) allocates risks to parties who are not best placed to manage them; and
that NSPs' profit motive and incentive to capitalise expenditure will distort decisions.
For these reasons and others, we suggest this will tend to result in unnecessarily
expensive solutions and arrangements that will impede innovation and learning in an
area of activity in which there is rapid technology change.
In addition many of the prospective technologies to supply inertia and strength are from
technologies, such as batteries, whose main markets (such as the main electricity spot
market or the ancillary services markets) are contestable. NSPs are prohibited from
participating in such markets since they have a conflict of interest and will undermine
competition in those markets. We conclude the same arguments apply in respect of NSP
involvement in most aspects of the supply of inertia and system strength.
We argue that instead of handing a monopoly for the provision of inertia and system
strength to NSPs, the system operator (SO) should be responsible for the provision of
inertia and strength provision, as had been originally proposed by the SA Energy
Minister in the original 2017 rule change applications.
Is there evidence to support our arguments that SO responsibility is preferable? Limited
data is available in Australia or elsewhere because procurement of system strength and
inertia is a new activity. There is no plausible dataset to compare the performance of
NSPs and SOs in this context. It is informative nonetheless to compare the acquisition of
inertia in Great Britain by the system operator (NG ESO), and in South Australia by the

8
network service provider, Electranet. The former attracted a mix of repurposed hydro,
coal and gas capacity and some new synchronous generators. In their procurement,
contract term is typically 6 years (competing providers were able nominate terms up to
a maximum of 6 years); prices were established in the tender and NG ESO accepted offers
up to point that they considered it could be cheaper to redispatch generation. In South
Australia four new synchronous condensers were procured by Electranet. The Australian
Energy Regulator recognised the full cost because, it said, Electranet had run a tender to
procure the capacity. Measured per GVA.s we estimate that the inertia supply in South
Australia is being delivered for less than half the price as that in Great Britain. But in SA,
customers will be paying this for the next 40 years, while in GB the contracts last for just
six years. The advantages of grid-forming batteries and renewable generation might then
be expected to be widely available and can be expected to deliver much cheaper inertia
(and system strength) than available from synchronous condensers.
It merits note that some NSPs have been proactive in developing expertise in grid-
forming batteries, funded in part by the Australian Renewable Energy Agency and also
by state governments. This is likely to mean that NSPs may prove to be competitive in
the supply of battery solutions. Tenders operated by the SO would be an ideal way to
discover if this is indeed the case. Demonstrating their advantages in competitive tenders
would allow NSPs to dismiss the suspicion that would arise if they had a monopoly, that
it would allow them to feather their nests at consumers’ expense.
“Do no harm”
In its determination of the institutional arrangements for system strength, in 2017 the
AEMC also obliged connecting generators to "do no harm". This means that renewable
generators are expected to work out what "harm" they are doing to system strength and
then invest in equipment (synchronous condensers typically) to mitigate the harm. The
AEMC has recently recommended a variation on this where the NSP instead charges
connecting generators and they have an option to challenge those charges by requesting
(and paying for) a specific study. The argument underlying the “do no harm” approach
in its original, and recently varied, form is that it provides appropriate investment
signals. We conclude there are several problems with this approach.

9
1. First, with this approach renewable generators are deemed to do no harm if
system strength is plentiful. It is only when system strength is in short supply
that “harm” will be done and then the generator expected to make good. This can
be likened to blaming the last straw for breaking the donkeys back. The “harm”
of that generator is a function of the state of the system it plugs into. For example,
a windfarm that connects before Electranet has developed its synchronous
condensers in South Australia will be doing harm and expected to make good (or
as the AEMC now suggests, pay a fee). But if the wind farm connects after the
synchronous condensers are commissioned it is likely to no longer be deemed to
be doing harm. “First in, best dressed” might be an accepted social norm for the
allocation of scarce resources, but blaming the last straw for breaking the
donkey’s back is not well-founded in the economics of natural monopolies.
2. Second, the approach allocates the risk to parties who have limited ability to
manage it. Connecting generators that are required to “make good” are likely to
select from a much smaller set of competing solutions (i.e. those they can easily
develop and control) than the range of solutions available to a co-ordinated
provider. A co-ordinated provider will also not be concerned in selecting
solutions to minimise the risk that competing generators get a free-ride (which is
likely to be a feature prominent in connecting generators’ consideration). Instead,
a co-ordinated provider may be expected to seek to maximise the public good at
the lowest cost.
3. Third, the typical sources of strength (i.e. synchronous condensers) exhibit large
economies of scale, are indivisible (they can not easily be shared) and lumpy (they
come in discrete sizes). In this respect, the cost structure and technology
characteristics of a synchronous condenser is just like that of a transmission line
or transformer. It is this cost structure that is the origin of the “natural monopoly”
characteristic of transmission and hence provides the basis for the co-ordinated
provision of transmission. Exactly the same logic applies to the provision of
system strength. A recent case study in Queensland finds that economies of scale
mean that co-ordinated provision of system strength is likely to mean
substantially cheaper provision than uncoordinated and decentralised provision.
10
Will the cost of inertia and strength increase in future?
Finally, we considered the question of whether the closure of synchronous generators
will result in higher inertia costs. This is likely to be the case, since the bulk of the inertia
currently provided in the market arises as a natural characteristic of rotating mass in
synchronous generators’, the inductance in networks and in customers' motors and so
has hitherto not needed any explicit compensation. As note the inertia provided by
customers’ synchronous motors and in grids will remain, even after synchronous
generators have closed.
The retirement of synchronous generators would require new inertia supplies to cover
at least part of this withdrawn capacity. Prospective supply includes synchronous
condensers, repurposing existing coal or gas generators to operate as synchronous
condensors or from a range of new alternatives including “tuning” inverters (to make
them more robust to lower fault currents and rates of change in frequency) or from “grid-
forming” renewable generators and batteries.
We have seen in frequency control markets already that battery capacity that is just one
hundredth that of the coal generators in the NEM, already supplies half of this market at
a price that is comparable to that charged by the coal generators and much cheaper than
the price that is charged by gas or hydro generators. Noting the earlier discussion on the
superiority of batteries for the supply of inertia compared to synchronous generators, the
evidence of frequency markets provides cause for optimism on the role of batteries in
inertia supply.
The largest expenditure attributable to inertia and strength so far is Electranet’s
development of four synchronous condensers ($166m). Lesser amounts (but unknown)
have also been incurred by NSPs (and passed through to consumers) to contract with
generators to provide inertia (Tasmania) to retune inverters (Queensland and Victoria).
The Australian Renewable Energy Agency has contributed tens of millions of dollars to
innovative battery projects and for research, motivated primarily by the search for inertia
and strength solutions. AEMO has also redispatched generation particularly in South

11
Australia. Some part of the justification of this has been system security (broadly defined)
that could be avoided to some extent if more inertia was available.
The lack of transparency in many areas makes it impossible to provide an accurate
estimate of how much money has been spent on system strength and inertia. From the
frequency control ancillary services markets, we can however observe expenditure of a
a little over $350m in 2020, of which coal generators received about a third).
While more money will need to be spent to increase the supply of inertia and strength as
coal generators close, technology is changing quickly making estimates of future costs
highly uncertain. On balance, we think it is likely that even after the withdrawal of all
synchronous generation in the NEM, the aggregate cost of inertia, system strength and
frequency response ancillary services will continue to be an almost inconsequentially
small part of customers' bills.
Recommendations
The "do no harm" regulations are inefficient and unfair and they should be abandoned.
In place of decentralised obligations on renewable generation, the provision of system
strength should be co-ordinated. This is not to suggest that connecting generators (of
whatever type) should be exempt from reasonable operating standards – such as the
ability to ride through faults – that will reduce the demand (and hence need for supply)
of system strength.
We suggest that the improvements in the co-ordinated provision of inertia and system
strength be possible by making the system operator responsible for their provision. This
will nonetheless require very close consultation with network service providers,
particularly with respect to the procurement of system strength. Some form of joint NSP-
AEMO decision-making arrangements merits further consideration, although it is
imperative that the system operator, not NSPs, is ultimately the entity responsible for
contracting the supply of strength and inertia.
Such arrangements do not preclude NSP involvement in the provision of strength or
inertia either through the supply of conventional grid solutions or through involvement

12
in grid-forming batteries. Indeed, Electranet and now TransGrid are developing valuable
expertise in the development and operation of such batteries. If this provides competitive
advantages in the supply of inertia and strength it will become evident in tenders or
similar competitions that the system operator runs.
Finally, the system operator should also be encouraged to seek to maximise the public
availability of information on the outcomes of the markets and tenders it operates to
procure strength and inertia. This will stimulate rivalry and innovation amongst service
providers and, we suggest, is an important part of the public accountability for the
procurement of these services.

13
Table of contents
1 Introduction.................................................................................................................... 16
2 Background ..................................................................................................................... 17
2.1 Definitions ..................................................................................................................................... 17
2.1.1 Inertia .............................................................................................................................................................. 17
2.1.2 System strength ........................................................................................................................................... 19
2.2 How is the power system changing?.................................................................................... 21
2.2.1 Demand for synchronous generation ................................................................................................. 22
2.2.2 Coal generator reliability ......................................................................................................................... 24
2.2.3 System frequency ........................................................................................................................................ 24
2.2.4 Grid-scale batteries and frequency services ................................................................................... 26
2.3 Inertia and system strength technical studies, institutional
developments and investment response........................................................................... 30
2.3.1 Technical studies ......................................................................................................................................... 30
2.3.2 Institutional developments ..................................................................................................................... 32
2.3.3 Inertia and system strength investments ......................................................................................... 35
3 Analysis of arrangements for provision of inertia and system
strength ............................................................................................................................ 38
3.1 Demand for inertia and system strength........................................................................... 38
3.2 Supply of inertia and system strength ................................................................................ 41
3.2.1 Inertia .............................................................................................................................................................. 42
3.2.2 System strength ........................................................................................................................................... 49
3.2.3 The economics of inertia and system strength supply ............................................................... 50
4 Evaluation of current arrangements for the provision of inertia
and system strength..................................................................................................... 53
4.1 Assessment criteria ................................................................................................................... 53
4.2 Assessment of "do no harm" ................................................................................................... 54
4.3 Assessment of NSP provision of inertia and system strength.................................... 56
4.4 Assessment of SO responsibility for the provision of inertia and
strength .......................................................................................................................................... 58
4.5 Evidence ......................................................................................................................................... 61
5 Conclusions ..................................................................................................................... 64

14
6 Recommendations ........................................................................................................ 66
7 Appendix A: Heat maps of number of synchronous units online ................ 67

15
Table of Figures
Figure 1. Mainland inertia duration curves, 2015-19 and forecast for 2025 ................... 21
Figure 2. Heat map charts showing the lowest residual demand (demand minus
large scale renewable production) in each NEM region ................................. 22
Figure 3. Forecast data estimating the percentage of time black coal generators
will be pushed to their minimum stable operating output ............................ 24
Figure 4. 3D histogram of system frequency in the mainland NEM since 2011 ............ 26
Figure 5. Regulation and contingency FCAS reserve payments in the NEM by
calendar year. ........................................................................................................ 26
Figure 6. Regulation and contingency FCAS payments to coal generators in the
NEM, by calendar year. ....................................................................................... 27
Figure 7. Volume of raise regulation FCAS provided by each fuel type in the NEM
................................................................................................................................. 28
Figure 8. Cost of raise regulation FCAS provided by each fuel type in the NEM ........ 28
Figure 9. Volume of raise 6 second FCAS provided by each fuel type in the NEM
................................................................................................................................. 28
Figure 10. Total Cost of raise 6 second FCAS provided by each fuel type in the
NEM ........................................................................................................................ 29
Figure 11. Price ($/MW/5-minutes) of raise regulation FCAS in the NEM .................. 29
Figure 12. Price ($/MW/5-minutes) of raise 6 second FCAS in the NEM ..................... 30
Figure 13. Methods to increase inertia categorised by main area of expertise .............. 42
Figure 14. South Australia secure operating level of inertia (2022-23) adjusted for
inertia support activities, with four synchronous condensers ....................... 48
Figure 15. Factors that affect system strength categorised into areas of expertise
categories................................................................................................................ 49
Figure 16. 99th percentile of the number of coal units online during each week of
the year (Victoria does not show the closure of Hazelwood). ....................... 67
Figure 17. Volume weighted average price in the NEM ................................................... 68

16
1 Introduction
This report has been prepared for the Australia Institute in the context of advice on the
Energy Security Board’s (ESB) Post-2025 redesign of the National Electricity Market
(NEM). There is an increasing focus on what has been called Essential System Services of
which “inertia” and “system strength” are important parts. We understand that the ESB
intends to recommend changes to the arrangements for the provision of these services as
part of its work on the redesign of the NEM.
We have been asked to:
• examine the existing arrangements for the provision of inertia and strength
including their supply and demand;
• assess the implications of the closure of synchronous generation; and
• advise on whether the institutional arrangements for the provision of inertia and
strength might be improved.
The report is set out as follows:
• Section 2 provides relevant background starting with definitions of inertia and
system strength and proceeding to quantitative and discursive material on how
the power system is changing and ending with a precis of relevant technical
studies, a description of the institutional arrangements and their recent
developments and finally some facts on investments that have been motivated by
inertia and system strength.
• Section 3 analyses the arrangements for the provision of inertia and system
strength. It is here that we assess and then argue for changes.
• Sections 4 concludes and Section 5 recommends.
17
2 Background
2.1 Definitions
2.1.1 Inertia
Rotational inertia describes the resistance of a spinning object to change its rotating
speed. Changing a rotating objects speed requires force and input energy, that depends
on the weight of the object and is speed of rotation: heavier objects spinning fast have
more kinetic energy than small objects spinning slowly, and hence harder to speed up or
slow down.
In a power system inertia refers to the resistance of the system to momentary changes in
the system-wide demand and supply. Most inertia is provided through the rotating
masses of the generators operating in the system. Induction motors also supply inertia
through their rotating masses, but this is less than the inertia provided by the rotating
mass in generators. Networks also provide inertia through their inductance but this is
less than the inertia in generators and motors.
The aggregate inertia in a power system is the sum of the energy stored in all connected
and operating rotating synchronous generators and machines. If the system operator
perfectly forecasts demand and perfectly dispatches generation to meet this demand, the
generators in interconnected regions will all rotate together at 50Hz (i.e. 50 full rotations
per second). If demand exceeds generation whether because of forecast error, generator
malfunction or a system fault, the frequency of rotation of all generators will reduce. If
generation exceeds demand, the system frequency will increase until brought back into
balance.
The Rate of Change of Frequency (RoCoF) after a system disturbance, measured in Hz
per second, depends on the amount of inertia in the system: a system with more inertia
will change its frequency more slowly. In the NEM, the automatic access standard is to
be able to operate continuously with a RoCoF of 4 Hz/s for 0.25 seconds, and 3 Hz/s for

18
more than one second. The system RoCoF should be maintained within this range. If
RoCoF increases above this limit, significant generation tripping could occur2.
Inertia is the first response to frequency changes after a disturbance; however, inertia is
not the only response needed to keep the system balanced. If the system operator does
not dispatch additional/less generation to make up shortfalls/surpluses the frequency
will continue to decline/rise and if not addressed this could result in widespread
blackouts. Reliable power system frequency operation requires a combination of:
1. Inertia acting in the first second after a disturbance, used to slow the rate of
change of system frequency and allow generation to respond.
2. Fast-acting generation responding in the first thirty seconds after a disturbance
(primary frequency control) and used to keep the frequency in a safe operating
range.
3. Slower acting generation greater than thirty seconds after a disturbance
(secondary frequency control), used to bring the system back to 50Hz.
In the Australian National Energy Market, most inertia is provided by coal, gas and
hydro generators. A substantia amount of inertia is also provided by the inductance in
the transmission system and in the rotating on the demand side3. Primary frequency
control is provided by automatic generation control (AGC), regulation frequency control
ancillary services (FCAS) and 6 Second contingency FCAS.
2 AEMO, (March 2020). Renewable Integration Study Stage 1 Appendix B: Frequency control, at
https://aemo.com.au/-/media/files/major-publications/ris/2020/ris-stage-1-appendix-b.pdf
3 In particular, AEMO has historically assumed that main and NEM load would decline by 1.5%
for a 1% reduction in power system frequency (0.5 Hz). At the average level of demand in the
NEM, this means that load was assumed to reduce by 375 MW (on average) for a 1% change in
frequency. To put this into context this is approximately equivalent to the average volume of 6
second raise purchased in the ancillary services market. AEMO has more recently revised its
assumption of load relief and now assumes that load will decline by 0.5% for a 1% reduction in
system frequency.

19
Supply and demand imbalances caused by forecasting errors or minor disturbances are
adjusted at four-second intervals using the regulation FCAS reserves. Contingency
events such as a generator failure are managed by the FCAS contingency reserves,
allowing for the dispatch of energy in 6-second, 60-second- and 5-minute time frames to
restore system frequency.
In grids with low inertia and in which generators have limited ability to sustain operation
when the frequency is changing rapidly, faster-acting contingency services operating in
the first couple of seconds will be particularly valuable.
For a system disturbance, the post-fault dynamics is not only a function of the total
system inertia but also of the spatial distribution of inertia across the grid.4
2.1.2 System strength
The literature uses a range of definitions of system strength, but most relate to the ability
of a power system to maintain stable voltage levels across the network after large faults,
such as from short circuits. In the National Electricity Rules ”fault level” refers to the
impact of a three-phase fault5 and is measured at each fault node (in MVA) and is
proportional to the fault current (in Amps) and the voltage at the fault node (in Volts).
The AEMC defines system strength as: “ a characteristic of an electrical power system that
relates to the size of the change in voltage following a fault or disturbance on the power system.
System strength can be measured by the availability of fault current at a given location. High
fault levels are generally found in a strong power system while low fault levels are representative
of a weak power system. When the system strength is high at a connection point the voltage
4 F. Milano, F. Dorfler, G. Hug, D. J. Hill, and G. Verbič, (2018). Foundations and challenges of low-
inertia systems (Invited Paper), in 20th Power Systems Computation Conference, PSCC 2018.
5 A three phase fault describes the condition where the three conductors are physically held
together with zero impedance between them.
20
changes very little for a change in the loading (i.e. a change in load or generation). However, when
the system strength is lower the voltage would vary more with the same change in loading.' 6
AEMO on the other hand has defined system strength as:" as the ability of the power system
to maintain and control the voltage waveform at any given location in the power system, both
during steady state operation and following a disturbance. The system strength at a given location
is proportional to the fault level at that location, inversely proportional to effective grid-following
Inverter-based resources penetration seen at that location (where close by grid-following Inverter-
based resources reduces system strength more so than electrically distant Inverter-based
resources). System strength is also a function of the severity of system events on the stability of
Inverter-based resources (for example, loss of a major transmission line connecting the afore
mentioned location to the broader power system, resulting in sudden changes in fault level and
voltage angle at that location).7
As highlighted by Gu et al.8, both AEMC and AEMO exclude inertia from their system
strength definition and use fault level as the metric. While inertia does increase system
strength, there are many other ways to address a shortfall which we discuss in Section
3.2.2.
In AEMO's 2020 definition for system strength, they expand on the AEMC's definition
for system strength, suggesting that system strength is inversely proportional to the
amount of grid-following inverter-based generation close to a fault node. This is because
at present the controllers used in inverter-based generation provide a significantly lower
and different contribution towards fault levels, which means that the lowest system
6 AEMC, (March 2020). Investigation into System Strength Frameworks in the NEM, at
https://www.aemc.gov.au/sites/default/files/documents/system_strength_investigation_-
_discussion_paper.pdf
7 AEMO, (March 2020). System strength in the NEM explained, at https://aemo.com.au/-
/media/files/electricity/nem/system-strength-explained.pdf
8 H. Gu, R. Yan and T. Saha, (Sept. 2019), Review of system strength and inertia requirements for the
national electricity market of Australia, in CSEE Journal of Power and Energy Systems, vol. 5, no. 3,
pp. 295-305, doi: 10.17775/CSEEJPES.2019.00230.

21
strength on a power system is likely to be in a part where generation is dominated by
inverter-based generation and electrically remote from synchronous machines9.
2.2 How is the power system changing?
Historically the NEM has had an abundance of inertia provided by synchronous coal,
hydro and gas generators, never dropping below about 70 GW.s before 2019 as shown in
Figure 1. The system is now transforming to include more renewable energy, most which
generally does not supply inertia or synthetic inertia.10 Historically, NEM mainland
inertia has never been below 68,000 MWs. By 2025, AEMO suggests that mainland NEM
total inertia could fall to 45,000 MW.s11.
Figure 1. Mainland inertia duration curves, 2015-19 and forecast for 2025
Source: AEMO, Renewable Integration Study (https://aemo.com.au/-/media/files/major-
publications/ris/2020/ris-stage-1-appendix-b.pdf)
9 AEMO, (March 2020). System strength in the NEM explained, at https://aemo.com.au/-
/media/files/electricity/nem/system-strength-explained.pdf
10AEMO, (July 2020). Power System Requirements, at https://www.aemo.com.au/-
/media/Files/Electricity/NEM/Security_and_Reliability/Power-system-requirements.pdf
11AEMO, (March 2020). Renewable Integration Study Stage 1 Appendix B: Frequency control, at
https://aemo.com.au/-/media/files/major-publications/ris/2020/ris-stage-1-appendix-b.pdf

22
In the rest of this sub-section, we summarise power system changes underway in the
NEM and discuss how the changes impact system strength and inertia.
2.2.1 Demand for synchronous generation
The minimum operational demand12 across the NEM is declining, in part because
consumption is declining and in part by because the rooftop solar generation is
increasing. The demand left for synchronous generators (residual demand)13 is declining
even faster due to the uptake of renewables in all regions of the NEM. At times of
exceptionally low residual demand, fewer synchronous generators are operating and so
system inertia is reduced. The monthly minimum residual demand from 2012 to 2020 is
shown in the heat map charts in Figure 2 where the colours represent residual demand.
Figure 2. Heat map charts showing the lowest residual demand (demand minus large scale
renewable production) in each NEM region
12 Operational demand is the demand that must be met by centrally dispatched generation. In
other words, it is the total electrical consumption from grid-connected consumers less
production from rooftop solar.
13 Residual demand is the operational demand minus large-scale renewable production at each
5-minute period

23
In the last two years, all regions saw their lowest residual demands of recent history.
SA's 2020 residual demand often went negative meaning that all of SA's demand was
provided by renewables with excess production being exported; currently SA is the only
state that has a negative residual demand. In 2020, Victoria saw residual demand fall to
1,490MW in October 2020; by contrast the minimum stable operation of Victoria's three
brown coal plants is approximately 2,800 MW. This means that if Victoria cannot export
the excess production, brown coal or renewables will be curtailed. Queensland also
experienced its lowest residual demand of 2,700MW in September 2020 and Tasmania
experienced 420MW in October 2020.
AEMO estimates that renewable production will exceed 75% of NEM demand at some
30-minute periods in 202514 and often provide over 50% of NEM demand. As the market
for coal generation declines it is likely to require significantly different operating regimes
for coal such as intra-day decommitment, seasonal withdrawal or if this can not be
sustained, closure.
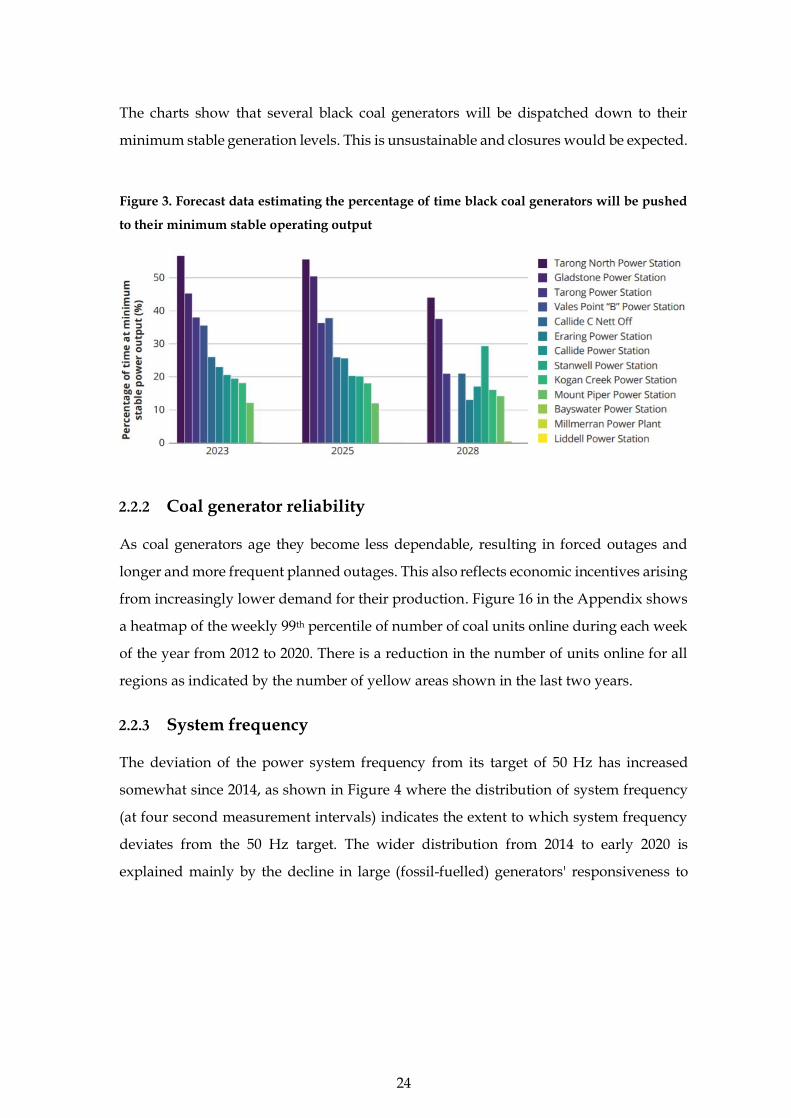
Figure 3 shows modelling results15 from a previous VEPC report that estimated the
percentage of time black coal generators will be pushed to their minimum stable
operating conditions, taking account of the forecast growth of renewables and demand.
14 AEMO, (April 2020). Renewable Integration Study: Stage 1 report, at https://aemo.com.au/-
/media/files/major-publications/ris/2020/renewable-integration-study-stage-1.pdf
15 Mountain, B. R., and Percy, S. (2019). Ensuring reliable electricity supply in Victoria to 2028: suggested policy changes. Victoria Energy Policy Centre, Victoria University, Melbourne, Australia.
24
The charts show that several black coal generators will be dispatched down to their
minimum stable generation levels. This is unsustainable and closures would be expected.
Figure 3. Forecast data estimating the percentage of time black coal generators will be pushed
to their minimum stable operating output
2.2.2 Coal generator reliability
As coal generators age they become less dependable, resulting in forced outages and
longer and more frequent planned outages. This also reflects economic incentives arising
from increasingly lower demand for their production. Figure 16 in the Appendix shows
a heatmap of the weekly 99th percentile of number of coal units online during each week
of the year from 2012 to 2020. There is a reduction in the number of units online for all
regions as indicated by the number of yellow areas shown in the last two years.
2.2.3 System frequency
The deviation of the power system frequency from its target of 50 Hz has increased
somewhat since 2014, as shown in Figure 4 where the distribution of system frequency
(at four second measurement intervals) indicates the extent to which system frequency
deviates from the 50 Hz target. The wider distribution from 2014 to early 2020 is
explained mainly by the decline in large (fossil-fuelled) generators' responsiveness to
25
system frequency as their automatic governor/generation control systems16 were
switched off, combined with an increase in intermittent generation in the NEM17. After
September 2020 as the graph shows the system frequency deviation from the 50 Hz target
narrowed greatly following the introduction of the primary frequency response
requirement for large generators from the last quarter of 2020, which meant, essentially,
coal generators turning their automatic generation control system back on again. This
evidence suggests that, contrary to popular perception, the decline in frequency
performance in the NEM is largely explained by the coal-fired generators decisions to
switch off their automatic governor control systems.
16 These are automated control systems that affect production in very short time periods in
response to power system conditions. The typically adjust first the excitation on the rotors and
then the amount of steam directed to the turbine blades.
17 AEMC, (December 2020). Frequency control rule changes , at
https://www.aemc.gov.au/sites/default/files/2020-
12/Frequency%20control%20rule%20changes%20-
%20Directions%20paper%20Info%20sheet%20-%20December%202020.pdf

26
Figure 4. 3D histogram of system frequency in the mainland NEM since 2011
Data source: Before 2020: AEMC, Figure 4.10: Frequency distribution on NEM mainland and 2020:
AEMO, Frequency and time deviation monitoring.
2.2.4 Grid-scale batteries and frequency services
Frequency fluctuations and major disturbances are currently managed in the NEM using
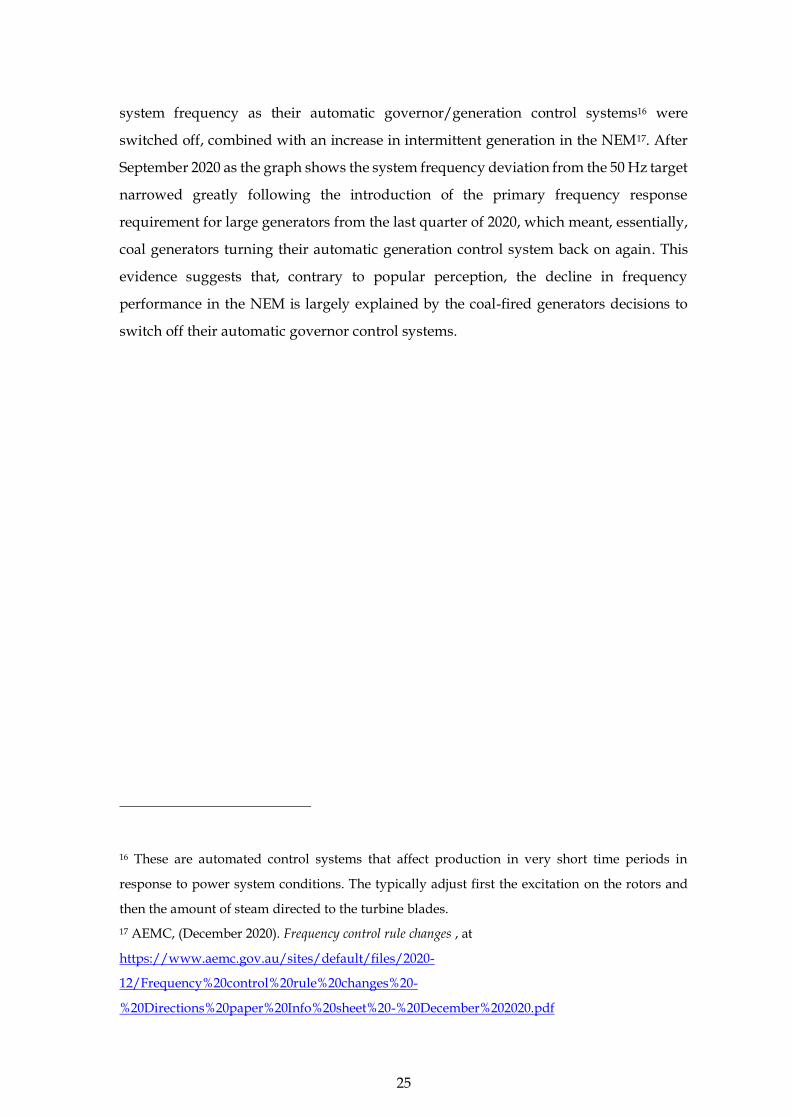
Frequency Control Ancillary Services (FCAS). Figure 5 shows the annual cost of the eight
NEM FCAS reserve markets from 2012 to 2020. Figure 6 shows the cost of the FCAS
provided by black and brown coal generation is a little over a third of the FCAS cost in
2020 ($363m). An 18 day separation of Victoria and South Australia on 31 January 2020
contributed to the record FCAS costs in 2020.
Figure 5. Regulation and contingency FCAS reserve payments in the NEM by calendar year.
27
Figure 6. Regulation and contingency FCAS payments to coal generators in the NEM, by
calendar year.
The FCAS markets in the NEM are changing as battery storage is increasingly displacing
coal, gas and hydro generators. Figure 7 and Figure 8 show the volume and cost of raise
regulation FCAS provided by each fuel type. Figure 9 and Figure 10 show the volume
and cost of 6-second raise contingency FCAS provided by each fuel type. This is the
“fastest” frequency response market. The step-up shown in FCAS regulation reserve
requirements in March 2019 is explained to a 50 MW increase in the regulation FCAS
requirement18.
The volume of FCAS provided by battery systems has rapidly grown since the end of
2018 when the Hornsdale power reserve was commissioned and since when three other
smaller batteries have entered service. The aggregate capacity of these batteries is around
1% of the capacity of the NEM’s coal generators, yet these batteries already provide about
as much FCAS as 20,000MW of coal generation.
The FCAS markets do not transact large volumes. In particular about 250 MW of
RaiseReg and about 400MW of 6-second raise contingency are required across the NEM.
FCAS contingency reserves have gone up in September 2019 due to a reduction in the
1818 AEMO, (2019). Regulation FCAS changes, at https://aemo.com.au/-
/media/Files/Electricity/NEM/Security_and_Reliability/Ancillary_Services/Frequency-and-
time-error-reports/Regulation-FCAS-factsheet.pdf

28
amount that AEMO assumes that synchronous demand will reduce as power system
frequency declines19.
Figure 7. Volume of raise regulation FCAS provided by each fuel type in the NEM
Figure 8. Cost of raise regulation FCAS provided by each fuel type in the NEM
Figure 9. Volume of raise 6 second FCAS provided by each fuel type in the NEM
19 AEMO, Load relief, at https://aemo.com.au/en/energy-systems/electricity/national-
electricity-market-nem/system-operations/ancillary-services/load-relief

29
Figure 10. Total Cost of raise 6 second FCAS provided by each fuel type in the NEM
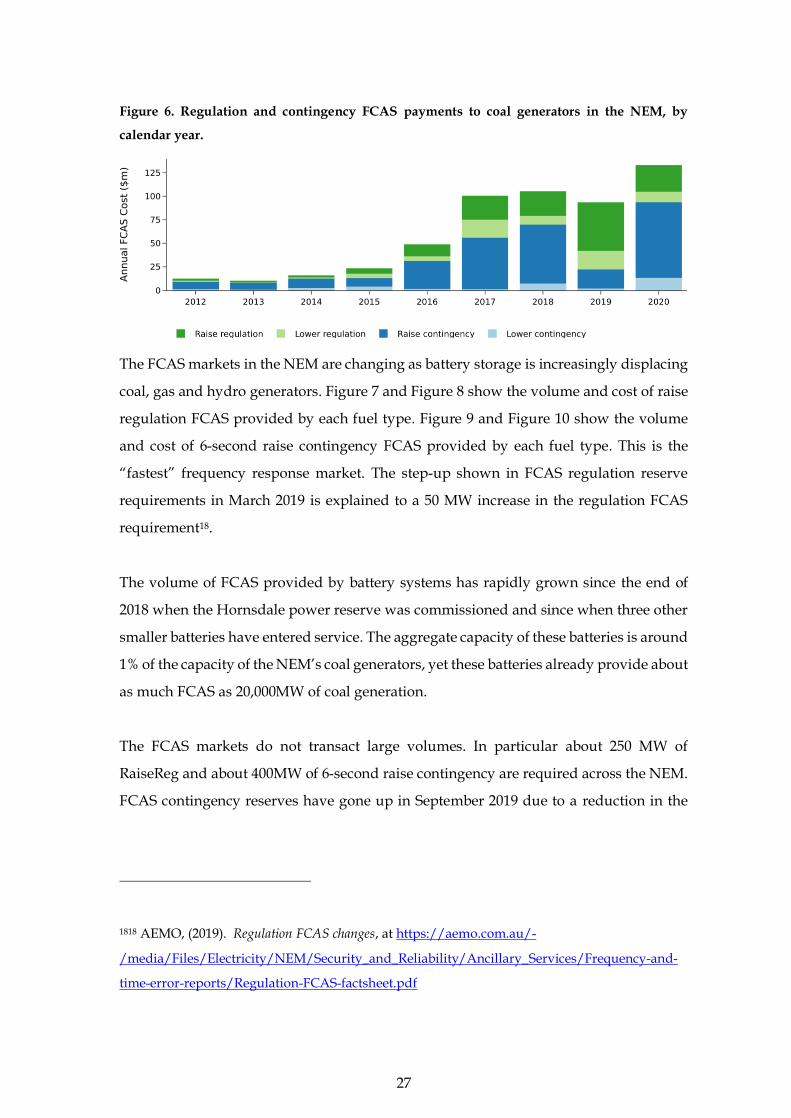
Figure 11 show the average price received by generators of different fuel types when
providing raise regulation and Figure 12 shows the price received by generators of
different fuel types when providing raise 6 second FCAS20. It shows that the most
expensive 6 second FCAS has been provided by gas generation and brown coal
generation.
Figure 11. Price ($/MW/5-minutes) of raise regulation FCAS in the NEM
20 This was calculated by dividing the total annual cost per fuel type divided by the sum of the
volume provided by that fuel type at all five minute periods.
30
Figure 12. Price ($/MW/5-minutes) of raise 6 second FCAS in the NEM
2.3 Inertia and system strength technical studies, institutional
developments and investment response
2.3.1 Technical studies
The starting point for the focus on inertia and system strength can be traced to AEMO's
Future Power System Security (FPSS) program which started in 2015 with the aim of
identifying challenges to power system security over the coming decade. The program
explored a number of areas including frequency control and system strength. The final
progress report21 published in early 2017 pointed to inertia shortfalls in South Australia
and Tasmania. With respect to system strength, it noted that in South Australia a
minimum combination of synchronous units had been instructed to remain online but
that more needed to be done to understand this better.
As part of the FPSS program, in June 2016 AEMO engaged GE Energy Consulting (GE)
to explore the potential value of a Fast Frequency Response (FFR) service in the NEM.
21AEMO, (January 2017). Progress Report: Future Power System Security Program, at
https://aemo.com.au/-
/media/files/electricity/nem/security_and_reliability/reports/2017/fpss-progress-report-
january-2017.pdf
31
The conclusions that AEMO drew22 from GE's advice23 was that several FFR-type
technologies such as batteries, flywheels and supercapacitors can respond very rapidly
to a triggering signal (within 40 milliseconds). Others, such as inertia-based FFR (IBFFR)
from wind turbines - often termed "synthetic inertia" - more typically deliver FFR in one
to two seconds, although GE noted that this response is highly tailorable.
One of the last reports24 published in 2017 under the FPSS program focussed on the
possibilities of Fast Frequency Response (FFR). FFR refers to a rapid active power
increase or decrease by generation or load in a timeframe of two seconds or less, to correct
a supply-demand imbalance and assist in managing power system frequency. Many
inverter-connected technologies, such as wind, photovoltaics (PV), batteries and other
types of storage have the capability to deliver FFR. The report suggests that FFR is a
partial substitute for inertia (inertia from synchronous units can slow frequency change
but can't restore power system frequency while FFR can slow the change of frequency
and also, by injecting active power, it can restore system frequency).
AEMO has a large program of work on frequency with many reports and studies in
addition to the routine inertia and system strength reports. A major recent report on
inertia and system frequency is AEMO's Renewable Integration Study Stage 1 Report
2020 (relevant information from this report was cited earlier)25. Relevant routine reports
include:
22AEMO, (March 2017). Fast Frequency Response Specification, at https://aemo.com.au/-
/media/files/electricity/nem/security_and_reliability/reports/2017/ffr-coversheet-
20170310.pdf)
23 AEMO, (2017). GE FFR Advisory, at https://www.aemo.com.au/-
/media/files/electricity/nem/security_and_reliability/reports/2017/20170310-ge-ffr-advisory-
report.pdf?la=en
24AEMO, (2017). FFR Working Paper, at https://aemo.com.au/-
/media/files/electricity/nem/security_and_reliability/reports/2017/ffr-working-paper.pdf
25 AEMO, (April 2020). Renewable Integration Study: Stage 1 report, at https://aemo.com.au/-
/media/files/major-publications/ris/2020/renewable-integration-study-stage-1.pdf
32
• the Power System Security Risk Review (published at least bi-annually) to assess
the robustness of the power system to non-credible (i.e. unlikely) events;
• the System Strength and Inertia report (published at least annually26) to assess the
possibility of shortfalls (the requirement to publish these reports is established in
the rule changes discussed below);
• reports to notify the market of inertia or system strength shortfalls.27
2.3.2 Institutional developments
The recent history of the institutional arrangements for system strength and inertia might
begin with the AEMC's 2017 System Security Frameworks Review. The actions
recommended in that review, as well as contemporaneous rule change proposals from
the South Australian Energy Minister, resulted in decisions that define the institutional
arrangements for the provision of inertia and system strength. To put the examination
of these in a broader context, it should be noted that the AEMC’s System Security
Frameworks Review suggested further study of whether inverters should be required to
operate with lower fault currents; whether mandatory governance response on fossil fuel
generators be introduced; how FCAS markets worked and whether they should be
changed; and whether new entrant plant should be required to have fast active power
control.
26 For the inaugural report published at the end of 2020 see for example: AEMO, (December
2020). 2020 System Strength and Inertia Report, , https://www.aemo.com.au/-
/media/files/electricity/nem/planning_and_forecasting/Operability/2020/2020-System-
Strength-and-Inertia-Report
27 See for example AEMO, (August 2020). Notice of South Australia Inertia Requirements and Shortfall, at https://aemo.com.au/-/media/files/electricity/nem/security_and_reliability/system-security-market-frameworks-review/2020/2020-notice-of-south-australia-inertia-requirements-and-shortfall.pdf&hash=673E32C8547A8170C9F4FA34323F3A8F)

33
More recently, a major report by FTI Consulting28 for the ESB has considered a range of
institutional and market design issues relevant not just to system strength and inertia but
also various other Essential System Services. The FTI report however did not recommend
any specific arrangements.
System strength
The institutional arrangements for the provision of "system strength" were defined by
the AEMC in its decision29 on rule changes proposed by the South Australian Energy
Minister in mid 201630. The proponent suggested AEMO should be responsible for the
provision of system strength31. The AEMC's final determination of the rule changes
requires AEMO to determine whether there is now or is likely to be in future, system
strength shortfalls, and to periodically publish the results of their studies. Transmission
network service providers (NSPs) were also given a regulated (by AER) monopoly over
the provision of system strength services. Under the rules newly connecting generators
are also obliged to "do no harm" (by diminishing system strength). This means that they
are required to mitigate any reduction in system strength by developing compensating
infrastructure, at their expense.
28 FTI Consulting, (August 2020). Essential System Services in the National Electricity Market,
https://www.fticonsulting.com/~/media/Files/emea--
files/insights/reports/2020/sept/essential-system-services-national-electricity-market.pdf
29AEMC, (September 2017). National Electricity Amendment (Managing power system fault levels)
Rule 2017, at https://www.aemc.gov.au/sites/default/files/content/4645acea-e66f-4b5b-94a1-
1dd14e7f8a93/ERC0211-Final-determination.pdf
30 Minister for Mineral Resources and Energy, (July 2016). Rule change proposal, at
https://www.aemc.gov.au/sites/default/files/content/073a6ab7-ca4b-4408-8a0e-
8833e3c497f2/ERC0211-Rule-change-proposal-National-Electricity-Rules-SA-Minister-for-
Mineral-Resources-and-Energy-as-published-on-website.PDF and Minister for Mineral
Resources and Energy, (July 2016). Rule change proposal, at
https://www.aemc.gov.au/sites/default/files/content/cd295d50-46a0-4c1e-a988-
2453ebc07f0c/ERC0214-Rule-change-proposal-National-Electricity-Rules-SA-Minister-for-
Mineral-Resources-and-Energy-as-published-on-website.PDF
31 In fact this is what the first sentence of the covering letter to their proposal said.

34
In response to criticism of these arrangements, the AEMC has recently completed a
further investigation; "Investigation into the System Strength Frameworks in the NEM".32
The AEMC now proposes an "evolved framework" for system strength, the essence of
which is to further reduce AEMO's role in setting the demand for system strength, to
increase the scope of the NSPs monopoly in planning and proactive provision of system
strength. The “do no harm” provision it suggests, should be changed so that newly
connecting generators are charged a fee based on the marginal cost of mitigating system
strength shortfalls (as determined by the NSP at their discretion). Connecting generators
can appeal this by requesting (at their expense) a specific study of their situation. The
AEMC said that it expects that this will almost certainly mean a higher fee than the
automatic fee that NSPs determine (which is meant to be based on the marginal cost of
mitigating any system strength shortfalls).
Inertia
The South Australian Minister for Mineral Resources and Energy proposed new rules
affecting the arrangements for the provision of inertia33 at the same time that it proposed
rules for the provision of system strength. As for system strength, in the inertia rule
change proposal, the South Australian minister proposed that AEMO be made
responsible for the provision of inertia. The AEMC ruled on this proposal, mirroring the
arrangements it developed for system strength: that AEMO be made responsible for
establishing whether there are now (or there will be in future) inertia shortfalls. NSPs
were then made responsible for providing inertia. This decision effectively implemented
the recommendations of the AEMC's earlier System Security Frameworks Review.
32 AEMC, (October 2020). Investigation into system Strength frameworks in the NEM, at
https://www.aemc.gov.au/sites/default/files/2020-
10/System%20strength%20investigation%20-%20final%20report%20-%20for%20publication.pdf
33Minister for Mineral Resources and Energy, (July 2016). Rule change proposal, at
https://www.aemc.gov.au/sites/default/files/content/cd295d50-46a0-4c1e-a988-
2453ebc07f0c/ERC0214-Rule-change-proposal-National-Electricity-Rules-SA-Minister-for-
Mineral-Resources-and-Energy-as-published-on-website.PDF

35
Other relevant developments include the AEMC's rejection (in 2018) of a proposal to
establish a spot market in inertia34, and its acceptance for consideration of a proposal (in
2020) for the creation of a fast frequency response spot market.
In 2020, following a proposal by AEMO35, the AEMC also set rules36 for the mandatory
provision of primary frequency by synchronous generators with Automatic Generator
Control (synchronous generators had gradually deactivated their AGC systems in recent
years contributing to the degradation in inertia37) but only for a limited period (until 4
June 2023). The AEMC is currently considering replacing this mandatory obligation with
its preferred approach of a spot market for the provision of primary frequency response.
2.3.3 Inertia and system strength investments
We have identified investments in South Australia, Victoria, Tasmania, Queensland and
New South Wales motivated primarily by the supply of inertia or system strength.
34 AEMC, (February 2018). National Electricity Amendment (Inertia Ancillary Service Market) Rule
2018, at https://www.aemc.gov.au/sites/default/files/content/0eea371b-f1c0-4071-83c3-
3cb3fab91c63/Final-version-for-publication-ERC0208-Final-Determination.pdf
35 AEMC, (September 2019). Primary Frequency Response Rule Changes, at
https://www.aemc.gov.au/sites/default/files/2019-
09/Primary%20frequency%20response%20rule%20changes%20-%20Consultation%20paper%20-
%20FOR%20PUBLI..._0.pdf
36 AEMC, (March 2020). National Electricity Amendment (Mandatory Primary Frequency Response)
Rule 2020, at https://www.aemc.gov.au/sites/default/files/2020-03/ERC0274%20-
%20Mandatory%20PFR%20-%20Final%20Determination_PUBLISHED%2026MAR2020.pdf
37AEMC, (September 2019). Primary Frequency Response Rule Changes, at
https://www.aemc.gov.au/sites/default/files/2019-
09/Primary%20frequency%20response%20rule%20changes%20-%20Consultation%20paper%20-
%20FOR%20PUBLI..._0.pdf

36
The biggest investment justified primarily by the provision of inertia is the construction
by Electranet in South Australia of four synchronous condensers. This will require an
outlay of $181m (before offsets) and operating expenditure of $1m per year and is to be
paid for by South Australian electricity consumers.
The second largest investment, also in South Australia, is the 30 MW (8 MWh) Dalrymple
Battery. It uses Virtual Synchronous Generator technology, which strengthens the grid
by replicating the behaviour and performance of a synchronous machine, providing 200
MW.s38 of synthetic inertia and high fault current. It was also developed (and is owned)
by Electranet but partly funded by the Australian Renewable Energy Agency (ARENA).
The cost of the Dalrymple battery, net of ARENA’s contribution, is included in
Electranet’s regulated asset base.
In Victoria, in its role as the network service provider, AEMO has procured fault current
in Redcliffs in north western Victoria for two years. Inverter based generation has been
rapidly growing in the West Murry area of Victoria leading to concerns about voltage
fluctuations. In September 2019 AEMO constrained the output of five solar farms39 in the
West Murry area to mitigate these issues. In April 2020 the constraint was lifted through
a collaboration between AEMO, the distribution system operator and the owner of the
solar farms to test and implement different inverter settings40. The commercial
arrangements underpinning these changes are not publicly available.
In Queensland, Powerlink (the NSP) advertised an expression of interest for the
provision of fault current close to the 275 kV Ross substation in Far North Queensland.
The successful tenderer, Cleanco, offered to “tune” the inverters at the Daydream,
38 When the BESS is in service the total inertia requirement in SA for a 3 Hz/s RoCoF is reduced
from 5,417 MWs to 5,217 MWs, see: https://www.escri-sa.com.au/globalassets/reports/escri---
sa-operational-report-no.2---february-2020.pdf
39 https://www.pv-magazine-australia.com/2019/09/16/jolted-aemo-radically-curtails-output-
of-five-large-solar-farms/
40 https://aemo.com.au/newsroom/media-release/constraints-lifted-for-west-murray-solar-
farms

37
Hamilton, Hayman and Whitsunday solar farms in Far North Queensland. Again the
commercial arrangements of this are not publicly available.
In Tasmania, the network service provider contracted with Tas Hydro to procure inertia
until 2024.
In New South Wales there has not yet been a procurement of inertia or system strength
by the network service provider, although TransGrid is developing a grid forming
battery more than twice as large as the Dalrymple Battery, partially funded by ARENA
and the New South Wales Government. We understand that TransGrid has included
$5.9m in its Regulatory Asset Base for this battery. This means it has not been subject to
the Regulatory Investment Test (which only applies to investments above $6m. The
treatment of the full cost of the battery (expected to be above $50m) is not clear.

38
3 Analysis of arrangements for provision of inertia and
system strength
This section presents summary information of the demand and supply of inertia and
system strength and then evaluates the current arrangements for their provision, and
then suggests alternative approaches.
3.1 Demand for inertia and system strength
As discussed previously, AEMO determines the minimum system strength and inertia
requirements in the NEM to determine if there is a risk of a shortfall in the next five years.
The inertia requirements include the 'minimum threshold level of inertia for when a region is
either islanded from the rest of the NEM or at credible risk of separation, and the secure operating
level of inertia for when a region is islanded'41.
System strength is assessed at each fault level node and must cover minimum three phase
fault levels at the node. AEMO applies the System Strength Requirements Methodology42
to identify a shortfall.
We summarise here the current situation and forecasts for system strength and inertia
shortfalls in the NEM according to AEMO's 2020 System Strength and Inertia Report,
and relevant shortfall declaration documents produced by AEMO since 2017.
41 AEMO, (December 2020). 2020 System Strength and Inertia Report, at
https://www.aemo.com.au/-
/media/files/electricity/nem/planning_and_forecasting/Operability/2020/2020-System-
Strength-and-Inertia-Report
42 AEMO, (July 2018). System Strength Requirements Methodology and System Strength Requirements
and Shortfalls, at https://www.aemo.com.au/-
/media/Files/Electricity/NEM/Security_and_Reliability/System-Security-Market-
Frameworks-Review/2018/System_Strength_Requirements_Methodology_PUBLISHED.pdf

39
New South Wales
In AEMO's 2020 assessment of system strength and inertia shortfalls they do not yet
consider a shortfall likely for New South Wales in the next five years. In this
assessment they estimate the retirement of Liddell Power Station in 2023 will not cause
system strength or inertia shortfalls in NSW. However, the future decommitment or
flexible operation of NSW's synchronous generators at times of low or minimum demand
may lead to system strength shortfalls at the Newcastle and Sydney West fault level
nodes. In AEMO's 2020 assessment they do not consider the supplies of strength or
inertia from a new 50MW battery in Western Sydney43 or the 700MW battery planned to
be installed in the Newcastle region44 which could help eliminate the shortfalls and
facilitate decommitments or closure of additional NSW coal generation.
Queensland
In April 2020 AEMO declared a 90 MVA fault level shortfall at the Ross fault level node
in Queensland for 2024-25 45. This shortfall has been addressed in the short term through
an agreement with CleanCo to supply system strength services and in the long term
through a number of control system changes to inverter-based generators in North
Queensland.
43 ARENA, (October 2020). Funding announced for NSW’s big battery, at
https://arena.gov.au/blog/funding-announced-for-nsws-big-battery/
44 Origin Energy, (January 2021). Origin progresses plans for nation’s largest battery at Eraring Power
Station, at https://www.originenergy.com.au/about/investors-media/media-
centre/origin_progresses_plans_for_nations_largest_battery_at_eraring_power_station.html
45AEMO, (April 2019). Notice of Queensland System Strength Requirements and Ross Fault Level
Shortfall, at
https://www.aemo.com.au/-/media/files/electricity/nem/security_and_reliability/system-
security-market-frameworks-review/2020/2020-notice-of-queensland-system-strength-
requirements-and-ross-node-fault-level-shortfall.pdf

40
In December 2020, AEMO did not declare a strength or inertia shortfall for Queensland.
However, AEMO estimates that in Queensland, the increasing levels of distributed and
large-scale solar generation will cause daytime prices to often reduce below the estimated
short run marginal cost of most coal-fired power stations which could lead to intra-day
decommitment or seasonal shutdowns. The low number of synchronous generation
units may lead to a system shortfall in Greenbank, Gin Gin and Western Downs.
Additionally, AEMO suggest that under the high renewable projection an inertia
shortfall for Queensland within the next five years may occur.
South Australia
For South Australia AEMO does not assess the secure operating level of inertia as a fixed
inertia level, like other states, but instead relates it to the amount of fast frequency
response available (see Figure 14 for the relationship between FFR and inertia for South
Australia).
AEMO declared an inertia shortfall for South Australia in August 2018. As discussed in
more detail later, to address this shortfall ElectraNet is developing four synchronous
condensers expected to be operational in 2021, to supply up to 4.4 GVA.s of inertia
costing $181.8m to which $166m will be paid by consumers46. AEMO has been
intervening in the market to secure the power system in South Australia. In August 2020,
AEMO declared inertia shortfalls for 2020-21 and 2021-22. AEMO says that the new
interconnector from South Australia to New South Wales (EnergyConnect), is expected
to alleviate inertia shortfalls for South Australia.
Victoria
In December 2019 AEMO declared a 312 MVA fault level shortfall at the 220kV Red Cliffs
fault node in the West Murray area of Victoria. To address this shortfall until 2022, as
discussed earlier AEMO secured services from facilities in the West Murray region.
46 AER, (August 2019). Final Decision ElectraNet Contingent Project, at
https://www.aer.gov.au/system/files/AER%20-%20Final%20Decision%20-%20ElectraNet%20-
%20SA%20system%20strength%20contingent%20project%20-%2016%20August%202019.pdf

41
AEMO is currently running a tender process for system strength in Red Cliffs beyond
2022 47.
System strength shortfalls in this region will be alleviated by the possible EnergyConnect
project. AEMO has not projected other system strength or inertia shortfalls for Victoria
in the next five years.
Tasmania
In November 2019, AEMO declared both an inertia and fault level shortfall in Tasmania.
It said an inertia shortfall of 2,350 MW.s can occur when there are insufficient hydro-
generating units online, which can be caused by high levels of import into Tasmania over
Basslink combined with low levels of local demand48. AEMO also declared a fault level
shortfall at the fault level nodes in George Town (530 MVA), Burnie (180 MVA),
Waddamana (310 MVA) and Risdon (320 MVA). TasNetworks addressed these
shortfalls by entering into a commercial agreement until 2024 with Hydro Tasmania to
run some of Hydro Tasmania’s units as synchronous condensers49. In AEMO's 2020
analysis, they conclude that the services provided by Hydro Tasmania will cover
Tasmania's system strength and inertia requirements until 2024.
3.2 Supply of inertia and system strength
This sub-section reviews technologies and mechanisms to supply inertia and system
strength.
47 AEMO, (2021). Call for Expressions of Interest Victorian System Strength, Available February 2021
at https://aemo.com.au/consultations/tenders/victorian-transmission/call-for-expressions-of-
interest-victorian-system-strength
48 AEMO, (November 2019). Notice of Inertia and Fault Level Shortfalls in Tasmania, at
https://www.aemo.com.au/-
/media/Files/Electricity/NEM/Security_and_Reliability/System-Security-Market-
Frameworks-Review/2019/Notice-of-Inertia-Fault-Level-Shortfalls-Tasmania-Nov-2019.pdf
49 TasNetworks, (2020). Annual Planning Report 2020, at https://www.tasnetworks.com.au/config/getattachment/4a3679b2-d65a-4c8e-b2f6-34920dbb2045/tasnetworks-annual-planning-report-2020.pdf

42
3.2.1 Inertia
Figure 13 summarises methods to increase inertia or reduce a power system’s inertia
requirement. Each method (described in detail below) is shown with arrows that show
the extent to which each method is best categorised as mainly in the fields of network
operation, power system operation or generation.
Figure 13. Methods to increase inertia categorised by main area of expertise
Synchronous generators
Synchronous generators contain a large amount of rotating mass in the generator and in
the turbines. Its rotational kinetic energy is the source of its inertia. Typically coal-fired
generators store enough kinetic energy to provide their peak capacity for around 3
seconds. Combined cycle gas generators store enough energy to provide their peak
capacity for about 5 seconds.
Synchronous condensers
Synchronous condensers are machines that resemble a synchronous generator or motor
but they do not have the ability to produce more energy than is contained in their rotating
components. However, unlike a generator or motor a synchronous condenser’s shaft
spins freely. The inertia provided by a synchronous condenser is related to the mass of
the rotor, and it is common to add a fly wheel to increase the amount of inertia that can
be supplied, albeit it only for a short interval.
Like a synchronous generator, a synchronous condenser resists a change in system
frequency by supplying active power from energy stored in its rotating mass. Similarly,
when the frequency increases, the synchronous condenser can absorb active power by
speeding up. The small amount of input power to overcome frictional losses and keep it
43
spinning comes from the grid. As discussed in Section 3.1, the inertia shortfall in South
Australia is being met mainly by synchronous condensers currently under construction.
Spahic et al.50 compares options to add inertia to manage a 500MVA disturbance in the
Ireland and Northern Ireland power transmission system. Their study first simulated the
frequency response on the system. With low levels of inertia, frequency changes in
response to power system events is large. They simulate the frequency response after
adding either a 550 MVA coal generator, a 50 MW battery, a 225 MVA synchronous
condenser, a 200 MW gas generator, a 1250 MVA nuclear power plant or supercapacitor
storage. They show a 225 MVA synchronous condenser does less to improve frequency
after a disturbance than the other methods.
Synthetic inertia (virtual synchronous generator)
Inverter-based generation can uses a control system to supply synthetic inertia51. This
means that the output from inverter-based generation can be programmed to respond to
changes in power system frequency, in a similar way to the inertial response of
synchronous generators52. The inertial response is programable, meaning the inertia
provided by the inverter is only subject to the energy source limitations and the inverter's
current rating. Spahic et al.53 show that a 50 MVA battery supplying synthetic inertia can
achieve a similar dynamic frequency response as a 550 MVA coal unit.
50 E. Spahic, D. Varma, G. Beck, G. Kuhn, and V. Hild, (2016). Impact of reduced system inertia on
stable power system operation and an overview of possible solutions, IEEE Power Energy Soc. Gen.
Meet., vol. 2016-Novem, no. 0325663, pp. 1–5.
51 Beck, H.P., Hesse, R., (2007). Virtual synchronous machine, in Proc. 9th International Conference
on Electrical Power Quality and Utilisation, Barcelona, Spain
52 Eriksson R, Modig N, Elkington K (2018). Synthetic inertia versus fast frequency response: A
definition. IET Renew Power Gener 12(5): 507-514
53 E. Spahic, D. Varma, G. Beck, G. Kuhn, and V. Hild, (2016). Impact of reduced system inertia on
stable power system operation and an overview of possible solutions, IEEE Power Energy Soc. Gen.
Meet., vol. 2016-Novem, no. 0325663, pp. 1–5.

44
Synthetic inertia inverters require an energy source which can be provided from a
battery, the kinetic energy contained in wind turbine blades or by curtailing the
production of a PV plant, thus allowing a quick increase in power if inertia is needed.
Synthetic inertia inverters create their own voltage waveform and can operate islanded
from the rest of the network.
A review of the limitations associated with synthetic inertia is given by Milano et al.54
They summarise the major issues to be control instabilities, actuation delays and
unpredictable dynamic interactions with the rest of the system. Control instabilities and
actuation delays have been investigated and solved through various methods in 55, 56, 57.
Unpredictable dynamic interactions require real world testing to fully understand.
Currently the 30 MW Dalrymple battery58 and the second (50-MW) phase of the
Hornsdale Power Reserve59 can supply synthetic inertia to the South Australian system.
Additionally, TransGrid is installing a 50MW battery in Western Sydney to supply
synthetic inertia60. It is likely that many new batteries will also have synthetic inertia
capability.
54 F. Milano, F. Dorfler, G. Hug, D. J. Hill, and G. Verbič, (2018). Foundations and challenges of low-
inertia systems (Invited Paper), in 20th Power Systems Computation Conference, PSCC 2018.
55 H. T. Nguyen, G. Yang, A. H. Nielsen, and P. H. Jensen, (2018). Frequency stability enhancement
for low inertia systems using synthetic inertia of wind power, in IEEE Power and Energy Society
General Meeting, vol. 2018-January, pp. 1–5.
56 H. T. Nguyen, G. Yang, A. H. Nielsen, and P. H. Jensen, (2019). Combination of synchronous
condenser and synthetic inertia for frequency stability enhancement in low-inertia systems, IEEE Trans.
Sustain. Energy, vol. 10, no. 3, pp. 997–1005,
57 H. R. Chamorro, I. Riaño, R. Gerndt, I. Zelinka, F. Gonzalez-Longatt, and V. K. Sood, (2019).
Synthetic inertia control based on fuzzy adaptive differential evolution, Int. J. Electr. Power Energy
Syst., vol. 105, pp. 803–813.
58 ESCRI-SA, (2021). ESCRI-SA - Dalrymple Battery Project at: https://www.escri-sa.com.au/
59 ARENA, (2020). Hornsdale Power Reserve Upgrade - Australian Renewable Energy Agency
(ARENA), at https://arena.gov.au/projects/hornsdale-power-reserve-upgrade/
60 ARENA, (October 2020). Funding announced for NSW’s big battery, at
https://arena.gov.au/blog/funding-announced-for-nsws-big-battery/

45
It should also be noted that the responsiveness of batteries means that even if they are
not “grid forming” and programmed to respond automatically to frequency changes
they can increase production (or demand) almost instantaneously when instructed to.
This has been demonstrated at Hornsdale on several occasions61.
Generators with synchronous condensing clutches
It is possible to retrofit synchronous generators that would otherwise be shut down with
synchronous condensing clutches that decouple the generator from their driving turbine,
allowing them to run as synchronous condensers when decoupled62. This feature is
available on some peaking power plants (not in Australia), allowing the generator to
remain synchronised while the turbine is stationary. Generators with synchronous
condensing clutches are similar in many respects to synchronous condensers.
Fast active power response
Fast active power response is the injection of active power during the initial frequency
drop after a system disturbance (normally within the first two seconds). Providing power
at this time scale helps to manage a disturbance and downgrades the required inertia.
Fast active power response is distinct from synthetic inertia in that the inverter controller
does not aim to simulate the response of a synchronous generator, but instead it provides
power according to an ancillary service market dispatch or other market rule.
61 See Appendix B of https://hornsdalepowerreserve.com.au/wp-
content/uploads/2020/07/Aurecon-Hornsdale-Power-Reserve-Impact-Study-year-2.pdf
62 F. F. Li, J. Kueck, T. Rizy, and T. King. (2006, Apr.). A preliminary analysis of the economics of
using distributed energy as a source of reactive power supply, at
http://info.ornl.gov/sites/publications/Files/Pub1771.pdf

46
In the National Energy Market, the requirement for fast active power response has led to
the introduction of the Primary frequency response63 (PFR) requirement and the Fast
frequency response64 (FFR) market ancillary service proposal.
The Australian Energy Market Commission in March 2020 determined a rule that
required all scheduled and semi-scheduled generators in the NEM to support secure
system operation by automatically changing power output in response to changes in
system frequency65. Under the current PFR response requirement, generators should
achieve a 5% change in active power output resulting from a change in a frequency
beyond the PFR Deadband (49.985 to 50.015 Hz) in no more than 10 seconds66. In the
absence of a PFR response in the NEM, AEMO found that by 2023, frequency deviations
can reach levels that would cause tripping of frequency-based protection devices67.
63 AEMC, (March 2020). Mandatory primary frequency response, at
https://www.aemc.gov.au/sites/default/files/2020-
03/National%20Electricity%20Amendment%20%28Mandatory%20primary%20frequency%20re
sponse%29%20Rule%202020%20No.%205_for%20publication.pdf
64AEMC, (July 2020). Fast frequency response market ancillary service, at
https://www.aemc.gov.au/sites/default/files/2020-
12/Frequency%20control%20rule%20changes%20-%20Directions%20paper%20-
%20December%202020.pdf
65 AEMO, (2020). Primary frequency response https://aemo.com.au/en/initiatives/major-
programs/primary-frequency-response
66 AEMO, (August 2019). Primary Frequency Response Requirements, at
https://www.aemc.gov.au/sites/default/files/2019-10/AEMO%20-
%20Primary%20frequency%20response%20requirements%20V1.1%20-%20clean.PDF
67 AEMO, (November 2020). Power System Frequency Risk Review – Stage 2,
https://aemo.com.au/-/media/files/stakeholder_consultation/consultations/nem-
consultations/2020/psfrr/stage-2/2020-psfrr-stage-2.pdf

47
As part of the PFR requirement rule, coal generators and some large wind farms had to
implement this change before the last quarter of 202068. Figure 4 shows that the system
frequency remained much closer to 50Hz after September 2020.
The speed and quantity of the PFR requirement may be insufficient to manage a major
disturbance, requiring additional fast response from FFR. As described earlier, FFR is
defined by the AEMC as the increase or decrease of active power by generation or load
in less than 2 seconds69. At present there is no formal ancillary service arrangement for
FFR in the NEM. However, Infigen Energy has proposed a spot-market arrangement for
FFR8. In South Australia, FFR is being provided by the Hornsdale Power Reserve and
compensated through the 6 second FCAS contingency market. Figure 14 shows the
relationship between FFR and inertia for South Australia. This shows that doubling the
quantity of FFR reduces the required inertia by about 4,700MW.s which is slightly more
than the inertia provided by the four synchronous condensers installed in South
Australia in 2021.
68 Slightly different dates were given for each generator see:
AEMO, (September 2020). Implementation of the National Electricity Amendment (Mandatory
Primary Frequency Response) Rule 2020, at https://aemo.com.au/-
/media/files/initiatives/primary-frequency-response/2020/pfr-implementation-report-11-sep-
20.pdf
69AEMC, (July 2020). Fast frequency response market ancillary service, at
https://www.aemc.gov.au/sites/default/files/2020-
12/Frequency%20control%20rule%20changes%20-%20Directions%20paper%20-
%20December%202020.pdf

48
Figure 14. South Australia secure operating level of inertia (2022-23) adjusted for inertia
support activities, with four synchronous condensers
Data source: AEMO, 2020 System Strength and Inertia Report
Batteries are ideally suited to supply FFR because of their high ramp rates, changing from
zero to maximum output in 100 milliseconds or faster. Other forms of generation can also
provide FFR. A synchronous generator with a large capacity might be able to ramp up a
small proportion of its capacity (essentially from the heat inertia in its steam) to meet
their PFR requirements or supply FFR. Wind turbines can also provide their PFR
requirements or FFR using rotor kinetic energy (inertia) of the wind turbine blades to
temporarily boost the power output of wind farms in response to a drop in system
frequency 70. However, this comes at the expense of lower power production after the
initial response. In the National Energy Market there has been an increase of loads
supplying contingency FCAS, these loads could also supply FFR.
Network augmentation
Stronger or more interconnection can increase inertia and system strength by reducing
the electrical distance from synchronous generators and by increasing redundancy and
thus reduce risks associated with transmission outages and so allowing generation to be
operated closer to failure limits.
70ARENA, (September 2020). What is Inertia Based Fast Frequency Response?, at
https://arena.gov.au/assets/2020/09/what-is-inertia-based-fast-frequency-response.pdf

49
3.2.2 System strength
Figure 15 shows the methods to address a system strength shortfall. Several of the
methods that provide system strength also supply inertia, these are synchronous
generation, synchronous condensers, network augmentations and synthetic inertia. Here
we cover those additional methods not discussed in the previous sub-section.
Figure 15. Factors that affect system strength categorised into areas of expertise categories.
Grid following inverter settings
Inverter-based generation (normally wind and solar farms and some batteries) can
negatively influence system strength. This is because these generators normally use grid-
following inverters, that do not contribute towards system inertia. Grid following
inverters use a control method called a phase-lock-loop that follows a measurement of
the system voltage waveform.
Under low system strength conditions and at the time of a system fault, the delay in
measuring and responding to a change in system frequency can cause the inverter to
react unpredictably, negatively affecting the system and neighbouring grid-following
inverters. “Tuning” inverter settings can make inverter-based generation more robust to
system strength issues caused by inverter based generation. As noted earlier, this was

50
applied at the 220kV Red Cliffs fault node in the West Murray area of Victoria and also
in Far North Queensland71.
Reactive power supply and network relay updates
Voltage stability can be maintained by controlling the amount of reactive power in the
network. Decreasing reactive power causes the voltage to fall and increasing it causes
voltage to rise. Ensuring a stable voltage waveform increases system strength. This can
be done using static var compensators, static synchronous compensators (STATCOM)
and thyristor-controlled series capacitors. However, while improving voltage and fault
levels, these do not contribute to system inertia.
Synchronous condensers can also help maintain network voltage by supplying or
absorbing reactive power. The impact this has on addressing system strength is hard to
quantify in a general case as the contribution to system strength is heavily dependent on
a specific location in the network.
Finally upgrading network relays can help increase reliable operation in low inertia
conditions.
3.2.3 The economics of inertia and system strength supply
The economics of inertia is complicated because it is a joint product. For example
synchronous generators (or inverter-based generators) also provide energy or sell
frequency control services; synchronous condensers can also inject or withdraw reactive
power and provide fault current; batteries that can provide inertia also provide energy
and frequency control services; transmission lines can transport electricity but also
71 AEMO, (March 2021). Call for Expressions of Interest Victorian System Strength, at
https://aemo.com.au/consultations/tenders/victorian-transmission/call-for-expressions-of-
interest-victorian-system-strength

51
improve inertia and system strength; voltage improvement devices can also provide
system strength.
This “joint-product” characteristic means that the cost of providing inertia depends on
how common costs are shared between the different products. In addition, for some
sources of inertia, there is an opportunity cost: the provision of inertia may mean
foregoing opportunities for income in other markets (for example stored energy in a
battery that is used to provide inertia can not be sold into energy markets or frequency
control markets).
These complexities make comparisons of the cost of inertia from competing sources,
complex and contentious.
The joint product characteristic applies in much the same way to the economics of system
strength, most of whose sources of supply are also from devices that provide other
valuable services (inertia, voltage support, congestion relief etc.)
The joint product characteristic points to the value of markets for the provision of inertia
and system strength to discover innovative ways to transact for their provision.
Finally, both system strength and inertia seem to fit the definition of public goods (they
are not excludable and they are non-rivalrous). However Bilimoria et al (2020)72 define
system strength as a “congestible common pool resource”, by which they mean that it is
like a public good when supply is not constrained, but when supply falls short of demand
it becomes increasingly rivalrous and thus while always excludable, it no longer also
meets the non-rivalrous condition needed to satisfy definition as a public good when
supply is congested. The AEMC has adopted this conception as the justification of their
“do no harm” provision.
72 Billimoria, F. , P. Mancarella , R. Poudineh, (June 2020). Market design for system
security in low-carbon electricity grids: from the physics to the economics, at
https://doi.org/10.26889/9781784671600
52
We don’t think that this is appropriate since, regardless of disputes about the public good
nature, the typical supply of system strength or inertia exhibits economies of scale, and
comes in lumpy increments. This cost structure and technology characteristic, just like
that of transmission lines or transformers, defines a natural monopoly and hence
provides the rationale for co-ordinated provision to avoid the prospect of investment
hold-up or inefficient under-investment in order to reduce the prospect of free riding, if
provision is decentralised.
Furthermore, with respect of system strength in particular it is arbitrary to associate a
system strength shortfall with a generator who does not supply system strength. This is
because the existence of surplus or deficit of system strength is a function not just of the
connecting generator but of the state of the system that the generator connects to. In the
same way, it would be arbitrary to associate transmission congestion with the last
customer whose demand (added to that of other customers) exceeds the capacity of the
transmission line. To put it colloquially, “first in, best dressed” might be an accepted
social norm for the allocation of scarce resources but blaming the last straw for breaking
the donkey’s back has no place in an economically sound response to natural monopoly.

53
4 Evaluation of current arrangements for the provision
of inertia and system strength
This section evaluates arrangements for the provision of inertia and system strength. It
starts with a description of the assessment criteria and then proceeds to an assessment of
"do no harm" and NSP provision of inertia and system strength. The sub-section ends
with an assessment of the alternative of system operator responsibility for the provision
of inertia and system strength.
4.1 Assessment criteria
We focus on five criteria in the assessment: does the arrangement achieve effective co-
ordination; does it allocate risk correctly; will it stimulate innovation and learning; does
it provide incentives to efficiency and can it cater for jurisdictional differences in policy
objectives.
Effective co-ordination
Three dimensions of co-ordination are distinguished:
• Generation and power system: ensuring that generation entry and operation
takes account of the requirements for efficient power system operation and vice
versa;
• Generation and network: ensuring that generation entry and operation takes
account of the requirements for efficient network development and operation;
• Network and power system: ensuring that network operation is co-ordinated
with power system operation.
Appropriate risk allocation: Do the arrangements allocate risk to the entity/party that
is best able to manage the risk? If no such party can be identified, then is the risk allocated
to the entity/party that is best able to bear it?

54
Innovation and learning: Do the arrangements encourage innovation and disseminate
knowledge effectively? Arrangements that achieve this are likely to be characterised by
non-discriminatory market access and transparency, particularly with respect to prices
and the selection of competing suppliers.
Incentives to efficiency: Do the arrangements encourage rivalry amongst competing
providers and do consumers benefit from this?
Catering for jurisdictional differences in policy objectives:
Can the arrangements cater for jurisdictional differences in energy policy (for example
differing jurisdictional preferences on the rate of renewable generation expansion).
4.2 Assessment of "do no harm"
This sub-section assesses the existing “do no harm” arrangement.
Co-ordination
The "do no harm" requirements oblige connecting generators to mitigate harm to the
strength of the power system that their entry is estimated to cause. There is a clear co-
ordination problem here because it is impossible to objectively determine the "harm" that
a generator causes. For example, under the current arrangements the entry of a non-
synchronous generator to a system that has plenty of synchronous generation does no
harm; yet the entry of the same non-synchronous generator to a system with a shortage
of synchronous generation does harm. This means that “harm” is not a measure that
exists independently of the conditions on the system. The “do no harm” provision makes
the arbitrary selection that “harm” is defined at the time that assessment is made.
Subsequent developments might eliminate that harm or make it worse. The “harm” done
by a connecting generator is a function of the state of the system that it plugs into and
will change over time.
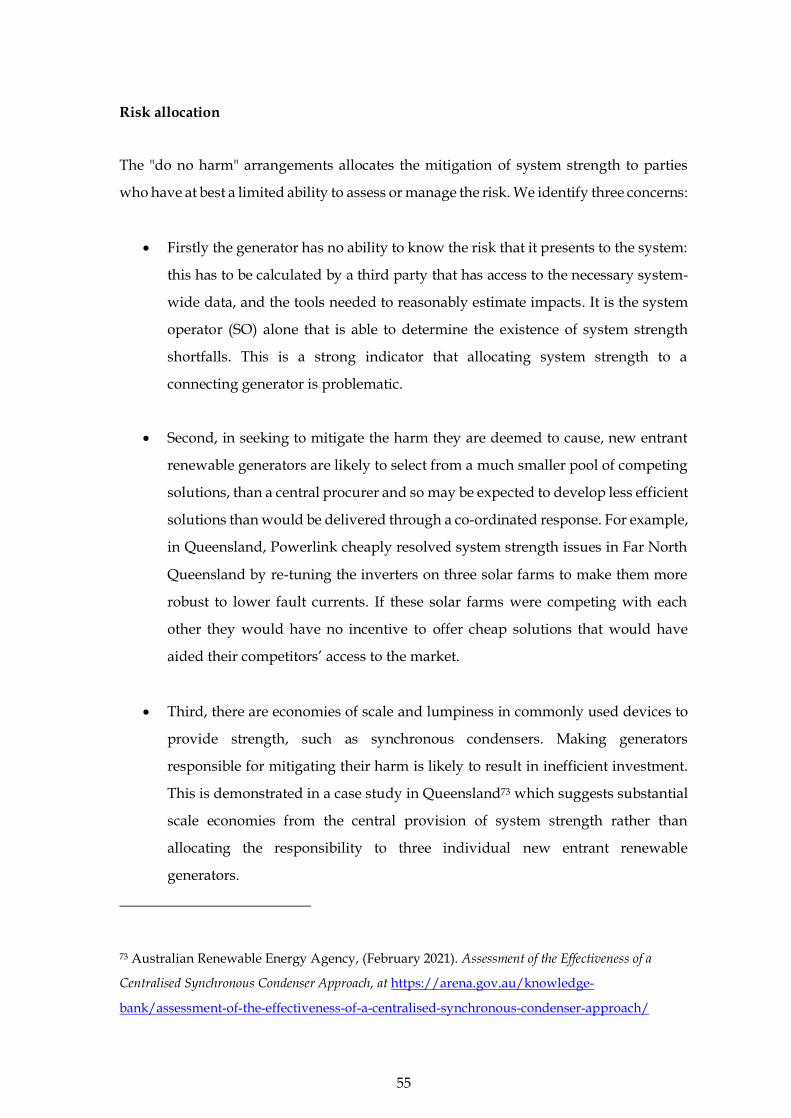
55
Risk allocation
The "do no harm" arrangements allocates the mitigation of system strength to parties
who have at best a limited ability to assess or manage the risk. We identify three concerns:
• Firstly the generator has no ability to know the risk that it presents to the system:
this has to be calculated by a third party that has access to the necessary system-
wide data, and the tools needed to reasonably estimate impacts. It is the system
operator (SO) alone that is able to determine the existence of system strength
shortfalls. This is a strong indicator that allocating system strength to a
connecting generator is problematic.
• Second, in seeking to mitigate the harm they are deemed to cause, new entrant
renewable generators are likely to select from a much smaller pool of competing
solutions, than a central procurer and so may be expected to develop less efficient
solutions than would be delivered through a co-ordinated response. For example,
in Queensland, Powerlink cheaply resolved system strength issues in Far North
Queensland by re-tuning the inverters on three solar farms to make them more
robust to lower fault currents. If these solar farms were competing with each
other they would have no incentive to offer cheap solutions that would have
aided their competitors’ access to the market.
• Third, there are economies of scale and lumpiness in commonly used devices to
provide strength, such as synchronous condensers. Making generators
responsible for mitigating their harm is likely to result in inefficient investment.
This is demonstrated in a case study in Queensland73 which suggests substantial
scale economies from the central provision of system strength rather than
allocating the responsibility to three individual new entrant renewable
generators.
73 Australian Renewable Energy Agency, (February 2021). Assessment of the Effectiveness of a
Centralised Synchronous Condenser Approach, at https://arena.gov.au/knowledge-
bank/assessment-of-the-effectiveness-of-a-centralised-synchronous-condenser-approach/

56
This does not mean that connecting generators should not be expected to reasonably
comply with technical standards (for example on fault ride-through) or have their
inverters "tuned" to respond appropriately to various grid events (as a condition of
connection to the power system).
4.3 Assessment of NSP provision of inertia and system strength
Co-ordination (inertia)
Individual NSPs do not have the information needed to determine the extent of any
possible inertia shortfalls, or the effectiveness of any inertia that they procure in
addressing existing or possible future shortfalls. Recognising this, the arrangements
require AEMO's active involvement in determining inertia requirements and then in
assessing the plausibility and effectiveness of NSP's proposed inertia supply. NSPs are
unable to procure inertia effectively without the SO's involvement in quantifying the
need and assessing the relative merit of competing options for provision. This co-
ordination problem is likely to become much worse as the market for competing sources
of inertia expands to grid-forming inverters (whether applied to batteries or renewable
generators).
Co-ordination (system strength)
System strength is locally/regionally defined and in this sense, multi-regional co-
ordination is less likely to be an issue in NSP provision of system strength (as it always
will be, for example, with inertia). However, NSPs do not have the information needed
to assess system strength shortfalls and neither are they able to assess the effectiveness
of competing sources of system strength (knowledge of the operation of the power
system is needed in such assessments of effectiveness). The SO's active involvement, as
for inertia, is required to assess the need for system strength and then to assess the merits
of competing system strength solutions.
57
Risk allocation (system strength and inertia)
The SO determines the strength/inertia requirement and evaluates the effectiveness of
competing sources of strength/inertia. Why then, is the NSPs allocated the task of
sourcing the supplies when they are neither able to determine the effectiveness of those
supplies nor expert, as discussed earlier, in most of the competing sources of inertia and
strength?
Innovation and learning (system strength and inertia)
NSPs have a pecuniary interest in the provision of strength and inertia (by being able to
capitalise the costs involved in providing the service). In some areas supplies they
procure will complement or substitute for regulated network services they provide.
These pecuniary and conflicting interests undermine market transparency by rendering
much of the relevant information "commercial in confidence." This restriction on market
information undermines competitive rivalry and thus of innovation and learning.
Incentives to efficiency (system strength and inertia)
With an NSP monopoly, the efficiency incentive relies on the economic regulator using
TNSPs' profit motive to seek out cheaper solutions and then setting regulations that
ensure a share of the cost reduction is passed to consumers in the form of lower prices.
But in a field as technically complex (and esoteric) as inertia and strength, it is
questionable whether an economic regulator would be able to establish incentives or
controls that could better the outcomes likely from monopsony, as discussed later.
Catering for jurisdictional differences (system strength and inertia)
TNSP responsibility for the provision of strength and inertia can cater for jurisdictional
differences in the sense that differing state policies (for example on the quantity of
renewable generation and storage) will affect the requirements for inertia and system
strength (which AEMO determines).

58
4.4 Assessment of SO responsibility for the provision of inertia
and strength
The obvious alternative to making the NSP responsible for the provision of inertia and
system strength, is to vest this responsibility in the SO. This is the approach adopted by
National Grid in Great Britain and by AEMO in Victoria (by virtue of the arrangement
that AEMO is the SO and also the NSP in Victoria).
The merits of SO responsibility for inertia and system strength is assessed below against
the four criteria, followed by other arguments and counter-arguments on this
arrangement.
• Co-ordination: the SO has the information needed to assess the quantity of
inertia/system strength that may be needed and also of the merits of competing
solutions. The SO also operates the chosen solutions. As an entity with NEM-
wide control, it can easily co-ordinate the analyses and actions of regional NSPs.
• Risk allocation: the SO is obviously the entity best able to manage inertia and
system strength, and by virtue of being able to pass the costs on, it is easily able
to bear the risk.
• Innovation and learning: as a not-for-profit entity, the SO is financially
disinterested in the procurement decisions it makes, and neither does it profit
from other factors that it controls that might substitute or compliment inertia or
strength it procures (such as procurement in FCAS markets for PFR obligations).
This pecuniary independence can help to encourage the development of
transparent markets with high levels of price discovery and non-discriminatory
market access. Such transparency aids innovation through the dissemination of
knowledge.
• Incentives to efficiency: the SO does not have a profit motive that regulators
could potentially leverage to incentivised cost reductions. However, as discussed,
it is unlikely that economic regulators would be able to establish regulations that
provide effective incentives to efficiency. As such, we do not think the absence of
a profit motive detracts from the argument for SO responsibility. To the contrary,
the absence of a profit motive removes the distortions that originate in rate of
59
return regulation that skew preferences towards capital intensive solutions that
can be added to regulatory asset bases. The SO's ability to operate contestable
markets for the supply of strength and inertia offers the potential for rivalry to
drive down the cost and drive up the quality of inertia and system strength
provision.
Other arguments and counter arguments
It might be suggested that NSPs have a particular advantage in some areas of the
provision of strength or inertia, for example through the development and operation of
their networks such as in respect of network relates, voltage control devices and network
operation and augmentation. It might be also that NSP they come to have expertise in
grid scale batteries such as Electranet and TransGrid are seeking to do with the
Dalrymple and Wallgrove Batteries. In this sense, NSP may come to have a expertise in
a wide range of methods of providing inertia and strength.
However SO responsibility for the procurement of system inertia does not preclude NSPs
from the supply of strength and inertia. If indeed they have attractive solutions they
would be free to enter these into tenders orchestrated by the SO. This would be an
excellent way to determine if the NSPs' solutions are indeed competitive, and would
allow for innovation in contracts of such services. NSPs that are confident about their
ability to compete in this market, might be expected to welcome competitive
arrangements for procurement particularly if this might help to eliminate the suspicion
that monopoly provision might lead to feather-bedding.
It might also be suggested that the arrangements for the recovery of AEMO's expenditure
(mostly from generators) distorts the choice of whether AEMO or NSPs (who recover
their expenditure mainly from charges to consumers) should be responsible for the
provision of inertia and system strength. If this is the case (and we think it is likely to the
case) arrangements should be changed so that the approach to cost recovery does not

60
distort the choice of the most advantageous arrangements for the provision of inertia and
strength.
If the arguments for SO responsibility are as persuasive as we suggest they are, why then
did the AEMC decide to make NSPs responsible for the provision of inertia and system
strength? This is even more perplexing since the rule change request (from the
Government of South Australia) proposed that AEMO, not NSPs, be made responsible
for the procurement of inertia and strength. The AEMC's reasoning rested on its belief
that a regulated monopoly would ensure efficient outcomes. Did other factors influence
the AEMC's decision?
One possibility is that since generators apply to NSPs to connect to the network, and in
the context of the AEMC's "do no harm" requirements, NSPs came to be involved in the
analysis of system strength and inertia. If so, it might have been considered a small step
in making NSPs responsible for system strength and inertia provision. To put it the other
way around, if the "do no harm" regulation did not exist it may have been less likely that
NSPs would have been made responsible for the provision of strength and inertia.
A second possibility is that AEMO is perceived to be excessively risk averse and if it is to
be tasked with procuring system strength and inertia it would therefore impose
unnecessary costs on producers in the first instance (since producers pay most of
AEMO's fee). Since AEMO is not regulated, perhaps the AEMC and some stakeholders
considered that giving the responsibility for inertia and strength provision to AEMO,
there would be a risk of unmitigated gold-plating. Perhaps this was part of the AEMC's
reasoning, but since AEMO still determines how much inertia and strength is needed, its
scope to "gold plate" is unaffected by whether (or not) it is responsible for delivering the
requirements it determines.
A third possibility may be opposition from some NSPs (other than in Victoria where
AEMO is the NSP) towards what would be perceived to be an extension of the model
adopted in Victoria, to their states.
61
4.5 Evidence
What can be learned from a comparison of SO responsibility for inertia and strength in
Great Britain, with NSP responsibility for the same in Australia? The table below
contrasts National Grid's first major inertia procurement in 2020 ("Pathfinder Phase 1")
with Electranet's procurement of synchronous condensers in South Australia.
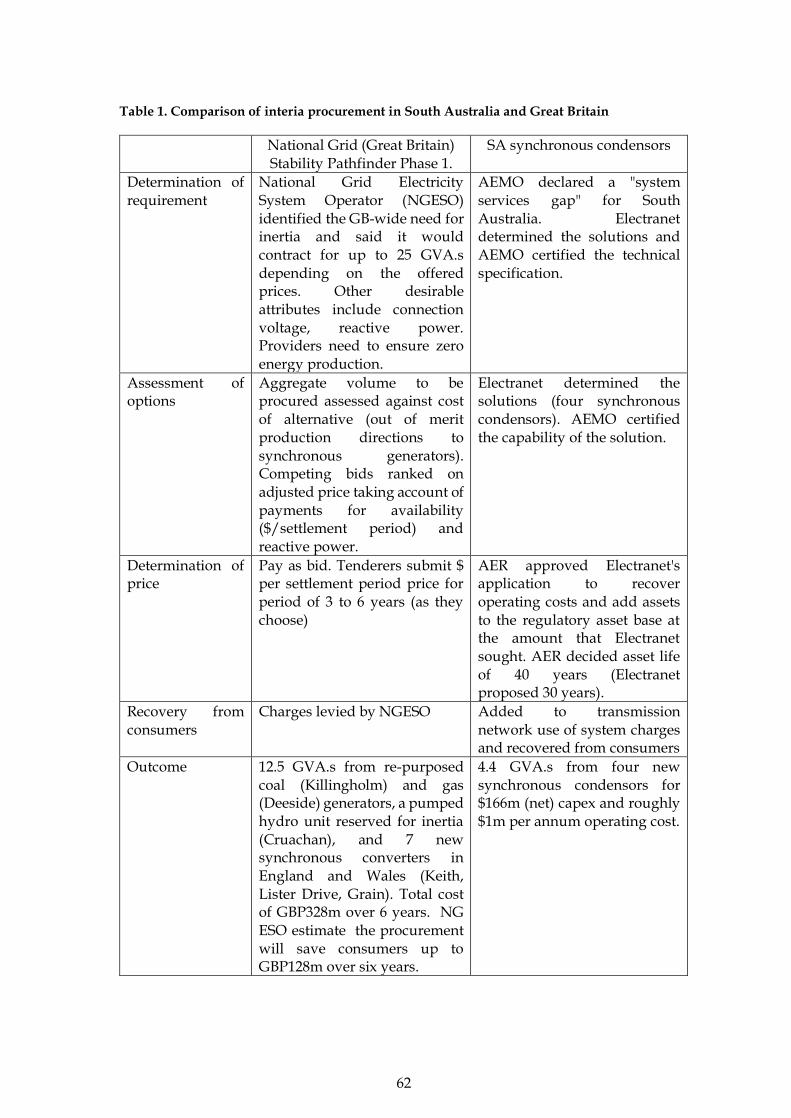
62
Table 1. Comparison of interia procurement in South Australia and Great Britain
National Grid (Great Britain) Stability Pathfinder Phase 1.
SA synchronous condensors
Determination of requirement
National Grid Electricity System Operator (NGESO) identified the GB-wide need for inertia and said it would contract for up to 25 GVA.s depending on the offered prices. Other desirable attributes include connection voltage, reactive power. Providers need to ensure zero energy production.
AEMO declared a "system services gap" for South Australia. Electranet determined the solutions and AEMO certified the technical specification.
Assessment of options
Aggregate volume to be procured assessed against cost of alternative (out of merit production directions to synchronous generators). Competing bids ranked on adjusted price taking account of payments for availability ($/settlement period) and reactive power.
Electranet determined the solutions (four synchronous condensors). AEMO certified the capability of the solution.
Determination of price
Pay as bid. Tenderers submit $ per settlement period price for period of 3 to 6 years (as they choose)
AER approved Electranet's application to recover operating costs and add assets to the regulatory asset base at the amount that Electranet sought. AER decided asset life of 40 years (Electranet proposed 30 years).
Recovery from consumers
Charges levied by NGESO Added to transmission network use of system charges and recovered from consumers
Outcome 12.5 GVA.s from re-purposed coal (Killingholm) and gas (Deeside) generators, a pumped hydro unit reserved for inertia (Cruachan), and 7 new synchronous converters in England and Wales (Keith, Lister Drive, Grain). Total cost of GBP328m over 6 years. NG ESO estimate the procurement will save consumers up to GBP128m over six years.
4.4 GVA.s from four new synchronous condensors for $166m (net) capex and roughly $1m per annum operating cost.

63
The information in Table 1 suggests that in round numbers NG ESO will pay $600m for
12.5 GVA.s for 6 years or $8m per GVA.s per year for six years. Electranet on the other
hand will charge around $14.5m for 4.4 GVA.s per year for 40 years, or $3.3m per GVA.s
per year for 40 years. Prima facie, Electranet has provided inertia for around half the cost
of NG ESO. However, Electranet has tied consumers up for the next 40 years.74 TransGrid
suggest that grid-forming batteries (such as the one it is developing at Wallgrove)
provide inertia for "a small fraction of the cost"75 of synchronous condensers. If indeed
this is the case then NG ESO's approach is likely to prove cheaper in time.
NG ESO's approach elicited offers from repurposed coal and gas generators and a
pumped hydro unit that has been set aside for the purpose of inertia provision only.
Electranet's approach has been to construct new synchronous units. NG ESO evaluated
the quantity of their inertia procurement with reference to the alternative cost of grid re-
dispatch. Electranet performed no such calculation. Might alternatives have been
available in SA, that would not have tied consumers up for 40 years, including by
repurposing synchronous generators in SA? Electranet's approach requires us to rely on
their own assessment that such opportunities do not exist. NG ESO's approach however
provides information from competing suppliers themselves as to the duration of contract
they prefer and payment they require.
As discussed earlier, in the context of very rapid technology development particularly in
respect of batteries and the design of inverters used by batteries and non-synchronous
generators, markets would seem to be particularly valuable for their ability to stimulate
innovation and risk-taking.
74 In its regulation of Electranet, the AER accepted Electranet’s proposal on the basis that
Electranet had run a tender for the purchase of the condensers and therefore it was satisfied that
expenditure was efficient. This is no more than conventional “cost plus” regulation.
75 Parkinson, G., (October 2020). Transgrid to build Australia’s first Tesla Megapack big battery in western Sydney, https://reneweconomy.com.au/transgrid-to-build-australias-first-tesla-megapack-big-battery-in-western-sydney-55391/

64
5 Conclusions
This report has examined the supply and demand for inertia and system strength and
then the institutional arrangements for their provision. Since explicit provision of these
is a recent phenomenon, the institutional arrangements themselves are recent. The
essential design of these arrangements is Network Service Provider (NSP) monopoly
albeit with the quantity of supply influenced by the System Operator (SO). In addition,
the arrangements identify newly connecting (renewable) generators as responsible for
the rectification of system strength shortfalls that their connection is deemed to cause.
Inertia and system strength are public goods: they are almost always non-excludable
(users can not be barred from the benefits of system strength or inertia if they refuse to
pay for them) and often76 non-rivalrous (the cost of providing them to a marginal user is
typically zero). As such, both inertia and system strength are most efficiently procured
by a single buyer.
76 Billimoria, F. , P. Mancarella , R. Poudineh, (June 2020). Market design for system security in low-carbon electricity grids: from the physics to the economics, at https://doi.org/10.26889/9781784671600 define system strength as a “congestible common pool resource”, by which they mean that it is like a public good when supply is not constrained, but when supply falls short of demand it becomes increasingly rivalrous and thus while always excludable, it no longer also meets the non-rivalrous condition needed to satisfy definition as a public good. The AEMC has adopted this conception as the justification of their “do no harm” provision. This is not an economically sound conclusion to draw on the appropriate arrangements for the provision of system strength. But the typical source of system strength exhibits economies of scale, and comes in lumpy increments. This cost structure and technology characteristic, just like that of transmission lines or transformers, defines a natural monopoly and hence provides the rationale for co-ordinated provision to avoid the prospect of investment hold-up or inefficient under-investment in order to reduce the prospect of free-riding if provision is decentralised. In addition, it is arbitrary to charge the last generator whose entry is associated with a system strength deficit, to make good on that deficit, just as it would be arbitrary to charge the last consumer whose demand (added to that of the existing consumers) exceeds the capacity of a transmission line, to pay for all of the cost of augmentation of the line. Colloquially, “first in, best dressed” might be an accepted social norm for the allocation of scarce resources but blaming the last straw for breaking the donkey’s back is not well-founded in the economics of natural monopolies.

65
We question the merits of NSP monopoly for the provision of inertia or system strength.
The current arrangements (and the AEMC’s recent recommendations of their future
variation) allocates risks to parties who are not best placed to manage them, and will give
rise to co-ordination failures and inefficiency. We argue this for several reasons:
• Many of the sources of system strength and inertia (particularly of the prospective
inverter-based technologies) are not core to the NSPs’ business of transporting
electricity.
• Efficient procurement of inertia and often also system-strength requires market-
wide co-ordination which regional NSPs are not able to achieve.
• NSPs' profit motive and incentive to capitalise expenditure - arising from their
rate of return regulation - will distort their expenditure decisions.
Furthermore many of the prospective technologies to supply inertia and strength are
from technologies, such as batteries, whose main markets (such as the main electricity
spot market or the ancillary services markets) are contestable. NSPs are prohibited from
participating in such markets since they have a conflict of interest and will undermine
competition in those markets if they had access to them. NSP responsibility for the
provision of inertia and strength offends this principle for the same reason.
In summary, for these reasons we suggest that NSP monopoly will tend to result in
unnecessarily expensive solutions and that will impede innovation and learning in an
area of activity in which there is rapid technology change. The AEMC has suggested that
NSP regulation will provide protection from monopoly exploitation and incentives to
efficiency. It is not clear why it has suggested this.

66
6 Recommendations
The "do no harm" regulations are inefficient and unfair and they should be abandoned.
In place of decentralised obligations on renewable generation, the provision of system
strength should be co-ordinated and its cost spread amongst all consumers who benefit
from its supply. This is not to suggest that connecting generators (of whatever type)
should be exempt from reasonable operating standards – such as the ability to ride
through faults or to “tune” their inverters to make them more robust to low system
strength.
We suggest that the improvements in the co-ordinated provision of inertia and system
strength are possible by making the SO responsible for their provision. This will
nonetheless require very close consultation with network service providers, particularly
with respect to the procurement of system strength. Some form of joint NSP-AEMO
decision-making arrangements merits further consideration, although it is imperative
that with such arrangement it is the SO, not NSPs, that is ultimately the entity responsible
for contracting the supply of strength and inertia.
This recommended arrangement does not preclude NSP involvement in the provision of
system strength or inertia either through the supply of conventional grid solutions or
through involvement in grid-forming batteries. Electranet in South Australia and
TransGrid in New South Wales are developing expertise in the development and
operation of such batteries. If this provides competitive advantages in their supply of
inertia and strength, this could become evident in their success in tenders or similar
market-based competitions that the SO administrates.
Finally, we suggest that the SO should also be encouraged to seek to maximise the public
availability of information on the outcomes of the markets and tenders it operates, to
procure strength and inertia. This will stimulate rivalry and innovation amongst service
providers and is also an important part of public accountability for the procurement of
these essential services.

67
7 Appendix A: Heat maps of number of synchronous
units online
Figure 16. 99th percentile of the number of coal units online during each week of the year
(Victoria does not show the closure of Hazelwood).
Since 2017 the prices in the NEM have been very high leading to huge profit from coal
generators. This is shown in Figure 17 which shows the volume weighted average price
from different fuel types in the NEM77. In 2020, there has been a reduction in volume
77 The values in this chart were determined by calculating a NEM wide demand weighted
average price. This price was used to calculate the volume weighted average price for each total
NEM fuel type production.

68
weighted average price for all generators. Coal are now receiving prices down to
$50/MWh, compared to
Figure 17. Volume weighted average price in the NEM