exercise #5: supervised classification. step 1. delineating training sites and generating signatures...
TRANSCRIPT
Exercise #5:Supervised Classification

Step 1. Delineating Training Sites and Generating Signatures
• An individual training site is delineated as an “area of interest” and given a class name.
• The pixels within the training site are used to generate a “signature.” This process is repeated to gather several training sites for each class.

Step 1. Delineating Training Sites and Generating Signatures
• Open yoursubset.img in a Viewer (choose a 4, 3, 2 combination).
• Then click on the Raster tab, then click on the Supervised tool and select Signature Editor.

Step 1. Delineating Training Sites and Generating Signatures
• Open a new AOI (Area of Interest) layer (right click in the View Window on your image and choose New AOI Layer).
• Notice that the Drawing tab becomes available when a new AOI layer is created.

Step 1. Delineating Training Sites and Generating Signatures• AOI tools let you interactively select a specific area from the
image. • The pixel values of all image bands within an AOI, not just those
bands displayed in the Viewer, are used to generate a signature.
• Zoom into an area of the image and select the polygon tool from the Insert Geometry tab group.
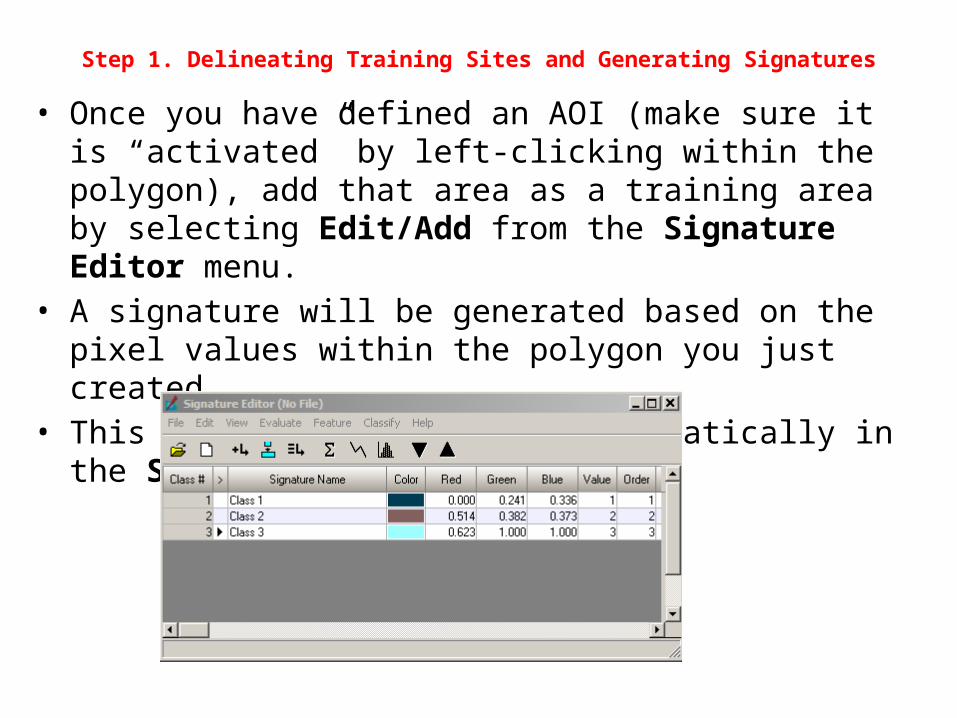
Step 1. Delineating Training Sites and Generating Signatures• Once you have defined an AOI (make sure it is “activated” by
left-clicking within the polygon), add that area as a training area by selecting Edit/Add from the Signature Editor menu.
• A signature will be generated based on the pixel values within the polygon you just created.
• This signature will appear automatically in the Signature Editor Cell Array.

Step 1. Delineating Training Sites and Generating Signatures• Give the signature a new name – choose a corresponding color
by left clicking on the Color column.• Highlight the signatures to be merged in the Signatures Editor’s
Cell Array and click the Merge Selected Signatures button• Repeat this process until you have several training sites for each
of your classes: Water, Types of Vegetation, Urban, Agriculture, etc.

Step 1. Delineating Training Sites and Generating Signatures• In creating signatures you are “telling” the computer how a
particular class “looks”. • The algorithm used for supervised classification will use the
summary statistics from the signature areas and match every pixel in the image to one (and only one) of the signatures.
• Your training sites should be:• Representative of all classes present in the image• Representative of different conditions of individual classes• Numerous• Relatively homogeneous• As large as possible while maintaining homogeneity and avoiding
mixed pixels at the edges of objects
Step 2. Signature Evaluation
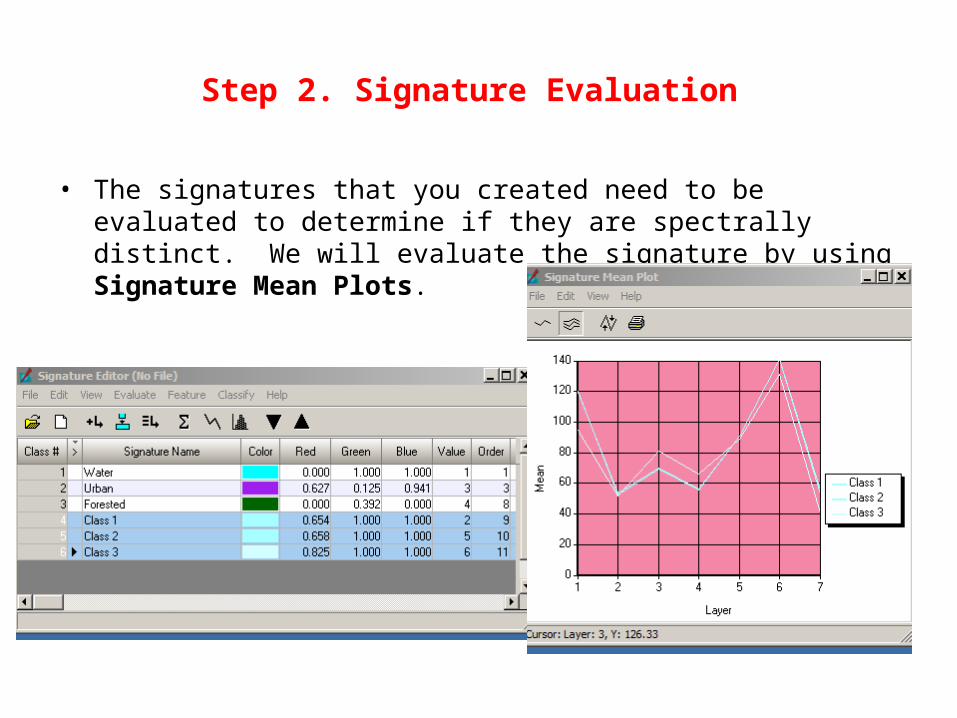
• The signatures that you created need to be evaluated to determine if they are spectrally distinct. We will evaluate the signature by using Signature Mean Plots.

Step 2. Signature Evaluation
• In Signature Editor select multiple signatures that have some spectral similarities with one another.
• Click the Display Mean Plot button in the Signature Editor. • In the Mean Plot Window, click the Multiple Signature Mode button.• Inspect a variety of signature set combinations and assess each signature’s
data distribution and uniqueness. If necessary, merge, delete, or re-collect any signatures (go back to Step 1).
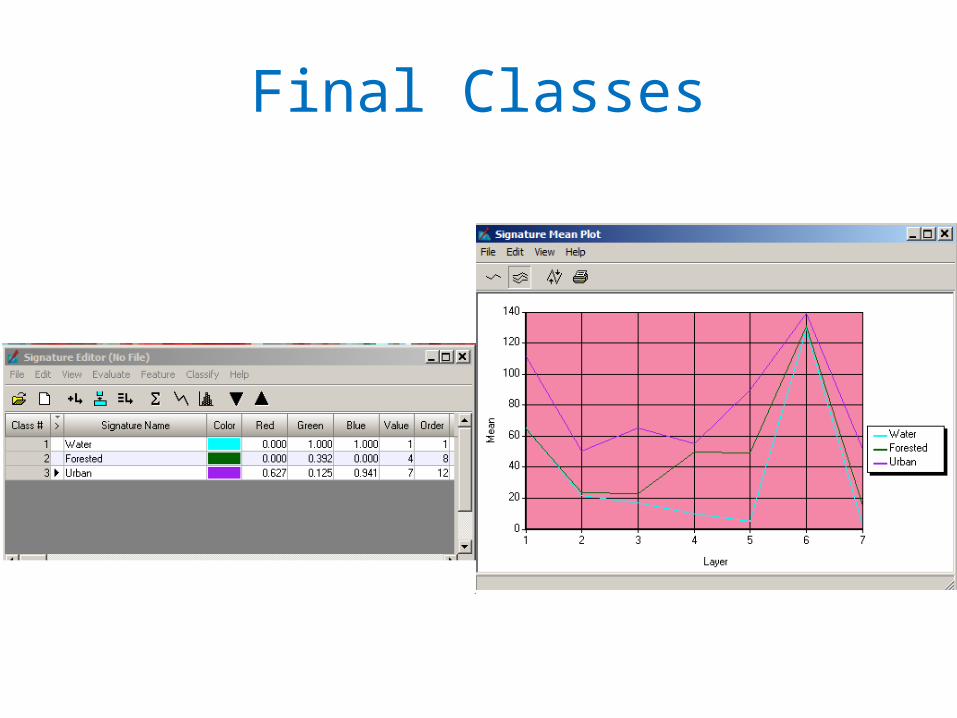
Final Classes
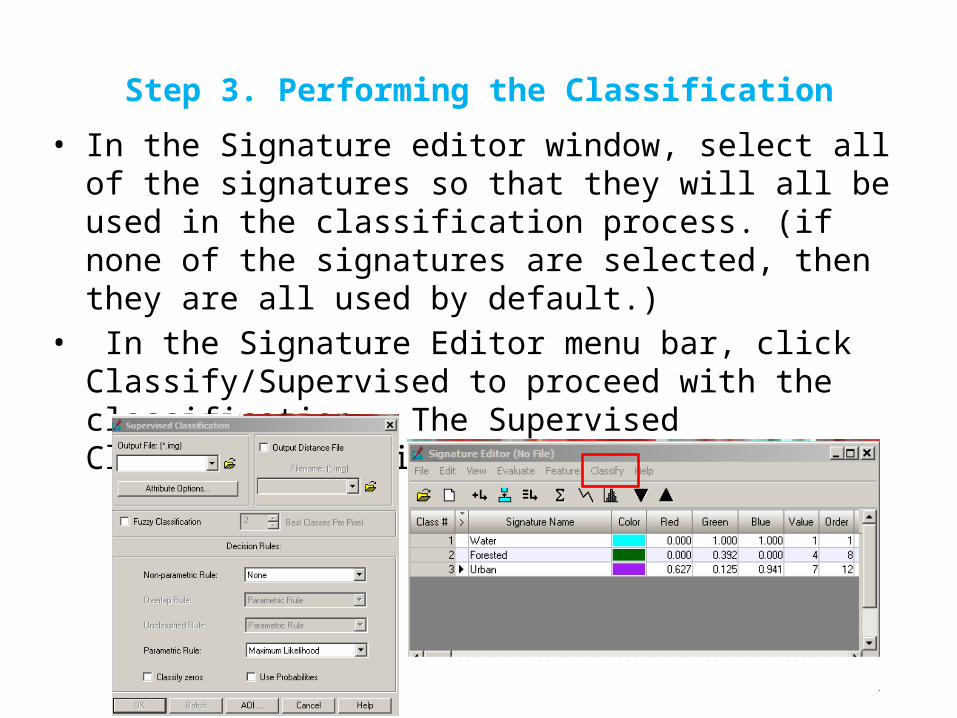
Step 3. Performing the Classification
• In the Signature editor window, select all of the signatures so that they will all be used in the classification process. (if none of the signatures are selected, then they are all used by default.)
• In the Signature Editor menu bar, click Classify/Supervised to proceed with the classification. The Supervised Classification dialog box appears.
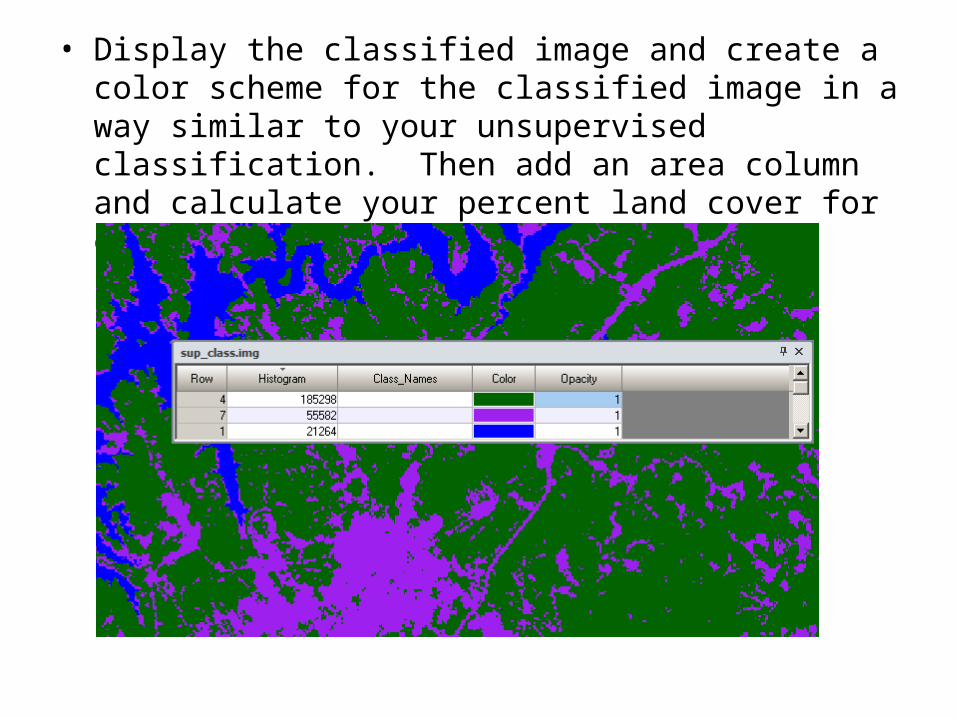
• Display the classified image and create a color scheme for the classified image in a way similar to your unsupervised classification. Then add an area column and calculate your percent land cover for each class.
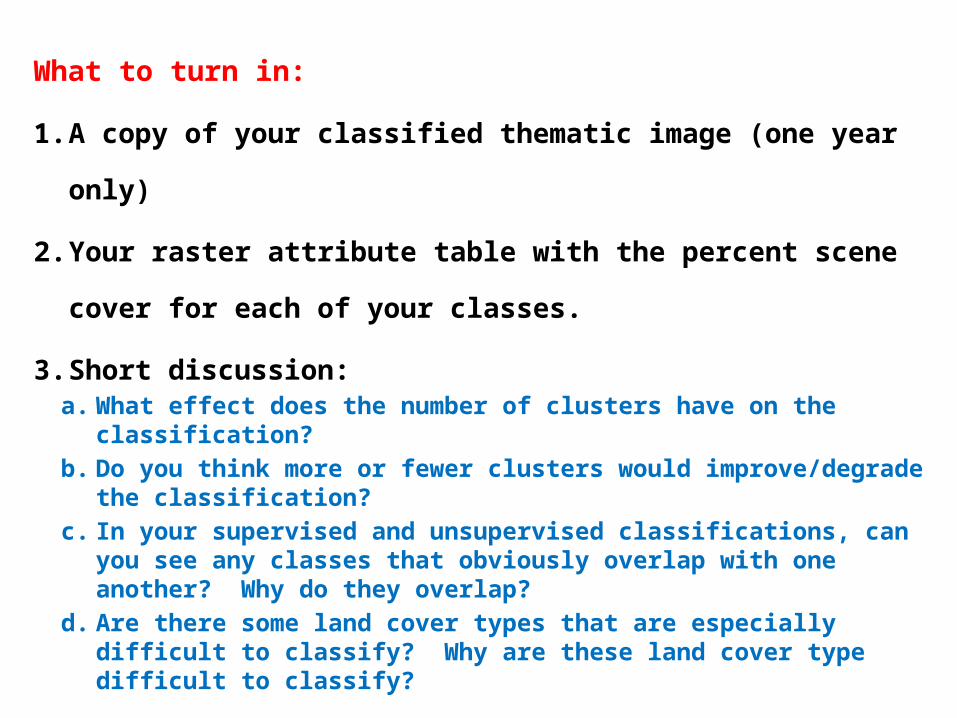
What to turn in:
1. A copy of your classified thematic image (one year only)
2. Your raster attribute table with the percent scene cover for
each of your classes.
3. Short discussion:a. What effect does the number of clusters have on the classification?b. Do you think more or fewer clusters would improve/degrade the
classification?c. In your supervised and unsupervised classifications, can you see
any classes that obviously overlap with one another? Why do they overlap?
d. Are there some land cover types that are especially difficult to classify? Why are these land cover type difficult to classify?