exercise alters gut microbiota composition and … · medicine & science in sports &...
TRANSCRIPT
. . . Published ahead of Print
Medicine & Science in Sports & Exercise® Published ahead of Print contains articles in unedited manuscript form that have been peer reviewed and accepted for publication. This manuscript will undergo copyediting, page composition, and review of the resulting proof before it is published in its final form. Please note that during the production process errors may be discovered that could affect the content.
Copyright © 2017 American College of Sports Medicine
Exercise Alters Gut Microbiota Composition and Function
in Lean and Obese Humans
Jacob M. Allen
1, Lucy J. Mailing
2, Grace M. Niemiro
1, Rachel Moore
1, Mark D. Cook
4,
Bryan A. White3, Hannah D. Holscher
1,2,5, and Jeffrey A. Woods
1,2
1Department of Kinesiology and Community Health, University of Illinois at Urbana-
Champaign, Urbana, IL; 2Division of Nutritional Sciences, University of Illinois at Urbana-
Champaign, Urbana, IL; 3Department of Animal Sciences, University of Illinois at Urbana-
Champaign, Urbana, IL; 4Department of Human Performance and Leisure Studies, North
Carolina A&T State University, Greensboro, NC; 5Department of Food Science and Human
Nutrition, University of Illinois at Urbana-Champaign, Urbana, IL
Accepted for Publication: 6 November 2017
ACCEPTED
Exercise Alters Gut Microbiota Composition and Function in Lean and Obese
Humans
Jacob M. Allen1, Lucy J. Mailing
2, Grace M. Niemiro
1, Rachel Moore
1, Mark D. Cook
4,
Bryan A. White3, Hannah D. Holscher
1,2,5, and Jeffrey A. Woods
1,2
1Department of Kinesiology and Community Health, University of Illinois at Urbana-
Champaign, Urbana, IL; 2Division of Nutritional Sciences, University of Illinois at Urbana-
Champaign, Urbana, IL; 3Department of Animal Sciences, University of Illinois at Urbana-
Champaign, Urbana, IL; 4Department of Human Performance and Leisure Studies, North
Carolina A&T State University, Greensboro, NC; 5Department of Food Science and Human
Nutrition, University of Illinois at Urbana-Champaign, Urbana, IL
Corresponding Author:
Jeffrey A. Woods, PhD
906 S. Goodwin Ave.
348 Louise Freer Hall
University of Illinois at Urbana-Champaign
Urbana IL 61801
217-244-8815
Medicine & Science in Sports & Exercise, Publish Ahead of Print DOI: 10.1249/MSS.0000000000001495
Copyright © 2017 by the American College of Sports Medicine. Unauthorized reproduction of this article is prohibited.
ACCEPTED

This work was partially funded by a doctoral student research grant from the American College
of Sports Medicine (ACSM). Authors have no professional relationships with companies or
manufacturers who will benefit from the results of the present study. Results of the present study
do not constitute endorsement by ACSM. Results of the study are presented clearly, honestly and
without fabrication, falsification, or inappropriate data manipulation.
Copyright © 2017 by the American College of Sports Medicine. Unauthorized reproduction of this article is prohibited.
ACCEPTED

Abstract
PURPOSE: Exercise is associated with altered gut microbial composition, but studies have not
investigated whether the gut microbiota and associated metabolites are modulated by exercise
training in humans. We explored the impact of six weeks of endurance exercise on the
composition, functional capacity, and metabolic output of the gut microbiota in lean and obese
adults with multiple-day dietary controls prior to outcome variable collection. METHODS:
Thirty-two lean (n=18 [9 female]) and obese (n=14 [11 female]), previously sedentary subjects
participated in six weeks of supervised, endurance-based exercise training (3 days/wk) that
progressed from 30 to 60 minutes/day and from moderate (60% of heart rate reserve [HRR]) to
vigorous intensity (75% HRR). Subsequently, participants subsequently returned to a sedentary
lifestyle activity for a six week washout period. Fecal samples were collected before and after six
weeks of exercise, as well as after the sedentary washout period, with 3-day dietary controls in
place prior to each collection. RESULTS: -diversity analysis revealed that exercise-induced
alterations of the gut microbiota were dependent on obesity status. Exercise increased fecal
concentrations of short chain fatty acids (SCFAs) in lean, but not obese, participants. Exercise-
induced shifts in metabolic output of the microbiota paralleled changes in bacterial genes and
taxa capable of SCFA production. Lastly, exercise-induced changes in the microbiota were
largely reversed once exercise training ceased. CONCLUSION: These findings suggest that
exercise training induces compositional and functional changes in the human gut microbiota that
are dependent on obesity status, independent of diet and contingent on the sustainment of
exercise. Keywords: exercise, gut, microbiota, microbiome, obesity, butyrate, human
Copyright © 2017 by the American College of Sports Medicine. Unauthorized reproduction of this article is prohibited.
ACCEPTED

INTRODUCTION
Environmental stimuli and behavioral practices can modulate the composition and
functionality of the gut microbiota. For instance, diet (1), obesity status (2), and mode of birth
delivery (3) have been shown to significantly contribute to the metabolic and immune-regulating
capacity of the gut microbiome throughout the lifespan. Physical activity status in humans
correlates with microbiota composition; however, the effects of endurance-based exercise
training on the human gut microbiota have not been explored.
Despite the lack of research in humans, data from our laboratory and others indicate that
exercise training can significantly modulate the gut microbiota in animal models (4-6).
Moreover, exercise-induced changes in the gut microbiota have been correlated with changes in
host physiology, including alterations in metabolism (7), immunity (5), and behavior (6).
Exercise training also increases microbiota-derived short chain fatty acids (SCFAs) within the
mouse gut (8). SCFAs are two to six carbon long fatty acids which serve as an energy source for
a variety of tissues and have been shown to reduce inflammation (9), improve insulin sensitivity
(10), and alter central nervous system morphology (11)
Among humans, Estaki et al. showed that cardiorespiratory fitness (VO2max) was
positively correlated with increased bacterial diversity and butyrate-producing bacteria (12),
while Barton et al. described that the gut microbiome in athletes support higher turnover of
macromolecules (carbohydrates and protein) and higher gut SCFA concentrations compared to
sedentary controls (13). Despite offering intriguing associations between exercise and the gut
microbiota, these studies are limited by their cross-sectional design because other factors that
transiently alter the gut microbiota are not controlled. Thus, the present study was designed to
assess gut microbial changes in a longitudinal design that controls for diet and antibiotic use.
Copyright © 2017 by the American College of Sports Medicine. Unauthorized reproduction of this article is prohibited.
ACCEPTED

The effects of exercise on the human gut microbiota have also not been investigated in
the context of obesity. An obesity-associated gut microbiota can significantly contribute to host
weight gain through enhanced energy harvest (14) and drive inflammation through reduced gut
barrier integrity (15). Exercise training can contribute to improvements in obesity status and
associated co-morbidities by increasing insulin sensitivity, reducing systemic inflammation (16),
and improving VO2max (17). Exercise training in mice has also been shown to limit gut barrier
integrity disruptions and tissue inflammatory responses induced by obesity, offering evidence of
a possible gut microbiota-mediated mechanism by which exercise improves outcomes associated
with obesity (18). However, considering the wide-ranging effectiveness of exercise interventions
in combating weight gain and obesity-associated co-morbidities in humans (19), a more
comprehensive investigation into the biological systems that are responsive to both obesity and
exercise training, including the gut microbiota, is needed.
In this study, we investigated whether six weeks of aerobic exercise training alters gut
microbial communities and fecal SCFAs in previously sedentary lean and obese adults with
controls in place to ensure consistent dietary patterns. We hypothesized that exercise training
would stimulate orthogonal shifts in gut microbial communities dependent on BMI status and,
lead to increased fecal SCFA levels as well as functional metabolic capacity for the gut
microbiota to produce SCFA. Lastly, we also predicted that composition, functional capacity and
metabolic output of the gut microbiota would return to baseline levels after an extended (6 week)
reversion to sedentary activity.
Copyright © 2017 by the American College of Sports Medicine. Unauthorized reproduction of this article is prohibited.
ACCEPTED

METHODS
Participants and ethical approval
Thirty-two adult, previously sedentary females (n=20) and males (n=12) were recruited
based on a lean or obese body mass index (BMI); lean (BMI < 25 kg/m2; n=18; 9 female, 9
male) and obese (BMI > 30 kg/m2; n=14; 11 female, 3 male). Baseline participant characteristics
are shown in Table 1. This study was approved by the University of Illinois Institution Review
Board, written informed consent was obtain for all participants and all procedures and protocols
conformed to the standards of use of human participants in research as outlined in the Sixth
Declaration of Helsinki..
Inclusion and Exclusion Criteria
Participants were 20-45 years of age, had a BMI < 25 kg/m2 (lean) or a BMI > 30 kg/m
2
(obese) and were sedentary (< 30 minutes of moderate or high intensity exercise per week and <
10 aggregate Godin-Shepard Leisure Time Physical Activity Questionnaire (GSLTQ; Godin-
Leisure) score. Subject medical history and medication use was assessed through questionnaire.
Subjects that qualified for the study were free of metabolic and gastrointestinal disease, not
pregnant or lactating, not taking medications that would impact bowel function, and not taking
antibiotics for at least three months prior to or during the study.
Study Design
The study was conducted as a longitudinal design lasting 14 weeks. After two weeks of
baseline testing, all subjects completed a six-week endurance-based exercise intervention. The
exercise training period was followed by a six-week ‘washout’ period, during which participants
were instructed to refrain from exercising. Fecal and blood samples were collected throughout
the study, with 3-day dietary controls in place prior to each collection (see Figure, Supplemental
Digital Content 1, Experimental Design, http://links.lww.com/MSS/B104).
Copyright © 2017 by the American College of Sports Medicine. Unauthorized reproduction of this article is prohibited.
ACCEPTED

Screening and Diet Control
At baseline, subjects came to the laboratory for four visits. During these visits, GSTLQs
were administered to ensure participants were sedentary over a period of at least three months.
Participants were asked to complete a 7-day dietary record, which included detailed descriptions
of the types and amounts of foods and beverages consumed. Then, in consultation with a
registered dietitian (RD), participants designed a 3-day food menu that consisted entirely of
foods and drinks from the 7-day dietary recall. Participants were asked to follow this 3-day food
menu prior to each fecal collection. Beyond the acute dietary control, subjects were also
instructed to maintain overall dietary patterns, which included maintenance of
alcoholic/caffeinated beverage consumption and continuation of any dietary supplement usage
that occurred prior to the beginning of the study. Three-day menus were analyzed for macro- and
micro-nutrient composition, food groups, and individual food item consumption (see Table,
Supplemental Digital Content 2, Baseline dietary consumption, http://links.lww.com/MSS/B105)
using Nutrition Data System for Research (NDSR 2014 version, University of Minnesota,
Minneapolis, MN).
Exercise training protocol
The exercise intervention consisted of three supervised 30 to 60 minute, moderate-to-
vigorous intensity (60-75% of heart rate reserve [HRR]) aerobic exercise sessions per week.
Subjects chose from a cycle ergometer or treadmill during each exercise session. Percent of HRR
was calculated as:
percent (%) of target intensity×(HRmax−HRrest) + HRrest
HRmax was determined during the baseline VO2max test. During Week 1 of training, sessions were
30 minutes at 60% HRR. Training sessions for Week 2 lasted 45 minutes at a similar intensity.
Copyright © 2017 by the American College of Sports Medicine. Unauthorized reproduction of this article is prohibited.
ACCEPTED

Training sessions at Week 3 were increased to 60 minutes at 60% HRR. During Weeks 4-6 of
training, there was an increase in intensity of 5% HRR per week, progressing up to 75% HRR for
60 minutes during Week 6. All participants were 100% compliant in completing necessary
requirements for the exercise portion of the study.
Washout Period
Following post-training assessments, all participants were instructed to refrain from
exercise for the next six weeks. To assess washout compliance, GSLTQs were again
administered. Participants that scored below 10 were deemed to have returned to sedentary
activity and were included in the washout analysis. A total of seven subjects (n=4 lean and n=3
obese) remained physically active during the washout (GSLTQ >10) and were not included in
the washout analysis.
Fecal Collections
Fecal samples were collected at baseline (E0), following six weeks of exercise (E6), and
following six weeks of return to sedentary activity (W6). All collections were preceded by the 3-
day food menu. Subjects were instructed to bring samples into the laboratory within 30 minutes
of defecation to ensure minimal degradation of volatile SCFAs. Researchers asked participants
the time defecation to ensure sample was received within 30 minutes. Once received, a small
portion of the sample (~0.5 grams) was aliquoted for SCFA analysis and the rest was stored at -
80C until future analysis.
Body Composition Assessments
Body composition was assessed using Dual Energy X-ray Absorptiometry (Hologic QDR
4500A, Bedford, Massachusetts) at E0, E6, and W6.
Copyright © 2017 by the American College of Sports Medicine. Unauthorized reproduction of this article is prohibited.
ACCEPTED
Maximal Oxygen Consumption (VO2max)
At baseline (E0) and after the exercise intervention (E6), participants completed a
maximal oxygen uptake test to assess cardiorespiratory fitness (VO2max) (Parvo Medics True
Max 2400, Sandy, UT). This test involved walking or running to maximal exertion on a treadmill
using the Bruce testing protocol as described previously (20). Heart rate (HR) was continuously
recorded via wireless Polar Monitor (Polar Electro, Lake Success, NY) and the test ended upon
volitional fatigue. VO2max was verified if two or more of the following criteria were met: (1) Rate
of Perceived Exertion > 18, (2) HR within 10 beats per minute (bpm) of age-predicted max HR,
(3) a plateau in HR (< 3 bpm change) over the last two intensity stages, and/or (4) Respiratory
Exchange Ratio (RER) of > 1.10.
Bacterial DNA isolation and 16S rRNA sequencing
Fecal bacterial DNA was extracted using the PowerLyzer PowerSoil DNA Isolation Kit
(MOBIO Laboratories, Inc.) and quality was assessed via gel electrophoresis. The DNA library
was constructed using a Fluidigm Access Array system in the Functional Genomics Unit of the
Roy J. Carver Biotechnology Center at the University of Illinois at Urbana (UIUC). After library
construction, a 300 bp region of the 16S rRNA gene (V4) were amplified using a two-step PCR
amplification method modified from Muturi et al. (21). Briefly, DNA samples were diluted to 2
ng/μl and amplified with Roche High Fidelity Fast Start Kit and 20x Access Array loading
reagent prior to PCR. Samples were amplified using the following Access Array cycling program
50 °C for 2 minutes (1 cycle), 70 °C for 20 minutes (1 cycle), 95 °C for 10 minutes (1 cycle),
followed by 10 cycles at 95 °C for 15 seconds, 60 °C for 30 seconds, and 72 °C for 1minute, 2
cycles at 95 °C for 15 seconds, 80 °C for 30 seconds, 60 °C for 30 seconds, and 72 °C for 1
minute, 8 cycles at 95 °C for 15 seconds, 60 °C for 30 seconds, and 72° for 1minute, 2 cycles at
95 °C for 15 seconds, 80 °C for 30 seconds, 60 °C for 30 seconds, and 72 °C for 1minute, 8
Copyright © 2017 by the American College of Sports Medicine. Unauthorized reproduction of this article is prohibited.
ACCEPTED
cycles at 95 °C for 15 seconds, 60 °C for 30 seconds, and 72 °C for 1minute, and 5 cycles at 95
°C for 15 seconds, 80 °C for 30 seconds, 60 °C for 30 seconds, and The PCR was quantified on
a Qubit fluorimeter (Thermo-Fisher). Evenly diluted product was used for a second round of
amplification with Illumina linkers and barcodes with the following PCR conditions: 1 cycle
95°C for 10 min. 1 cycle 95°C for 15sec, 1 cycle of 60°C for 30 sec, 14 cycles of 72 °C for 1
minute followed by a 72 °C extension for 3 minutes. Products were quantified on a Qubit
fluorimeter and stored at -20 C. All samples were run on a Fragment Analyzer (Advanced
Analytics, Ames, IA) and amplicon regions and expected sizes confirmed. Samples were then
pooled in equal amounts according to product concentration. The pooled products were then size
selected on a 2% agarose E-gel (Life Technologies) and extracted from the isolated gel slice with
Qiagen gel extraction kit (Qiagen). Cleaned size selected products were run on an Agilent
Bioanalyzer to confirm appropriate profile and determination of average size. The final library
pool was spiked with 10% non-indexed PhiX control library (Illumina®) and sequenced using
Illumina® MiSeq® V3 Bulk system. The libraries were sequenced from both ends of the
molecules to a total read length of 300 nt from each end. High-quality (> 25) sequence data
(FASTQ) were analyzed with QIIME 1.9.054
. Quality control consisted of depleting or removing
barcodes, primers, and short sequences (< 237 bp), sequences with ambiguous base calls, and
sequences with homopolymer runs exceeding 6 bp. After removal of singletons, OTUs were
classified using closed reference picking with the Ribosomal Database Project (RDP) at 97%
similarity. -diversity (weighted and unweighted UniFrac distances) were computed at an even
sampling depth of 14,201 sequences per sample based on α-diversity (Chao1) rarefaction plots
(see Figure, Supplemental Digital Content 3, Rarefaction α- diversity plot,
http://links.lww.com/MSS/B106).
Copyright © 2017 by the American College of Sports Medicine. Unauthorized reproduction of this article is prohibited.
ACCEPTED

SCFA analysis
SCFAs were analyzed as described previously by Panasevich et al.(22). Briefly, fresh
fecal samples were acidified in 6.25% meta-phosphoric acid solution and stored at −20°C. SCFA
concentrations were determined by gas chromatography (Hewlett-Packard 5890A Series II) and
a glass column (180 cm × 4 mm i.d.), packed with 10% SP-1200/1% H3PO4 on 80/100 + mesh
Chromosorb WAW (Supelco, Inc.). Nitrogen was the carrier gas with a flow rate of 75 mL/min.
Oven, detector, and injector temperatures were 125°C, 175°C, and 180°C, respectively. Acetic,
n-butyric, and propionic acid solutions (Sigma-Aldrich) were used as standards.
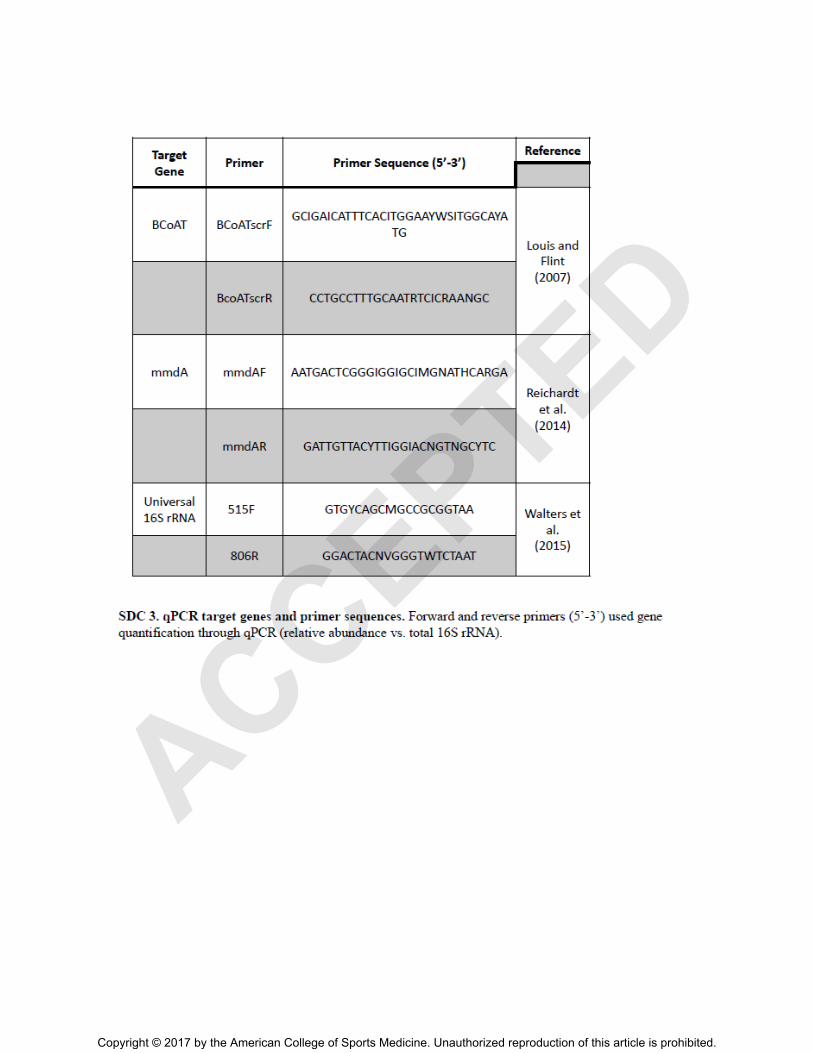
Functional gene quantification
Isolated bacterial DNA was assessed for the relative abundance of butyryl CoA: acetate
CoA transferase gene (BCoAT) and methylmalonyl CoA (mmDA) content by qPCR as described
by Louis and Flint (2007) and Reichardt (2014), repectively (23, 24). Briefly, real-time PCR
experiments were performed with SYBR Green Master Mix (Applied Biosystems) in a total
volume of 20 L. BCoAT and mmDA genes were quantified in parallel with a universal 16S
rRNA gene probe (see Table, Supplemental Digital Content 4, qPCR target genes and primer
sequences, http://links.lww.com/MSS/B107).
Statistical Analysis
Gut Microbiota Diversity and Taxonomy Evaluation
-diversity was calculated using QIIME version 1.9.0 (25) at an even sample depth of
14,038 sequences per sample, visualized using EMPeror (26), and analyzed by permutational
multivariate analysis of variance (PERMANOVA). Genera level taxonomy assignment was
generated using RDP database through QIIME and was used as the primary outcome variable in
subsequent factor analysis analyzing changes in gut microbiome. Pre-exercise (E0) to post-
Copyright © 2017 by the American College of Sports Medicine. Unauthorized reproduction of this article is prohibited.
ACCEPTED

exercise (E6) changes in SCFA concentrations, SCFA producing genes, body composition, and
VO2max were analyzed using a 2 x 2 repeated measures analysis of variance (ANOVA) with BMI
(Lean, Obese) and Exercise [Time] (E0 - E6) as independent factors. Due to non-universal
adherence to washout period guidelines, Post exercise (E6) to Washout (W6) changes in SCFA
concentrations, relative SCFA producing genes, body composition, and VO2max were completed
using a separate 2 x 2 repeated measures ANOVA with BMI and Washout [Time] (E6-W6) as
independent variables.
Random Forest Analysis and Boruta Feature Selection
To determine whether exercise training induced orthogonal shifts in the gut microbiota
based on obesity status, Random Forest (RF) analysis was performed. The training set utilized
pre- to post-exercise change in bacterial genera (Δ E0-E6 expressed as % of total bacteria) with
BMI status as the grouping variable. RF was also performed with the change in bacterial genera
during the washout (Δ E6-W6 % of total bacteria) as the independent training set. The cross-
validation error rates of correctly predicted groupings were averaged across BMI groups
compared to the baseline error rates that would be achieved by randomly assigning to either
grouping variable by Matthews Correlation Coefficient (see Figure, Supplemental Digital
Content 5, Random Forest classification, http://links.lww.com/MSS/B108). Next, Boruta feature
selection was implemented to determine which shifts in bacterial taxa best discriminated between
lean and obese groups. Boruta selection uses RF to iteratively compare importance of
independent variables with that of pseudo-random (shadow) attributes(27). Variables
‘confirmed’ by Boruta feature selection had significantly higher RF importance scores than
‘shadow’ attributes and could therefore delineate between lean and obese groups. Analysis was
performed on R random forest package with 1000 trees and all other default values.
Copyright © 2017 by the American College of Sports Medicine. Unauthorized reproduction of this article is prohibited.
ACCEPTED
Principle Component Factor Reduction
To determine if exercise caused physiologically relevant changes in gut microbiota
composition, principle component factor analysis (PCA) was completed on the change scores of
bacterial genera (ΔE0-E6) that paralleled similar changes in SCFA (fecal butyrate or BCoAT; or
cardiorespiratory fitness (VO2max) within each BMI group. First, the analyses revealed that the
change in seven bacterial genera paralleled change in butyrate or BCoAT production in the lean
participants and ten genera paralleling change in VO2max in the obese participants via Spearman
Rho correlations. Next, retracted components explaining the overall change in these bacteria
were calculated by PCA. This factor equation was then applied (unbiased) to the washout change
scores of the same genera (ΔE6-W6). Resulting factors were then compared to each other and to
outcome variables through Pearson r correlation analysis. Loading variables with small loading
coefficients (< 0.4) were suppressed for all PCA analysis. Significance was set a priori at α <
0.05 for analyses.
RESULTS
Exercise training improved body composition and VO2max, which were reversed after
returning to sedentary activity.
Exercise training increased total lean body mass (p < 0.01, Fig. 1A), decreased body fat
percentage (p < 0.01, Fig 1B), and increased bone mineral density (p < 0.05, Fig 1C) in both
lean and obese subjects. Exercise also led to a marked improvement in cardiorespiratory fitness
as measured by relative VO2max in both lean and obese groups (p < 0.05, Fig 1D). After a return
to sedentary activity for six weeks (W6), lean mass and body fat changes that occurred in
response to training were reversed towards baseline values in both lean and obese participants (p
< 0.05; Figure 1A-B); while BMD remained higher versus baseline (Figure 1C). VO2max was
not measured at W6.
Copyright © 2017 by the American College of Sports Medicine. Unauthorized reproduction of this article is prohibited.
ACCEPTED
Exercise induces orthogonal shifts in the gut microbiome dependent on BMI status
-diversity analysis revealed that gut microbiota composition was different between lean and
obese individuals at baseline (E0 PERMANOVA p = 0.034; Fig. 2A). After exercise training,
there was no difference between the two groups (E6, PERMANOVA p = 0.31; Fig. 2B) and
remained not significantly different after the washout period (W6, PERMANOVA p = 0.27; Fig
2C). To further investigate whether exercise-training initiated orthogonal shifts in gut microbiota
communities’ dependent on obesity status, RF analysis using pre- to post-exercise change scores
of bacterial genera was implemented. Change scores of genera could be adequately trained to
predict obesity status (Cross Validation Error Rate = 19.35 + 3.32, p < 0.05 versus Baseline
Entry; see Figure A, Supplemental Digital Content 5, Random Forest classification,
http://links.lww.com/MSS/B108). Next, RF was applied to change scores of bacterial genera
from post-exercise (E6) to washout (W6) and again, could be used to predict obesity status
(Cross Validation Error Rate=18.21 + 13.35, p<0.05 versus Baseline Entry; see Figure B,
Supplemental Digital Content 5, Random Forest classification, http://links.lww.com/MSS/B108).
Bacterial taxa that shifted differentially in response to exercise as a result of obesity status
(confirmed by Boruta feature selection) are shown in Figure 2D (Exercise) and Figure 2E
(Washout). Notably, changes in three bacterial genera (Collinsella spp., Faecalibacterium spp.
and Lachnospira spp.) were strong predictors of BMI status across both RF analyses and
responded in a contrasting manner as a result of exercise training (E0-E6; Figure 2D) compared
to washout (E6-W6; Figure 2E). No differences in α-diversity of the microbiota were observed
between lean and obese participants at baseline (see Figure, Supplemental Digital Content 3,
Rarefaction α- diversity plot, http://links.lww.com/MSS/B106); p > 0.05) or at any of
remaining collection time points (p > 0.05; data not shown).
Copyright © 2017 by the American College of Sports Medicine. Unauthorized reproduction of this article is prohibited.
ACCEPTED

Exercise training increased fecal SCFA concentrations and gut microbiome SCFA-
producing capacity depending on BMI status
We investigated the effects of exercise training on fecal SCFA concentrations and genes
within the gut microbiota important for SCFA production and observed that aerobic exercise
increased fecal concentrations of the three most abundant SCFAs: acetate [C2], propionate [C3]
and butyrate [C4]. This effect appeared to be dependent on BMI status, as the change in acetate
and butyrate were observed primarily in the lean participants (Exercise x BMI p < 0.05; Fig. 3Ai
and Figure 3Aiii). Changes in SCFAs were observed concomitant to an exercise-induced
increase in the relative abundance of the butyrate-regulating gene BCoAT and the propionate-
regulating gene mmDA (p < 0.05, respectively; Fig. 3Bi-ii). At W6, fecal acetate concentrations
remained elevated (p > 0.05), while propionate and butyrate declined towards baseline levels (p
< 0.05). In the obese group, concentrations of all three SCFAs did not change from E6 to W6 (p
> 0.05; Fig 3Ai-iii). However, the washout period was accompanied by a reduction in SCFA-
producing capacity of the gut microbiome, as depicted by E6 to W6 reduction in relative
abundance of BCoAT and mmdA (p < 0.05; Fig. 3Bi-ii).
In obese individuals, we observed greater relative BCoAT compared to lean individuals (p <
0.01; Fig. 3Bi). The differences in baseline BCoAT levels, however, were not corroborated by
differences in fecal SCFA concentrations between BMI categories at baseline (Fig. 3Ai-iii).
Interestingly, and contrary to the notion that the SCFA-producing capacity of the gut microbiota
may be detrimental to obese individuals, relative concentrations of SCFAs and BCoAT were
associated with lower body fat (%), higher lean mass (%) and higher VO2max within the obese
group at baseline (see Figures A-D, Supplemental Digital Content 6, SCFAs and functional
genes versus baseline measures, http://links.lww.com/MSS/B109; p<0.05, respectively).
Copyright © 2017 by the American College of Sports Medicine. Unauthorized reproduction of this article is prohibited.
ACCEPTED

Exercise training increases butyrate-regulating bacterial taxa that strongly associate with
parallel shifts in body composition in lean individuals
Despite observing clear overall shifts in community composition, few individual taxa were
consistently altered by exercise training across all individuals. In light of this apparent
individualized response, we focused on whether functional groups of bacteria (rather than
individual taxa), changed as a result of physical activity. First, we examined whether there
existed a ‘SCFA-regulating bacterial group’ that was affected by exercise training in lean
participants only, as SCFA concentrations in obese participants were altered to a lesser degree by
exercise training compared to lean participants. Using Spearman rank correlations, we observed
that the change from E0 to E6 of five bacterial genera, Roseburia spp., Lachnospira spp.,
Clostridiales spp., Faecalibacterium spp., and f Lachnospiraceae unclass., positively correlated
with changes in butyrate and/or BCoAT, while changes in Bacteroides spp. and Rikenella spp.
negatively correlated with changes in butyrate and/or BCoAT (p < 0.05 for both analyses;
Figure 4A). Using principle components analysis, the relative changes in these selected taxa
were then modeled into one factor, which explained 61.2% of the total variance in how these
genera changed as a result of exercise training (EXERCISELN_Factor1; Figure 4B). Next, we
correlated this resulting factor against changes in body composition and VO2max and report that
exercise-induced changes in ‘butyrate-regulating bacterial group’, along with changes in SCFA
concentrations and BCoAT levels, were significantly related to changes in body composition
(e.g., increases in lean mass and reductions in fat mass) (Figure 4C). Moreover, the five bacteria
genera that were positively correlated to butyrate production were modeled into one factor
termed ‘Butyrate Producers’. These bacterial genera (Clostridiales spp, Lachnospira spp,
Roseburia spp. f_Lachnospiraceae unclass and Faecalibacterium spp.), which together consisted
of over 30% of the total representative genera, increased in abundance with exercise training
Copyright © 2017 by the American College of Sports Medicine. Unauthorized reproduction of this article is prohibited.
ACCEPTED
irrespective of BMI (p < 0.05), and then decreased after a return to sedentary activity (p < 0.05;
Figure 4D). Within the obese group, we observed fewer relationships between genera changes
and parallel shifts in SCFAs. Nevertheless, we observed a functional group of genera (10) that
paralleled changes in cardiorespiratory fitness (see Figure, Supplemental Digital Content 7,
Obese microbiota changes versus VO2 max, http://links.lww.com/MSS/B110).
A return to sedentary activity for six weeks led to a BMI dependent reversion in gut
microbiome composition
Lastly, we investigated whether a return to sedentary activity (E6-W6) would reverse the gut
microbiota changes observed after exercise training. To accomplish this, we analyzed the effects
of exercise training (ΔE0-E6) and return to sedentary activity (ΔE6-W6) on the bacterial genera
within the BMI dependent bacterial groups depicted in Figure 4 (LN) and Figure, Supplemental
Digital Content 7, Obese microbiota changes versus VO2 max, http://links.lww.com/MSS/B110
(OB). First, our results reveal that the relationship between genera changes that occurred from
ΔE0-E6 were inversely related to the genera changes that occurred from ΔE6-W6. In fact, five
out of the seven bacterial genera in the lean bacterial clade and eight out of the ten genera in the
obese bacterial clade were inversely regulated by PA status (Figure 5Ai. and Bi.). We then used
the component factor equation that most thoroughly explained the change in bacterial genera
from E0-E6 (EXERCISEfactor1) to calculate a factor explaining genera changes that occurred
during E6-W6 (WASHfactor1). Using this unbiased predictive model, we found that the calculated
factor component from the washout period WASHfactor1 was inversely correlated to that of the
factor component from exercise period EXERCISEfactor1 within both BMI categories (Lean r = -
0.831, p < 0.01, Fig 5Aii. Obese r = -0.630, p < 0.05; Fig. 5Bii.), thus further validating that gut
microbiota composition is dependent upon PA status.
Copyright © 2017 by the American College of Sports Medicine. Unauthorized reproduction of this article is prohibited.
ACCEPTED
DISCUSSION
In this study, we provide evidence that six weeks of aerobic exercise training alters the
gut microbiota and microbial-derived SCFAs in previously sedentary lean and obese adults
without any changes to dietary patterns. At baseline, obese individuals had different gut
microbiota compositions from lean individuals, and the microbiotas of the two groups responded
differently to exercise training. Additionally, we demonstrate that exercise-induced modulations
of the gut microbiota and SCFAs were strongly associated with changes in body composition in
lean participants and VO2max in obese participants, highlighting a role of the gut microbiota in
regulating physiological adaptations to exercise training. Lastly, we report that gut microbiome
changes that occurred after a return to sedentary activity were inversely related to the
modifications that occurred in response to exercise training, providing further evidence that
physical activity status contributes significantly to the composition of the human gut microbiota.
This study revealed that compositional and functional microbiome changes due to
exercise participation (or a return to sedentary activity) were dependent on BMI. This was
indicated by obesity-dependent differences in baseline gut microbiota composition that were not
maintained after six weeks of exercise. Further highlighting the BMI-dependent response to
training, exercise-induced shifts in SCFA-producing taxa (Faecalibacterium spp. and
Lachnospira spp.) and genetic machinery (BCoAT) were more substantial in lean versus obese
participants.
Exercise-induced increases in fecal SCFA concentrations observed in this study corroborate data
presented in rodent models (8), as well as a previous cross-sectional study in humans relating
fecal butyrate concentrations to VO2max and muscle turnover (12). The mechanism(s) responsible
for exercise-induced increases in fecal SCFA concentration are not yet clear, but could involve
Copyright © 2017 by the American College of Sports Medicine. Unauthorized reproduction of this article is prohibited.
ACCEPTED

increased production of SCFA through endogenous metabolic input (e.g. lactate), increased
mixing of intestinal contents and bacterial fermentation of dietary fibers, increased anaerobic
fermentation due to colonic oxygen saturation or pH changes, or reduced intestinal utilization
and uptake of SCFA (28). Exercise-induced increases in fecal SCFA may also be augmented
by shifts in the gut microbiota’s functional capacity to produce SCFA. Of the genes within the
gut microbiota involved in SCFA production, Butyryl CoA: Acetate CoA transferase (BCoAT) is
one of two known butyrate-producing genes that contributes significantly to butyrate levels (29).
Functionally, BCoAT transfers a co-enzyme A group from butyrl CoA to acetate, which results
in the formation of acetyl CoA and butyrate, two substrates utilized by tissues for macromolecule
synthesis or energy production (30). Methylmalonyl-CoA decarboxylase (mmdA), meanwhile, is
an integral gene in the succinate pathway, one of three propionate regulating pathways highly
conserved within the mammalian gut microbiota (24). In light of the prominent roles of these
genes in SCFA production and their strong association with SCFA-producing bacteria, we
hypothesize that exercise-induced increases in these functional genes may partially explain the
parallel rise in fecal SCFAs.Moreover, it is possible that these shifts in SCFA genetic machinery
may augment responses to other environmental cues within the gut, including increased potential
for dietary fiber fermentation, ultimately leading to increased SCFA production (31).
Exercise-induced increases in fecal BCoAT and SCFA levels also strongly paralleled
improvements in body composition, including most notably, increases in lean mass . The
mechanisms behind such an association are unclear, but many possible explanations exist.
SCFAs can improve skeletal muscle insulin sensitivity (32), reduce inflammation (33), and
regulate satiety (34), all of which may contribute to the improvements in body composition
observed in this study. Additionally, SCFAs are also energy substrates for numerous tissue types,
Copyright © 2017 by the American College of Sports Medicine. Unauthorized reproduction of this article is prohibited.
ACCEPTED

including colon (35), adipose (36), and muscle (32), indicating that SCFAs can contribute to
enhanced energy harvest from the diet, ultimately leading to enhanced tissue growth, including
skeletal muscle. Considering the findings presented here and previous cross-sectional studies
(12, 13), we postulate that an exercise-induced increase towards a greater SCFA-producing
capacity may represent a beneficial adaptation, ultimately contributing to enhanced
replenishment of expended calories and improvements in body composition. The SCFA-
producing capacity of the gut microbiota also returned to pre-training levels after the washout
period, as indicated by a return of fecal BCoAT and mmDA levels (within the lean and obese
groups) and butyrate-producing bacteria taxa (within the lean group) toward baseline values. In
light of these findings, we postulate that exercise-induced shifts in the metabolic capacity of the
gut microbiome may be transient and likely dependent on repeated exercise stimuli.
This study also identified differences in the baseline microbiome characteristics and
SCFA producing capabilities between lean and obese individuals. Most notably, obese
participants displayed nearly double the baseline levels of BCoAT compared to lean
counterparts. The possible role of BCoAT and SCFAs in energy harvest during obesity was first
described in a seminal study by Turnbaugh et al.(14), who showed that a fecal transplant from
obese individuals into germ-free (GF) mice led to increased gut SCFA concentrations and an
obese phenotype in the recipient mice. In humans, successful weight loss through gastric bypass
surgery was accompanied by reduced levels of BCoAT (37). However, contrary to previous
studies, we observed no differences in the concentrations of any SCFAs between lean and obese
individuals. Moreover, and conflicting with the notion that SCFAs lead to aberrant body
composition phenotypes during obesity, this study indicates that within the obese participants,
baseline fecal butyrate concentrations were strongly associated with higher lean mass, reduced
body fat, and higher cardiorespiratory fitness (VO2max), while BCoAT levels were associated
Copyright © 2017 by the American College of Sports Medicine. Unauthorized reproduction of this article is prohibited.
ACCEPTED

with higher lean mass. Therefore, these data challenge the assumption that the gut microbiome’s
potential to produce SCFAs is a biomarker for a maladaptive obese phenotype. Rather, it appears
that these factors are indicative of healthier body composition and enhanced cardiorespiratory
fitness during obesity.
Exercise-induced shifts in the gut microbiota and SCFAs may have implications for
diseases of the gut. Physical activity has been shown to reduce risk of colorectal cancer and
irritable bowel disease (IBD) (38). Butyrate is a primary fuel source for colonocytes (39), is
required for maintaining gut barrier function (40), and is a critical metabolite regulating the anti-
inflammatory/regulatory phenotypes of gut-resident immune cells (41). Interestingly, genera that
positively associated with exercise-induced increases in butyrate concentrations
(Faecalibacterium spp., Roseburia spp., Lachnospira spp., f_Lachnospiraceae, and Clostridiales
spp.), are well documented butyrate producers (31, 42), and have been associated with notable
physiological outcomes in vivo. In particular, Faecalibacterium spp._has been shown to induce
local and systemic anti-inflammatory effects and may be protective against bowel diseases,
including ulcerative colitis (43, 44). Thus, we postulate that exercise-induced shifts in SCFAs,
butyrate-producing taxa and metabolic capacity to produce SCFA may have the potential to
prevent the occurrence or offset the symptomology of IBD. Future studies are needed to address
these hypotheses more closely.
There are limitations to this study. Seven participants did not adhere to washout guidelines and
were excluded from analysis. We also did not include VO2 max at the end of the study due to
predicted subject burden of an extended exercise training study. We did, however, assess
washout body composition to verify that physiological parameters reverted to pre-exercise levels
after a return to sedentary activity.
Copyright © 2017 by the American College of Sports Medicine. Unauthorized reproduction of this article is prohibited.
ACCEPTED
In summary, these data indicate for the first time that exercise training can significantly
modulate the composition and metabolic capacity of the human gut microbiota. Exercise-induced
changes in the gut microbiota are valuable prognostic features that are integral to understanding
the overall physiological response to exercise training in humans.
Acknowledgements
The authors would like to acknowledge Mark Band, Chris Wright and Alvaro Hernandez at the
Roy J. Carver Biotechnology Center at the UIUC for their contribution to sequencing preparation
and analysis. This work was partially funded by a doctoral student research grant from the
American College of Sports Medicine (ACSM)
Conflict of Interest Statement
Authors have no professional relationships with companies or manufacturers who will benefit
from the results of the present study. Results of the present study do not constitute endorsement
by ACSM. Results of the study are presented clearly, honestly and without fabrication,
falsification, or inappropriate data manipulation.
Copyright © 2017 by the American College of Sports Medicine. Unauthorized reproduction of this article is prohibited.
ACCEPTED

REFERENCES
1. David LA, Maurice CF, Carmody RN, Gootenberg DB, Button JE, Wolfe BE, et al. Diet
rapidly and reproducibly alters the human gut microbiome. Nature. 2013. doi:
10.1038/nature12820. PubMed PMID: 24336217.
2. Cani PD. Gut microbiota and obesity: lessons from the microbiome. Briefings in
functional genomics. 2013;12(4):381-7. Epub 2013/04/26. doi: 10.1093/bfgp/elt014. PubMed
PMID: 23616309.
3. Dominguez-Bello MG, Costello EK, Contreras M, Magris M, Hidalgo G, Fierer N, et al.
Delivery mode shapes the acquisition and structure of the initial microbiota across multiple body
habitats in newborns. Proceedings of the National Academy of Sciences of the United States of
America. 2010;107(26):11971-5. Epub 2010/06/23. doi: 10.1073/pnas.1002601107. PubMed
PMID: 20566857; PubMed Central PMCID: PMC2900693.
4. Allen JM, Berg Miller ME, Pence BD, Whitlock K, Nehra V, Gaskins HR, et al.
Voluntary and forced exercise differentially alters the gut microbiome in C57BL/6J mice. J Appl
Physiol (1985). 2015;118(8):1059-66. doi: 10.1152/japplphysiol.01077.2014. PubMed PMID:
25678701.
5. Choi JJ, Eum SY, Rampersaud E, Daunert S, Abreu MT, Toborek M. Exercise attenuates
PCB-induced changes in the mouse gut microbiome. Environmental health perspectives.
2013;121(6):725-30. doi: 10.1289/ehp.1306534. PubMed PMID: 23632211; PubMed Central
PMCID: PMC3672930.
Copyright © 2017 by the American College of Sports Medicine. Unauthorized reproduction of this article is prohibited.
ACCEPTED

6. Kang SS, Jeraldo PR, Kurti A, Miller ME, Cook MD, Whitlock K, et al. Diet and
exercise orthogonally alter the gut microbiome and reveal independent associations with anxiety
and cognition. Mol Neurodegener. 2014;9:36. doi: 10.1186/1750-1326-9-36. PubMed PMID:
25217888; PubMed Central PMCID: PMCPMC4168696.
7. Evans CC, LePard KJ, Kwak JW, Stancukas MC, Laskowski S, Dougherty J, et al.
Exercise prevents weight gain and alters the gut microbiota in a mouse model of high fat diet-
induced obesity. PloS one. 2014;9(3):e92193. Epub 2014/03/29. doi:
10.1371/journal.pone.0092193. PubMed PMID: 24670791; PubMed Central PMCID:
PMC3966766.
8. Matsumoto M, Inoue R, Tsukahara T, Ushida K, Chiji H, Matsubara N, et al. Voluntary
running exercise alters microbiota composition and increases n-butyrate concentration in the rat
cecum. Biosci Biotechnol Biochem. 2008;72(2):572-6. doi: 10.1271/bbb.70474. PubMed PMID:
18256465.
9. Kaczmarczyk MM, Miller MJ, Freund GG. The health benefits of dietary fiber: beyond
the usual suspects of type 2 diabetes mellitus, cardiovascular disease and colon cancer.
Metabolism: clinical and experimental. 2012;61(8):1058-66. doi:
10.1016/j.metabol.2012.01.017. PubMed PMID: 22401879; PubMed Central PMCID:
PMC3399949.
10. Watterson KR, Hudson BD, Ulven T, Milligan G. Treatment of type 2 diabetes by free
Fatty Acid receptor agonists. Frontiers in endocrinology. 2014;5:137. Epub 2014/09/16. doi:
10.3389/fendo.2014.00137. PubMed PMID: 25221541; PubMed Central PMCID: PMC4147718.
Copyright © 2017 by the American College of Sports Medicine. Unauthorized reproduction of this article is prohibited.
ACCEPTED
11. De Vadder F, Kovatcheva-Datchary P, Goncalves D, Vinera J, Zitoun C, Duchampt A, et
al. Microbiota-generated metabolites promote metabolic benefits via gut-brain neural circuits.
Cell. 2014;156(1-2):84-96. Epub 2014/01/15. doi: 10.1016/j.cell.2013.12.016. PubMed PMID:
24412651.
12. Estaki M, Pither J, Baumeister P, Little JP, Gill SK, Ghosh S, et al. Cardiorespiratory
fitness as a predictor of intestinal microbial diversity and distinct metagenomic functions.
Microbiome. 2016;4(1):42. doi: 10.1186/s40168-016-0189-7. PubMed PMID: 27502158;
PubMed Central PMCID: PMCPMC4976518.
13. Barton W, Penney NC, Cronin O, Garcia-Perez I, Molloy MG, Holmes E, et al. The
microbiome of professional athletes differs from that of more sedentary subjects in composition
and particularly at the functional metabolic level. Gut. 2017. doi: 10.1136/gutjnl-2016-313627.
PubMed PMID: 28360096.
14. Turnbaugh PJ, Ley RE, Mahowald MA, Magrini V, Mardis ER, Gordon JI. An obesity-
associated gut microbiome with increased capacity for energy harvest. Nature.
2006;444(7122):1027-31. doi: 10.1038/nature05414. PubMed PMID: 17183312.
15. McPhee JB, Schertzer JD. Immunometabolism of obesity and diabetes: microbiota link
compartmentalized immunity in the gut to metabolic tissue inflammation. Clinical science.
2015;129(12):1083-96. Epub 2015/10/16. doi: 10.1042/CS20150431. PubMed PMID: 26464517.
16. Woods JA, Vieira VJ, Keylock KT. Exercise, inflammation, and innate immunity.
Immunol Allergy Clin North Am. 2009;29(2):381-93. Epub 2009/04/25. doi: S0889-
8561(09)00012-5 [pii]
10.1016/j.iac.2009.02.011. PubMed PMID: 19389588.
Copyright © 2017 by the American College of Sports Medicine. Unauthorized reproduction of this article is prohibited.
ACCEPTED

17. Hammer RL, Barrier CA, Roundy ES, Bradford JM, Fisher AG. Calorie-restricted low-
fat diet and exercise in obese women. The American journal of clinical nutrition. 1989;49(1):77-
85. PubMed PMID: 2912014.
18. Campbell SC, Wisniewski PJ, Noji M, McGuinness LR, Haggblom MM, Lightfoot SA,
et al. The Effect of Diet and Exercise on Intestinal Integrity and Microbial Diversity in Mice.
PloS one. 2016;11(3):e0150502. doi: 10.1371/journal.pone.0150502. PubMed PMID: 26954359;
PubMed Central PMCID: PMC4783017.
19. Goldberg Y, Boaz M, Matas Z, Goldberg I, Shargorodsky M. Weight loss induced by
nutritional and exercise intervention decreases arterial stiffness in obese subjects. Clinical
nutrition. 2009;28(1):21-5. Epub 2008/11/21. doi: 10.1016/j.clnu.2008.10.001. PubMed PMID:
19019502.
20. Pollock ML, Foster C, Schmidt D, Hellman C, Linnerud AC, Ward A. Comparative
analysis of physiologic responses to three different maximal graded exercise test protocols in
healthy women. Am Heart J. 1982;103(3):363-73. PubMed PMID: 7064770.
21. Muturi EJ, Donthu RK, Fields CJ, Moise IK, Kim CH. Effect of pesticides on microbial
communities in container aquatic habitats. Scientific reports. 2017;7:44565. doi:
10.1038/srep44565. PubMed PMID: 28300212; PubMed Central PMCID: PMC5353589.
22. Panasevich MR, Allen JM, Wallig MA, Woods JA, Dilger RN. Moderately Fermentable
Potato Fiber Attenuates Signs and Inflammation Associated with Experimental Colitis in Mice.
The Journal of nutrition. 2015;145(12):2781-8. Epub 2015/10/23. doi: 10.3945/jn.115.218578.
PubMed PMID: 26491118.
Copyright © 2017 by the American College of Sports Medicine. Unauthorized reproduction of this article is prohibited.
ACCEPTED
23. Louis P, Flint HJ. Development of a semiquantitative degenerate real-time pcr-based
assay for estimation of numbers of butyryl-coenzyme A (CoA) CoA transferase genes in
complex bacterial samples. Applied and environmental microbiology. 2007;73(6):2009-12. Epub
2007/01/30. doi: 10.1128/AEM.02561-06. PubMed PMID: 17259367; PubMed Central PMCID:
PMC1828812.
24. Reichardt N, Duncan SH, Young P, Belenguer A, McWilliam Leitch C, Scott KP, et al.
Phylogenetic distribution of three pathways for propionate production within the human gut
microbiota. The ISME journal. 2014;8(6):1323-35. Epub 2014/02/21. doi:
10.1038/ismej.2014.14. PubMed PMID: 24553467; PubMed Central PMCID: PMC4030238.
25. Kuczynski J, Stombaugh J, Walters WA, Gonzalez A, Caporaso JG, Knight R. Using
QIIME to analyze 16S rRNA gene sequences from microbial communities. Current protocols in
microbiology. 2012;Chapter 1:Unit 1E 5. Epub 2012/11/28. doi:
10.1002/9780471729259.mc01e05s27. PubMed PMID: 23184592.
26. Vazquez-Baeza Y, Pirrung M, Gonzalez A, Knight R. EMPeror: a tool for visualizing
high-throughput microbial community data. GigaScience. 2013;2(1):16. doi: 10.1186/2047-
217X-2-16. PubMed PMID: 24280061; PubMed Central PMCID: PMC4076506.
27. Kursa MB. Robustness of Random Forest-based gene selection methods. BMC
bioinformatics. 2014;15:8. doi: 10.1186/1471-2105-15-8. PubMed PMID: 24410865; PubMed
Central PMCID: PMC3897925.
Copyright © 2017 by the American College of Sports Medicine. Unauthorized reproduction of this article is prohibited.
ACCEPTED
28. Turnbaugh PJ, Gordon JI. The core gut microbiome, energy balance and obesity. The
Journal of physiology. 2009;587(Pt 17):4153-8. Epub 2009/06/06. doi:
10.1113/jphysiol.2009.174136. PubMed PMID: 19491241; PubMed Central PMCID:
PMC2754355.
29. Louis P, McCrae SI, Charrier C, Flint HJ. Organization of butyrate synthetic genes in
human colonic bacteria: phylogenetic conservation and horizontal gene transfer. FEMS
microbiology letters. 2007;269(2):240-7. Epub 2007/01/24. doi: 10.1111/j.1574-
6968.2006.00629.x. PubMed PMID: 17241242.
30. Charrier C, Duncan GJ, Reid MD, Rucklidge GJ, Henderson D, Young P, et al. A novel
class of CoA-transferase involved in short-chain fatty acid metabolism in butyrate-producing
human colonic bacteria. Microbiology. 2006;152(Pt 1):179-85. Epub 2005/12/31. doi:
10.1099/mic.0.28412-0. PubMed PMID: 16385128.
31. Hippe B, Zwielehner J, Liszt K, Lassl C, Unger F, Haslberger AG. Quantification of
butyryl CoA:acetate CoA-transferase genes reveals different butyrate production capacity in
individuals according to diet and age. FEMS microbiology letters. 2011;316(2):130-5. Epub
2011/01/06. doi: 10.1111/j.1574-6968.2010.02197.x. PubMed PMID: 21204931.
32. Canfora EE, Jocken JW, Blaak EE. Short-chain fatty acids in control of body weight and
insulin sensitivity. Nature reviews Endocrinology. 2015;11(10):577-91. Epub 2015/08/12. doi:
10.1038/nrendo.2015.128. PubMed PMID: 26260141.
33. Roelofsen H, Priebe MG, Vonk RJ. The interaction of short-chain fatty acids with
adipose tissue: relevance for prevention of type 2 diabetes. Beneficial microbes. 2010;1(4):433-
7. doi: 10.3920/BM2010.0028. PubMed PMID: 21831781.
Copyright © 2017 by the American College of Sports Medicine. Unauthorized reproduction of this article is prohibited.
ACCEPTED

34. Kaji I, Karaki S, Kuwahara A. Short-chain fatty acid receptor and its contribution to
glucagon-like peptide-1 release. Digestion. 2014;89(1):31-6. Epub 2014/01/25. doi:
10.1159/000356211. PubMed PMID: 24458110.
35. Astbury SM, Corfe BM. Uptake and metabolism of the short-chain fatty acid butyrate, a
critical review of the literature. Current drug metabolism. 2012;13(6):815-21. PubMed PMID:
22571479.
36. den Besten G, Bleeker A, Gerding A, van Eunen K, Havinga R, van Dijk TH, et al. Short-
Chain Fatty Acids Protect Against High-Fat Diet-Induced Obesity via a PPARgamma-Dependent
Switch From Lipogenesis to Fat Oxidation. Diabetes. 2015;64(7):2398-408. Epub 2015/02/20.
doi: 10.2337/db14-1213. PubMed PMID: 25695945.
37. Patrone V, Vajana E, Minuti A, Callegari ML, Federico A, Loguercio C, et al.
Postoperative Changes in Fecal Bacterial Communities and Fermentation Products in Obese
Patients Undergoing Bilio-Intestinal Bypass. Front Microbiol. 2016;7:200. doi:
10.3389/fmicb.2016.00200. PubMed PMID: 26941724; PubMed Central PMCID:
PMCPMC4762995.
38. Wolin KY, Yan Y, Colditz GA, Lee IM. Physical activity and colon cancer prevention: a
meta-analysis. British journal of cancer. 2009;100(4):611-6. doi: 10.1038/sj.bjc.6604917.
PubMed PMID: 19209175; PubMed Central PMCID: PMC2653744.
39. Donohoe DR, Garge N, Zhang X, Sun W, O'Connell TM, Bunger MK, et al. The
microbiome and butyrate regulate energy metabolism and autophagy in the mammalian colon.
Cell metabolism. 2011;13(5):517-26. doi: 10.1016/j.cmet.2011.02.018. PubMed PMID:
21531334; PubMed Central PMCID: PMC3099420.
Copyright © 2017 by the American College of Sports Medicine. Unauthorized reproduction of this article is prohibited.
ACCEPTED
40. Peng L, Li ZR, Green RS, Holzman IR, Lin J. Butyrate enhances the intestinal barrier by
facilitating tight junction assembly via activation of AMP-activated protein kinase in Caco-2 cell
monolayers. The Journal of nutrition. 2009;139(9):1619-25. doi: 10.3945/jn.109.104638.
PubMed PMID: 19625695; PubMed Central PMCID: PMC2728689.
41. Furusawa Y, Obata Y, Fukuda S, Endo TA, Nakato G, Takahashi D, et al. Commensal
microbe-derived butyrate induces the differentiation of colonic regulatory T cells. Nature.
2013;504(7480):446-50. doi: 10.1038/nature12721. PubMed PMID: 24226770.
42. Louis P, Duncan SH, McCrae SI, Millar J, Jackson MS, Flint HJ. Restricted distribution
of the butyrate kinase pathway among butyrate-producing bacteria from the human colon. J
Bacteriol. 2004;186(7):2099-106. Epub 2004/03/19. PubMed PMID: 15028695; PubMed Central
PMCID: PMC374397.
43. Machiels K, Joossens M, Sabino J, De Preter V, Arijs I, Eeckhaut V, et al. A decrease of
the butyrate-producing species Roseburia hominis and Faecalibacterium prausnitzii defines
dysbiosis in patients with ulcerative colitis. Gut. 2014;63(8):1275-83. Epub 2013/09/12. doi:
10.1136/gutjnl-2013-304833. PubMed PMID: 24021287.
44. Qiu X, Zhang M, Yang X, Hong N, Yu C. Faecalibacterium prausnitzii upregulates
regulatory T cells and anti-inflammatory cytokines in treating TNBS-induced colitis. J Crohns
Colitis. 2013;7(11):e558-68. Epub 2013/05/07. doi: 10.1016/j.crohns.2013.04.002. PubMed
PMID: 23643066.
Copyright © 2017 by the American College of Sports Medicine. Unauthorized reproduction of this article is prohibited.
ACCEPTED

Figure Legends
Figure 1. Changes from pre-exercise (E0) to post-exercise (E6) and washout (W6) for; A) lean
mass % [upper right inset: absolute lean mass], B) body fat % (BF%) [upper right inset: absolute
fat mass], C) bone mineral density (BMD) grams/cm2 and D) relative maximal oxygen
consumption (VO2max) in ml/kg/min. * p < 0.05 versus E0 in respective group. N/A indicates that
VO2max tests were not administered at the washout time point.
Figure 2. A-C) Principle coordinates analysis (PCoA) of gut microbiota community composition
(Weighted Unifrac) comparing Lean (LN) versus Obese (OB) groups at A) pre-exercise (E0), B)
after exercise training for six weeks (E6) and, C) following a return to sedentary activity for six
weeks (W6). PERMANOVA p < 0.05 deems significant difference between LN and OB
microbiota communities, ns = not significantly different. D-E) Comparison of bacterial genera
that changed orthogonally based on obesity status as a result of D) Exercise training (E0-E6) and
E) Returning to sedentary activity washout (E6-W6); data are represented as Δ E0-E6 change (+
SEM). Genera represented were ‘confirmed’ by Boruta feature selection as satisfactory in
describing obesity category.
Figure 3. A) Changes in fecal SCFA concentrations: i. acetate [C2], ii. propionate [C3] and iii.
butyrate [C4] as a result of 6 weeks of exercise training (E0-E6) and returning to sedentary
activity for six weeks (E6-W6, upper right graphs), B) changes in relative abundance of i.
Butyryl CoA: acetate CoA transferase (BCoAT) and ii. methylmalonyl CoA decarboxylase
(mmDA) as a result of six weeks of exercise training (E0-E6) and return to sedentary activity for
six weeks (E6-W6, upper right graphs). *Denotes significant Time [Exercise or Washout] x
Group [BMI] interaction effect; #denotes significant Exercise or Washout main effect; &denotes
significant BMI main effect at p < 0.05.
Copyright © 2017 by the American College of Sports Medicine. Unauthorized reproduction of this article is prohibited.
ACCEPTED

Figure 4. A) Spearman correlations relating exercise-induced changes in seven bacterial
genera to parallel changes in fecal concentrations of butyrate and relative abundance of butyryl
CoA:acetate CoA transferase (BCoAT) within the LN group only. EXERCISELN_Factor1
represents
the component factor that most thoroughly explained the variance (61.2% of total) of the change
in the highlighted bacterial genera. Spearman ρ, *p<0.05, **p<0.01 B) Loading coefficients for
each selected taxa used in primary component factor explaining largest overall variance.
EXERCISELn_FACTOR1
is representative of the factor component that most thoroughly explained
the variance in change of these select bacteria genera (61.2%). C) Exercise-induced changes in
butyrate-regulating taxa (ExerciseLN_factor1), butyrate and BCoAT associate with parallel changes
in body composition but not cardiorespiratory fitness within the LN participants (E0-E6),
Pearson r, *p<0.05, **p<0.01. D) Indicates the effects of exercise training on the overall change
in the five bacterial taxa (Roseburia spp + Lachnospira spp. + f_Lachnospriaceae +
Clostridiales spp. + Faecalibacterium spp.) that positively associated with changes in butyrate
or BCoAT concentrations, termed ‘Butyrate Producers’. # Main effect of Exercise (E0-E6) or
Washout (E6-W6) at p<0.05.
Figure 5. Spearman correlations describing the relationship between the gut microbiota response
to exercise-training (E0-E6) versus the gut microbiota responses to washout from exercise (E6-
W6) regarding individual bacterial genera within: Ai) lean and Bi) obese ‘functional clades’. Aii
– Bii) Factor equations explaining most variance in bacterial change during exercise period
among both BMI categories (EXERCISELN_factor1 or EXERCISEOB_Factor1) were applied directly
to those genera changes that occurred during the washout. The resulting factor component,
termed WASHLN_factor1 or WASHOB_FACTOR1, was then compared with Pearson r correlations to
the corresponding EXERCISE factor component.
Copyright © 2017 by the American College of Sports Medicine. Unauthorized reproduction of this article is prohibited.
ACCEPTED

Supplemental Digital Content
SDC 1.TIF Experimental Design. HRR= Heart Rate Reserve; Body Comp = Body
Composition analysis through DEXA; VO2
max = Maximal Oxygen Uptake.
SDC 2.PDF Baseline dietary consumption A) Absolute (total intake/day) or B) Relative (% of
total Kcal) macronutrient or fiber intake does not differ between lean and obese participants.
Data are represented as Mean + S.E.M. *Represents significant difference between Lean and
Obese groups at p < 0.05.
SDC 3.TIF Rarefaction α- diversity plot. Rarefaction plot (Chao 1) at 14,201 sequences per
sample (rarefaction depth).No statistical differences were observed between α-diversity of lean
and obese participants at baseline or at any time point throughout the study p>0.05
SDC 4.PDF qPCR target genes and primer sequences. Forward and reverse primers (5’-3’)
used for relative gene quantification through qPCR.
SDC 5.TIF Random Forest classification Random Forest (RF) analysis was performed on the
A) pre- to post-exercise change (E0-E6) and B) post-exercise to washout change (E6-W6) in
bacterial genera as the training sets and with BMI status as the grouping variable. The cross-
validation error rates (averaged across BMI groups) were compared to the baseline error rates
that would be achieved by randomly assigning to either grouping variable through a Matthew’s
correlation coefficient.
Copyright © 2017 by the American College of Sports Medicine. Unauthorized reproduction of this article is prohibited.
ACCEPTED

SDC 6.TIF SCFAs and functional genes versus baseline measures A-C) Butyrate
concentrations associate with A) higher lean mass, B) lower body fat and C) higher
cardiorespiratory fitness (VO2max) within obese participants at the baseline time point (E0). D)
Butyrate regulating gene BCoAT also associates with higher relative VO2max in obese
participants at E0. Pearson correlation coefficients significant at p <0.05, respectively.
SDC 7.TIF Obese microbiota changes versus VO2max A) Spearman correlations relating
changes in ten bacterial genera to parallel changes in cardiorespiratory fitness within the obese
group only. Spearman ρ *p<0.05, ** p<0.01 B) Loading coefficients for each selected taxa used
in primary component factor analysis. EXERCISEOB_FACTOR1
is representative of the factor
component that most thoroughly explained the variance in change of these select bacteria genera
(74.05%). C) EXERCISEOB_Factor1
was positively associated with changes in cardiorespiratory
fitness within the obese group. Pearson r *p<0.05, **p<0.01
Copyright © 2017 by the American College of Sports Medicine. Unauthorized reproduction of this article is prohibited.
ACCEPTED

Figure 1
Copyright © 2017 by the American College of Sports Medicine. Unauthorized reproduction of this article is prohibited.
ACCEPTED

Figure 2
Copyright © 2017 by the American College of Sports Medicine. Unauthorized reproduction of this article is prohibited.
ACCEPTED

Figure 3
Copyright © 2017 by the American College of Sports Medicine. Unauthorized reproduction of this article is prohibited.
ACCEPTED
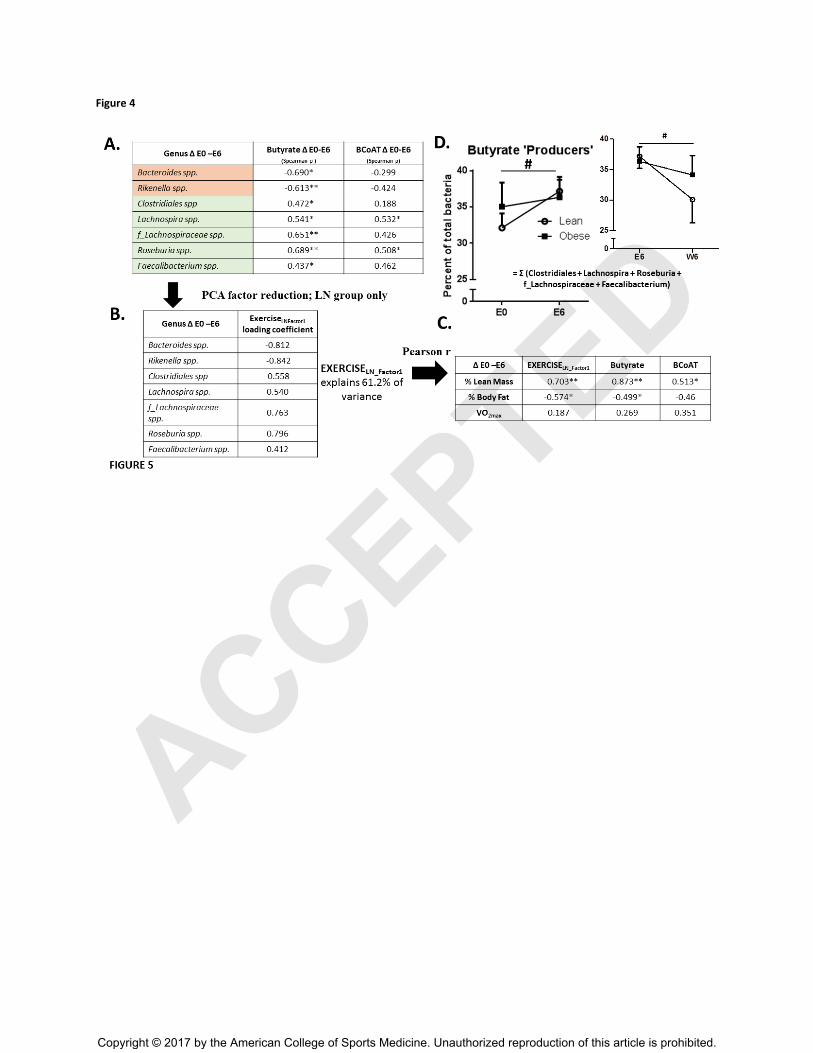
Figure 4
Copyright © 2017 by the American College of Sports Medicine. Unauthorized reproduction of this article is prohibited.
ACCEPTED

Figure 5
Copyright © 2017 by the American College of Sports Medicine. Unauthorized reproduction of this article is prohibited.
ACCEPTED

Table 1. Subject characteristics at baseline. Data are mean + SEM. *Significant effect of BMI category at p<0.05.
BMI Group
Lean (n=18); 9 female Obese (n=14); 11 female
Age (yrs) 25.10 + 6.52 31.14 + 8.57
BMI (kg/m2)
22.21 + 2.76 35.71 + 5.11*
Weight (kg) 58.92 + 9.29 100.09 + 23.60*
Body Fat % 26.04 + 6.12 38.42 + 4.98*
Lean Mass % 71.52 + 6.18 59.42 + 5.03*
Bone Density (g/cm2)
1.11 + 0.08 1.21 + 0.12*
Absolute VO2Max
2.51 + 0.61 2.86 + 0.89
Relative VO2Max
38.99 + 4.74 28.76 + 6.01*
Copyright © 2017 by the American College of Sports Medicine. Unauthorized reproduction of this article is prohibited.
ACCEPTED

Copyright © 2017 by the American College of Sports Medicine. Unauthorized reproduction of this article is prohibited.
ACCEPTED

Copyright © 2017 by the American College of Sports Medicine. Unauthorized reproduction of this article is prohibited.
ACCEPTED

Copyright © 2017 by the American College of Sports Medicine. Unauthorized reproduction of this article is prohibited.
ACCEPTED
Copyright © 2017 by the American College of Sports Medicine. Unauthorized reproduction of this article is prohibited.
ACCEPTED
Copyright © 2017 by the American College of Sports Medicine. Unauthorized reproduction of this article is prohibited.
ACCEPTED

Copyright © 2017 by the American College of Sports Medicine. Unauthorized reproduction of this article is prohibited.
ACCEPTED

Copyright © 2017 by the American College of Sports Medicine. Unauthorized reproduction of this article is prohibited.
ACCEPTED