exhibit 3-1 strategic questions
TRANSCRIPT

© 1983 – 2020 John Barrickman and New Horizons Financial Group LLC. All rights reserved.
Module 3
Assessing the Risks Facing the Borrower
© 1983 – 2020 John Barrickman and New Horizons Financial Group LLC. All rights reserved.
2
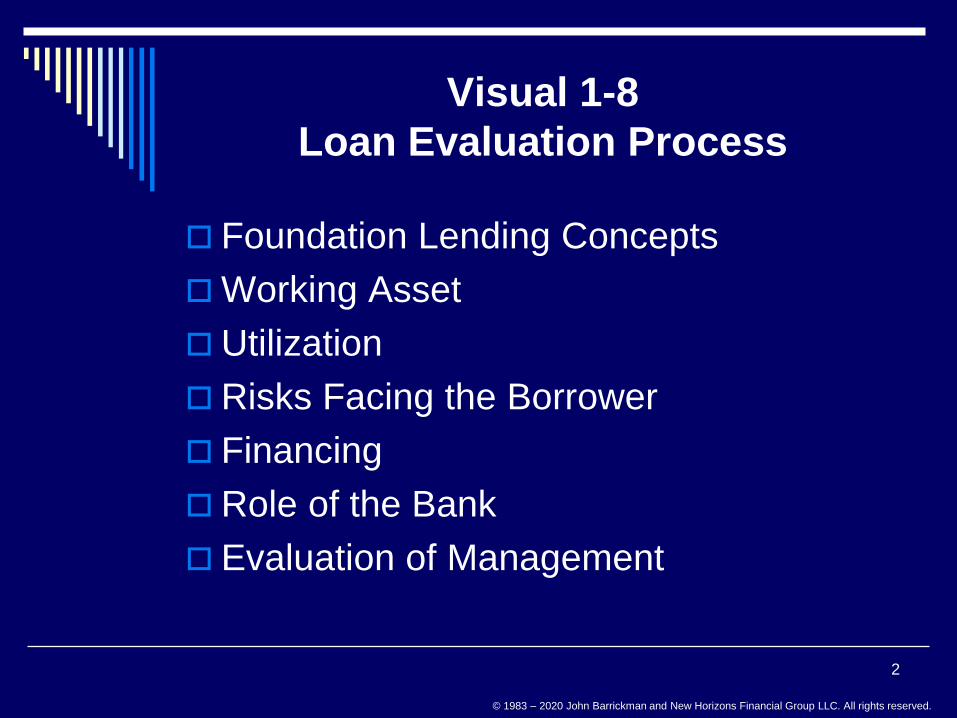
Visual 1-8
Loan Evaluation Process
Foundation Lending Concepts
Working Asset
Utilization
Risks Facing the Borrower
Financing
Role of the Bank
Evaluation of Management
© 1983 – 2020 John Barrickman and New Horizons Financial Group LLC. All rights reserved.
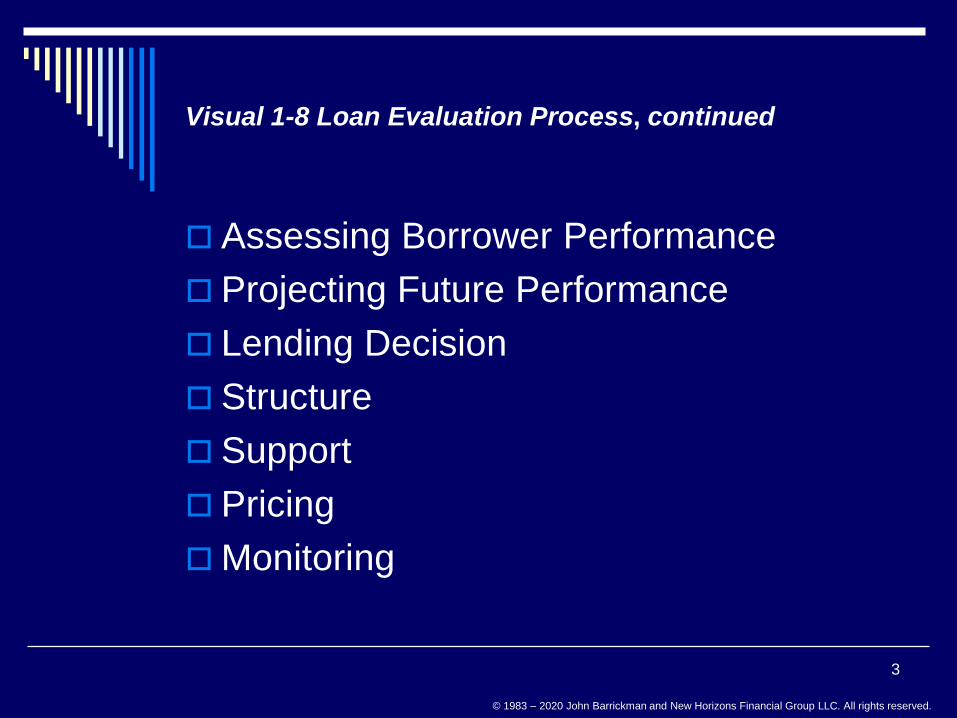
Visual 1-8 Loan Evaluation Process, continued
Assessing Borrower Performance
Projecting Future Performance
Lending Decision
Structure
Support
Pricing
Monitoring
3
© 1983 – 2020 John Barrickman and New Horizons Financial Group LLC. All rights reserved.
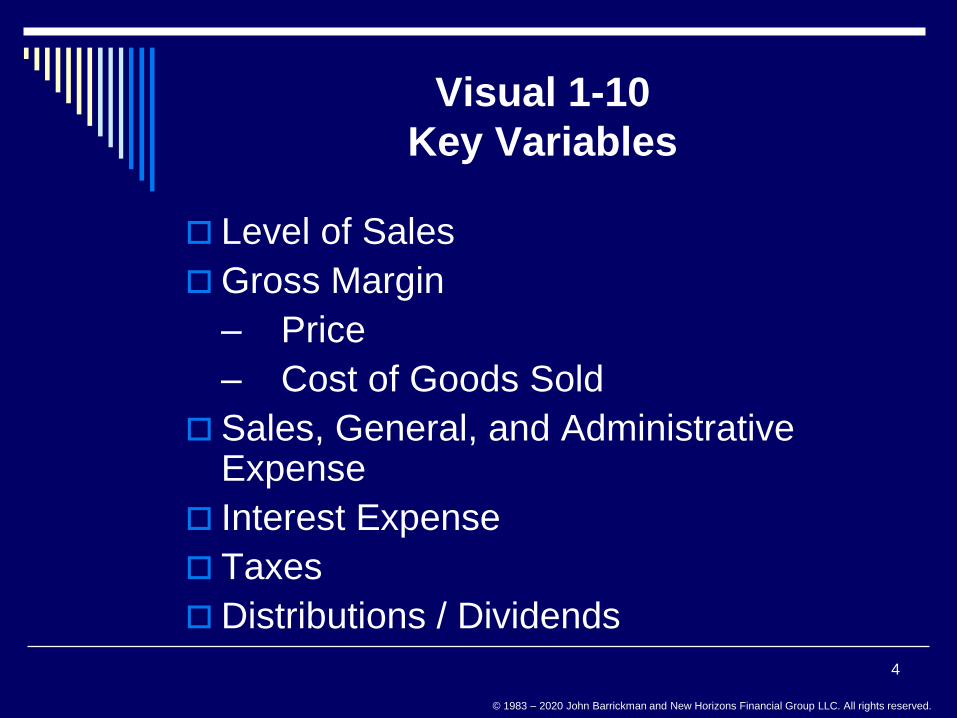
Visual 1-10
Key Variables
Level of Sales
Gross Margin
– Price
– Cost of Goods Sold
Sales, General, and Administrative Expense
Interest Expense
Taxes
Distributions / Dividends
4
© 1983 – 2020 John Barrickman and New Horizons Financial Group LLC. All rights reserved.
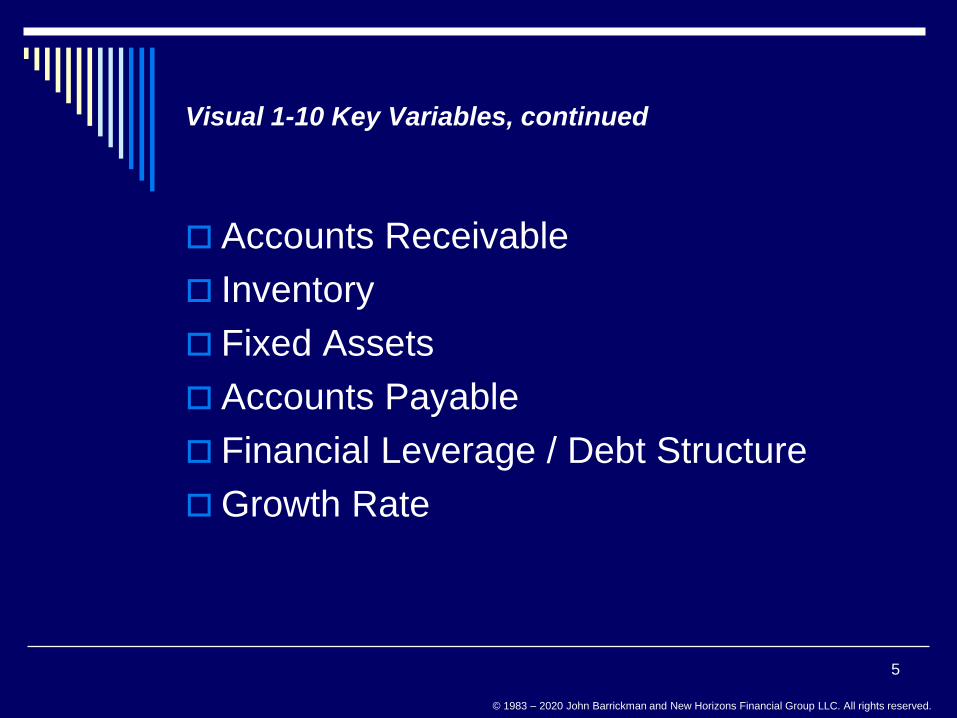
Visual 1-10 Key Variables, continued
Accounts Receivable
Inventory
Fixed Assets
Accounts Payable
Financial Leverage / Debt Structure
Growth Rate
5

© 1983 – 2020 John Barrickman and New Horizons Financial Group LLC. All rights reserved.
6
Visual 3-1
Economic Fluctuations
Seasonal
Cyclical
Secular
Wave

© 1983 – 2020 John Barrickman and New Horizons Financial Group LLC. All rights reserved.
7
Visual 3-2*
Factors Influencing the Economy
Fiscal Policy
Monetary Policy
Regulation
Foreign Influence
Consumer Confidence
Structural Changes
Economic, Social and Governance (ESG)

© 1983 – 2020 John Barrickman and New Horizons Financial Group LLC. All rights reserved.
Visual 3-3
Strategic Questions
Who Are We?
What Do We Want To Be?
Where Are We Going?
How Do We Get There?
What Do We Do?
Who is Responsible?
How Do We Monitor Our Progress?
How Do We Communicate The Results?
8
© 1983 – 2020 John Barrickman and New Horizons Financial Group LLC. All rights reserved.
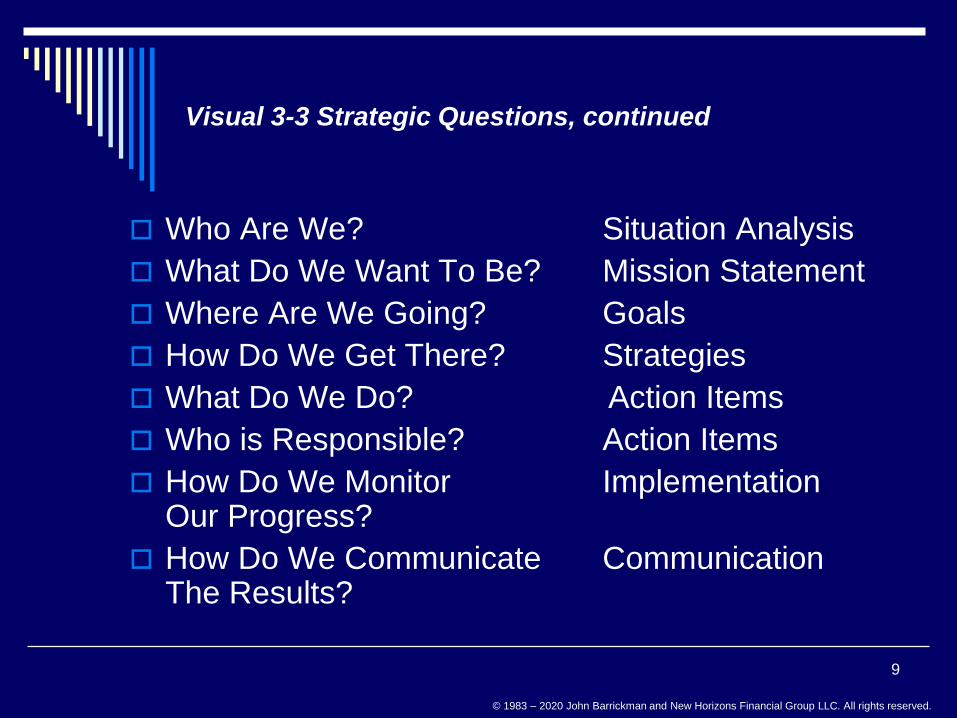
Visual 3-3 Strategic Questions, continued
Who Are We? Situation Analysis
What Do We Want To Be? Mission Statement
Where Are We Going? Goals
How Do We Get There? Strategies
What Do We Do? Action Items
Who is Responsible? Action Items
How Do We Monitor ImplementationOur Progress?
How Do We Communicate CommunicationThe Results?
9

© 1983 – 2020 John Barrickman and New Horizons Financial Group LLC. All rights reserved.
Visual 3-3 Strategic Questions, continued
Who Are We? Situation Analysis
What Do We Want To Be? Mission Statement
Where Are We Going? Goals
How Do We Get There? Strategies
What Do We Do? Action Items
Who is Responsible? Action Items
How Do We Monitor ImplementationOur Progress?
How Do We Communicate CommunicationThe Results?
10
© 1983 – 2020 John Barrickman and New Horizons Financial Group LLC. All rights reserved.
Visual 3-4
Competitive Questions
Who Is Our Customer?
Why Do They Do Business With Us?
What Makes Us Different?
11

© 1983 – 2020 John Barrickman and New Horizons Financial Group LLC. All rights reserved.
Visual 3-5
Types of Competitive Strategies
Price/volume/cost leadership
Product differentiation
Product focus or niche
12

© 1983 – 2020 John Barrickman and New Horizons Financial Group LLC. All rights reserved.
Visual 3-6
Factors Influencing
Level of Consumer Spending
Stock of liquid assets
Stock of durable goods on hand
Expectations income, prices, product
availability
Consumer indebtedness
Attitudes toward thrift
Taxation
13

© 1983 – 2020 John Barrickman and New Horizons Financial Group LLC. All rights reserved.
Visual 3-7
Factors Influencing
Level of Capital Spending
Profit expectations
Technological advance and innovation
Acquisition, maintenance, and operating
costs
Interest rates (hurdle rates)
Government policies
Stock of capital goods (current operating
rate)
Expectations of future sales and profitability
14

© 1983 – 2020 John Barrickman and New Horizons Financial Group LLC. All rights reserved.
Visual 3-8
Market Structure Summary
Pure Monopolistic
Characteristic Competition Competition Oligopoly Monopoly
Number of Very large Many Few One
competitors number
Ease of Very easy Relatively Difficult No entry
market entry easy
Product None Significant Standardized Unique
differentiation real or or product
perceived differentiated
differences
Control over None Function of Limited by Considerable
price ability to competition
differentiate
product
15

© 1983 – 2020 John Barrickman and New Horizons Financial Group LLC. All rights reserved.
Visual 3-8 Market Structure Summary, continued
Nonprice None Significant Significant Limited
competition
Example Contractors Retail Trade Auto Utilities
16

© 1983 – 2020 John Barrickman and New Horizons Financial Group LLC. All rights reserved.
Visual 3-9
Market Share Vs. Market Growth
17
Market ShareLarge
High
Low
Stars
Cash Cows Dogs
Question Marks
Mark
et
Gro
wth
Rate
Small
© 1983 – 2020 John Barrickman and New Horizons Financial Group LLC. All rights reserved.
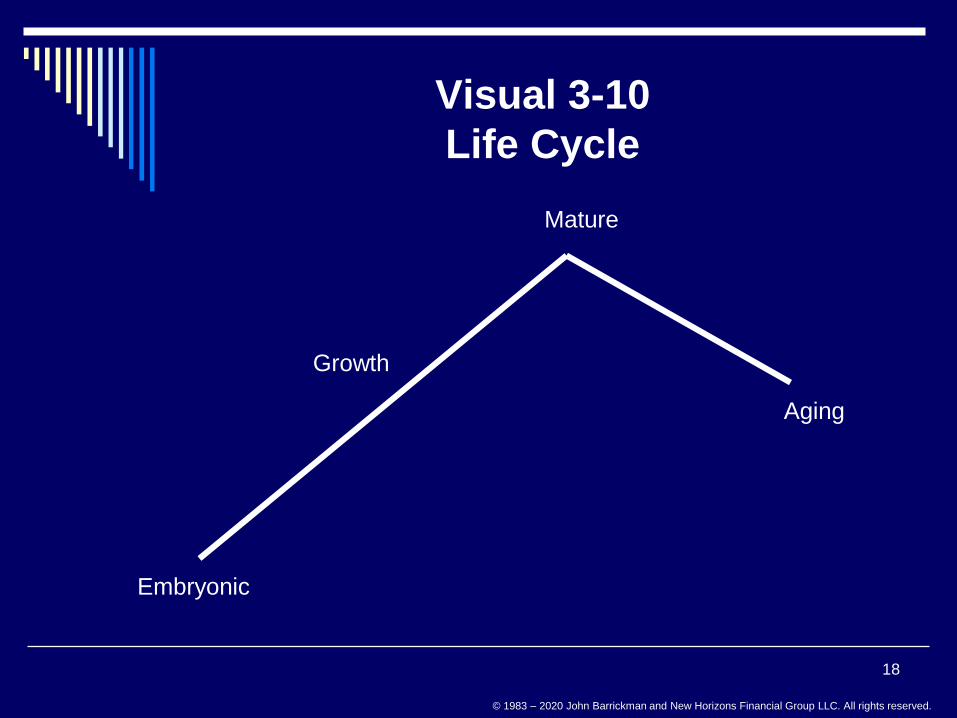
Visual 3-10
Life Cycle
18
Embryonic
Growth
Mature
Aging
© 1983 – 2020 John Barrickman and New Horizons Financial Group LLC. All rights reserved.
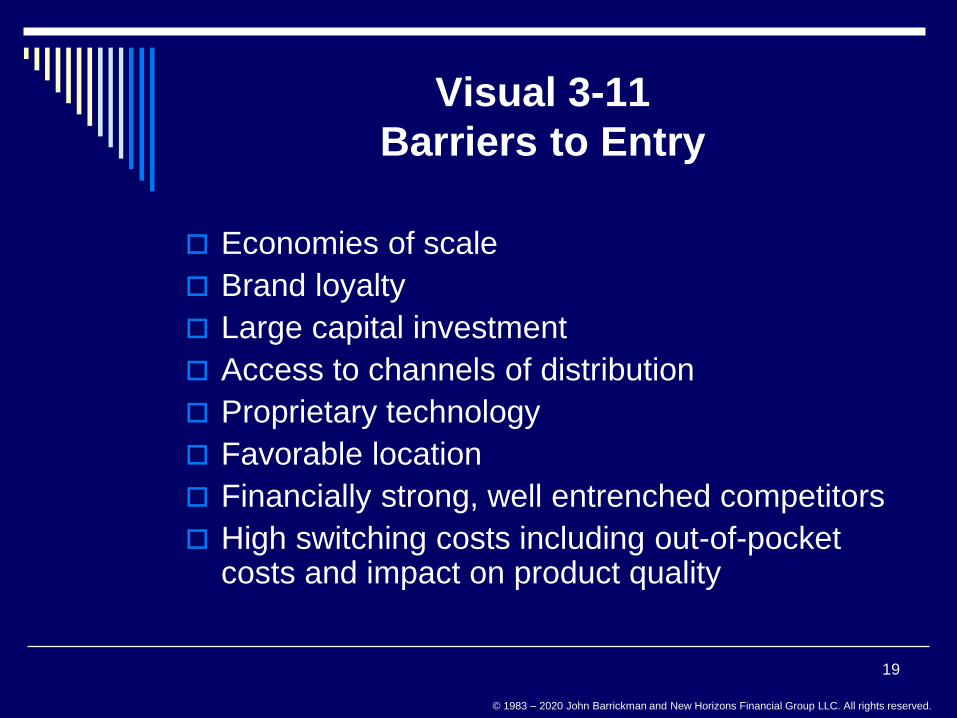
Visual 3-11
Barriers to Entry
Economies of scale
Brand loyalty
Large capital investment
Access to channels of distribution
Proprietary technology
Favorable location
Financially strong, well entrenched competitors
High switching costs including out-of-pocket costs and impact on product quality
19

© 1983 – 2020 John Barrickman and New Horizons Financial Group LLC. All rights reserved.
Visual 3-12
Profitability Measures
Return on Sales (ROS) = Profit/Sales
Return on Assets (ROA) = Profit/Assets
Return on Equity (ROE) = Profit/Equity
20

© 1983 – 2020 John Barrickman and New Horizons Financial Group LLC. All rights reserved.
Visual 3-13
Profitability Measures
Interrelationship
ROS x Asset Utilization = ROA
Profit x Sales = Profit
Sales Assets Assets
.04 x 2 = .08
ROA x Financial Leverage = ROE
Profit x Assets = Profit
Assets Equity Equity
.08 x 2.5 = .20
21
© 1983 – 2020 John Barrickman and New Horizons Financial Group LLC. All rights reserved.
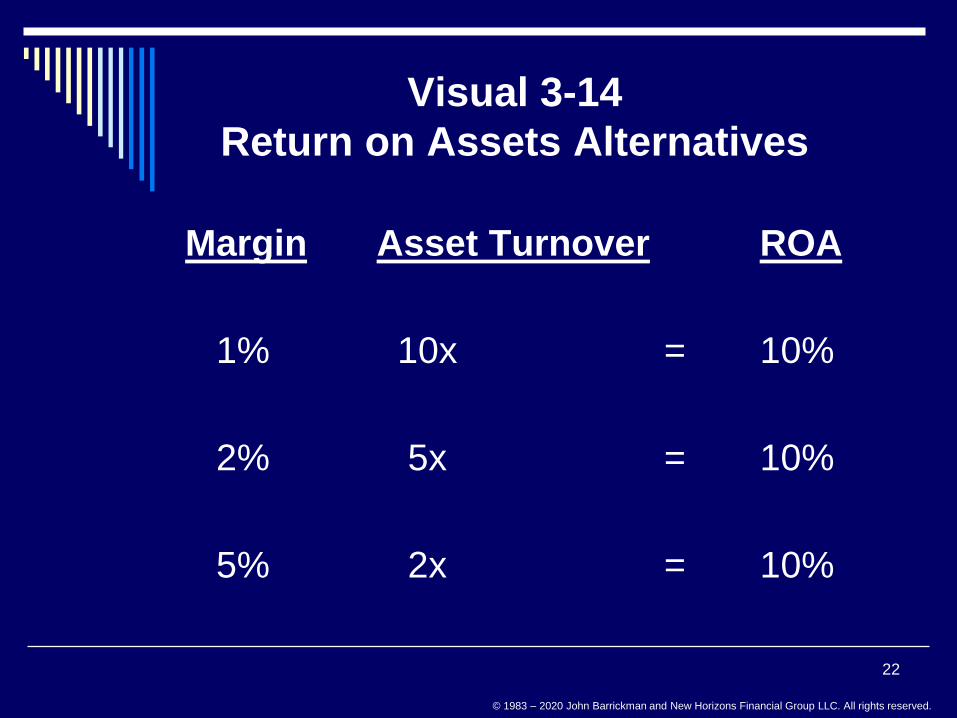
Visual 3-14
Return on Assets Alternatives
Margin Asset Turnover ROA
1% 10x = 10%
2% 5x = 10%
5% 2x = 10%
22

© 1983 – 2020 John Barrickman and New Horizons Financial Group LLC. All rights reserved.
Visual 3-15
Questions?
23