exmar half year report · pdf fileexmar half year report . activity report...
TRANSCRIPT

2017EXMAR
HALF YEAR REPORT

ACTIVITY REPORT LPG/AMMONIA/PETCHEMS
LNG
Offshore
Supporting Services
6
10
14
18
01
02
03
04
PANORAMA 2017Financial summary 3
21
37
38
TABLE OF CONTENTS
COLOPHON, GLOSSARY Colophon
Glossary
FINANCIAL REPORTCondensed consolidated interim financial statements

CONSOLIDATED KEY FIGURES
FINANCIAL SUMMARY
International Financial Reporting Standards (IFRS)
(Note 1)
Management reporting based on proportionate consolidation
(Note 2)
Restated(*) Restated(*)
30/06/2017 30/06/2016 30/06/2017 30/06/2016
CONDENSED CONSOLIDATED STATEMENT OF PROFIT OR LOSS (IN MILLION USD)Turnover 44.6 55.2 117.6 150.7
EBITDA -17.8 14.6 30 72.3
Depreciations and impairment losses -4.2 -2.3 -46.3 -22.1
Operating result (EBIT) -22.0 12.3 -16.3 50.2
Net finance result 1.3 1.1 -16.6 -16.7
Share in the result of equity accounted investees (net of income tax) -12.8 19.8 -0.5 -0.2
Result before tax -33.5 33.2 -33.4 33.3
Tax -0.6 0.5 -0.7 0.4
Consolidated result after tax -34.1 33.7 -34.1 33.7
of which group share -34.1 33.7 -34.1 33.7
INFORMATION PER SHARE (IN USD PER SHARE)Weighted average number of shares of the period 56,832,799 56,741,655 56,832,799 56,741,655
EBITDA -0.31 0.26 0.53 1.27
EBIT (operating result) -0.39 0.22 -0.29 0.88
Consolidated result after tax -0.60 0.59 -0.60 0.59
INFORMATION PER SHARE (IN EUR PER SHARE)Exchange rate 1.0789 1.1106 1.0789 1.1106
EBITDA -0.29 0.23 0.49 1.15
EBIT (operating result) -0.36 0.20 -0.27 0.80
Consolidated result after tax -0.56 0.53 -0.56 0.53
Note 1: The figures in these columns have been prepared in accordance with IFRS as adopted by the EU. Note 2: The figures in these columns show joint ventures applying the proportionate consolidation method instead of applying the equity method. The amounts in these columns correspond with the amounts in the ‘Total’ column of Note 4 Segment Reporting in the Half Year Report as per 30 June 2017. A reconciliation between the amounts applying the proportionate method and the equity method is shown in Note 5 in the Half Year Report as per 30 June 2017.
(*) IAS 23 requires that borrowing costs which are attributable to the construction of vessels are to be capitalized as part of the asset. As a consequence of the non-application of IAS 23 in prior periods, the opening balances of vessels under construction, the interest cost of the prior period as well as the equity have been restated. We refer to note 6 in the Half Year Report per 30 June 2017.
REBITDA* PER SEGMENT
June 2016
June 2016
June 2016
June 2017
June 2017
June 2017
LPG PRESSURIZED LPG MGC LPG VLGC
LNG OFFSHORE25
Mio USD
20
15
10
5
-5
*Recurring earnings before interests, taxes, depreciation and amortization. Following items are excluded from EBITDA: sale BRUGGE VENTURE (LPG: USD 0,5 million), fees Wison (LNG: USD -11 million) and the sale of the KISSAMA (offshore: USD 1.4 million). See respective segment sections for reconciliation between EBITDA an REBITDA per segment.

02
ACTIVITY REPORT
LPG/AMMONIA/PETCHEMS LNG OFFSHORE SUPPORTING SERVICES


LPG/AMMONIA/ PETCHEMSEXMAR LPG is a leading shipowner and operator in the transportation of liquefied gas products such as Liquid Petroleum Gas (butane, propane and a mixture of both), anhydrous ammonia and petrochemical gases. EXMAR trades worldwide for the fertilizer, clean energy fuel and petrochemical industry. As a prominent Midsize LPG owner-operator, EXMAR benefits from long-term contracts with first class customers.
Earnings across most segments have suffered from sustained pressure
due to an extensive amount of vessel deliveries, a lack of long-haul
arbitrage opportunities and US LPG export volumes which have
plateaued.
In spite of reaching historically high volumes, US LPG exports levelled
out at around 2.2 million metric tonnes (MT) per month mainly as a
result of the tight inventory situation which is close to a five year low.
Poor arbitrage economics from the US to Far East have led to close
to 40 cargo cancellations during the first half of the year, resulting
in a drop in overall ton mile. Though the number of large vessels
trading from the Middle East to the Far East has increased, this has
not materially compensated the overall ton mile reduction due to the
shorter round voyage time and many vessels staying put in the West.
The LPG market-setting Very Large Gas Carrier (VLGC) segment has
benefited from healthy demand in Asia and better-than-expected US
terminal capacity at the end of 2016 and early 2017 which lead to
an upturn in earnings throughout the first quarter of 2017. Strenuous
arbitrage conditions combined with another 15 new VLGC deliveries
– in addition to the 44 vessels last year – have dampened the upward
momentum and the Baltic LPG Index has dropped back to USD 25
per MT average in June, returning USD 364,000 per month on a
modern 84,000 m³ VLGC.
MARKET OVERVIEW
The operating result (EBIT) of the LPG fleet in the first half of 2017
was USD 7.4 million (as compared to USD 26.2 million for the same
period in 2016 including a badwill of USD 14.3 million recognized on
the acquisition of 50% of the pressurized fleet held by Wah Kwong
in June 2016).
100
150
200
250
2013 2014
Spread Panama/COGH40%-80%
Base Case DemandScenario
Net VLGC supply
2015 2016 2017 2018 2019 2020 year
Num
ber
of v
esse
ls
VLGC SUPPLY/DEMAND WITH PANAMA CANAL SCENARIOS
Source: Poten
30/06/2017 30/06/2016
CONSOLIDATED KEY FIGURES PROPORTIONATE CONSOLIDATION (in million USD)
Condensed consolidated statement of profit or loss
Turnover 51.3 54.6
EBITDA 19.2 35.9
REBITDA(*) 18.7 21.6
Operating result (EBIT) 7.4 26.2
Consolidated result after tax 0.9 21.9
Condensed consolidated statement of financial position
Vessels (including vessels under construction)
417.0 399.9
Financial debts 280.4 272.1
(*) REBITDA: recurring earnings before interests, taxes, depreciations and amorti zations. Following items are excluded from EBITDA: sale BRUGGE VENTURE (LPG: USD 0,5 million).
6 ACTIVITY REPORT

The continued surplus of VLGC’s, which is keeping rates under
pressure, is expected to impact rates well into 2018 with ten more
vessels expected to enter the water in 2017 and another 19 by 2020.
As forecasted in the EXMAR Annual Report for 2016, increased vessel
supply has impacted on overall earnings in the Midsize Gas Carrier (MGC) segment in the first half of 2017. 14 newbuilds have already
been delivered (including EXMAR’s 38,000m³ LPG/C KALLO and
LPG/C KRUIBEKE) this year, with a further two expected by the end
of 2017. The segment has grown by over 40% since 2015 and is
expected to increase by another 10% in the next two years.
Whilst owners of Midsize carriers have managed to maintain relatively
firmer rates compared to vessels with larger capacity, the trickle-down
effects from the weaker VLGC and Large Gas Carrier (LGC) markets
have caused further significant corrections in this segment, with short-
Source: Grieg Shipbrokers
���79%
���92%
���53%
���42%
MIDSIZE FLEET
2010 20110
20
40
60
80
100
120
140
160
0
500
1000
1500
2000
2500
3500
3000
4000
4500
2012 2013 2014 2015 2016 2017
1 year TC (US 1,000 pcm) Baltic LPG (lhs) Spot TCE (USD 1,000 pcm)
BALTIC RATE (AG-FE, USD/ML) AND VLGC EARNINGS
term and one-year contracts being concluded at half the monthly rates
experienced two years ago, i.e. around USD 450,000 per month.
The Pressurized vessel segment has solidified its recovery throughout
the second quarter of 2017 with fixtures concluded 25% higher than
last year, following a prolonged period of vessel oversupply and a
fragmented market with multiple ship owners. Additional volumes
have been generated in the Far East for this segment as traders
and Oil Majors have expanded their LPG downstream platforms,
integrating more Pressurized vessels into their portfolio. A negligible
orderbook (OB) for vessels in this class combined with firm LPG and
petrochemical trading paves the way for further improvements.
EMPLOYMENT
Source: Grieg Shipbrokers
2017
2017 2018
2018
PRESSURIZED FLEET
LPG/AMMONIA/PETCHEMS 7

EXMAR OWNED LPG FLEET
VLGC: Very Large Gas Carrier
Semi-ref: Semi-refrigerated LPG carrier
21Midsize LPG
Carrier
10Fully Pressurized
LPG Carrier
1VLGC
1Semi-ref.
Note: List includes fully-owned vessels, vessels in
joint venture (JV) and vessels chartered in as of 30 August 2017
0
5,000
Jan Feb
2013 2016 2017
Mar year
10,000
15,000
20,000
25,000
30,000
35,000
40,000
45,000
Apr May Jun Jul Aug Sep Oct Nov Dec
US
D p
er d
ay
2014 2015
0
1,000
2013
3,500 m3 5,000 m3
year
2,000
3,000
4,000
5,000
6,000
7,000
8,000
9,000
2014
US
D p
er d
ay
10,000
2015 2016 2017
8,882
7,644 8,046
6,798 6,9088,010
7,612
5,638
5,320
5,731
MIDSIZE CHARTER RATES 2013-2017 (YTD) PRESSURIZED FLEET AVERAGE EARNINGS 2013-2017 (YTD)
Source: Clarksons Source: EXMAR
8 ACTIVITY REPORT

As the VLGC segment continued its downward trend since the spring
of last year, BW TOKYO remained employed on short- and mid-term
time charter basis with the same charterers.
In the Midsize segment, the majority of the fleet remains employed on
medium- and long-term basis while some vessels became exposed
to the spot market when term contracts came to an end. Idle time
has been rather well contained as contracts were either renewed at
corrected levels or short-term employment has been found with new
or existing industrial clients in ammonia or LPG.
EXMAR has taken delivery of LPG/C KALLO and LPG/C KRUIBEKE
– 38,000 m³ from Hanjin Heavy Industries and Construction
(HHIC - Subic Bay) – in April and July respectively. Both vessels
have found short-term employment in ammonia and LPG, trading
East of Suez. In June, EXMAR ordered an MGC newbuilding contract
at Hyundai Heavy Industries with expected delivery mid-2018,
bringing the orderbook to three Midsize vessels with deliveries
between the fourth quarter of 2017 and third quarter of 2018.
For the years 2017 and 2018 employment of respectively 79% and
53% is already in place on EXMAR’s Midsize fleet.
Since EXMAR acquired Wah Kwong’s share of the ten jointly-owned
Pressurized vessels last year, rates have gradually increased and the
outlook for the smaller segment is positive. Earnings on 5,000 m³
vessels have increased by 25% and are looking to remain firm
going forward. The negligible orderbook and likelihood of scrapping
vintage tonnage will benefit all smaller sizes in the segment. EXMAR
managed to obtain cover for 92% of its Pressurized fleet in 2017
and 42% for 2018.
HIGHLIGHTS FIRST HALF 2017 AND OUTLOOK SECOND HALF 2017

LNGEXMAR LNG is owner and operator of two LNG carriers, one of which is on long–term time charter. It also owns and operates FSRUs (Floating Storage and Regasification Units) deployed at LNG import terminals to regasify LNG into gas for the local energy grid onshore. All of EXMAR’s four vessel-based FSRUs are on long-term time charter. A barge-based FSRU will be added to the fleet later this year. FLNGs (Floating Liquefaction Units) transform local reserves of Natural Gas to Liquefied Natural Gas (LNG) ready for export and shipping. The barge-based CARIBBEAN FLNG (CFLNG) was delivered to EXMAR in July of this year. Both barges are available for commercial employment.
During the first half of 2017, about 137 million tonnes of LNG was
traded, amounting to 275 million tonnes if annualized, which would
represent a growth of 5.1% over 2016 levels. Apart from the growth
in Australia (+3 million tonnes), it is the US (from 3.5 million tonnes
in 2016 to 6.4 million tonnes already for July YTD 2017) that is
producing more. Angola and Nigeria will also export additional tonnes
given their 2016 production issues.
2017 year-to-date demand has especially been buoyed by Asian
markets, namely China, India, Japan and South Korea in particular.
Also France and Turkey are ramping up imports and are already
closing in on levels reached throughout 2016. There is also the
increasing trend that additional growth in LNG volumes are off taken
MARKET OVERVIEW
Source: Cheniere Research (Gastech Tokyo presentation 2017)
LNG SUPPLY BY COUNTRY VS. TRADE OUTLOOK
The operating result (EBIT) was USD -20.4 million for the first half
2017 (compared to USD 24.7 million for the first half 2016. This figure
included a payment of USD 8 million as a termination fee by Pacific
Exploration and Production on CFLNG). The operating result has been
negatively impacted by a non-cash impairment of USD 22.5 million on
the EXCEL as well as costs related to the late delivery of the CFLNG.
2000
300
400
500
2030
QATAR OTHER
2015 to 2030CAGR(%) = 4.4
New supply(127 mtpa)
LNG tradeforecast
Supply existing and
under construction
UNITED STATES AUSTRALIA
200
100
02005 2010 2015 2020 2025
MTPA
LNG SHIPPING
30/06/2017 30/06/2016
CONSOLIDATED KEY FIGURES PROPORTIONATE CONSOLIDATION (in million USD)
Condensed consolidated statement of profit or loss
Turnover 36.1 54.8
EBITDA 11.7 33.8
REBITDA(*) 22.7 25.8
Operating result (EBIT) -20.4 24.7
Consolidated result after tax -33.2 14.5
Condensed consolidated statement of financial position
Vessels (including vessels under construction)
739.2 591.0
Financial debts 364.3 382.5
(*) REBITDA: recurring earnings before interests, taxes, depreciations and amorti zations. Following items are excluded from EBITDA : fees Wison (LNG: USD -11 million).
10 ACTIVITY REPORT

EXCEL has been employed uninterruptedly from December 2016 to
July 2017 for Indonesian account. Several employment alternatives
are being explored. EXCALIBUR has performed according to her long-
term contract to Excelerate Energy (EE). This employment contract
will last until March 2022.
HIGHLIGHTS FIRST HALF 2017 AND OUTLOOK SECOND HALF 2017
SHORT-TERM RATES (USD/DAY)
Source: Fearnleys, Clarkson
180,000
160,000
140,000
120,000
100,000
80,000
60,000
40,000
20,000
0,000
2012
.01
2012
.12
2012
.23
2012
.34
2012
.45
2013
.04
2013
.15
2013
.26
2013
.37
2013
.48
2014
.07
2014
.18
2014
.29
2014
.40
2014
.51
2015
.10
2015
.21
2015
.32
2015
.43
2016
.02
2016
.13
2016
.24
2016
35
2016
.46
2017
.50
2017
.16
2017
.27
145k Steam
Chart Area
125k Steam
160k Tri-Fuel
by a still growing number of importers or buyers, adding to the view
that LNG is becoming a globalized product as well as a substitute to
other hydrocarbons.
The LNG world fleet stood at 454 carriers (including 30 vessels of
less than 50,000m3) at the end of 2016. A total of 64 vessels were
scheduled for delivery in 2017. 24 have already been delivered so far.
The order book (OB) is at its lowest level since 2010 with only about
17 units being contracted in 2017.
Having bottomed out towards the end of 2016, the average spot
charter rate for a 160,000 m3 LNG carrier stood at USD 33,528 per
day. The malaise continued into the first half of 2017 with rates for
Steam Turbine ships and modern LNG carriers averaging USD 21,000
per day and USD 34,096 per day, respectively. With more volumes
traded and less ships idling towards the end of the first half of 2017,
freight rates improved again. This is, among other things, due to
the Australian port of Gladstone which has seen increased levels of
exports year-on-year of the three liquefaction plants situated on Curtis
Island. Combined exports from its Queensland Curtis LNG (QCLNG),
Golan LNG (GLNG) and Australia Pacific LNG (APLNG) plants reached
almost 1.7 million tonnes during July 2017 with over 60% destined
for China. More plants like these in the US (Cove Point) and Australia
(Wheatstone) are coming on stream, delivering additional tonnes
this year – also more long-haul to Europe occasionally – so freight
market conditions cannot but improve in the next quarters. This factor,
combined with demand sparked by a sudden winter spell and owners
seeking to deploy their LNG fleets only in profitable trades, will mean
freight market conditions are expected to improve in the second half
of the year.
LIST OF VESSEL COMMITMENTS
Asset Type DeliveryCapacity
(m3)
Production capacity
(cu ft. gas)Ownership 2017 2020 2025 2030 2035
LNG VESSELS
EXCALIBUR LNG/C 2002 138,000 n.a. 50%
EXCEL LNG/C 2003 138,000 n.a. 50%
UNDER CONSTRUCTION OPTION UNCOMMITTED CHARTERED
EXMAR OWNED LNG CARRIER FLEETLNG Carrier
2
LNG 11

EXMAR’s existing Floating Storage and Regasification Unit (FSRU)
fleet currently comprises of four jointly-owned units, under long-term
charter to Excelerate Energy. These units are operated and maintained
by EXMAR Shipmanagement.
FLOATING REGASIFICATION
LIST OF VESSEL COMMITMENTS
Asset Type DeliveryCapacity
(m3)
Production capacity
(cu ft. gas)Ownership 2017 2020 2025 2030 2035
FLNGs
CFLNG FLNG 2017 16,100 0,5 MTPA 100%
FSRUs
EXCELSIOR FSRU 2005 138,087 600 mm 50%
EXCELERATE FSRU 2006 138,074 600 mm 50%
EXPLORER FSRU 2008 150,981 600 mm 50%
EXPRESS FSRU 2009 150,116 600 mm 50%
FSRU BARGE FSRU Q2 2017 26,230 600 mm 100%
UNDER CONSTRUCTION OPTION UNCOMMITTED CHARTERED
MARKET OVERVIEWLNG INFRASTRUCTURE
Worldwide liquefaction capacity has reached 340 million tonnes
per annum (MTPA) in 2017. By the end of 2017 another 47 MTPA of
liquefaction capacity is expected to come online in the United States
(US), Russia, Australia and Malaysia. The US and Australia will be
the main contributors to this new liquefaction capacity.
Meanwhile worldwide LNG regasification capacity has reached 795
MTPA in 2017, and the FSRU world fleet grew to 24 FSRUs. The
majority of new capacity came online in countries that are established
LNG players such as China, Japan, France and India. New entrants
like Poland, Colombia and Abu Dhabi were additional contributors.
Given the global liquefaction supply boost and current low oil price
level, LNG prices remained low in the first six months of 2017.
These continued low LNG prices sustain the current buyer’s market
attracting increasing interest in quick-to-market and low-cost LNG
import solutions. The number of LNG import terminals will continue
to increase with LNG regasification capacity expected to grow by more
than 40% during the next five years. At least 24 projects where FSRUs
are the preferred import solutions, are planned or under development.
On the liquefaction side cost-competitive floating LNG export
infrastructure (FLNG) is becoming the LNG industry trend, as it is
easier to build than traditional onshore terminals. Various floating
LNG export projects are being developed: purpose-built, near shore
and conversions. There are four confirmed FLNG projects totalling
8.7 MTPA scheduled to come on line, further endorsing the adoption
of this innovative technology.
FSRU (barge-based)
1FLNG
(barge-based)
1FSRU
(ship-based)
4
EXMAR OWNED LNG CARRIER FLEET
The FSRU fleet has performed well in accordance with the underlying
time charter contracts and the same is expected for the remainder
of 2017.
HIGHLIGHTS FIRST HALF 2017 AND OUTLOOK SECOND HALF 2017
12 ACTIVITY REPORT

Liquefaction Regasification
EXISTING
UNDER CONSTRUCTION
UNDER CONSTRUCTION
Klaipeda Port
Kaliningrad
Toscana (OLT) Hadera, Israel
Ain Sokhna 1Jordan
Mina Al-Ahmadi
Karachi, Pakistan 1
Tianjin
West Java
LampungPecem
BahiaSergipe
Guanabara Bay
Bahia BlancaEscobar
Northeast Gateway
Gulf Gateway
Shell Prelude FLNG
Petronas PFLNG 1
Golar FLNG
Conception Bay
Montevideo
Ruwais, Abu Dhabi 1
Jebel Ali, DubaiKarachi, Pakistan (2)
Chittagong, BangladeshAin Sokhna 2
FLOATING LIQUEFACTION AND REGASIFICATION PROJECTS WORLDWIDE
The Floating LNG liquefaction unit CARIBBEAN FLNG (CFLNG) has
been delivered to EXMAR on 27 July 2017.
The CFLNG is a flexible design that is compatible with both conventional
and tailored specialized mooring infrastructure. This allows for the
deployment of the CFLNG in a wide range of operating environments.
With the CFLNG delivered, EXMAR is in a unique position to roll it out
into the market for quick deployment. With the necessary supporting
local infrastructure and related operational permits in place, the CFLNG
can be mobilized, installed and started up on site within four to six
months from contract signature.
EXMAR is in dialogue with multiple entities for the commercial
engagement of the CFLNG.
FLOATING LIQUEFACTION
EXMAR’s barge based FSRU is now effectively nearing completion
and targeted to be delivered later this year.
EXMAR’s barge-based FSRU will permit its customer to commence
importing natural gas in less than six months following contract
signature. It is suitable for both lower send outs and standalone
operation in shallow water and for higher send outs with a floating
storage unit as buffer storage. This flexibility makes the barge-based
FSRU suitable to address both small and larger scale projects. A Term
Sheet for a long-term financing has been signed with Chinese banks
and completion is expected to occur in the coming months. EXMAR is
in dialogue with various companies for the commercial engagement
of the FSRU barge but no revenues are expected for the unit before
the first half of 2018.
For the Swan Energy import terminal parties terminated their
discussions in view of the complexity of the set-up of this project.
In addition to the barge-based FSRU under construction, EXMAR
has two purpose-built LNG import infrastructure projects under
development with technical and permit-related field work being
performed and with a target for final investment decisions (FID) within
the coming year.
LNG 13
. Idealiter staan ze naast elkaar
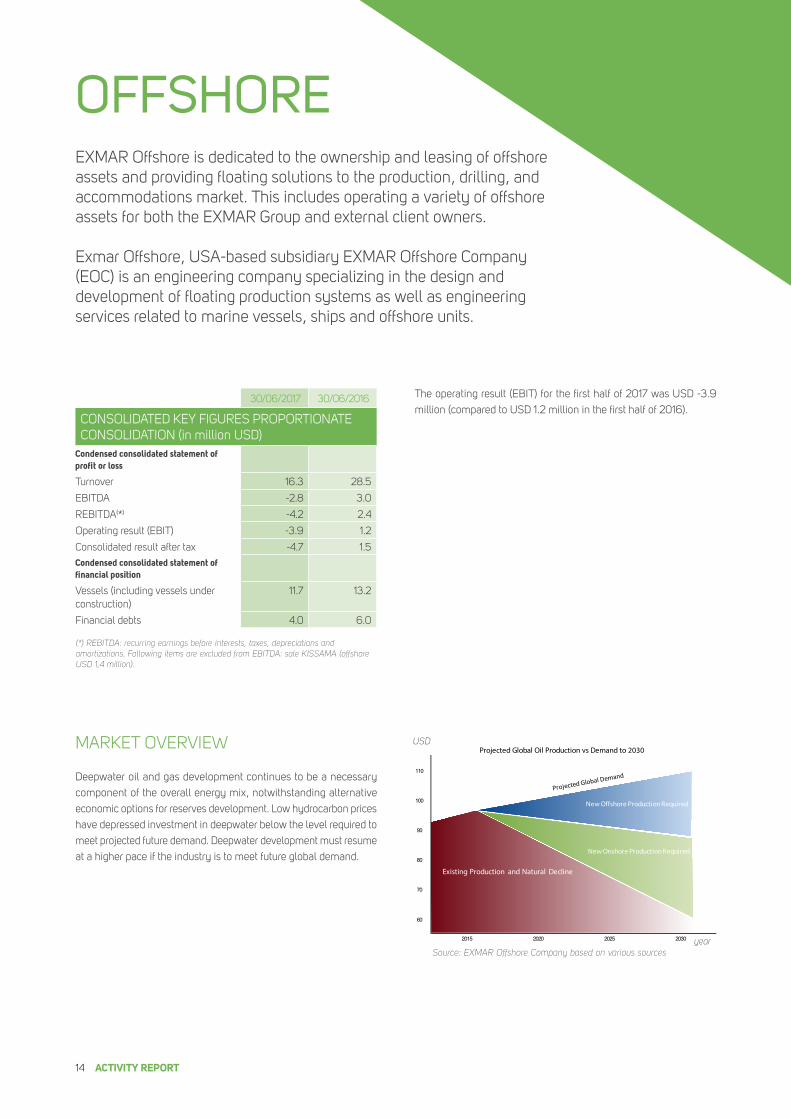
The operating result (EBIT) for the first half of 2017 was USD -3.9
million (compared to USD 1.2 million in the first half of 2016).
Deepwater oil and gas development continues to be a necessary
component of the overall energy mix, notwithstanding alternative
economic options for reserves development. Low hydrocarbon prices
have depressed investment in deepwater below the level required to
meet projected future demand. Deepwater development must resume
at a higher pace if the industry is to meet future global demand.
OFFSHOREEXMAR Offshore is dedicated to the ownership and leasing of offshore assets and providing floating solutions to the production, drilling, and accommodations market. This includes operating a variety of offshore assets for both the EXMAR Group and external client owners.
Exmar Offshore, USA-based subsidiary EXMAR Offshore Company (EOC) is an engineering company specializing in the design and development of floating production systems as well as engineering services related to marine vessels, ships and offshore units.
MARKET OVERVIEW
Current Production and Natural Decline
2030
Projected Global Oil Production vs Demand to 2030
80
70
60
2015 2020 2025
110
100
90
New Offshore Production Required
New Onshore Production Required
Existing Production and Natural Decline
Source: EXMAR Offshore Company based on various sources
USD
year
30/06/2017 30/06/2016
CONSOLIDATED KEY FIGURES PROPORTIONATE CONSOLIDATION (in million USD)
Condensed consolidated statement of profit or loss
Turnover 16.3 28.5
EBITDA -2.8 3.0
REBITDA(*) -4.2 2.4
Operating result (EBIT) -3.9 1.2
Consolidated result after tax -4.7 1.5
Condensed consolidated statement of financial position
Vessels (including vessels under construction)
11.7 13.2
Financial debts 4.0 6.0
(*) REBITDA: recurring earnings before interests, taxes, depreciations and amorti zations. Following items are excluded from EBITDA: sale KISSAMA (offshore USD 1,4 million).
14 ACTIVITY REPORT

Deepwater projects compete for Capital Expenditure (CAPEX)
investment against other opportunities, including increasingly
attractive onshore shale plays in North America. The Permian
Basin presents the lowest end of the breakeven range for shale,
but reservoir variability across all shale plays and client- and field-
specific financial structures allow the lowest cost deepwater projects
to compete within that range. EXMAR Offshore’s strategy targets that
range with a proven low cost, high value Floating Production System
(FPS) solution, maximizing deepwater competitive opportunities.
Globally, deepwater reserves remain important for development
and monetization by resource owners. Numerous offshore prospects
potentially requiring FPS development may reach Final Investment
Decision (FID) in the coming years. Brazil’s deepwater portfolio
is an excellent example with breakeven costs between USD 40
and USD 50 per barrel. Petrobras’ commitment to development is
demonstrated with its tenders of three FPSOs to be awarded this
year and a further four FPSOs for 2018. EXMAR Offshore competes
to win these projects through an OPTI® FPS or FPSO application
through experience, technical expertise, and operational skill.
By the same token, established offshore projects will remain
necessary to sustain the increase in demand of oil and gas. EXMAR
accommodation units serve the need to bring offshore workers
to perform operations and maintenance of these projects. While
maintenance campaigns have been postponed in the last two
years, oil companies cannot continue on to defer work necessary
to maintain production levels. We see a recovery of offshore projects
starting in 2018 – 2019 with the need to accommodate more offshore
workers.
Approximate wellhead breakeven oil price ranges for selected basins -2014 - 2017 Source: EXMAR Offshore based on various sources
90
80
70
60
50
40
30
20
2014 2015 2016 2017
Gulf of Mexico
Brazil
Breakeven Oil Price Ranges For Deepwater Gulf of Mexico, Offshore Brazil, and the Permian Basin
USD
year
Permian Basin
BREAKEVEN OIL PRICE RANGES FOR DEEPWATER GULF OF MEXICO, OFFSHORE BRAZIL, AND THE PERMIAN BASIN
Offshore 15

EXMAR Offshore submitted proposals for FPS projects in the first half
of 2017, including its first ever proposal for a Petrobras Engineering,
Procurement, Construction and Installation (EPCI) project, the FPSO
SEPIA. EXMAR is reported to have submitted the second lowest bid.
Based on this strong performance, EXMAR has been encouraged and
invited to bid for Petrobras’ FPSO BUZIOS V in the second half of 2017.
EXMAR Offshore continues to pursue FPS projects in the Gulf of
Mexico and elsewhere for the OPTI® semi-submersible FPS. EOC
completed pricing exercises for two prospective clients in the first
half of the year and expects to receive an OPTI® FEED (Fond End
Engineering Design) study Request For Proposal (RFP) in the second
half.
HIGHLIGHTS FIRST HALF 2017 AND OUTLOOK SECOND HALF 2017
Source: EXMAR Offshore based on various sources.
FLOATING PRODUCTION POTENTIAL FID BY 2022
SOUTHEAST ASIA 20
BRAZIL 26
AFRICA 31
OTHER 17
NORTH SEA 13
AUSTRALIA / NEW ZEALAND 12
GULF OF MEXICO 12
Both WARIBOKO and NUNCE Accommodation Work Barges remain
fully utilized under time charters while many of competing units
remained unemployed during the same period. WARIBOKO’s charter
expires at year end 2017 with charterer’s option extensions for up
to two years. The NUNCE charter ends in 2019, excluding options.
KISSAMA’s employment ended in the fourth quarter of 2016 and
was sold in April 2017.
Engineering projects at EOC continued to feel the lack of investments
in deepwater drilling and exploration. However, recent encouraging
signs of increased activity have been felt troughout the industry.
Looking to the second half of 2017, EXMAR Offshore is well positioned
to serve the oil and gas industry as adjustments continue to the new
price environment. The proven and successful OPTI® FPS remains a
strong contender for deep water applications, and EXMAR Offshore
continues to develop its FPSO business, particularly in Brazil and
Africa. EXMAR anticipates developing proposals for early design of
two FPS projects in the second half of 2017.
2Acc. barge
EXMAR OWNED OFFSHORE FLEET
Type Persons on board (POB) Year Built Status
NUNCE Accommodation Work Barge 350 POB 2009 joint venture
WARIBOKO Accommodation Work Barge 300 POB 2010 joint venture
16 ACTIVITY REPORT

BEXCO BEXCO is a Belgian-based manufacturer which designs and produces
a wide range of specialized synthetic ropes geared to serve the specific
mooring, towing and heavy lifting needs of marine, offshore and
energy providers.
While major deepwater mooring project production is anticipated in
2018-2019 rather than in 2017, BEXCO adapted to the challenging
market conditions, supplying its first offshore mooring rope for a major
wind turbine project in early 2017, winning a tender with its first major
offshore towing customer and launching its new FLEXOR heavy lift
round sling. In the marine segment, BEXCO continues to supply the
world’s largest container ships with its high modulus polyethylene
(HMPE) mooring rope and has performed well in other marine sectors
despite challenging market conditions.
Although BEXCO remained behind budget for the first half of 2017,
BEXCO still aims to close the year in line with budget, based on the
more positive outlook and the order book for the second half of 2017.
DVO
DV Offshore (DVO) is a Paris-based, independent firm of consulting
engineers specialized in all the technical aspects of marine
engineering and operations. DVO has acted as consulting engineers
to oil companies in France and abroad, port authorities, as well as to
governmental institutions or companies.
DVO has developed its activities in the marine domains such as
mooring solutions for open sea terminals, port terminals, offshore
floating storage and production, renewable energy generation as
well as underwater engineering and operations.
The first six months of 2017 have remained challenging, with only a
gradual recovery in tenders for new offshore projects. Recent onshore
work includes projects involving a Product Terminal for a Congolese
refinery and a Product Terminal for a Senegalese Refinery. The
renewables segment remains buoyant, and with deepwater projects
being awarded in both the first half and second half of 2017, the
outlook has improved for offshore projects in the second half of the
year and beyond.
Offshore 17

SUPPORTING SERVICES
EXMAR SHIP MANAGEMENT
In the first half of 2017, EXMAR Ship Management (ESM) progressed
further with the Midsize newbuild programme of the EXMAR LPG
fleet. It successfully supervised the commissioning and delivery of
the 38,000 m³ LPG carriers KALLO and KRUIBEKE to the owner in
March and July respectively.
The LNG Business Unit performed 125 ship-to-ship transfers (STS) of
just over 15.7 million cubic meters of LNG in the first seven months
of 2017, reaching almost one STS transfer operation per day in the
second quarter. With the delivery of CFLNG to EXMAR, ESM has
now taken the world’s first small scale floating liquefaction barge
into management.
The Offshore division continues to manage the accommodation work
barges NUNCE and WARIBOKO off the coast of Angola and Nigeria
respectively.
The newly-established ship management arm SEAVIE, which is
based in ESM’s offices in Mumbai, has added another two vessels
to its portfolio with a total of three bulk and general cargo vessels
under its management. The business offers the same quality levels
of technical and operational efficiency as ESM’s to ship owners not
directly involved in shipping liquid gas.
In addition to its core business activities, EXMAR Holdings has business interests in a variety of companies in the fields of insurance, specialized travel, offshore consultancy and supplies to the marine and offshore industry.
In the second quarter, ESM also commenced two start-up operations
outside its main maritime oil and gas vessel and infrastructure
management activities. In a joint venture with AHLERS, ESM
commenced integrating crew management of an externally-owned
fleet of ten chemical tankers, 15 inland gas tankers and one LNG
bunkering barge. ESM also reached an agreement with the Brazilian
fruit juice producer CITROSUCO to manage its fleet of four purpose-
built liquid bulk carriers, integrating its Belgian-based technical and
crew management staff into its offices in Antwerp.
EXMAR Ship Management expects to add another EXMAR LPG
newbuild under construction at Subic Bay in the Philippines to its
portfolio by the end of the year and is actively training ESM crew
members who are assisting in supervising the construction of EXMAR’s
barge-based FSRU at the Wison shipyard in Nantong, China.
The company is also actively seeking additional tonnage to manage
outside its maritime oil and gas infrastructure remit, further developing
the new start-up operations in Antwerp and Mumbai.
30/06/2017 30/06/2016
CONSOLIDATED KEY FIGURES PROPORTIONATE CONSOLIDATION (in million USD)
Condensed consolidated statement of profit or loss
Turnover 22.7 23.8
EBITDA 1.9 -0.4
REBITDA 1.9 -0.4
Operating result (EBIT) 0.6 -1.9
Consolidated result after tax 2.9 -0.9
Condensed consolidated statement of financial position
Vessels (including vessels under construction)
0.0 0.0
Financial debts 130.5 127.6
OF LNG TRANSFERRED SO FAR IN 2017
15,736,814 m3
18 ACTIVITY REPORT

TRAVEL PLUSTravel PLUS is a service-oriented travel agency based in Antwerp,
Belgium, and is the country’s largest independent travel agency.
The company specializes in both business and leisure travel,
differentiating itself from its competitors by fully exploring the travel
requirements and options with each individual client in order to
produce a customized and appropriate travel plan.
The company had a positive first half of 2017, experiencing an
upturn in flight bookings from its loyal customer base as well as
from new clients. Activity is split with approximately 75% in the
business travel sector and the remaining 25% in the leisure travel
sector. In the business segment, Travel PLUS has a wide portfolio of
accounts with companies based in Belgium. In the leisure segment,
the company caters for personalized vacation itineraries. Both are
expected to perform well in the second half of the year.
BELGIBOBELGIBO Insurance Group (BELGIBO NV) is an independent specialities
insurance broker and risk & claims management service provider with
outstanding expertise in Marine, Aviation, Industrial, Transport and
Credit & Political Risks. It ranks amongst the top ten insurance brokers
in Belgium, serving a diverse national and international client portfolio.
BELGIBO Industry and Cargo (BIC) division grew strongly in earnings
thanks to new and additional business in employee benefits and
logistics clients.
Despite Marine, Aviation and Special Risks (MAS) division experiencing
a marked decline in revenue, its main aviation and inland portfolios
performed to expectations.
As announced in the Press Release of 31 August 2017, BELGIBO has
been sold to Jardine Lloyd Thompson Group plc (JLT).
Services 19

20 FINANCIAL REPORT

CONDENSED CONSOLIDATED INTERIM FINANCIAL STATEMENTS FOR THE PERIOD ENDED 30 JUNE 2017CONDENSED CONSOLIDATED STATEMENT OF FINANCIAL POSITION (in thousands of USD)
Note30 June
2017 31 December
2016 Restated(*)
ASSETSNON-CURRENT ASSETS 961.797 785,773
Vessels 490,917 287,533
Vessels 6 112,489 115,471
Vessels under construction - advance payments 6 378,428 172,062(*)
Other property, plant and equipment 2,821 3,079
Intangible assets 3,213 3,651
Investments in equity accounted investees 7 160,949 147,598
Borrowings to equity accounted investees 8 303,897 343,912
CURRENT ASSETS 175,442 223,425
Available-for-sale financial assets 11 3,902 3,608
Trade receivables and other receivables 75,627 62,723
Current tax assets 589 1,107
Restricted cash 9 30,198 34,891
Cash and cash equivalents 9 65,126 121,096
TOTAL ASSETS 1,137,239 1,009,198
EQUITY AND LIABILITIESTOTAL EQUITY 409,884 441,918
Equity attributable to owners of the Company 409,693 441,703
Share capital 88,812 88,812
Share premium 209,902 209,902
Reserves 145,112 102,611(*)
Result for the period -34,133 40,378(*)
Non-controlling interest 191 215
NON-CURRENT LIABILITIES 444,558 337,269
Borrowings 10 436,688 329,590
Employee benefits 4,614 4,267
Provisions 2,440 2,434
Deferred tax liability 816 978
CURRENT LIABILITIES 282,797 230,011
Borrowings 10 24,754 140,147
Trade debts and other payables 223,403 51,244
Current tax liability 1,749 2,438
Derivative financial instruments 11 32,891 36,182
TOTAL EQUITY AND LIABILITIES 1,137,239 1,009,198
(*) IAS 23 requires that borrowing costs which are attributable to the construction of vessels are to be capitalized as part of the asset. As a consequence of the non-application of IAS 23 in prior periods, the prior period financial statements have been restated. The affected captions in the condensed consolidated statement of financial position have been marked with (*). We refer to note 6 for more information in this respect.
The notes are an integral part of these condensed consolidated interim financial statements.
Condensed consolidated interim financial statements 21

CONDENSED CONSOLIDATED STATEMENT OF PROFIT OR LOSS AND CONDENSED CONSOLIDATED STATEMENT OF OTHER COMPREHENSIVE INCOME (in thousands of USD)
Note
6 months ended30 June
2017
6 months ended30 June
2016 Restated(*)
CONDENSED CONSOLIDATED STATEMENT OF PROFIT OR LOSSRevenue 44,631 55,240
Capital gain on sale of assets 1,504 601
Other operating income 710 15,146
OPERATING INCOME 46,845 70,987
Goods and services(**) -42,277 -29,172
Personnel expenses -22,153 -26,025
Depreciations, amortisations & impairment losses -4,192 -2,248
Provisions 0 131
Other operating expenses -203 -1,379
RESULT FROM OPERATING ACTIVITIES -21,980 12,294
Interest income 12,907 11,800
Interest expenses -7,558 -5,027(*)
Other finance income 788 373
Other finance expenses -4,808 -6,046
NET FINANCE RESULT 1,329 1,100
RESULT BEFORE INCOME TAX AND SHARE OF RESULT OF EQUITY ACCOUNTED INVESTEES -20,651 13,394
Share of result of equity accounted investees (net of income tax) 7 -12,836 19,843
RESULT BEFORE INCOME TAX -33,487 33,237
Income tax expense/ income -619 482
RESULT FOR THE PERIOD -34,106 33,719
ATTRIBUTABLE TO:
Non-controlling interest 27 18
Owners of the Company -34,133 33,701
RESULT FOR THE PERIOD -34,106 33,719
BASIC EARNINGS PER SHARE (IN USD) -0.60 0.59
DILUTED EARNINGS PER SHARE (IN USD) -0.60 0.59
CONDENSED CONSOLIDATED STATEMENT OF COMPREHENSIVE INCOMERESULT FOR THE PERIOD -34,106 33,719
ITEMS THAT ARE OR MAY BE RECLASSIFIED SUBSEQUENTLY TO PROFIT OR LOSS:
Equity accounted investees - share in other comprehensive income 239 -5,019
Foreign currency translation differences 1,235 380
Net change in fair value of cash flow hedges - hedge accounting -100 672
Available-for-sale financial assets - net change in fair value 0 -144
Available-for-sale financial assets - reclassified to profit or loss 0 3,021
TOTAL OTHER COMPREHENSIVE INCOME FOR THE PERIOD (NET OF INCOME TAX) 1,374 -1,090
TOTAL COMPREHENSIVE INCOME FOR THE PERIOD -32,732 32,629
TOTAL COMPREHENSIVE INCOME ATTRIBUTABLE TO:
Non-controlling interest -24 21
Owners of the Company -32,708 32,608
TOTAL COMPREHENSIVE INCOME FOR THE PERIOD -32,732 32,629
(*) IAS 23 requires that borrowing costs which are attributable to the construction of vessels are to be capitalized as part of the asset. As a consequence of the non-application of IAS 23 in prior periods, the prior period financial statements have been restated. The affected captions in the condensed consolidated statement of profit or loss have been marked with (*). We refer to note 6 for more information in this respect.
(**) Goods and services increase compared to 30 June 2016. This increase can be mainly explained by the fees paid to Wison in respect of the CARIBBEAN FLNG.
The notes are an integral part of these condensed consolidated interim financial statements.
22 FINANCIAL REPORT

CONDENSED CONSOLIDATED STATEMENT OF CASH FLOWS (in thousands of USD)
Note
6 months ended30 June
2017
6 months ended30 June
2016 Restated(*)
OPERATING ACTIVITIESResult for the period -34,106 33,719(*)
Share of result of equity accounted investees (net of income tax) 12,836 -19,843
Depreciations, amortisations & impairment loss 4,192 2,248
Profit or loss effect available-for-sale financial assets -137 3,306
Badwill pressurized fleet transaction 0 -14,343
Net interest income/expenses -5,349 -6,773(*)
Income tax expense/ income 619 -482
Net gain on sale of assets -1,504 -601
Unrealized exchange differences 1,310 -179
Dividend income -42 -42
Equity settled share-based payment expenses (option plan) 399 782
GROSS CASH FLOW FROM OPERATING ACTIVITIES -21,782 -2,208
Increase/decrease of trade and other receivables -12,288 783
Increase/decrease of trade and other payables(**) -1,107 -5,758
Increase/decrease in provisions and employee benefits 0 -131
CASH GENERATED FROM OPERATING ACTIVITIES -35,177 -7,314
Interest paid -9,360 -6,624
Interest received 11,529 11,467
Income taxes paid/ received -1,024 66
NET CASH FROM OPERATING ACTIVITIES -34,032 -2,405
INVESTING ACTIVITIESAcquisition of vessels and vessels under construction(**) 6 -33,586 -4,763
Acquisition of other property plant and equipment -175 -156
Acquisition of intangible assets -219 -192
Proceeds from the sale of vessels and other property, plant and equipment 1,528 84
Change in consolidation scope 0 -1,884
Dividends from equity accounted investees 7 -2,558 0
Borrowings to equity accounted investees 8 0 -1,245
Repayments from equity accounted investees 8 18,730 9,213
NET CASH FROM INVESTING ACTIVITIES -16,280 1,057
FINANCING ACTIVITIESDividends paid 0 -12,942
Dividends received 42 42
Proceeds from treasury shares and share options excercised 125 139
Proceeds from new borrowings 10 0 100
Repayment of borrowings 10 -12,286 -7,528
Increase/ decrease in restricted cash 9 4,693 9,805
NET CASH FROM FINANCING ACTIVITIES -7,426 -10,384
NET INCREASE/ DECREASE IN CASH AND CASH EQUIVALENTS -57,738 -11,732
RECONCILIATION OF NET INCREASE/DECREASE IN CASH AND CASH EQUIVALENTSNet cash and cash equivalents at 1 January 121,096 129,969
Net increase/decrease in cash and cash equivalents -57,738 -11,732
Exchange rate fluctuations on cash and cash equivalents 1,768 1,013
NET CASH AND CASH EQUIVALENTS AT 30 JUNE 9 65,126 119,250
(*) IAS 23 requires that borrowing costs which are attributable to the construction of vessels are to be capitalized as part of the asset. As a consequence of the non-application of IAS 23 in prior periods, the prior period financial statements have been restated. The affected captions in the condensed consolidated statement of cash flows have been marked with (*). We refer to note 6 for more information in this respect.
(**) A payment obligation of USD 170,5 million is included in the trade payables in respect of the CFLNG. This amount has been corrected on the movements of trade and other payables and on the acquisitions of vessels and vessels under construction.
The notes are an integral part of these condensed consolidated interim financial statements.
Condensed consolidated interim financial statements 23

CONDENSED CONSOLIDATED STATEMENT OF CHANGES IN EQUITY (in thousands of USD)
Share capital
Share premium
Retained earnings(*)
Reserve for treasury shares
Translation reserve
Fair value reserve
Hedging reserve
Share-based payments reserve
Total Non-controlling interest
Total equity
CONDENSED CONSOLIDATED STATEMENT OF CHANGES IN EQUITY AS PER 30 JUNE 2016OPENING EQUITY AS PREVIOUSLY REPORTED PER 1 JANUARY 2016(*) 88,812 209,902 167,916 -54,123 -10,301 -3,973 -3,823 10,204 404,614 190 404,804
CORRECTION OF THE NON APPLICATION OF IAS 23 IN PRIOR PERIODS(*) 4,642 4,642 4,642
OPENING EQUITY RESTATED PER 1 JANUARY 2016(*) 88,812 209,902 172,558 -54,123 -10,301 -3,973 -3,823 10,204 409,256 190 409,446
COMPREHENSIVE RESULT FOR THE PERIOD
Result for the period 33,701 0 0 0 33,701 18 33,719
Total other comprehensive result for the period 0 1,579 2,877 -5,549 -1,093 3 -1,090
TOTAL COMPREHENSIVE RESULT FOR THE PERIOD 0 0 33,701 0 1,579 2,877 -5,549 0 32,608 21 32,629
TRANSACTIONS WITH OWNERS OF THE COMPANY
Dividends paid -12,942 -12,942 -12,942
Share-based payments
Share options exercised -257 464 -25 182 182
Share based payments transactions 0 0 782 782 782
TOTAL TRANSACTIONS WITH OWNERS OF THE COMPANY 0 0 -13,199 464 0 0 0 757 -11,978 0 -11,978
30 JUNE 2016 88.812 209.902 193.060 -53.659 -8.722 -1.096 -9.372 10.961 429.886 211 430.097
Share capital
Share premium
Retained earnings(*)
Reserve for treasury shares
Translation reserve
Fair value reserve
Hedging reserve
Share-based payments reserve
Total Non-controlling interest
Total equity
CONDENSED CONSOLIDATED STATEMENT OF CHANGES IN EQUITY AS PER 30 JUNE 2017OPENING EQUITY AS PREVIOUSLY REPORTED PER 1 JANUARY 2017(*) 88,812 209,902 183,435 -52,236 -9,777 0 822 11,511 432,469 215 432,684
CORRECTION OF THE NON APPLICATION OF IAS 23 IN PRIOR PERIODS(*) 9,234 9,234 9,234
OPENING EQUITY RESTATED PER 1 JANUARY 2017(*) 88,812 209,902 192,669 -52,236 -9,777 0 822 11,511 441,703 215 441,918
COMPREHENSIVE RESULT FOR THE PERIOD
Result for the period -34,133 -34,133 27 -34,106
Foreign currency translation differences 1,286 1,286 -51 1,235
Foreign currency translation differences - share equity accounted investees 558 558 558
Net change in fair value of cash flow hedges - hedge accounting -100 -100 -100
Net change in fair value of cash flow hedges - hedge accounting - share equity accounted investees -319 -319 -319
TOTAL OTHER COMPREHENSIVE RESULT FOR THE PERIOD 0 0 0 0 1,844 0 -419 0 1,425 -51 1,374
TOTAL COMPREHENSIVE RESULT FOR THE PERIOD 0 0 -34,133 0 1,844 0 -419 0 -32,708 -24 -32,732
TRANSACTIONS WITH OWNERS OF THE COMPANY
Dividends paid 0 0
Share-based payments
Share options exercised -85 449 -65 299 299
Share based payments transactions 399 399 399
TOTAL TRANSACTIONS WITH OWNERS OF THE COMPANY 0 0 -85 449 0 0 0 334 698 0 698
30 JUNE 2017 88,812 209,902 158,451 -51,787 -7,933 0 403 11,845 409,693 191 409,884
(*) IAS 23 requires that borrowing costs which are attributable to the construction of vessels are to be capitalized as part of the asset. As a consequence of the non-application of IAS 23 in prior periods, the prior period financial statements have been restated. We refer to note 6 for more information in this respect.
The notes are an integral part of these condensed consolidated interim financial statements.
24 FINANCIAL REPORT

Share capital
Share premium
Retained earnings(*)
Reserve for treasury shares
Translation reserve
Fair value reserve
Hedging reserve
Share-based payments reserve
Total Non-controlling interest
Total equity
CONDENSED CONSOLIDATED STATEMENT OF CHANGES IN EQUITY AS PER 30 JUNE 2016OPENING EQUITY AS PREVIOUSLY REPORTED PER 1 JANUARY 2016(*) 88,812 209,902 167,916 -54,123 -10,301 -3,973 -3,823 10,204 404,614 190 404,804
CORRECTION OF THE NON APPLICATION OF IAS 23 IN PRIOR PERIODS(*) 4,642 4,642 4,642
OPENING EQUITY RESTATED PER 1 JANUARY 2016(*) 88,812 209,902 172,558 -54,123 -10,301 -3,973 -3,823 10,204 409,256 190 409,446
COMPREHENSIVE RESULT FOR THE PERIOD
Result for the period 33,701 0 0 0 33,701 18 33,719
Total other comprehensive result for the period 0 1,579 2,877 -5,549 -1,093 3 -1,090
TOTAL COMPREHENSIVE RESULT FOR THE PERIOD 0 0 33,701 0 1,579 2,877 -5,549 0 32,608 21 32,629
TRANSACTIONS WITH OWNERS OF THE COMPANY
Dividends paid -12,942 -12,942 -12,942
Share-based payments
Share options exercised -257 464 -25 182 182
Share based payments transactions 0 0 782 782 782
TOTAL TRANSACTIONS WITH OWNERS OF THE COMPANY 0 0 -13,199 464 0 0 0 757 -11,978 0 -11,978
30 JUNE 2016 88.812 209.902 193.060 -53.659 -8.722 -1.096 -9.372 10.961 429.886 211 430.097
Share capital
Share premium
Retained earnings(*)
Reserve for treasury shares
Translation reserve
Fair value reserve
Hedging reserve
Share-based payments reserve
Total Non-controlling interest
Total equity
CONDENSED CONSOLIDATED STATEMENT OF CHANGES IN EQUITY AS PER 30 JUNE 2017OPENING EQUITY AS PREVIOUSLY REPORTED PER 1 JANUARY 2017(*) 88,812 209,902 183,435 -52,236 -9,777 0 822 11,511 432,469 215 432,684
CORRECTION OF THE NON APPLICATION OF IAS 23 IN PRIOR PERIODS(*) 9,234 9,234 9,234
OPENING EQUITY RESTATED PER 1 JANUARY 2017(*) 88,812 209,902 192,669 -52,236 -9,777 0 822 11,511 441,703 215 441,918
COMPREHENSIVE RESULT FOR THE PERIOD
Result for the period -34,133 -34,133 27 -34,106
Foreign currency translation differences 1,286 1,286 -51 1,235
Foreign currency translation differences - share equity accounted investees 558 558 558
Net change in fair value of cash flow hedges - hedge accounting -100 -100 -100
Net change in fair value of cash flow hedges - hedge accounting - share equity accounted investees -319 -319 -319
TOTAL OTHER COMPREHENSIVE RESULT FOR THE PERIOD 0 0 0 0 1,844 0 -419 0 1,425 -51 1,374
TOTAL COMPREHENSIVE RESULT FOR THE PERIOD 0 0 -34,133 0 1,844 0 -419 0 -32,708 -24 -32,732
TRANSACTIONS WITH OWNERS OF THE COMPANY
Dividends paid 0 0
Share-based payments
Share options exercised -85 449 -65 299 299
Share based payments transactions 399 399 399
TOTAL TRANSACTIONS WITH OWNERS OF THE COMPANY 0 0 -85 449 0 0 0 334 698 0 698
30 JUNE 2017 88,812 209,902 158,451 -51,787 -7,933 0 403 11,845 409,693 191 409,884
(*) IAS 23 requires that borrowing costs which are attributable to the construction of vessels are to be capitalized as part of the asset. As a consequence of the non-application of IAS 23 in prior periods, the prior period financial statements have been restated. We refer to note 6 for more information in this respect.
The notes are an integral part of these condensed consolidated interim financial statements.
Condensed consolidated interim financial statements 25

NOTES TO THE CONDENSED CONSOLIDATED INTERIM FINANCIAL STATEMENTS
1. REPORTING ENTITY
EXMAR NV is a company domiciled in Belgium, whose shares are publicly traded (Euronext -EXM). The condensed consolidated interim financial
statements of EXMAR NV for the six months ended 30 June 2017 comprise EXMAR NV and its subsidiaries (together referred to as the “Group”)
and the Group’s interests in associates and joint arrangements. The Group is active in the industrial shipping business.
2. BASIS OF PREPARATION
These condensed consolidated interim financial statements have been prepared in accordance with International Financial Reporting Standard
(IFRS) IAS 34 “Interim Financial Reporting” as adopted by the EU. They do not include all of the information required for full annual financial
statements, and should be read in conjunction with the consolidated financial statements of the Group as at 31 December 2016, available on the
website: www.EXMAR.be.
These condensed consolidated interim financial statements were approved by the board of directors on 8 September 2017. The condensed
consolidated interim financial information as of and for the 6-month period ended 30 June 2017 included in this document, have not been subject
to an audit or a review by our statutory auditor.
The preparation of these condensed consolidated interim financial statements requires management to make judgements, estimates and
assumptions that affect the application of accounting policies and the reported amounts of assets and liabilities, income and expense. Actual
results may differ from these estimates. The significant judgements made by management in applying the Group’s accounting policies were the
same as those applied to the consolidated financial statements as per 31 December 2016.
IAS 23 requires that borrowing costs which are attributable to the construction of vessels are to be capitalized as part of the asset. As a consequence
of the non-application of IAS 23 in prior periods, the opening balances of vessels under construction, the interest cost of the prior period as well
as the equity have been restated. We refer to note 6 for more information in this respect
3. SIGNIFICANT ACCOUNTING POLICIES
The accounting policies applied in these condensed consolidated interim financial statements are the same as those applied in the Group’s
consolidated financial statements as at and for the year ended 31 December 2016.
The first time application of new or revised IFRS standards, which are effective for annual periods beginning on or after 1 January 2017 have no
impact on the condensed consolidated interim financial statements.
26 FINANCIAL REPORT

4. SEGMENT REPORTING (in thousands of USD)
The company continues to manage its operations based on internal management reports applying the principles of the proportionate consolidation
method. The reconciliation of the segment reporting to the condensed consolidated statement of profit or loss is presented in note 5. All differences
relate to the application of IFRS 11 Joint Arrangements, no other differences exist.
No segment reporting has been presented related to assets and liabilities as no significant changes occured compared to the segment
reporting of 2016.
SEGMENT REPORTING 30 JUNE 2017
LPG LNG Offshore Supporting Services
Eliminations Total
CONDENSED CONSOLIDATED STATEMENT OF PROFIT OR LOSSRevenue third party 50,569 36,118 15,833 14,620 0 117,140
Revenue intra-segment 742 0 474 7,552 -8,768 0
Total revenue 51,311 36,118 16,307 22,172 -8,768 117,140
Revenue on property rental third party 0 0 0 477 0 477
Revenue on property rental intra-segment 0 0 0 73 -73 0
Total revenue on property rental 0 0 0 550 -73 477
Capital gain on sale of assets 543 0 1,425 80 0 2,048
Other operating income 207 0 153 340 0 700
Other operating income intra-segment 0 0 0 171 -171 0
Total other operating income 207 0 153 511 -171 700
OPERATING INCOME 52,061 36,118 17,885 23,313 -9,012 120,365
OPERATING RESULT BEFORE DEPRECIATIONS, AMORTISATIONS & IMPAIRMENT LOSSES (EBITDA)
19,195 11,710 -2,853 1,913 0 29,965
Depreciations, amortisations and impairment losses(*) -11,838 -32,150 -1,021 -1,258 0 -46,267
OPERATING RESULT (EBIT) 7,357 -20,440 -3,874 655 0 -16,302
Interest income/expenses (net) -5,956 -10,993 -77 5,059 0 -11,967
Other finance income/expenses (net) -495 -1,717 -268 -2,130 0 -4,610
Share in the result of equity accounted investees 0 0 -524 29 0 -495
Income tax expense -7 0 0 -725 0 -732
SEGMENT RESULT FOR THE PERIOD 900 -33,150 -4,743 2,888 0 -34,106
RESULT FOR THE PERIOD -34,106
Non-controlling interest 26
ATTRIBUTABLE TO OWNERS OF THE COMPANY -34,132
(*) In the LNG segment, an impairment loss of USD 22,5 million has been registered on the vessel EXCEL to reflect the market value of the vessel.
Condensed consolidated interim financial statements 27

SEGMENT REPORTING 30 JUNE 2016 - RESTATED(*)
LPG LNG Offshore Supporting Services
Eliminations Total
CONDENSED CONSOLIDATED STATEMENT OF PROFIT OR LOSS Revenue third party 52,912 54,282 27,708 15,277 0 150,179
Revenue intra-segment 1,634 473 833 7,951 -10,891 0
Total revenue 54,546 54,755 28,541 23,228 -10,891 150,179
Revenue on property rental third party 0 0 0 473 0 473
Revenue on property rental intra-segment 0 0 0 73 -73 0
Total revenue on property rental 0 0 0 546 -73 473
Capital gain on sale of assets 0 0 565 36 0 601
Other operating income 14,463 0 228 747 0 15,438
Other operating income intra-segment 0 0 0 192 -192 0
Total other operating income 14,463 0 228 939 -192 15,438
OPERATING INCOME 69,009 54,755 29,334 24,749 -11,156 166,691
OPERATING RESULT BEFORE DEPRECIATIONS, AMORTISATIONS & IMPAIRMENT LOSSES (EBITDA)
35,948 33,825 3,001 -385 0 72,389
Depreciations, amortisations and impairment losses -9,714 -9,113 -1,774 -1,539 0 -22,140
OPERATING RESULT (EBIT) 26,234 24,712 1,227 -1,924 0 50,249
Interest income/expenses (net)(*) -4,087 -9,899 -503 3,962 0 -10,527
Other finance income/expenses (net) -230 -319 -54 -2,320 0 -2,923
Share in the result of equity accounted investees 0 0 86 -264 0 -178
Income tax expense/income -7 0 756 -346 0 403
SEGMENT RESULT FOR THE PERIOD 21,910 14,494 1,512 -891 0 37,025
Unallocated finance result -3,306
RESULT FOR THE PERIOD 33,719
Non-controlling interest 18
ATTRIBUTABLE TO OWNERS OF THE COMPANY 33,701
(*) IAS 23 requires that borrowing costs which are attributable to the construction of vessels are to be capitalized as part of the asset. As a consequence of the non-application of IAS 23 in prior periods, the prior period financial statements have been restated. The affected captions in the condensed consolidated statement of profit or loss have been marked with (*). We refer to note 6 for more information in this respect.
28 FINANCIAL REPORT

5. RECONCILIATION PROPORTIONATE CONSOLIDATION WITH EQUITY CONSOLIDATION (in thousands of USD)
The financial information of each operating segment is reviewed by management using the proportionate consolidation method. The below tables
reconcile the 30 June financial information as reported in the condensed consolidated statement of profit or loss (using the equity consolidation
method as required under IFRS 11) and as disclosed in note 4 ‘Segment reporting’ (using the proportionate consolidation method).
Proportionate consolidation Difference Equity consolidation
RECONCILIATION CONDENSED CONSOLIDATED STATEMENT OF PROFIT OR LOSS AND PROPORTIONATE CONSOLIDATION (SEGMENT REPORTING)
FOR THE SIX MONTHS ENDED 30 JUNE 2017
Revenue 117,617 -72,986 44,631
Capital gain on sale of assets 2,048 -544 1,504
Other operating income 700 10 710
Goods and services -67,572 25,295 -42,277
Personnel expenses -22,178 25 -22,153
Depreciations, amortisations & impairment losses -46,267 42,075 -4,192
Other operating expenses -650 447 -203
RESULT FROM OPERATING ACTIVITIES -16,302 -5,678 -21,980
Interest income 1,353 11,554 12,907
Interest expenses -13,320 5,762 -7,558
Other finance income 817 -29 788
Other finance expenses -5,427 619 -4,808
RESULT BEFORE INCOME TAX AND SHARE OF RESULT OF EQUITY ACCOUNTED INVESTEES
-32,879 12,228 -20,651
Share of result of equity accounted investees (net of income tax) -495 -12,341 -12,836
Income tax expense -732 113 -619
RESULT FOR THE PERIOD -34,106 0 -34,106
RECONCILIATION CONDENSED CONSOLIDATED STATEMENT OF PROFIT OR LOSS AND PROPORTIONATE CONSOLIDATION (SEGMENT REPORTING)
FOR THE SIX MONTHS ENDED 30 JUNE 2016 - RESTATED(*)
Revenue 150,652 -95,412 55,240
Capital gain on sale of assets 601 0 601
Other operating income 15,438 -292 15,146
Goods and services -66,575 37,403 -29,172
Personnel expenses -26,006 -19 -26,025
Depreciations, amortisations & impairment losses -22,140 19,892 -2,248
Provisions 131 0 131
Capital loss on disposal of assets 0 0 0
Other operating expenses -1,852 473 -1,379
RESULT FROM OPERATING ACTIVITIES 50,249 -37,955 12,294
Interest income 393 11,407 11,800
Interest expenses(*) -10,920 5,893 -5,027
Other finance income 507 -134 373
Other finance expenses -6,735 689 -6,046
RESULT BEFORE INCOME TAX AND SHARE OF RESULT OF EQUITY ACCOUNTED INVESTEES
33,494 -20,100 13,394
Share of result of equity accounted investees (net of income tax) -178 20,021 19,843
Income tax expense 403 79 482
RESULT FOR THE PERIOD 33,719 0 33,719
(*) IAS 23 requires that borrowing costs which are attributable to the construction of vessels are to be capitalized as part of the asset. As a consequence of the non-application of IAS 23 in prior periods, the prior period financial statements have been restated. The affected captions in the condensed consolidated statement of profit or loss have been marked with (*). We refer to note 6 for more information in this respect.
Condensed consolidated interim financial statements 29

6. VESSELS (in thousands of USD)
LPG LNG OffshoreUnder construction - advance payments(*) Total
COST 2017BALANCE AS PER 1 JANUARY 2017 118,500 0 40,459 172,062(**) 331,021
Changes during the financial year
Acquisitions 0 204,095 204,095
Borrowing costs 0 2,271 2,271
Disposals(***) -40,459 0 -40,459
Conversion differences 0 0 0
BALANCE AS PER 30 JUNE 2017 118,500 0 0 378,428 496,928
DEPRECIATIONS AND IMPAIRMENT LOSSES 2017BALANCE AS PER 1 JANUARY 2017 3,029 0 40,459 0 43,488
Changes during the financial year
Depreciations 2,982 0 2,982
Disposals(***) 0 -40,459 -40,459
Conversion differences 0 0 0
BALANCE AS PER 30 JUNE 2017 6,011 0 0 0 6,011
NET BOOK VALUENET BOOK VALUE AS PER 30 JUNE 2017 112,489 0 0 378,428 490,917
(*) The advance payments in respect of vessels under construction have been presented under vessels in the statement of financial position. The advance payments made do not give EXMAR ownership rights on the vessels before their final delivery.
(**) IAS 23 requires that borrowing costs which are attributable to the construction of vessels are to be capitalized as part of the asset. As a consequence of the non-application of IAS 23 in prior periods, the opening balances of vessels under construction, the interest cost of the prior period as well as the equity have been restated. The table below summarizes the impact on the Group’s condensed consolidated interim financial statements.
As previously reported
Adjustments As restated
IMPACT ON CONDENSED CONSOLIDATED STATEMENT OF FINANCIAL POSITION 31 DECEMBER 2016
Vessels 278,299 9,234 287,533
Other non-current assets 498,240 0 498,240
TOTAL ASSETS 776,5 9,234 785,773
TOTAL LIABILITIES -567,280 0 -567,280
Retained earnings -133,755 -9,234 -142,989
Others -298,929 0 -298,929
TOTAL EQUITY -432,684 -9,234 -441,918
IMPACT ON THE CONDENSED CONSOLIDATED STATEMENT OF PROFIT OR LOSSFOR THE PERIOD ENDED 30 JUNE 2016
Interest expenses -7,310 2,283 -5,027
Others 38,746 0 38,746
RESULT FOR THE PERIOD 31,436 2,283 33,719
FOR THE PERIOD ENDED 31 DECEMBER 2016
Interest expenses -15,907 4,592 -11,315
Others 51,725 0 51,725
RESULT FOR THE PERIOD 35,818 4,592 40,410
(***)The vessel KISSAMA has been sold during April 2017. The gain realized on this sale amounts to USD 1,4 million.
The vessels under construction mainly relate to payments made for the construction of the CARIBBEAN FLNG and the FSRU. The CARIBBEAN FLNG
has been delivered on 27 July 2017. We refer also to note 12 in respect of the CARIBBEAN FLNG and the FSRU.The vessels shown in above
roll forward shedule table under “LPG” are pledged as a security for the related underlying liabilities. We refer to note 10 for more information in
respect of these underlying liabilities.
30 FINANCIAL REPORT

7. INVESTMENTS IN EQUITY ACCOUNTED INVESTEES (in thousands of USD)
EQUITY ACCOUNTED INVESTEESBALANCE AS PER 1 JANUARY 2017 147,598
Changes during the financial year
Share in the profit/loss(-) -12,836
Dividends 2,558
Allocation of negative net assets(*) 23,744
Conversion differences 558
Changes in other comprehensive income equity accounted investees -319
Other -354
BALANCE AS PER 30 JUNE 2017 160,949
(*) The equity accounted investees for whom the share in the net assets is negative, are allocated to other components of the investor’s interest in the equity accounted investee. If the negative net asset exceeds the investor’s interest, a corresponding liability is recognized.
EXMAR has analysed the existing joint arrangements and has concluded that these joint arrangements are all joint ventures in accordance with
IFRS 11 “joint arrangements”.
EXMAR has provided guarantees to financial institutions that have provided credit facilities to her equity accounted investees. As of June 30, 2017,
an amount of USD 615,8 million was outstanding under such loan agreements, of which EXMAR has guaranteed its share of USD 307,9 million.
8. BORROWINGS TO EQUITY ACCOUNTED INVESTEES (in thousands of USD)
LPG LNG Offshore Total
BORROWINGS TO EQUITY ACCOUNTED INVESTEESBALANCE AT 1 JANUARY 2017 56,119 298,452 16,934 371,505
New loans and borrowings 0 0 0 0
Repayments -6,822 -7,641 -4,267 -18,730
Change in allocated negative net assets(*) 2,753 -26,364 -133 -23,744
Capitalised interests 433 65 0 498
BALANCE AT 30 JUNE 2017 52,483 264,512 12,534 329,529
MORE THAN 1 YEAR 52,483 240,995 10,419 303,897
LESS THAN 1 YEAR 0 23,517 2,115 25,632
(*) The equity accounted investees for whom the share in the net assets is negative, are allocated to other components of the investor’s interest in the equity accounted investee. If the negative net asset exceeds the investor’s interest, a corresponding liability is recognized.
The activities and assets of certain of our equity accounted investers are financed by shareholder borrowings made by the company to
the respective joint ventures. The current portion of such borrowings and the working capital facilities are presented as other receivables.
The main borrowings to equity accounted investees relate to the borrowings granted to the LPG joint venture with Teekay LNG Partners L.P.,
the LNG joint venture with MOL and the LNG joint ventures with Excelerate Energy L.P.
Condensed consolidated interim financial statements 31

10. BORROWINGS (in thousands of USD)
Bank loans Other loans Total
BORROWINGS BALANCE AT 1 JANUARY 2017 354,287 115,450 469,737
New loans and borrowings 0 0 0
Scheduled repayments -12,286 0 -12,286
Amortised transaction costs 0 542 542
Conversion differences 58 3,391 3,449
BALANCE AT 30 JUNE 2017 342,059 119,383 461,442
MORE THAN 1 YEAR 317,305 119,383 436,688
LESS THAN 1 YEAR 24,754 0 24,754
LPG 63,947 0 63,947
LNG 277,801 0 277,801
Offshore 0 0 0
Services 311 119,383 119,694
BALANCE AT 30 JUNE 2017 342,059 119,383 461,442
The bank loans mainly relate to the Excelerate facility, the Explorer/ Express facility and the LPG pressurized facilities.
The other loans mainly relate to a NOK 700 million senior unsecured bond issue which was issued in 2014. During 2015, an additional amount
of NOK 300 million has been issued (second tranche on the original NOK 700 million bond). The total nominal amount outstanding amounts to
NOK 1 billion with initial maturity date in July 2017. In June 2017, the term of the loan has been extended until July 2019. As a consequence,
the bond has been classified as a long term liability in the condensed consolidated statement of financial position.
Each bond holder had the possibility to exchange NOK bonds to USD bonds. The interest percentage applicable on the remaining NOK bonds
amounts to three months NIBOR plus a margin of 8%. The exchanged USD bonds bear an interest percentage of three months LIBOR plus a
margin of 8,5%. EXMAR has received instructions for exchanges totaling NOK 145 million which represents a USD amount of USD 17.292.366.
EXMAR has a call option on the bond at anytime. The call option price and redemption price at maturity amounts to 105%. However, this price
will increase gradually up to 112,5% at maturity should certain financial criteria not materialise. EXMAR has analysed the new conditions of the
bond and has judged that per end of June 2017, the bond can remain in the condensed consolidated interim financial statements at initial value.
The different assumptions which have led to this scenario will be monitored by management on a periodical basis.
For the CCIRS-contracts related to the initial bond issue in 2014 and 2015, we refer to note 11.
End of June 2017, EXMAR has signed a financing agreement of USD 200 million with the Bank of China (Boc), Deutsche Bank and Sinosure
for the financing of the CARIBBEAN FLNG. This loan has been drawn on 27 July 2017 at the time of the delivery of the CARIBBEAN FLNG.
9. RESTRICTED CASH AND CASH EQUIVALENTS (in thousands of USD)
30 June 2017 31 December 2016
RESTRICTED CASH AND CASH EQUIVALENTSRESTRICTED CASH 30,198 34,891
Bank 64,465 105,385
Cash in hand 201 168
Short-term deposits 460 15,543
CASH AND CASH EQUIVALENTS 65,126 121,096
The restricted cash relates to the Explorer/ Express credit facility (see also note 10) and to financial instrument agreements regarding the NOK
bond (see also note 10 and 11).
32 FINANCIAL REPORT

11. FINANCIAL INSTRUMENTS (in thousands of USD)
Financial instruments include a broad range of financial assets and liabilities. They include both primary financial instruments such as cash,
receivables, debt and shares in another entity and derivative financial instruments. They are measured either at fair value or at amortized cost.
Fair value is the amount for which an asset could be exchanged, or a liability settled between knowledgeable, willing parties in an at arm’s length
transaction. All derivative financial instruments are recognized at fair value in the condensed consolidated statement of financial position.
The fair values of financial assets and liabilities measured at fair value are presented by class in the table below. The Group aggregates its financial
instruments into classes based on their nature and characteristics.
Level 1 Level 2 Level 3 Total
30 JUNE 2017
Equity securities - available-for-sale 2,288 1,614 3,902
TOTAL FINANCIAL ASSETS CARRIED AT FAIR VALUE 2,288 1,614 0 3,902
Cross currency interest rate swap used for hedging 32,891 32,891
TOTAL FINANCIAL LIABILITIES CARRIED AT FAIR VALUE 0 32,891 0 32,891
In 2014, a cross currency interest rate swap (“CCIRS”) was entered into in order to hedge the currency and floating interest exposure on the issued
NOK 700 million senior unsecured bonds. In July 2015, a new CCIRS was closed on the additional amount of NOK 300 million that has been
issued in 2015. The CCIRS-contracts have been presented as short term liabilities in the condensed consolidated statement of financial position
as the contracts have not been extended as a consequence of the extension of the term of the bond (see also note 10 in this respect).
Financial instruments other than those listed above are all measured at amortized cost.
For its financial instruments, the Group has applied the same accounting classification and basis for determining fair values in its condensed
consolidated interim financial statements as those applied in the consolidated financial statements as at and for the year ended December 31,
2016. Therefore, we refer to the Annual Report 2016, disclosure note 28 ‘Financial risks and financial instruments’.
The fair value of financial assets and liabilities not measured at fair value has not been updated per June 30, 2017 as no significant changes
occurred that would impact the fair value determination. Therefore, we refer to the Annual Report 2016, disclosure note 28 ‘Financial risks and
financial instruments’.
In respect of liquidity risk, we refer to note 12 Capital commitments.
Condensed consolidated interim financial statements 33

SubsidiariesEquity
accounted investees
LPG-segment 0 71.065
LNG-segment 254.100 0
254.100 71.065
The amount disclosed for the equity accounted investees represents our share in the capital commitments of these equity accounted investees.
The capital commitments relate to the midsize carriers under construction (LPG segment) as well as to the committed investments in the LNG
segment. The payments of these commitments will be spread over the coming one and a half year.
For the capital commitments relating to the LPG segment, the necessary financing agreements are in place, except for the last ordered LPG vessel
under construction (USD 37,5 million) which is expected to be delivered mid 2018.
The capital commitments for the LNG segment relate to the CARIBBEAN FLNG (CFLNG) (USD 170,5 million) and the FSRU (USD 83,6 million).
The capital commitment in respect of the CFLNG has already been recognised in the statement of financial position per 30 June 2017.
The CFLNG has been delivered on the 27th of July 2017 at which the last installment of USD 170,5 million has been paid. For the financing in
respect of the CFLNG, we refer to note 10. The CFLNG is currently in lay up at Wison shipyard (Nantong, People’s Republic of China). EXMAR is
in dialogue with multiple entities for the commercial engagement of the CFLNG. EXMAR does not expect revenue on the unit before the second
half of 2018.
EXMAR’s barge based FSRU is now effectively nearing completion and targeted to be delivered later this year. Discussions are still ongoing with
various companies for the commercial engagement of the FSRU barge but no revenues are expected for the unit before the first half of 2018.
A term sheet in respect of the financing of the FSRU has been signed with the Chinese Development Bank (CDB). The final credit agreement is
subject to the approval of the credit insurer Sinosure.
12. CAPITAL COMMITMENTS (in thousands of USD)
As per June 30, 2017, the capital commitments are as follows:
13. GOING CONCERN
The condensed consolidated interim financial statements have been prepared on a going concern basis. In making this assessment, the Board of
Directors has considered the following material uncertainty that may cast doubt on the Group’s ability to continue as a going concern:
* Capital commitment for the FSRU of USD 83,6 million, payable to the yard at delivery and a firm commitment from the banks for the financing
of the FSRU, as disclosed in Note 12.
The Board of Directors is confident that it will be able to successfully manage this uncertainty and therefore has prepared these condensed
consolidated interim financial statements on a going concern basis.
14. CONTINGENCIES AND GUARANTEES
There were no significant changes in contingencies as disclosed in the consolidated financial statements of the Group for the year ended
31 December 2016.
A vessel held by one of our joint ventures was party to a lease arrangement whereby the lessor could claim tax depreciation on the capital
expenditures it incurred to acquire these vessels. As is typical in these leasing arrangements, tax and change of law risks are assumed by the lessee.
Our joint venture terminated this lease arrangement in 2013. However, in case of a successful challenge by the UK tax authority (“HMRC”) of the tax
treatment of the lease by the UK lessor, we can be required to compensate the lessor for any tax amounts to be paid. At this point in time, the
Board of Directors is not able to calculate the possible outflow as a consequence of this matter.
34 FINANCIAL REPORT

In general, the borrowings held by EXMAR and its equity accounted investees are secured by a mortgage on the underlying assets owned by
the subsidiaries or the equity accounted investees. Furthermore, different pledges and other types of guarantees exist to secure the borrowings.
In addition, dividend restrictions may exist.
EXMAR has pledged financial assets as collateral for liabilities. We refer to note 9 where the amount of restricted cash in respect of financing
agreements and financial instruments is disclosed. We refer to note 8 where the borrowings to equity accounted investees are disclosed. The
Excelerate bonds and the Explorer/ Express shareholders loans have been pledged as a security for the related underlying liabilities.
Also different financial covenants exist that require compliance with certain financial ratio’s. These ratio’s are calculated based on EXMAR’s
consolidated figures (proportionate consolidation method). In case of non-compliance with these covenants, early repayment of related borrowings
might occur. As of June 30, 2017, EXMAR was compliant with all covenants and does not expect to be in breach with its covenants at year end.
EXMAR is continuously monitoring compliance with all applicable covenants.
15. RELATED PARTIES
The Company has a related party relationship with its controlling shareholder and with its controlling shareholder related parties, with its subsidiaries,
joint ventures, associates and with its directors and executive officers. These relationships were disclosed in the consolidated financial statements
of the Group for the year ended 31 December 2016. There were no significant changes in these related party transactions.
16. RISKS AND UNCERTAINTIES
There were no significant changes in risks and uncertainties compared to the risks and uncertainties described in the annual consolidated
financial statements for the year ended 31 December 2016.
In respect of liquidity risk, we refer to note 12 Capital commitments.
17. SUBSEQUENT EVENTS
EXMAR has reached an agreement on 31 August 2017 to sell insurance broker BELGIBO NV to Jardine Lloyd Thomson Group plc (JLT), one of
the world’s leading providers of insurance, reinsurance and employee benefits related advice, brokerage and associated services. The sale will
result in an estimated gain of approximately USD 30 million.
Condensed consolidated interim financial statements 35

STATEMENT ON THE TRUE AND FAIR VIEW OF THE CONDENSED CONSOLIDATED INTERIM FINANCIAL STATEMENTS AND THE FAIR OVERVIEW OF THE INTERIM MANAGEMENT REPORT
The Board of Directors, represented by Nicolas Saverys and Patrick De Brabandere, and the Executive Committee, represented by Nicolas
Saverys and Miguel de Potter, hereby certifies, on behalf and for the account of the Company, that, to their knowledge,
- the condensed consolidated interim financial information which has been prepared in accordance with IAS 34, “Interim Financial Reporting“
as adopted by the European Union, gives a true and fair view of the equity, financial position and financial performance of the Company,
and the entities included in the consolidation as a whole,
- the interim management report includes a fair overview of the information required under Article 13, §§ 5 and 6 of the Royal Decree of
November 14, 2007 on the obligations of issuers of financial instruments admitted to trading on a regulated market.
36 FINANCIAL REPORT, COLOPHON, GLOSSARY
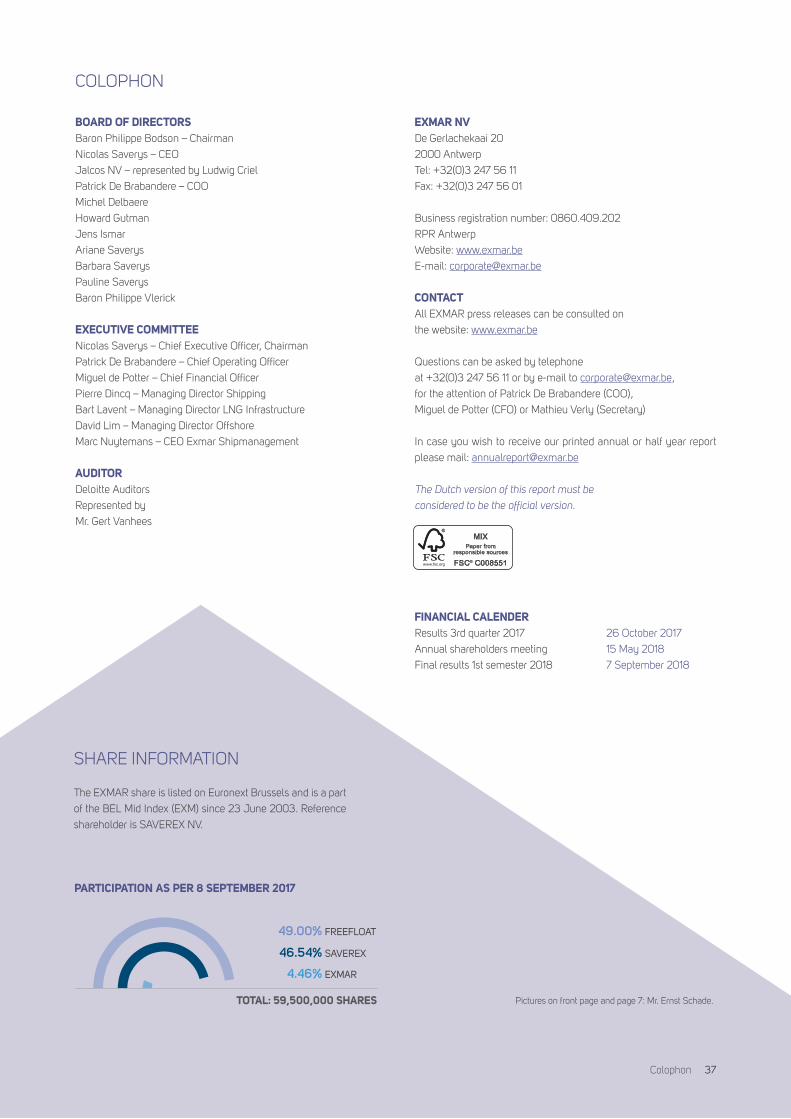
COLOPHON
BOARD OF DIRECTORSBaron Philippe Bodson – Chairman
Nicolas Saverys – CEO
Jalcos NV – represented by Ludwig Criel
Patrick De Brabandere – COO
Michel Delbaere
Howard Gutman
Jens Ismar
Ariane Saverys
Barbara Saverys
Pauline Saverys
Baron Philippe Vlerick
EXECUTIVE COMMITTEENicolas Saverys – Chief Executive Officer, Chairman
Patrick De Brabandere – Chief Operating Officer
Miguel de Potter – Chief Financial Officer
Pierre Dincq – Managing Director Shipping
Bart Lavent – Managing Director LNG Infrastructure
David Lim – Managing Director Offshore
Marc Nuytemans – CEO Exmar Shipmanagement
AUDITORDeloitte Auditors
Represented by
Mr. Gert Vanhees
EXMAR NV De Gerlachekaai 20
2000 Antwerp
Tel: +32(0)3 247 56 11
Fax: +32(0)3 247 56 01
Business registration number: 0860.409.202
RPR Antwerp
Website: www.exmar.be
E-mail: [email protected]
CONTACTAll EXMAR press releases can be consulted on
the website: www.exmar.be
Questions can be asked by telephone
at +32(0)3 247 56 11 or by e-mail to [email protected],
for the attention of Patrick De Brabandere (COO),
Miguel de Potter (CFO) or Mathieu Verly (Secretary)
In case you wish to receive our printed annual or half year report
please mail: [email protected]
The Dutch version of this report must be
considered to be the official version.
FINANCIAL CALENDERResults 3rd quarter 2017 26 October 2017
Annual shareholders meeting 15 May 2018
Final results 1st semester 2018 7 September 2018
�����
46.54% SAVEREX
4.46% EXMAR
49.00% FREEFLOAT
TOTAL: 59,500,000 SHARES
PARTICIPATION AS PER 8 SEPTEMBER 2017
SHARE INFORMATION
The EXMAR share is listed on Euronext Brussels and is a part
of the BEL Mid Index (EXM) since 23 June 2003. Reference
shareholder is SAVEREX NV.
Pictures on front page and page 7: Mr. Ernst Schade.
Colophon 37

GLOSSARY
BIC Belgibo Industry Cargo
CAGR Compound annual growth rate
CAPEX Capital Expenditure
CEO Chief Executive Officer
COGH Cape of Good Hope
DVO DV Offshore
EBIT Earnings before interest and taxes
EBITDA Earnings before interest, taxes, depreciation, and amortization
EE Excelerate Energy
EOC EXMAR Offshore Company
EPCI Engineering, Procurement, Construction and Installation
ESM EXMAR Ship Management
FID Final Investment Decision
FLNG Floating Liquefaction of Natural Gas
FPS Floating Production System
FPSO Floating Production Storage and Offloading-unit
FSRU Floating Storage and Regasification Unit
HHIC Hanjin Heavy Industries and Construction
HMPE High modulus polyethylene
IAS International Accounting Standards
IFRS International Financial Reporting Standards
JV Joint venture
LGC Large Gas Carrier
LNG Liquefied Natural Gas
LNG/C Liquefied Natural Gas Carrier
LPG Liquefied Petroleum Gas
MAS Marine Aviation Special Risks
MGC Midsize Gas Carrier
Midsize 20,000 m³ to 40,000 m³
MT Metric tonnes
MTPA Million tonnes per annum
OB Order book
PCM Pulse-code modulation
Petchems Petrochemicals
POB Persons on board
REBITDA Recurring earnings before interests, taxes, depreciations and amortizations
38 COLOPHON, GLOSSARY

RFP Request for proposal
STS Ship-to-ship
TC Time chartered
TCE Timecharter equivalent
ULCV Ultra Large Container Vessel
US United States
USD United States Dollar
VCM Vinyl Chloride Monomer
VLGC Very Large Gas Carrier
YTD Year-to-date
Glossary 39