exosomes from m1-polarized macrophages enhance ...3. anhui province key laboratory of chinese...
TRANSCRIPT

Exosomes from M1-polarized macrophages enhance paclitaxel
antitumor activity by activating macrophages-mediated
inflammation
1. School of Pharmacy, Anhui University of Chinese Medicine, Hefei,
Anhui, 230012, China
2. Institute of Drug Metabolism, Anhui University of Chinese Medicine,
Hefei, Anhui, 230012, China
3. Anhui Province Key Laboratory of Chinese Medicinal Formula, Hefei,
Anhui, 230012, China
4. Institute of Pharmaceutics, Anhui Academy of Chinese Medicine,
Hefei, Anhui, 230012, China
5. Synergetic Innovation Center of Anhui Authentic Chinese Medicine
Quality Improvement, Hefei, Anhui, 230012, China
1*Corresponding Author
Lei Wang, e-mail: [email protected]
Weidong Chen, e-mail: [email protected]
Keywords
Anti-cancer, Immunological-chemo therapy, M1-macrophage, M1-exosomes, Drug
delivery

Supplementary Table
Table S1 Primer used for quantitative RT-PCR.
Gene Primer sequence (5’-3’)
GAPDH
F:GGTCGGTGTGAACGGATTTGG
R:GCCGTGGGTAGAGTCATACTGGAAC
F:CCTTCCGAAGTTTCTGGCAGCAGC
R:GGCTGTCAGAGCCTCGTGGCTTTGG
iNOS
IL-10
F:TTCTTTCAAACAAAGGACCAGC
R:GCAACCCAAGTAACCCTTAAAG
F:CTCCCAACAGACCTGTCTATAC
R:CCATTGCACAACTCTTTTCTCA
IL-6
IL-12b
F:TGAGAAGTATTCAGTGTCCTGC
R:CTGTGAGTTCTTCAAAGGCTTC
F:TACCAGGAGCCATATCCACGGATG
R:TGTGGTGTTCTTCGTTGCTGTGAG
F:ATGTCTCAGCCTCTTCTCATTC
R:GCTTGTCACTCGAATTTTGAGA
IL-4
TNF-α
NF-kB
F:CCTCTGGCGAATGGCTTTAC
R:GCCTGGTCCCGTGAAATACA
IkB
F:ACTTCTCCTGAAGCCGGTG
R:TGGTTGTCAGGTCTGCAATTT
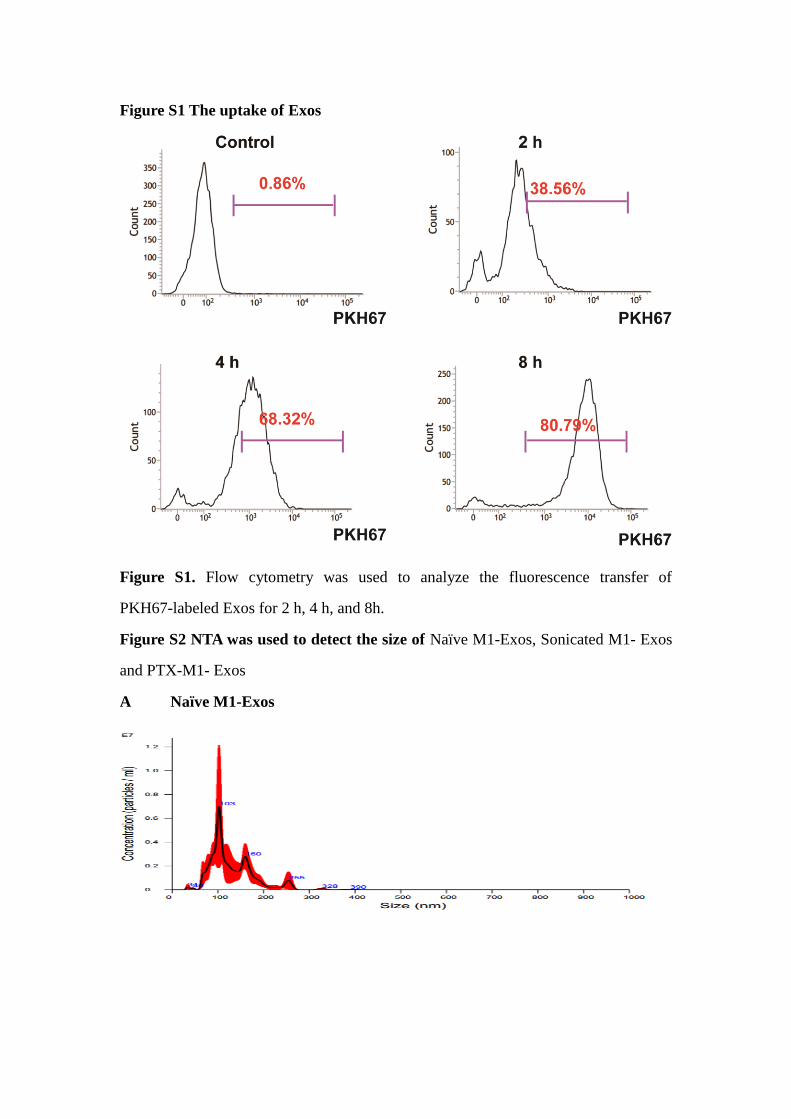
Figure S1 The uptake of Exos
Figure S1. Flow cytometry was used to analyze the fluorescence transfer of
PKH67-labeled Exos for 2 h, 4 h, and 8h.
Figure S2 NTA was used to detect the size of Naïve M1-Exos, Sonicated M1- Exos
and PTX-M1- Exos
A Naïve M1-Exos

B Sonicated M1- Exos
C PTX-M1-Exos
Figure S2. NTA demonstrates the size distribution and concentration of Naïve M1-
Exos (S 2A), Sonicated M1- Exos (S 2B) and PTX-M1- Exos (S 2C).
Drug loading analysis
PTX was quantified by using a Waters 1260 HPLC system on a C18 column, in
isocratic mode using acetonitrile and 0.01% phosphoric acid solution (65: 35, v/v) as
mobile phase and detected at 227 nm (Figure S3). Samples concentrations were
calculated according to the standard curve.
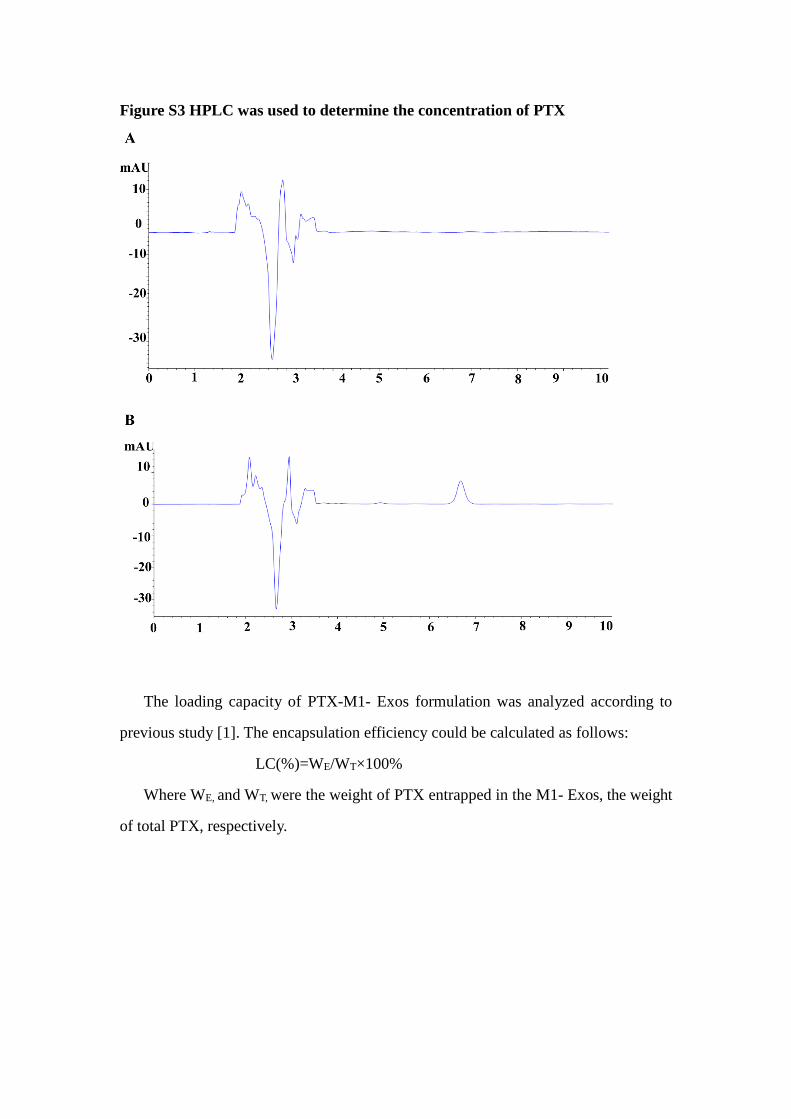
Figure S3 HPLC was used to determine the concentration of PTX
The loading capacity of PTX-M1- Exos formulation was analyzed according to
previous study [1]. The encapsulation efficiency could be calculated as follows:
LC(%)=WE/WT×100%
Where WE, and WT, were the weight of PTX entrapped in the M1- Exos, the weight
of total PTX, respectively.

Figure S4 MTT assay
Figure S4. MDA-MB-231, MCF-7, 4T1, A549, HepG2 and Hela cells were incubated
with medium (Control), M1- Exos (40 μg/mL), 15 μg/mL free PTX, and PTX-M1-
Exos (at a dose of PTX 15 μg/mL) for 24 h. The inhibitory effects were detected by
MTT assay. (n=6; *P<0.05 **P<0.01, *** P<0.001vs. the control group)

Figure S5
Figure S5.MDA-MB-231, MCF-7, 4T1, A549, HepG2 and Hela cells were incubated
with medium (Control), M2- Exos (40 μg/mL), 15 μg/mL free PTX, and PTX-M2-
Exos (at a dose of PTX 15 μg/mL) for 24 h. The inhibitory effects were detected by
MTT assay. (n=6; *P<0.05 **P<0.01, *** P<0.001vs. the control group)

Figure S6
Figure S 6. (A) Cell apoptosis was detected by flow cytometry at 24 h in each group,
and (B) Statistical analysis of data. The data shown are mean ± SD. (n=3; *P<0.05
**P<0.01, *** P<0.001vs. the control group)
Figure S7
Figure S7. Model of exosomes loading PTX.