expanding insurance coverage through nhif marwa chacha manager, strategy & corporate planning,...
TRANSCRIPT
Expanding Insurance Coverage through NHIF
Marwa ChachaManager, Strategy & Corporate
Planning, NHIF
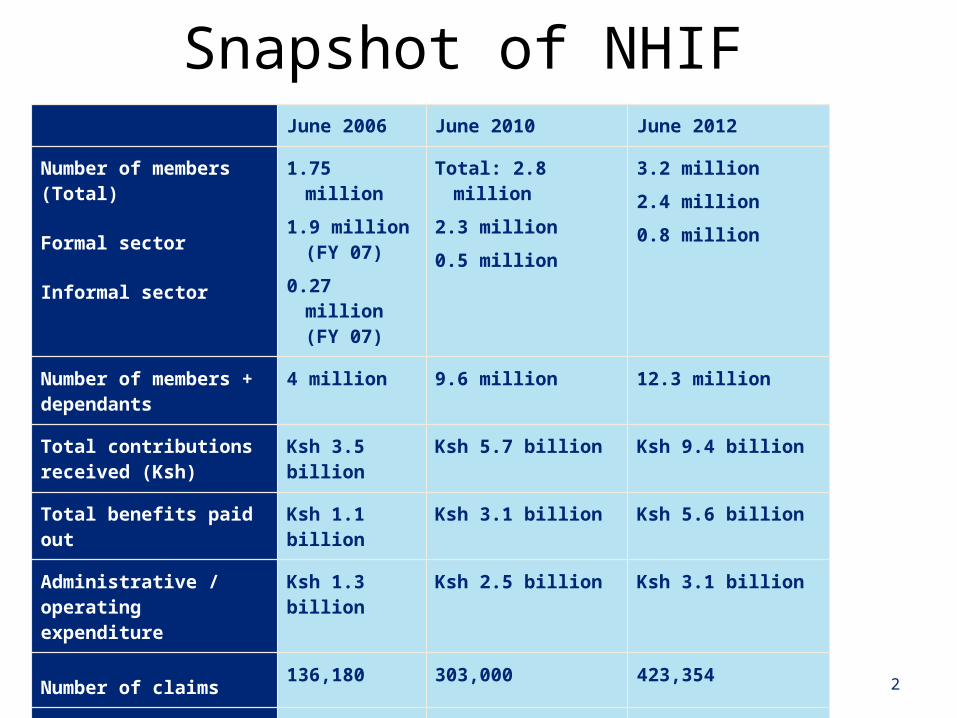
Snapshot of NHIF
2
June 2006 June 2010 June 2012
Number of members (Total)
Formal sector
Informal sector
1.75 million1.9 million (FY
07)0.27 million (FY
07)
Total: 2.8 million 2.3 million0.5 million
3.2 million2.4 million0.8 million
Number of members + dependants
4 million 9.6 million 12.3 million
Total contributions received (Ksh)
Ksh 3.5 billion Ksh 5.7 billion Ksh 9.4 billion
Total benefits paid out Ksh 1.1 billion Ksh 3.1 billion Ksh 5.6 billion
Administrative / operating expenditure
Ksh 1.3 billion Ksh 2.5 billion Ksh 3.1 billion
Number of claims 136,180 303,000 423,354
Amount of average claim
(Ksh)
Ksh 6,986 Ksh 10,028 Ksh 13,200

NHIF has had some notable successes in the past 5 years
1. NHIF’s membership has grown during the 5 year review period (from FY 2006 to FY 2011), growth by 13% p.a.;
2. NHIF has increased coverage of the informal sector from less than 200,000 in 2005 to 531,388 as at June 30 2010.
3. The total contribution revenue has increased from Ksh 3.1 billion in FY 06 to Ksh 5.6 billion in FY 10 and Ksh 9.4 billion in FY 2011
4. NHIF has increased the level of pay-out of benefits to members and their beneficiaries. The pay-out ratio has increased to 60% in FY10 from 32% in FY06 – in Ksh grown from Ksh 1.1 billion to Ksh 3.1 billion. Currently at 60%
5. Increasing investment in ICT including revenue collection, EFT payments, use of MPESA, online registration and online banking.
3
NHIF has had some notable successes in the past 5 years
6. NHIF on average pays claims between 14 to 21 days compared with the best paying private insurers who pay within 30 days or the worst who pay within 60 to 120 days.
7. Within the last 5 years from FY 06, NHIF has progressively been increasing the rebates on its inpatient package – improvements of 71% in 5 years
8. The Fund has contracts with 645 hospitals, accounting for 44,299 beds in Kenya against a total of 49,000 beds – covers close to 100% of all hospitals in Kenya
9. Imminent full scale implementation of outpatient services will be a major improvement in the level of service offered to members.
4
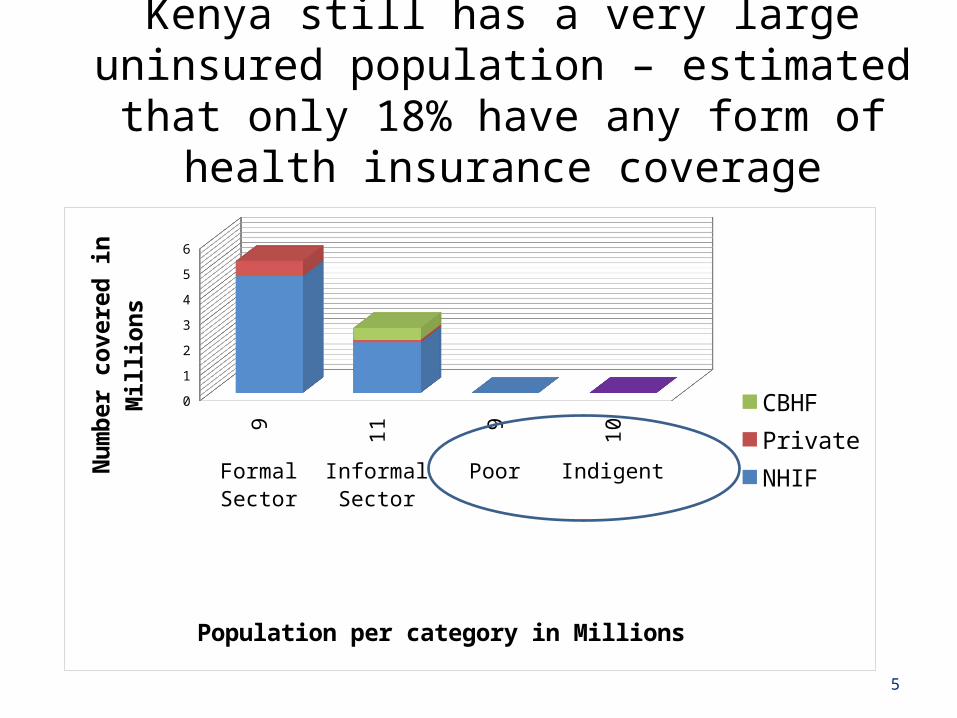
Kenya still has a very large uninsured population – estimated that only 18% have any form of health
insurance coverage
5
9 11 9 10 Formal Sector Informal
SectorPoor Indigent
0
1
2
3
4
5
6
CBHFPrivateNHIF
Population per category in Millions
Num
ber c
over
ed in
Mill
ions
NHIF has a key role to play for Kenya to achieve universal coverage
6
There needs to be institutional transformation, focusing on:
1. Governance and accountability2. Efficiency and effectiveness3. Financial sustainability
Governance and accountability
7
8
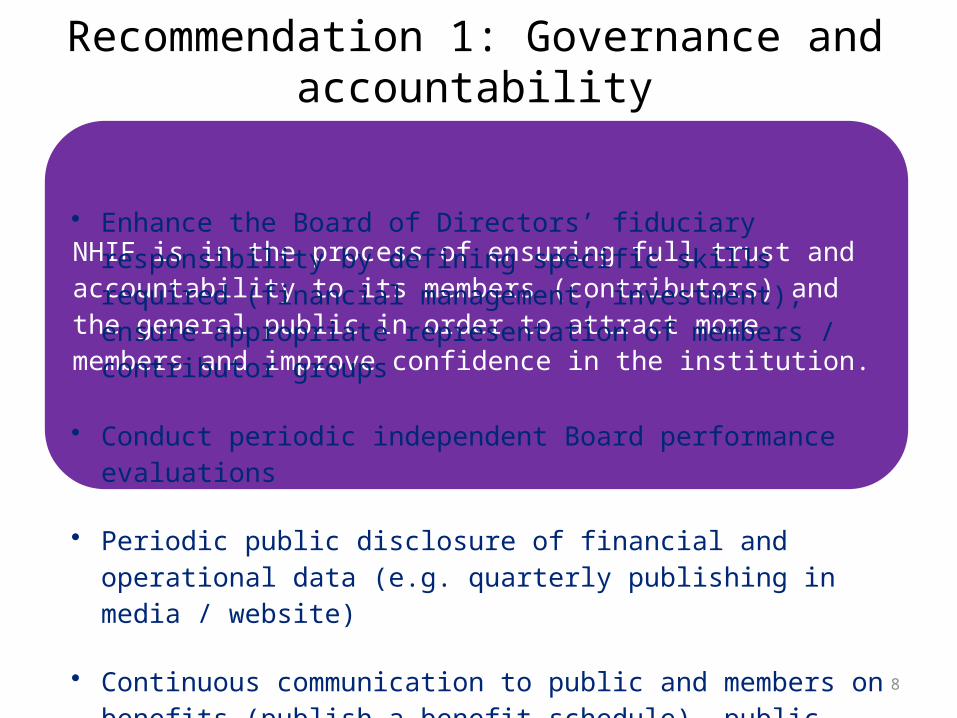
NHIF is in the process of ensuring full trust and accountability to its members (contributors) and the general public in order to attract more members and improve confidence in the institution.• Enhance the Board of Directors’ fiduciary responsibility by defining
specific skills required (financial management, investment), ensure appropriate representation of members / contributor groups
• Conduct periodic independent Board performance evaluations
• Periodic public disclosure of financial and operational data (e.g. quarterly publishing in media / website)
• Continuous communication to public and members on benefits (publish a benefit schedule), public forum to engage with members, establish an ombudsman or grievance channel through existing Government ombudsman
• Become a ‘risk intelligent’ organization: fully operationalize organization wide risk management
Recommendation 1: Governance and accountability

Effectiveness & Efficiency
9
10
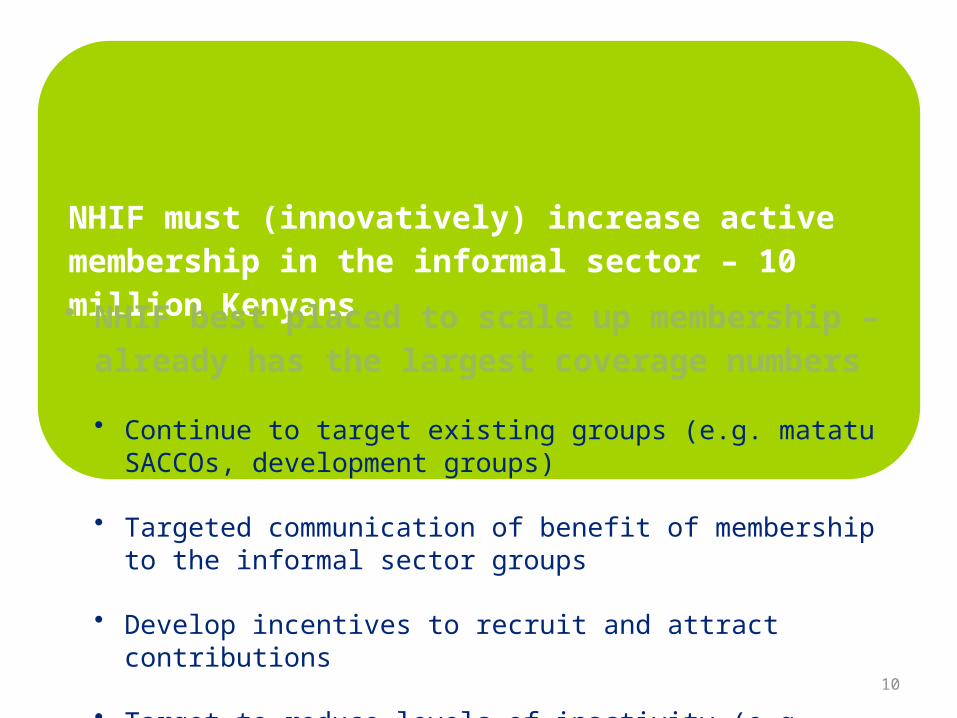
NHIF must (innovatively) increase active membership in the informal sector – 10 million Kenyans
• NHIF best placed to scale up membership – already has the largest coverage numbers
• Continue to target existing groups (e.g. matatu SACCOs, development groups)
• Targeted communication of benefit of membership to the informal sector groups
• Develop incentives to recruit and attract contributions
• Target to reduce levels of inactivity (e.g. remove disincentives, incentives for pre-payments, easy payment methods for individual members, ease of movement from formal to informal membership and vice versa)
11
NHIF must be a ‘strategic’ purchaser of healthcare to enhance service to members
• NHIF should overhaul its existing provider payment mechanisms
• Move away from current rebate based payment system to more cost effective payment modalities for providers (fixed reimbursement, capitation)
• Review payment modalities for each category of contract
• Drive incentive programmes with Facilities to partner in attracting and retaining members
• Publish ratings of facilities to encourage high quality treatment of NHIF members
• Utilize costing data to inform purchasing decisions and negotiations
Increase efficiency by aligning processes and people to ICT
• There is an opportunity to improve operational processes and increase effectiveness with optimal ICT deployment
1. Member registration process has been fairly lengthy, requiring documentation and is manual in some aspects
2. Customer service can be enhanced with technology – increasing channels to customers (NHIF website, call centers etc.)
3. Claim processing, though fast has too many handovers and can be shortened. Initiative is currently under way and has resulted in a shorter process
12
Mandate of NHIF (Per NHIF Act) requires provision of both in-patient and outpatient benefits
• Benefits package has been improving e.g.
• New maternity cover available at a wider range of facilities
• Increasing average rebate rates – an increase of 70% from 2006 to 2010
• Deliberate strategy to increase the number of Category A and B contracts with smaller private, faith based hospitals has increased access.
• However…
• Primary benefit remains ‘inpatient cover’ based on length of stay
• NHIF most comprehensive ‘depth’ of cover mainly achieved at public health facilities – under Contract A or smaller private and mission hospitals under Contract B
• Public facilities face significant supply side constraints – accessibility, location, quality of service
• High cost of care under Category C limits the depth of NHIF’s cover in this category
• Effective outpatient cover is non-existent
13
Efficiency gains recorded over the past 5 years• The operating cost to income ratio has reduced to 45% in 2010 – in an
environment where contribution rates have not changed in 20 years
• Some of the gains include:
• Improving turnaround times in key processes e.g. speed of claims payment and collections has increased
• The Fund is more reliant on technology in its operational processes
• However,
• Though the expense ratio has been falling in past 5 years from 70% to 32% - but last 3 years have been flat – no further economies of scale?
• Staff costs the highest category (71%) – there’s an opportunity to align staff to ICT for efficient processes.
14
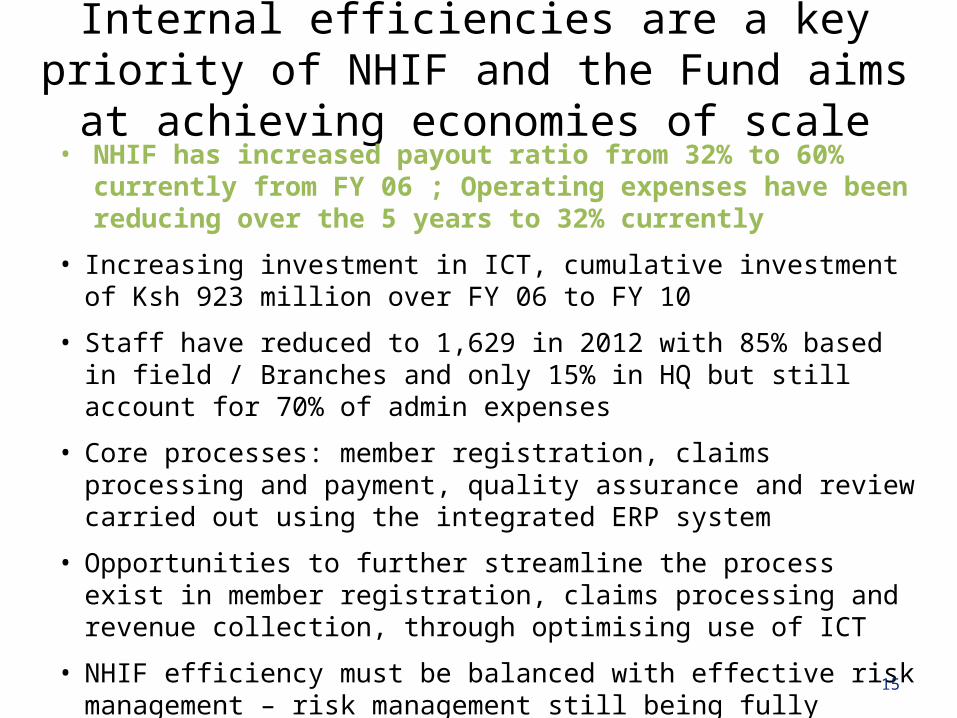
Internal efficiencies are a key priority of NHIF and the Fund aims at achieving economies of scale
• NHIF has increased payout ratio from 32% to 60% currently from FY 06 ; Operating expenses have been reducing over the 5 years to 32% currently
• Increasing investment in ICT, cumulative investment of Ksh 923 million over FY 06 to FY 10
• Staff have reduced to 1,629 in 2012 with 85% based in field / Branches and only 15% in HQ but still account for 70% of admin expenses
• Core processes: member registration, claims processing and payment, quality assurance and review carried out using the integrated ERP system
• Opportunities to further streamline the process exist in member registration, claims processing and revenue collection, through optimising use of ICT
• NHIF efficiency must be balanced with effective risk management – risk management still being fully operationalized across operating functions
15
16
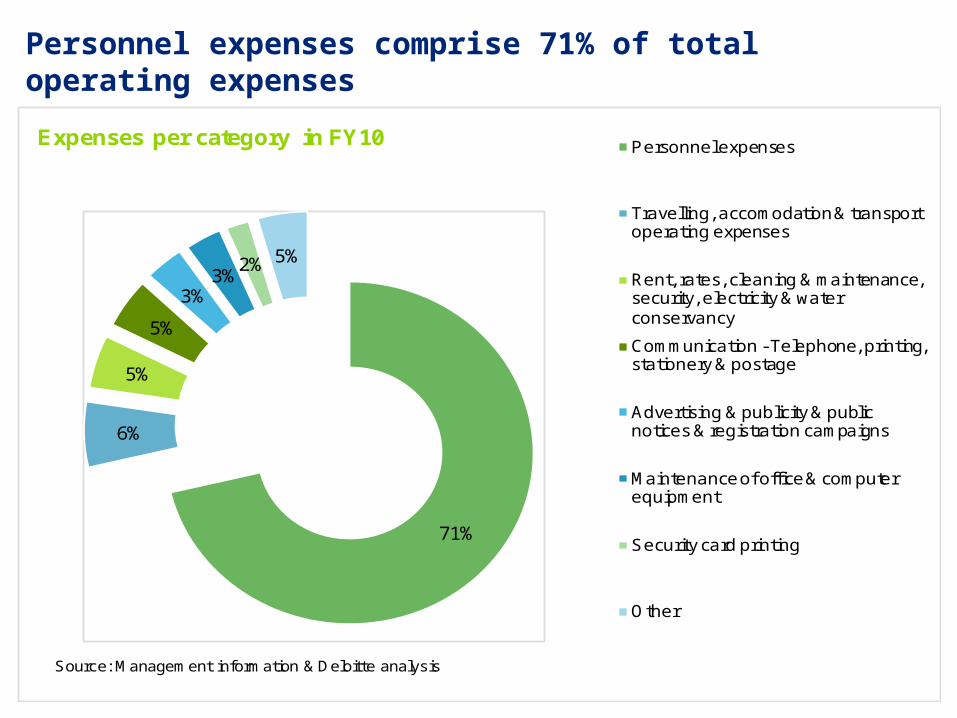
Personnel expenses comprise 71% of total operating expenses
71%
6%
5%
5%
3%3%
2% 5%
Expenses per category in FY10 Personnel expenses
Travelling, accomodation & transport operating expenses
Rent, rates, cleaning & maintenance, security, electricity & water conservancy
Communication - Telephone, printing, stationery & postage
Advertising & publicity & public notices & registration campaigns
Maintenance of office & computer equipment
Security card printing
Other
Source: Management information & Deloitte analysis
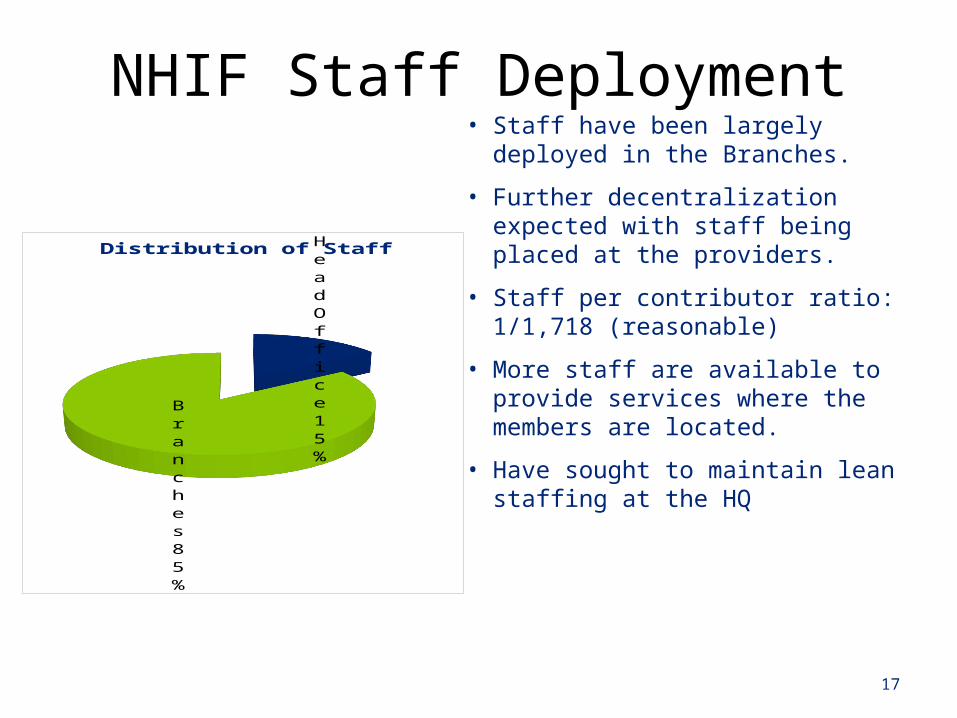
NHIF Staff Deployment
17
Head Office
15%
Branches85%
Distribution of Staff• Staff have been largely deployed in the
Branches.
• Further decentralization expected with staff being placed at the providers.
• Staff per contributor ratio: 1/1,718 (reasonable)
• More staff are available to provide services where the members are located.
• Have sought to maintain lean staffing at the HQ
18
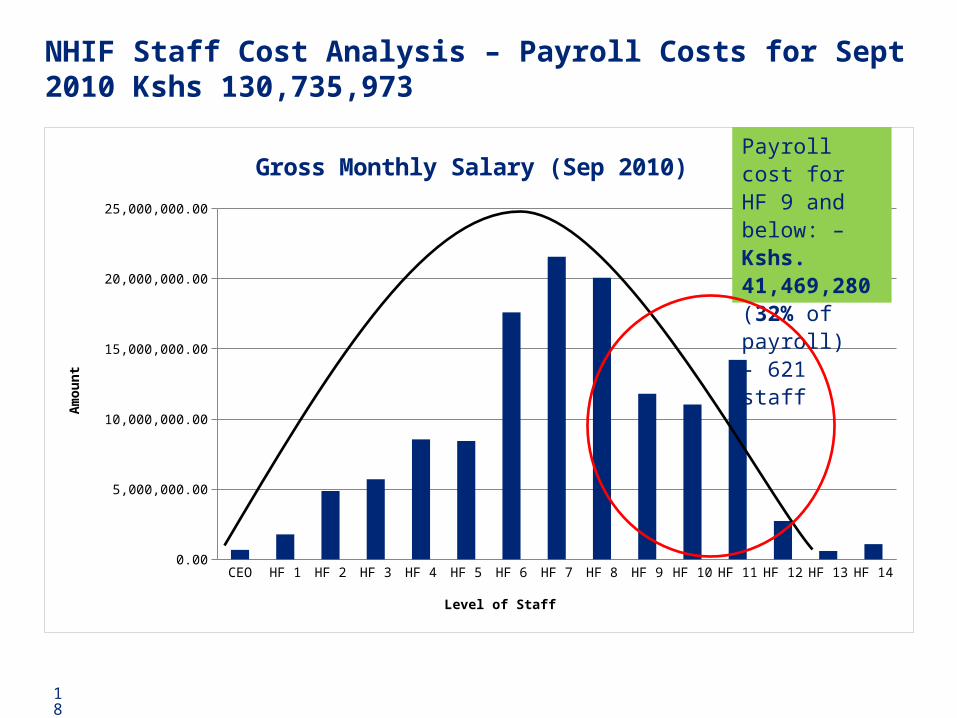
NHIF Staff Cost Analysis – Payroll Costs for Sept 2010 Kshs 130,735,973
CEO HF 1 HF 2 HF 3 HF 4 HF 5 HF 6 HF 7 HF 8 HF 9 HF 10 HF 11 HF 12 HF 13 HF 140.00
5,000,000.00
10,000,000.00
15,000,000.00
20,000,000.00
25,000,000.00
Gross Monthly Salary (Sep 2010)
Level of Staff
Am
ou
nt
Payroll cost for HF 9 and be-low: – Kshs. 41,469,280 (32% of payroll)- 621 staff
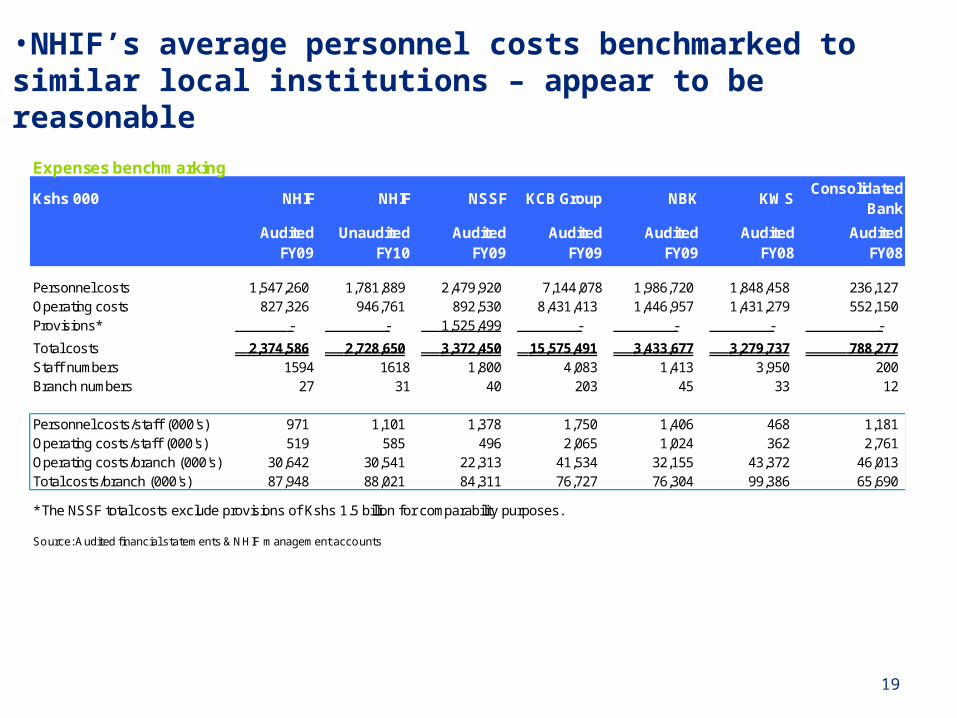
•NHIF’s average personnel costs benchmarked to similar local institutions – appear to be reasonable
19
Expenses benchmarking
Kshs 000 NHIF NHIF NSSF KCB Group NBK KWSConsolidated
Bank
Audited FY09
Unaudited FY10
Audited FY09
Audited FY09
Audited FY09
Audited FY08
Audited FY08
Personnel costs 1,547,260 1,781,889 2,479,920 7,144,078 1,986,720 1,848,458 236,127 Operating costs 827,326 946,761 892,530 8,431,413 1,446,957 1,431,279 552,150 Provisions* - - 1,525,499 - - - -
Total costs 2,374,586 2,728,650 3,372,450 15,575,491 3,433,677 3,279,737 788,277 Staff numbers 1594 1618 1,800 4,083 1,413 3,950 200 Branch numbers 27 31 40 203 45 33 12
Personnel costs/staff (000's) 971 1,101 1,378 1,750 1,406 468 1,181 Operating costs/staff (000's) 519 585 496 2,065 1,024 362 2,761 Operating costs/branch (000's) 30,642 30,541 22,313 41,534 32,155 43,372 46,013 Total costs/branch (000's) 87,948 88,021 84,311 76,727 76,304 99,386 65,690
* The NSSF total costs exclude provisions of Kshs 1.5 billion for comparability purposes.
Source: Audited financial statements & NHIF management accounts
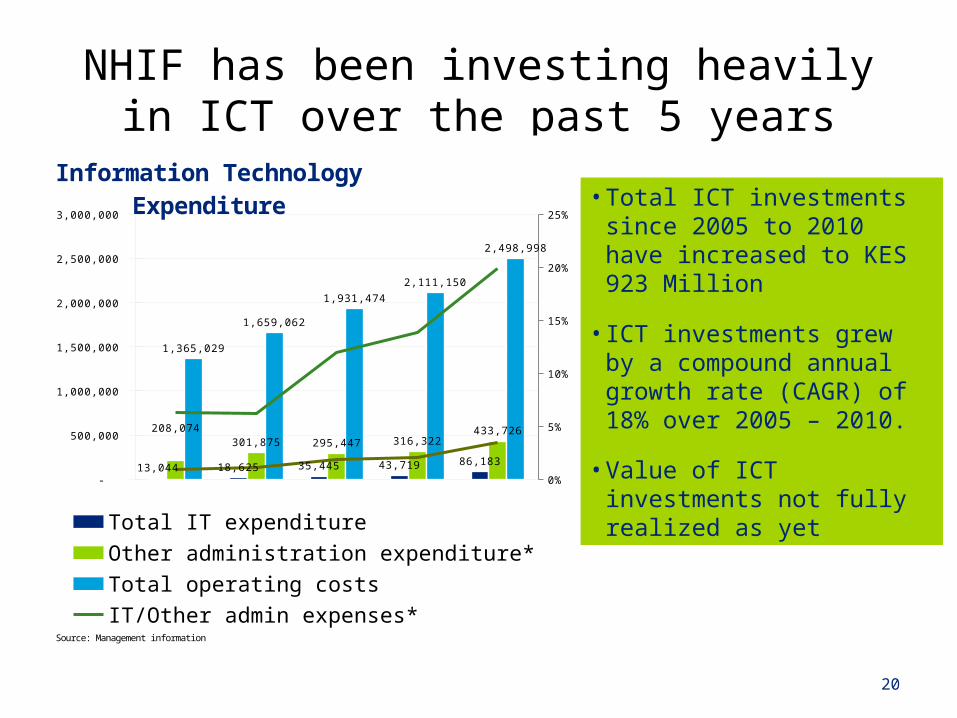
NHIF has been investing heavily in ICT over the past 5 years
• Total ICT investments since 2005 to 2010 have increased to KES 923 Million
• ICT investments grew by a compound annual growth rate (CAGR) of 18% over 2005 – 2010.
• Value of ICT investments not fully realized as yet
20
-
500,000
1,000,000
1,500,000
2,000,000
2,500,000
3,000,000
0%
5%
10%
15%
20%
25%
13,044 18,625 35,445 43,719 86,183
208,074 301,875 295,447 316,322
433,726
1,365,029
1,659,062
1,931,474
2,111,150
2,498,998
Information Technology Expendi-ture
Total IT expenditureOther administration expenditure*Total operating costsIT/Other admin expenses*IT/Total operation costs
Source: Management information
IT Utilization deployment has helped boost NHIF’s image with providers and contributors
• The significant advantages Information Technology has assisted NHIF has been through:
• Enhancing cash collection by leveraging various collection centers such as banks, use of mobile money transfer
• Easing registration of contributors where in some areas, NHIF is able to take and upload the pictures
• Allowing payments to be undertaken centrally through the headquarters by leveraging on EFT
• Connecting health facilities which assists in patient detail capture, verification thus enhancing the payment cycle as this details are captured online
21

Financial sustainability:
22
23
NHIF is in the process of addressing its longer term financial sustainability issues by ensuring sufficient revenue, continuing to reduce operating expenditure and restructuring the balance sheet• Reducing operating expenditure:
• Ensure economies of scale by fully leveraging ICT, improving processes, effectively utilizing staff
• Focus on purchasing healthcare
• Restructuring the balance sheet:
• Gradual disposal of illiquid assets
• Improve current investment policy to focus on liquidity, solvency and ensure adequate returns
• Increase funding to NHIF: • Automatic mechanism of increasing contributions (matching inflation)• Consider other sources of funds to supplement worker’s contributions• Make NHIF contribution tax exempt• Attract additional funds for special needs (e.g. indigents, chronic diseases
etc.)
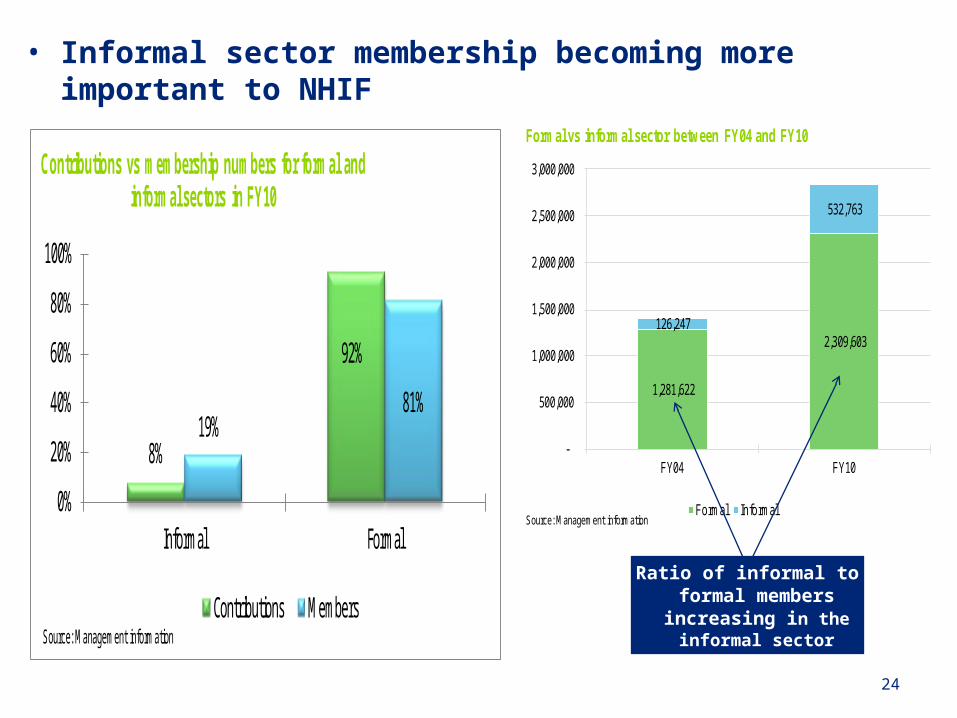
• Informal sector membership becoming more important to NHIF
24
1,281,622
2,309,603 126,247
532,763
-
500,000
1,000,000
1,500,000
2,000,000
2,500,000
3,000,000
FY04 FY10
Formal vs informal sector between FY04 and FY10
Formal InformalSource: Management information
Ratio of informal to formal members increasing in the
informal sector
8%
92%
19%81%
0%
20%
40%
60%
80%
100%
Informal Formal
Contributions vs membership numbers for formal and informal sectors in FY10
Contributions MembersSource: Management information
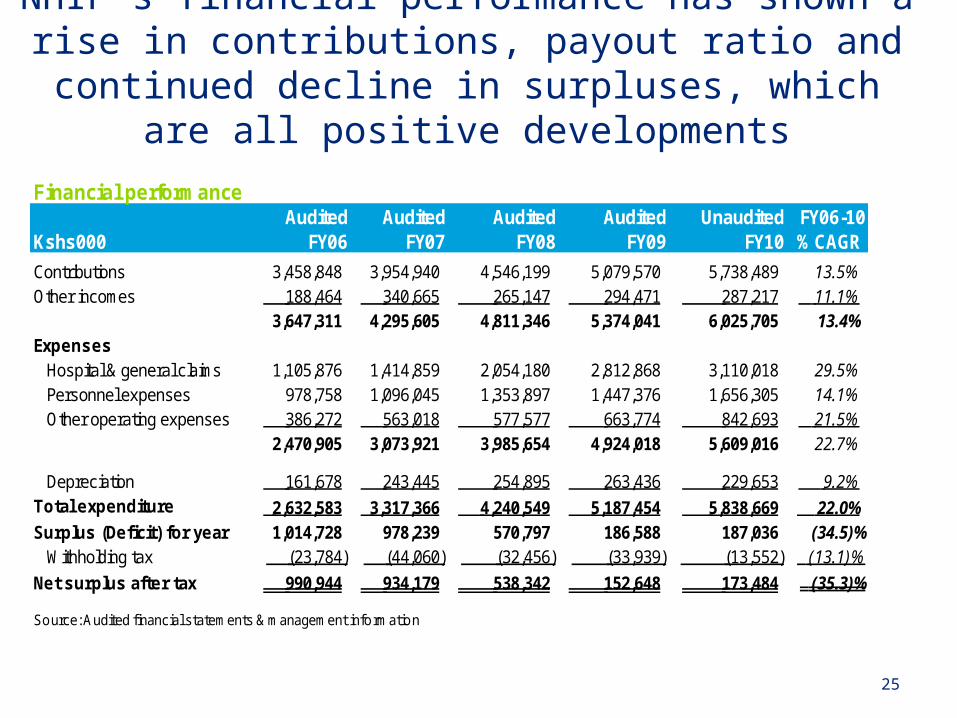
NHIF’s financial performance has shown a rise in contributions, payout ratio and continued decline in
surpluses, which are all positive developments
25
Financial performanceAudited Audited Audited Audited Unaudited FY06-10
Kshs000 FY06 FY07 FY08 FY09 FY10 % CAGR
Contributions 3,458,848 3,954,940 4,546,199 5,079,570 5,738,489 13.5% Other incomes 188,464 340,665 265,147 294,471 287,217 11.1%
3,647,311 4,295,605 4,811,346 5,374,041 6,025,705 13.4% Expenses
Hospital & general claims 1,105,876 1,414,859 2,054,180 2,812,868 3,110,018 29.5% Personnel expenses 978,758 1,096,045 1,353,897 1,447,376 1,656,305 14.1% Other operating expenses 386,272 563,018 577,577 663,774 842,693 21.5%
2,470,905 3,073,921 3,985,654 4,924,018 5,609,016 22.7%
Depreciation 161,678 243,445 254,895 263,436 229,653 9.2% Total expenditure 2,632,583 3,317,366 4,240,549 5,187,454 5,838,669 22.0% Surplus (Deficit) for year 1,014,728 978,239 570,797 186,588 187,036 (34.5)%
Withholding tax (23,784) (44,060) (32,456) (33,939) (13,552) (13.1)%
Net surplus after tax 990,944 934,179 538,342 152,648 173,484 (35.3)%
Source: Audited financial statements & management information
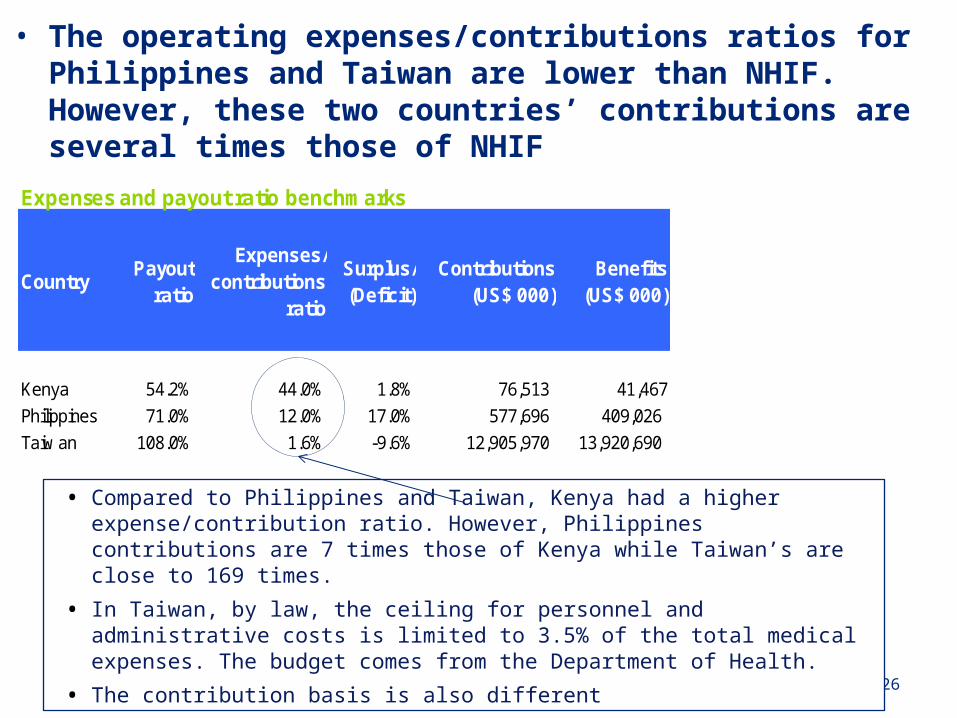
Expenses and payout ratio benchmarks
CountryPayout
ratio
Expenses/contributions
ratio
Surplus/(Deficit)
Contributions (US$ 000)
Benefits (US$ 000)
Kenya 54.2% 44.0% 1.8% 76,513 41,467
Philippines 71.0% 12.0% 17.0% 577,696 409,026
Taiw an 108.0% 1.6% -9.6% 12,905,970 13,920,690
• The operating expenses/contributions ratios for Philippines and Taiwan are lower than NHIF. However, these two countries’ contributions are several times those of NHIF
26
• Compared to Philippines and Taiwan, Kenya had a higher expense/contribution ratio. However, Philippines contributions are 7 times those of Kenya while Taiwan’s are close to 169 times.
• In Taiwan, by law, the ceiling for personnel and administrative costs is limited to 3.5% of the total medical expenses. The budget comes from the Department of Health.
• The contribution basis is also different
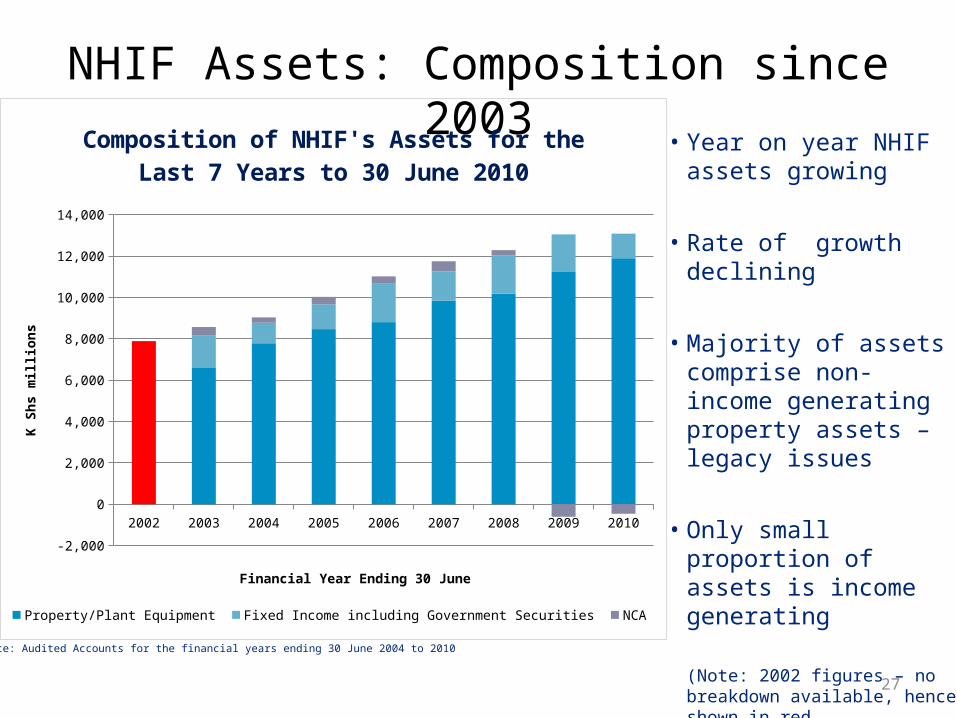
NHIF Assets: Composition since 2003
27
Source: Audited Accounts for the financial years ending 30 June 2004 to 2010
• Year on year NHIF assets growing
• Rate of growth declining
• Majority of assets comprise non-income generating property assets – legacy issues
• Only small proportion of assets is income generating
(Note: 2002 figures – no breakdown available, hence shown in red
2002 2003 2004 2005 2006 2007 2008 2009 2010
-2,000
0
2,000
4,000
6,000
8,000
10,000
12,000
14,000
Composition of NHIF's Assets for the Last 7 Years to 30 June 2010
Property/Plant Equipment Fixed Income including Government Securities NCA
Financial Year Ending 30 June
K Sh
s mill
ions
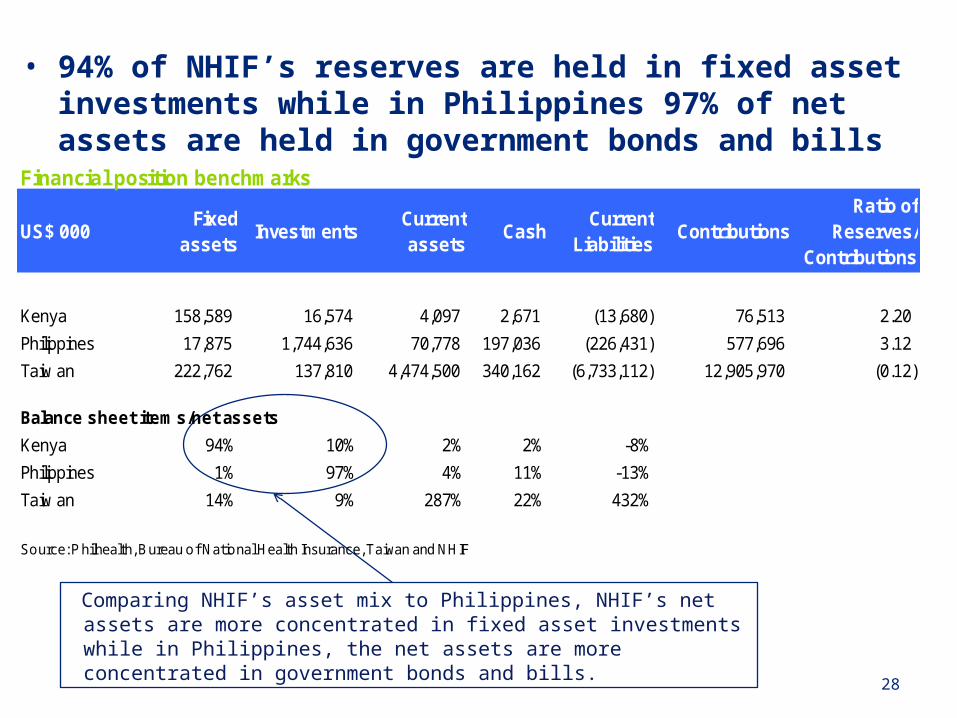
• 94% of NHIF’s reserves are held in fixed asset investments while in Philippines 97% of net assets are held in government bonds and bills
28
Comparing NHIF’s asset mix to Philippines, NHIF’s net assets are more concentrated in fixed asset investments while in Philippines, the net assets are more concentrated in government bonds and bills.
Financial position benchmarks
US$ 000Fixed
assetsInvestments
Current assets
CashCurrent
LiabilitiesContributions
Ratio of Reserves/
Contributions
Kenya 158,589 16,574 4,097 2,671 (13,680) 76,513 2.20
Philippines 17,875 1,744,636 70,778 197,036 (226,431) 577,696 3.12
Taiw an 222,762 137,810 4,474,500 340,162 (6,733,112) 12,905,970 (0.12)
Balance sheet items/net assets
Kenya 94% 10% 2% 2% -8%
Philippines 1% 97% 4% 11% -13%
Taiw an 14% 9% 287% 22% 432%
Source: P hilhealth, Bureau of National Health Insurance, Taiwan and NHIF
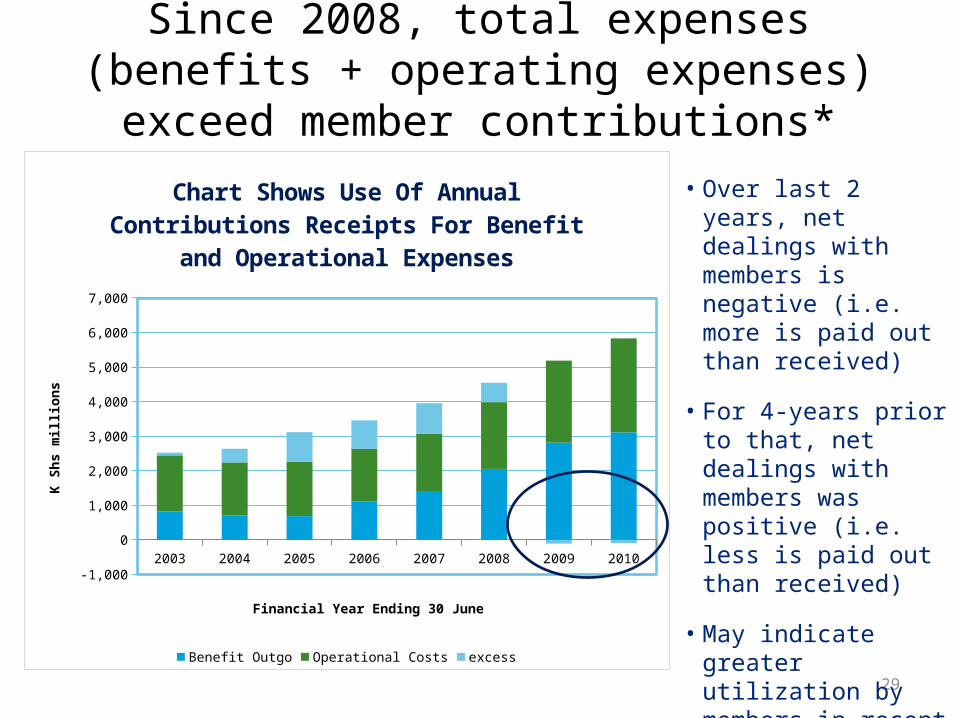
Since 2008, total expenses (benefits + operating expenses) exceed member contributions*
29
2003 2004 2005 2006 2007 2008 2009 2010
-1,000
0
1,000
2,000
3,000
4,000
5,000
6,000
7,000
Chart Shows Use Of Annual Contributions Receipts For Benefit and Operational Expenses
Benefit Outgo Operational Costs excess
Financial Year Ending 30 June
K Sh
s mill
ions
• Over last 2 years, net dealings with members is negative (i.e. more is paid out than received)
• For 4-years prior to that, net dealings with members was positive (i.e. less is paid out than received)
• May indicate greater utilization by members in recent years
*excludes investment income
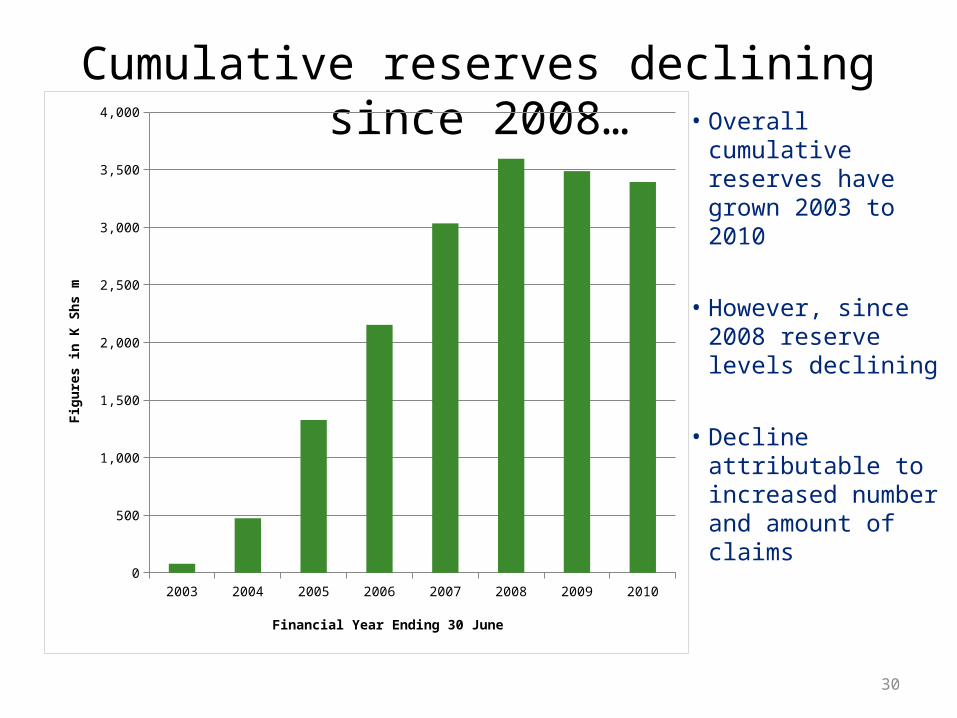
Cumulative reserves declining since 2008…
30
2003 2004 2005 2006 2007 2008 2009 20100
500
1,000
1,500
2,000
2,500
3,000
3,500
4,000
Financial Year Ending 30 June
Figu
res i
n K
Shs m
• Overall cumulative reserves have grown 2003 to 2010
• However, since 2008 reserve levels declining
• Decline attributable to increased number and amount of claims
Strategies to expand coverage
• The Fund is looking at this from three perspectives:– Expanding population coverage– Expanding the benefit package– Financing system to reduce co-pay and out of
pocket expenditure
Expanding Population coverage
• Enhance informal sector penetration through:– Enhance group enrolment through SACCOs,
organised groups and cooperatives– Partnerships with the private sector Insurance
brokers and agents to enhance recruitment– Partnering with Mobile Money transfer companies – Partnering with social franchising programmes
already in the bottom of the pyramid– Leveraging technology
Expanding Population Coverage
• Expanding into the indigent population:– Pilot study on Health Insurance Subsidy
Programme (HISP) underway to provide evidence on its impact on increasing health utilisation and reducing Household Expenditure on Health
– Plans underway to seek support for scale up of the HISP
Other efforts….
• A studies is also underway on:– Designing a cost effective demand driven benefit
package for the informal sector– How NHIF can contribute in Health Prevention and
Promotion Strategies
Conclusion
• NHIF despite the recent challenges has developed systems to enhance insurance coverage especially through the expansion into the informal sector and the indigent population.

Thank You