expanding outcomes in educational program evaluation
TRANSCRIPT

University of Arkansas, FayettevilleScholarWorks@UARK
Theses and Dissertations
5-2019
Expanding Outcomes in Educational ProgramEvaluation: Student Outcomes, Systemic Effects,and Policy ImplicationsHeidi Lauren HolmesUniversity of Arkansas, Fayetteville
Follow this and additional works at: https://scholarworks.uark.edu/etd
Part of the Curriculum and Instruction Commons, Educational Assessment, Evaluation, andResearch Commons, and the Education Policy Commons
This Dissertation is brought to you for free and open access by ScholarWorks@UARK. It has been accepted for inclusion in Theses and Dissertations byan authorized administrator of ScholarWorks@UARK. For more information, please contact [email protected].
Recommended CitationHolmes, Heidi Lauren, "Expanding Outcomes in Educational Program Evaluation: Student Outcomes, Systemic Effects, and PolicyImplications" (2019). Theses and Dissertations. 3214.https://scholarworks.uark.edu/etd/3214

Expanding Outcomes in Educational Program Evaluation: Student Outcomes, Systemic Effects,
and Policy Implications
A dissertation submitted in partial fulfillment
of the requirements for the degree of
Doctor of Philosophy in Education Policy
by
Heidi Lauren Holmes
Brigham Young University
Bachelor of Arts, 2012
May 2019
University of Arkansas
This dissertation is approved for recommendation to the Graduate Council.
____________________________________
Jay P. Greene, Ph.D
Dissertation Director
____________________________________
Patrick J. Wolf, Ph.D
Committee Member
____________________________________
Robert M. Costrell, Ph.D
Committee Member

Abstract
Education policy debates over the last twenty years have focused on the need to increase
students’ test scores. The federal government and states have implemented and expanded a
variety of test-based, school accountability policies. Accountability pressures have incentivized
schools to narrow their curriculum, decrease time allocated to extracurricular activities, and
focus on short-term student outcomes. This dissertation focuses on expanding outcomes in
educational program evaluations and demonstrates the value of looking beyond the goal of
increasing student test scores. The first chapter, using random assignment, estimates the causal
effects of culturally enriching field trips on various student outcomes. Such field trips have been
declining in part due to accountability pressures. We find evidence that such field trips can
actually have a positive impact on student achievement as well as school engagement. The
second chapter focuses on post-secondary outcomes for students. Also using an experimental
design, we evaluate the impact of the Louisiana Scholarship Program on the likelihood of
students entering college. Despite the program negatively affecting student test scores, we find
that the program had no significant effect on the likelihood that students enter college. Finally,
the third chapter takes a broader approach and evaluates systemic effects created by charter
schools. Using nationwide data, I analyze the extent to which charter schools crowd out private
schools in the market. I find evidence that charter and private schools compete for student
enrollment, and as charter schools remain in the market, the quantity of private schools
decreases.

Acknowledgements
I would first like to acknowledge my advisor, Dr. Jay Greene, and my other dissertation
committee members, Dr. Patrick Wolf and Dr. Robert Costrell, whose guidance and insight over
the last four years has been invaluable. This work would not be possible without their support. I
would also like to acknowledge my coauthors, Dr. Angela Watson, Molly Beck, and Dr.
Jonathan Mills, who have greatly contributed to this work. Furthermore, I want to acknowledge
Laura Florick, who has expertly managed our longitudinal arts field trip experiment, along with
our research partners at The Woodruff Arts Center who are dedicated to improving students’
lives and who have been incredible partners. Additionally, I am grateful for the faculty and the
staff in the Department of Education Reform for their excellent training and encouragement that
has helped me develop as a researcher.
Finally, I would like to thank my family for their unwavering support and
encouragement. I am most grateful for the never-ending support of my husband, Dane Erickson.
He enthusiastically moved to Arkansas and over the past four years has provided countless
takeout meals, an endless supply of Diet Coke, and a steady foundation that I rely on daily.

Dedication
To my parents, Doug and Erin Holmes, to whom I owe my passion for education and who taught
me to seek after truth.

Table of Contents
Introduction ................................................................................................................................... 1
References ................................................................................................................................... 7
Chapter 1: Does Art Make You Smart? A Longitudinal Experiment of the Effects of
Multiple Arts-Focused Field Trips .............................................................................................. 9
Introduction ................................................................................................................................. 9
Previous Literature .................................................................................................................... 11
Research Question and Hypotheses .......................................................................................... 14
Study Design ............................................................................................................................. 15
Results ....................................................................................................................................... 23
Discussion ................................................................................................................................. 27
Conclusion ................................................................................................................................ 29
References ................................................................................................................................. 30
Chapter 2: The Effect of the Louisiana Scholarship Program on College Entrance ........... 32
Introduction ............................................................................................................................... 32
Louisiana Scholarship Program Description ............................................................................ 34
Literature Overview .................................................................................................................. 34
Research Methodology ............................................................................................................. 43
Results ....................................................................................................................................... 50
Discussion ................................................................................................................................. 54
Conclusion ................................................................................................................................ 57
References ................................................................................................................................. 59
Chapter 3: Who Wins in School Choice? Evaluating the Impact of Charter Schools on the
Market Share of Private Schools ............................................................................................... 64
Introduction ............................................................................................................................... 64
Research Question and Theory ................................................................................................. 66
Previous Literature .................................................................................................................... 70
Research Methodology ............................................................................................................. 72
Results ....................................................................................................................................... 75
Discussion ................................................................................................................................. 81
Conclusion ................................................................................................................................ 84
References ................................................................................................................................. 86
Conclusion ................................................................................................................................... 89
Institutional Review Board Approvals ..................................................................................... 92

List of Published Papers
Erickson, H. H., Greene, J. P., Watson, A. R., & Beck, M. I. (2019). Does Art Make You Smart?
A Longitudinal Experiment of the Effects of Multiple Arts-Focused Field Trips. EDRE
Working Paper no. 2019-05. Social Science Research Network (Chapter 1 of this
dissertation).
Erickson, H. H, Mills, J.N., & Wolf, P.J. (2019, April). The Effect of the Louisiana Scholarship
Program on College Entrance. EDRE working paper no. 2019-12. Social Science
Research Network. (Chapter 2 of this dissertation)

1
Introduction
Ever since the Nation at Risk report was published in 1983 under President Ronald
Reagan’s administration, education reform has been a hotly debated topic at all levels of
government. The report declared that American students were falling behind students in other
nations and that a tide of mediocrity was sweeping through the United States (Gardner et al.,
1983). As a result, politicians, activists, and parents fearing that the United States would lose its
economic standing in the world, called for higher standards and greater accountability at all
levels of public education. Since the report’s release, the demand for greater accountability has
continued until today and remains central to education policy debates. President George W. Bush
implemented the first substantial federal accountability program, No Child Left Behind (NCLB),
in 2002. NCLB mandated that states administer tests in grades three through eight with the hope
of holding schools accountable for student test scores and ensuring that students, especially
minority and economically disadvantaged students, made adequate yearly progress. If schools
failed to meet set standards, they faced threats of sanctions. While it is unclear the extent to
which schools actually experienced sanctions, NCLB significantly changed the schooling climate
where administrators and teachers felt great pressure to improve students’ test scores (Reback,
Rockoff & Schwartz, 2014; Ladd, 2017). In an attempt to enhance federal accountability policy,
President Barack Obama replaced NCLB with the Every Student Succeeds Act (ESSA) in 2015.
ESSA allows states to design the specific features of their accountability systems, but the law
still requires states to administer tests in grades three through eight. While states have slightly
more flexibility, student test scores remain the primary focus.
As a result of increased federal involvement in school accountability policy,
policymakers and schools have intensely focused on improving student test scores.
Unintentionally, test-based accountability incentivized schools to narrow their curriculum in

2
order to increase instructional time as well as time dedicated to test preparation in the hope of
meeting accountability metrics (Greene; 2017; Ladd, 2017). Because of the increased emphasis
on test scores, there is great political pressure to make policy decisions regarding implementing,
sustaining, expanding, and discontinuing various education programs on a program’s ability to
increase test scores. Despite the attention to test scores by policy makers, few parents believe
that test scores are the only, or even the most important measure of educational success (DiPerna
& Catt, 2016; Erickson, 2017; Glazerman & Dotter, 2016; Hastings, Kane, & Staiger, 2005).
Most families want an education for their children that does not simply teach students reading
and math skills, but which also provides a safe learning environment where students learn
citizenship, perseverance, and creativity, as well as expose them to a world beyond what they
already know. But, due to high-stakes, test-based accountability, many of the other values that
schools provide are not frequently considered when evaluating educational policies, which leads
to a narrow understand of how and what programs impact students. I do not intend to say that
test scores are not an important measure of educational success, student academic achievement is
an important outcome, but a hyper sensitivity to test scores comes at the expense of other
important educational inputs and outcomes.
In this dissertation, I evaluate programs and focus on student outcomes that have not been
commonly considered during the high-stakes accountability era. These programs can impact
students’ success during and after their K-12 schooling and have widespread policy implications
for the education system. Chapter 1 evaluates the benefits of culturally enriching field trips and
how these field trips affect students’ engagement in school as well as future academic outcomes.
Field trips are a long-standing tradition in schools that serve to enrich students’ learning and to
expose them to a broader world. However, there is evidence that such field trips are declining in

3
part due to accountability pressures (Gadsden, 2008; Government Accountability, 2009; Rabkin
& Hedberg, 2011). Schools, particularly low performing schools and those in high poverty areas,
instead choose to increase instructional time in math and reading in the hopes of boosting test
scores. This additional seat time comes at the expense of other subjects and supplemental
educational activities. Unfortunately, there is limited rigorous research on the benefits of field
trips. I, along with my colleagues, seek to understand these benefits by conducting, what is to our
knowledge, the first ever longitudinal experiment of arts-related field trips. In collaboration with
the Woodruff Arts Center in Atlanta, Georgia and a nearby, large urban school district, we
randomly assigned fourth and fifth grade students to receive three arts-related field trips or to
serve as a control. The Woodruff Arts Center is a world class arts center that offers premier
facilities and award-winning theater productions and concerts that are of the highest professional
quality. Treatment students receive a field trip to the Alliance Theatre, the Atlanta Symphony
Orchestra, and the High Museum of Art, while the control group receives business as usual,
which could be one field trip to various locations around Atlanta. We then measure the effect of
the field trips on a variety of student outcomes. Surprisingly, we find that treatment students in
the first cohort experience gains on their math and English Language Arts (ELA) end-of-year test
scores. This finding was contrary to our original hypothesis since we expected to see no
substantial test score gains. We believe that the test score gains may be a result of increased
school engagement because we also find that treatment students report enjoying attending school
more and have fewer reported behavioral infractions than their control counterparts. It is clear
that attending three arts related fieldtrip throughout the year did not diminish student test scores,
but instead could potentially increase test scores, as well as increase student engagement. As

4
such, the practice of reducing field trips due to accountability pressures is perhaps unnecessary
and attending field trips may instead improve students’ academic outcomes.
Chapter 2 is an evaluation of the Louisiana Scholarship Program’s (LSP) effect on
college entrance. The LSP is a private school voucher program that provides government
financial aid to low-income families to attend a private school of their choice. There is a vast
amount of school choice research that evaluates the effect of a program on students’ academic
achievement; however, there is less known regarding the impacts school choice programs have
on students’ post-secondary outcomes. Much of the policy discussion surrounding school choice
focuses on whether or not programs are successful at increasing students’ test scores.
Policymakers face significant political pressure to discontinue programs that do not improve test
scores. However, it is not clear if school choice programs affect student achievement and longer-
term outcomes such as high school graduation and college entrance rates in the same way.
In the school choice literature, there is a growing disconnect between a program’s effect
on student achievement and later educational attainment (Hitt, McShane, & Wolf, 2018). For
example, some choice programs, especially charter schools, have shown large significant test
score gains but null or even negative effects on post-secondary outcomes. The opposite is true
with other programs, particularly private school choice programs, demonstrating no significant
effect on test scores, but large effects on high school graduation rates. When policy decisions are
made based on test score results exclusively, the programs that have less impact on test scores
face being discontinued despite improving students’ longer-term outcomes. In previous
evaluations, the LSP has shown large negative effects on students’ math and reading test scores
(Mills & Wolf, 2019). However, in this study using an experimental design, we find no
significant effect on the likelihood that students who use a scholarship enroll in college at any

5
different rate than do their control counterparts. Our findings elicit many questions regarding
how to evaluate programs and whether or not to maintain or discontinue the LSP. What is clear is
that test scores and other outcomes are not always correlated and making significant policy
decisions based solely on test scores provides a limited perspective on the varied impacts of a
program.
Chapter 3 takes a broader approach to program evaluation and analyzes how charter
schools impact the supply of private schools. While most of the school choice literature focuses
on measuring participant effects, school choice programs can have significant impacts on the
entire education system. Traditional public, charter, and private schools all play an important role
in the K-12 schooling market. It is important to understand how one schooling sector affects
others as a change in the supply of schools in one sector can impact the supply and quality of
schools in another. Charter schools have grown quickly and expanded across the United States
since they were first introduced in 1991. As of 2018, only seven states did not have a charter law.
Charter schools offer a cost-free alternative to families who have been paying a premium for
private schools. As such, families are likely to leave private schools for charters when new
schools open. Using nation-wide panel data, I evaluate the extent to which charter schools affect
the market share of private schools. I specially look at the effect that charter schools have on
private school student enrollment as well as the number of private schools. I find that as charter
school enrollment increases in a specific county, private school enrollment and the number of
private schools in that county decreases. These findings have broad policy implications because
they demonstrate that there is a demand for alternative schooling options and that some families
prefer charter schools over traditional public schools. These findings also have significant
financial implications because as more students leave the private sector and enter public schools,

6
public education funds are spread among more students, lowering per-student spending overall.
This study illustrates the importance of considering the systemic impacts of programs because a
change in one sector can have substantial ramifications on the entire education system.
Overall, this dissertation demonstrates the need to think broadly about how educational
policies affect students and the education system as a whole. As a result of the test-based
accountability era, schools have increased instruction in core subjects at the expense of thinning
their overall curriculum. Research on various educational programs has also focused primarily
on measuring the impact programs have on student academic achievement. However, as
illustrated in the following three chapters, test scores give an important, yet narrow view on how
programs affect students and the education system. In Chapter 1, we find evidence that students
who were randomly assigned to receive multiple culturally enriching field trips were more
engaged in school and they scored higher on their end-of-year exams than did control students.
These findings question the efficacy of schools increasing traditional classroom instruction at the
cost of reducing the number of extracurricular activities such as field trips. In Chapter 2, we find
that the Louisiana Scholarship Program had no significant effect on the likelihood of students
enrolling in college. This finding is particularly interesting given the large, negative effect the
program had on student test scores. This chapter demonstrates the importance of considering
long-term student outcomes such as college entrance when evaluating policies. The final chapter
broadens the literature on school choice by focusing on the systemic effects created by charter
schools. I find that charter schools draw a significant amount of enrollment from nearby private
schools and that over time, the number of private schools actually decreases to adjust for
declining enrollment. These findings have significant implications for state and local education
resources.

7
References
DiPerna, P. & Catt, A. D. (2016). 2016 Schooling in America survey: Public opinion on K-12
Education and school choice. Edchoice, Polling Paper no. 28. Retrieved from
https://www.edchoice.org/research/2016-schooling-america-survey/.
Erickson, H. H. (2017). How do parents choose schools, and what schools do they choose? A
literature review of private school choice programs in the United States. Journal of
School Choice, 11(4), 491-506.
Gadsden, V. (2008). The arts and education: Knowledge generation, pedagogy, and the discourse
of learning. Review of Research in Education, 32(1), 29-61.
Gardner, D. P., Larsen, Y. W., Baker, W., Campbell, A., & Crosby, E. A. (1983). A nation at
risk: The imperative for educational reform. Washington, DC: United States Department
of Education.
Glazerman, S., & Dotter, D. (2016). Market Signals: How Do DC Parents Rank Schools, and
What Does It Mean for Policy? Policy Brief. Mathematica Policy Research, Inc.
Government Accountability Office (2009). Access to arts education: Inclusion of additional
questions in education’s planned research would help explain why instruction time has
decreased for some students. Report to Congressional Requesters. February, GAO-09-
286. Retrieved from https://www.gao.gov/new.items/d09286.pdf.
Greene, J. P. (2017). Futile accountability systems should be abandoned. Education Next, 17(3),
51-54.
Hastings, J. S., Kane, T. J., & Staiger, D. O. (2005). Parental preferences and school
competition: Evidence from a public school choice program (No. w11805). National
Bureau of Economic Research.
Hitt, C., McShane, M. Q., & Wolf, P. J. (2018). Do impacts on test scores even matter? Lessons
from long-run outcomes in school choice research. American Enterprise Institute.
Retrieved from http://www. aei. org/publication/do-impacts-on-test-scores-even-
matterlessons-from-long-run-outcomes-in-school-choice-research.
Ladd, H. F. (2017). No Child Left Behind: A deeply flawed federal policy. Journal of Policy
Analysis and Management, 36(2), 461-469.
Mills, J.N., & Wolf, P.J. (2019). The effects of the Louisiana Scholarship Program on student
achievement after four years. EDRE working paper no. 2019-10. Social Science Research
Network, April 23.
Rabkin, N., & Hedberg, E. (2011). Arts education in America: What the declines mean for arts
participation. National Endowment for the Arts, Research Report #52.

8
Reback, R., Rockoff, J., & Schwartz, H. L. (2014). Under pressure: Job security, resource
allocation, and productivity in schools under No Child Left Behind. American Economic
Journal: Economic Policy, 6(3), 207-41.

9
Chapter 1: Does Art Make You Smart? A Longitudinal Experiment of the Effects of
Multiple Arts-Focused Field Trips1
Introduction
In this paper we estimate the causal effects of culturally enriching field trips on students’
academic performance and school engagement. Such field trips are a long-standing tradition in
schools. There are many potential benefits for students from attending culturally enriching field
trips. Field trips to cultural institutions, particularly arts institutions, expose students to new
ideas, places, and cultures while providing opportunities to deepen learning outside of the
traditional classroom. Arts institutions provide meaningful opportunities not only to see, hear,
and discuss works of arts, but expose students to a world beyond what they know. Many
students, especially in low-income areas, experience little beyond their homes, neighborhoods,
and schools. Field trips can vastly expand what children experience as part of their schooling.
Field trips to cultural institutions such as art museums and theaters continue mostly due to the
wisdom of educators and historical tradition. However, in recent decades, institutions such as arts
venues, science museums, and zoos have noticed a decline in field trip attendance (Ellerson &
McCord, 2009; Greene, Kisida, & Bowen, 2014). Teachers and students also reported a decline
in school sponsored field trips (Government Accountability Office, 2009; Keiper et al., 2009).
Some evidence suggests that schools are reducing the number of field trips due to
increased pressure from high-stakes accountability (Gadsden, 2008; Government Accountability,
2009; Rabkin & Hedberg, 2011). Under test-based accountability systems schools are under
pressure to reconsider the costs and benefits of traditional educational field trips as they focus on
increasing math and reading test scores (Gadsden, 2008; Rabkin & Hedberg, 2011; Student
Youth & Travel Association, 2016). Responding to these pressures, schools allocate additional
1 This paper was co-authored with Jay P. Greene, Angela R. Watson, and Molly I. Beck

10
time to instruction, specifically in math and reading, and test preparation while cutting back on
non-tested subjects and other activities such as field trips. Notably, academically low-performing
schools that serve students from high-poverty areas are more likely to report a decline in school-
sponsored field trips, including arts-focused trips (Government Accountability Office, 2009;
Keiper et al., 2009). These schools also face the greatest accountability pressures. A decline in
field trips in high-poverty areas is especially concerning as field trips can provide equitable
access to cultural institutions for students across various economic and racial groups.
Unfortunately, there is little systematic evidence on the value of cultural field trips for
students. However, foregoing field trips could have unintended consequences for students as
time in school is allocated to other academic activities in hopes of increasing student test scores.
We seek to increase the literature on the impacts of field trips with the goal of better
understanding the benefits for students and what might be lost if schools continue to decrease
such activities. We expand the literature on the educational benefits of field trips by conducting,
to our knowledge, the first-ever multi-visit, longitudinal experiment to estimate these effects. We
randomly assign fourth and fifth grade students in ten elementary schools in a large urban school
district to receive multiple arts-related field trips throughout the school year or to serve as a
control group. This paper presents the results from the second year of the study. Our findings
show significant educational benefits for students who attend arts-related field trips. We find that
treatment students exhibit higher levels of school engagement. Surprisingly and contrary to our
hypothesis, we find that treatment students also perform significantly better on their end-of-year
standardized tests, and that this effect is persistent one year after treatment. These effects appear
to be stronger for the first cohort of students in our sample.

11
The paper proceeds as follows. First, we discuss the previous literature on the impact of
field trips and arts exposure for students. Second, we present our research questions and describe
the study design. We then present our results and conclude with discussing policy implications
and future research.
Previous Literature
Despite the educational tradition of fieldtrips, there is limited rigorous research
evaluating the effects students experience from such activities. We draw on the literature
evaluating the benefits of arts education as well as research on specific field trips. We group the
literature based on research design pulling from both observational and experimental designs.
Observational Studies
There are a handful of observational studies focusing on the value of the arts for students’
academic and social development. Longitudinal studies find positive correlations between arts
exposure and academic outcomes (Ruppert, 2006; Lacoe, Painter, & Williams, 2016). Jægar and
Møllegarrd (2017), comparing identical twins, find that children who frequent museums,
theaters, and musical performances when they are younger also perform better in school when
they are teenagers. Notably, a recent meta-analysis on the effects of student achievement from
arts integration programs finds a four-percentage point increase in achievement (Ludwig, Boyle,
& Lindsay, 2017). While a four-percentage point increase reflects significant academic gains, the
authors warn against causal interpretation as none of the studies in the meta-analysis were able to
establish a causal connection between arts activities and academic performance. Further, Lacoe,
Painter, & Williams (2016) evaluate an arts integration program and find evidence that the
dosage of exposure is important; students who receive longer and more intensive dosages

12
experience larger academic gains and fewer school suspensions. However, they also find
diminishing effects once treatment ceases.
Other research has found social and emotional benefits from exposure to the arts. A
recent study looking at single-visit art museum field trips finds that students experience increases
in critical thinking, creative thinking, and human connection (Randi Korn & Associates, 2018).
Human connection is defined as an awareness or sense of connection to others and the self and is
similar to the construct of social perspective taking (Gehlbach, Brinkworth, & Wang, 2012;
Greene et al., 2018). In addition to a single art museum visit, the study adds a second treatment
condition of a near identical arts program that takes place in a classroom instead of in the
museum. The authors find that the in-gallery experience appears to be more impactful than
simply seeing and discussing identical art content at school (Randi Korn & Associates, 2018).
Experimental Studies
Fortunately, there is a growing, yet still limited, body of literature on the causal effects
for students from arts integration and specifically, arts-related field trips. A study of a district-
wide arts enrichment program where, due to budget constraints, schools were randomly chosen
to participate, shows positive outcomes on students’ compassion for others, school engagement,
as well as increased standardized test scores (Bowen & Kisida, 2019). Greene, Kisida, and
Bowen (2014) experimentally evaluate the effects of a single visit to an art museum on student
outcomes and find that students who tour an art museum demonstrate a host of significant
benefits when measured nearly two months after the visit occurs. Treatment students are more
likely to report a greater desire to consume art in the future and actually visit the same art
museum on their own following the field trip (Kisida, Greene, & Bowen, 2014). In addition,
there is evidence that treatment students demonstrate increased levels of critical thinking skills,

13
as well as increased tolerance, content knowledge, and historical empathy (Bowen, Greene, &
Kisida, 2014; Greene, Kisida, & Bowen, 2014). Further, these benefits appear stronger for
students from low socioeconomic backgrounds.
In a similar experimental study evaluating the effects of attending field trips to see live
theater performances, students demonstrate higher levels of tolerance, social perspective taking,
and evidence of increasing desire to consume theater in the future (Greene, et al., 2015; Greene
et al., 2018). Particularly interesting, Greene et al. (2018) adds a second treatment condition
wherein some students receive a field trip to a live theater performance, some receive a field trip
to see a movie of the same play, and the control group remains at school and receives neither the
play nor the movie treatment. Students who view the live theater performance demonstrate
higher levels of tolerance, social perspective taking, and content knowledge compared to the
students who viewed a movie of the same play.
Our current study adds to the existing literature on the benefits of culturally enriching
field trips in four ways. First, we use an experimental design that allows us to capture the causal
effects on students from attending field trips. Second, where most of the previous literature
focuses on the effects from attending one field trip, treatment students in this study attend three
different arts-related field trips: an art museum, live theater, and the symphony. Third, this study
takes place in a large urban city, and the participating schools consist primarily of students of
color who are from economically disadvantaged backgrounds. Much of the existing research was
conducted in suburban and rural areas. Fourth, this study is the first longitudinal experiment
where we collect both survey and administrative data for students in our sample.

14
Research Question and Hypotheses
This paper examines whether attending multiple arts-focused field trips throughout the
school year improves students’ engagement in school and affects their academic performance.
We measure the effect of receiving three field trips in one year, six field trips over two years, and
the effect one year following treatment. We set the following hypotheses:
H1: We expect that treatment students will demonstrate higher levels of school
engagement.
H1a: We expect treatment students to report higher levels of school engagement
through self-reported measures on surveys than their control counterparts.
H1b: We also expect treatment students to have fewer behavioral infractions
throughout the school year than their control counterparts.
H2: We expect to find no statistically significant treatment effect on students’ end of year
standardized test scores.
We hypothesize that treatment students will demonstrate higher levels of school
engagement by spending time away from traditional instruction and being exposed to new ideas
and art forms with which they are unfamiliar. Exposing students to new ideas sparks their
creativity and desire to learn. When students are excited about a certain subject or idea, they are
naturally more engaged in school. It is also possible, that simply providing a break from
traditional instruction motivates and refreshes students so that they enjoy school more. There is
not a comprehensive measure of school engagement; we use a self-reported and behavioral
measure to capture students’ engagement. First, we use students’ self-reports on how boring they
believe school is. Second, we use the number of infractions a student receives in a year. Students
who are engaged in school are less likely to act out. Using both self-reported and behavioral
measures provides a good proxy for students’ engagement in school.

15
While field trips can expose students to arts and provide a unique learning environment,
it is unlikely that three arts-related trips will significantly affect students’ academic performance
on math or reading exams. Three days away from traditional instruction is unlikely to harm
student achievement nor provide enough content to improve test scores. While some previous
studies have found positive effects on students’ academic performance from arts exposure, these
studies have evaluated more intensive arts integrations programs. We are evaluating a less
intensive program of only arts-related field trips. As such, we expect to find no significant
difference between treatment and control students’ test scores.
Study Design
In partnership with The Woodruff Arts Center in Atlanta, Georgia and a large urban
school district, we randomly assign fourth and fifth grade classes within ten elementary schools
to receive a field trip to each of the three Woodruff arts partners, the Alliance Theatre, the
Atlanta Symphony Orchestra, and the High Museum of Art, or to serve as a control group. The
Woodruff Arts Center is a world-class center that offers some of the nation's leading exhibits and
facilities. The three high-quality field trips, all part of the otherwise existing educational
programming at each venue, are carefully designed for maximum impact and cultural relevancy.
The hour-long Alliance Theatre performance is designed for children and families and performed
by a professional cast and is of the highest artistic quality. A trained volunteer docent leads the
hour-long High Museum of Art’s program featuring several works of art followed by an hour-
long hands-on studio experience led by a teaching artist. Finally, the Atlanta Symphony
Orchestra fills their 1,700-seat facility for an hour-long concert with a full symphony performing
music carefully selected for younger audiences and accented with large-screen video descriptions
and images.

16
In the first year of the study there were four participating schools, and in year two six
additional schools were included for a total of ten schools. Randomization occurred within
schools between the fourth and fifth grade. We ensured that we had equal numbers of fourth and
fifth grades that were assigned to treatment and control. For example, in the first year of the
study with four participating schools, two schools had fourth grade receive treatment and fifth
grade serve as a control; while the other two schools had fifth grade receive treatment and fourth
grade serve as a control. Treatment students who were in fourth grade in the first year received
an additional year of treatment when they were in fifth grade the following year. Table 1 shows
treatment assignment in year two for each school and grade. In year two, we are able to estimate
the effect of three field trips in one year, six field trips in two years, and the effect of three field
trips a year following the treatment.

17
Table 1: Treatment Assignment by Cohort in Year 2
School 1 School 5
4th Treatment 4th Treatment
5th Control 5th Control
6th Treatment- year post treatment School 6
School 2 4th Treatment
4th Treatment 5th Control
5th Control School 7
6th Treatment- year post treatment 4th Treatment
School 3 5th Control
4th Control School 8
5th Treatment- double dose 4th Control
6th Control 5th Treatment
School 4 School 9
4th Control 4th Control
5th Treatment- double dose 5th Treatment
6th Control School 10
4th Control
Cohort 1 Cohort 2 5th Treatment
Randomization occurred within schools between 4th and 5th grades. Students in 6th grade
from schools 1 and 2 were randomly assigned to treatment when they were in 5th grade in
year one of the study. As such, in year two they are one year post treatment. Students in 5th
grade in schools 3 and 4 were randomly assigned to treatment when they were in 4th grade in
year one of the study. As such, in year two they receive an additional dose of treatment for a
total of 6 field trips.
Ideally, we would prefer to randomize individual students to the treatment or control
group; however, it is logistically difficult to take a mix of fourth and fifth grade students from
different classes and schools on three field trips throughout the year. We wanted to minimize the
administrative burden on the schools and create minimal disruption to their normal schedules. It
was easier on schools and more efficient for entire grades within a school to attend the field trips.
We believe that our design remains a rigorous experiment because participating students are very
similar to each other prior to randomization, therefore increasing the probability of having
similar treatment and control groups. First, all the schools are in the same large urban school
district. The ten elementary schools are all near each other and feed into two neighboring middle

18
schools. Second, the ten schools all serve very similar student populations. Students live in a
large, urban area and are primarily students of color and the majority qualify for free or reduced-
price lunch (FRL). Third, fourth and fifth grade students in the same schools are relatively
similar to each other. The primary reason students are either in fourth or fifth grade is their
birthday. We also believe that arts-related field trips are unlikely to affect fourth grade students
in a significantly different way than fifth grade students in the same school. If, by chance, there
are significant differences between fourth and fifth graders, our design accounts for the
differences by ensuring a balance of fourth and fifth grades across the treatment and control
groups.
Following randomization, our research team surveyed all students at the beginning of the
school year. The treatment group then attended the three field trips throughout the course of the
school year. It is important to note that the treatment consisted of the three field trips and one day
of professional development for teachers in treatment grades conducted by The Woodruff Arts
Center. Any supplementary activities either before or following any of the field trips were done
at the discretion of the teacher or school. The control group received business as usual which
could have been up to one field trip to various locations in Atlanta throughout the school year.
Our team then administered post surveys near the end of the school year following the end-of-
grade exams. We also received administrative data from the school district for all students in the
year prior to them entering the study and each year following.
Sample and Data
Our sample consists of just under 1,400 students who are 10.5 years old on average. Over
90% of the students in our sample identify as black or African American. We do not report the
percent of students who qualify for FRL because the majority of schools in our sample record all

19
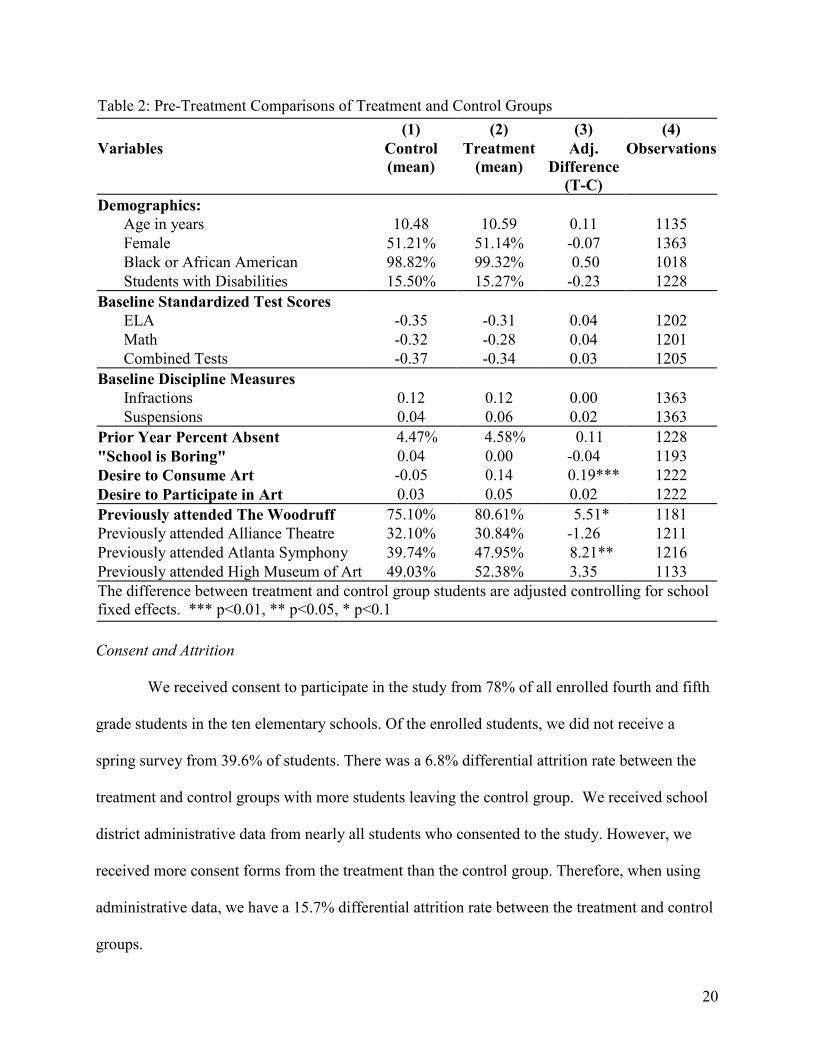
students as qualifying for FRL. Table 2 includes demographic and pre-treatment measures for
treatment and control groups separately.
Our treatment and control groups are statistically similar to each other at baseline on key
measures such as demographics, special education status, test scores, discipline measures, and
school attendance (Table 2, Column 3). Most of these measures come from administrative data
provided by the school district. There are some statistically significant differences between the
treatment and control groups on pre-treatment survey measures. Treatment students report
greater desires to consume art in the future (Table 2, Column 3). However, we believe these
differences are due to teachers priming treatment students prior to our pre-treatment surveys and
are not due to underlying differences between the two groups. Teachers were aware of their
class’ treatment assignment prior to surveying due to scheduling constraints. Many teachers told
the students before beginning the survey that they were going to attend various field trips
throughout the year and discussed the importance of museums and theaters prior to survey
administration. We believe these differences reflect some effect of the treatment if students
exhibit interest in the arts when they simply anticipate attending the given institutions. We
controlled for baseline desire to consume art in our analysis and it does not affect our outcomes
of interest in any significant ways.
20
Table 2: Pre-Treatment Comparisons of Treatment and Control Groups
(1) (2) (3) (4)
Variables Control
(mean)
Treatment
(mean)
Adj.
Difference
(T-C)
Observations
Demographics:
Age in years 10.48 10.59 0.11 1135
Female 51.21% 51.14% -0.07 1363
Black or African American 98.82% 99.32% 0.50 1018
Students with Disabilities 15.50% 15.27% -0.23 1228
Baseline Standardized Test Scores
ELA -0.35 -0.31 0.04 1202
Math -0.32 -0.28 0.04 1201
Combined Tests -0.37 -0.34 0.03 1205
Baseline Discipline Measures
Infractions 0.12 0.12 0.00 1363
Suspensions 0.04 0.06 0.02 1363
Prior Year Percent Absent 4.47% 4.58% 0.11 1228
"School is Boring" 0.04 0.00 -0.04 1193
Desire to Consume Art -0.05 0.14 0.19*** 1222
Desire to Participate in Art 0.03 0.05 0.02 1222
Previously attended The Woodruff 75.10% 80.61% 5.51* 1181
Previously attended Alliance Theatre 32.10% 30.84% -1.26 1211
Previously attended Atlanta Symphony 39.74% 47.95% 8.21** 1216
Previously attended High Museum of Art 49.03% 52.38% 3.35 1133
The difference between treatment and control group students are adjusted controlling for school
fixed effects. *** p<0.01, ** p<0.05, * p<0.1
Consent and Attrition
We received consent to participate in the study from 78% of all enrolled fourth and fifth
grade students in the ten elementary schools. Of the enrolled students, we did not receive a
spring survey from 39.6% of students. There was a 6.8% differential attrition rate between the
treatment and control groups with more students leaving the control group. We received school
district administrative data from nearly all students who consented to the study. However, we
received more consent forms from the treatment than the control group. Therefore, when using
administrative data, we have a 15.7% differential attrition rate between the treatment and control
groups.

21
When using only survey data, the overall and differential attrition rates fall within the
What Works Clearinghouse tolerable threat of bias under optimistic assumptions (What Works
Clearinghouse). We believe the optimistic assumptions are appropriate for this study because it is
unlikely that treatment status affects the attrition of a student from our sample. Students in our
sample are a highly mobile population and movement within the year is fairly common as seen in
the overall attrition rate.
When district administrative data is included, however, we have a higher threat of bias
under the What Works Clearinghouse guidelines. The administrative data has significant
benefits, despite the high differential attrition between the treatment and control groups.
Administrative data provides data on students who leave their original school but stay within the
district. It also provides a rich set of control and outcome variables of interest. Unfortunately,
issues with consent and attrition are common in field work. As a robustness check, we ran our
analysis with administrative data limiting it to students who have spring surveys. All effects
remain in the same direction and are typically stronger in magnitude and statistically significant
at higher confidence levels when just using students with survey and administrative data. In this
paper, we present the analysis that includes all students from whom we received administrative
data.
Outcome Measures
In this paper we focus on the effects field trips have on students’ academic performance
and school engagement. To measure academic performance, we use a composite math and
English language arts (ELA) score on the Georgia Milestones end-of-grade exams. The Georgia
Milestones are given to all public school students in the state starting in third grade and the exam
scores are used in Georgia's accountability system. In our analysis, we include baseline test

22
scores which are from the school year prior to treatment2. All test scores are standardized within
grade level and presented in standard deviation effect sizes.
To measure school engagement, we use the number of infractions a student receives
during the school year as well as the student’s self-reported responses of how boring school is. In
the district administrative data, we are able to see every time a student is written up for a
behavioral infraction. We use the number of infractions during the treatment year as our outcome
variable and control for the number of infractions in the prior year. For student self-reports,
students indicate how much they agree with the statement “School is boring” on a five-point
scale from disagree a lot to agree a lot. We control for pre-treatment responses to the same
statement. All pre- and post-treatment responses are standardized. We recognize that these two
measures do not capture all forms of student engagement, but believe they capture important
elements of school engagement.
Analyses
Due to the randomized field trial design, which generates similar treatment and control
groups, we use a straightforward analytic approach to estimate the causal effect of attending arts-
related field trips on students’ academic performance and school engagement. Our technique
estimates mean differences between the treatment and control groups using the following
equation for outcome 𝑌 for student i in school s:
𝑌𝑖𝑠 = 𝛽0 + 𝛽11𝑇𝑟𝑒𝑎𝑡𝑖𝑠 + 𝛽22𝑇𝑟𝑒𝑎𝑡𝑖𝑠 + 𝛽3𝑃𝑇𝑟𝑒𝑎𝑡𝑖𝑠 + 𝛽4𝐵𝑎𝑠𝑒𝑙𝑖𝑛𝑒𝑖𝑠 + 𝑋𝑖𝛽5 + 𝜃𝑠 +
𝛼𝑖 + 휀𝑖𝑠
2 For our baseline test score measure, we use a combined standardized score of all Georgia Milestone exams a
student took in the year prior to a treatment. All students took the math and ELA milestone while some students also
took the science and social studies exams.

23
Where 1𝑇𝑟𝑒𝑎𝑡 is a binary variable equal to 1 if a student receives one dosage of treatment,
2𝑇𝑟𝑒𝑎𝑡 is equal to 1 if a student receives a second dosage of treatment, and 𝑃𝑇𝑟𝑒𝑎𝑡 is equal to 1
if a student receives treatment in the prior year. In order to increase the precision of our
estimates, we include baseline measures of the outcome, 𝐵𝑎𝑠𝑒𝑙𝑖𝑛𝑒, and a vector of student
characteristics, 𝑋, which includes binary variables for a student’s gender and if the student is in
sixth grade. Because randomization occurred within schools, 𝜃 is a fixed effect for each school,
which effectively compares treatment and control students within the same school instead of
across schools. We also include student random effects, 𝛼, to account for correlation between a
student’s error over the two years. It is important to note that we have an unbalanced panel data
set where cohort one students appear in year one and year two, and cohort two students only
appear in year two. We believe random effects are appropriate because we are correcting for
student errors correlated over time and not trying to account for potential endogeneity where
fixed effects would be more appropriate. Finally, 휀 is the stochastic error term clustered at the
teacher level to account for spatial correction from students in the same classroom.
Results
Student Academic Performance
As reflected in Table 3, receiving the opportunity to attend three field trips has a
marginally statistically significant effect at the 90% confidence level on students’ math and ELA
test scores the year following treatment. Receiving treatment in a prior year leads to a 0.12
standard deviation increase in the following year test scores. However, the effect on test scores
varies when looking at cohorts one and two separately. Cohort one students who receive the first
dosage of treatment experience a statistically significant 0.15 standard deviation increase in test
scores compared to their control counterparts. This effect is significant at the 95% confidence

24
level. The effect persists a year after treatment, where treatment students score 0.13 standard
deviations higher than control students. The effect slightly increases with a second dosage of
treatment, where treatment students score 0.17 standard deviations higher than control students;
however, it is only statistically significant at the 90% confidence level. These effects do not
appear for cohort two students.
Table 3: Treatment Effect on End of Grade Math and ELA Tests
Combined Cohort 1 Cohort 2
1st Treatment 0.06 0.154** 0.027
(0.042) (0.068) (0.057)
2nd Treatment 0.06 0.166*
(0.092) (0.09)
Previous Treatment 0.119* 0.128**
(0.066) (0.064)
Pre-Composite Test Score 0.857*** 0.858*** 0.850***
(0.018) (0.024) (0.021)
Female 0.008 0.05 -0.007
(0.035) (0.051) (0.031)
Grade 6 -0.022 0.038
(0.04) (0.044)
Observations (N) 1,493 817 889
Number of Students 1,130 454 889
Fixed effects for the ten elementary schools and student random effects are included in each
model. Standard errors clustered at the teacher level are in parentheses. Observations refer to
the number of observations in the panel. Number of students refers to the number of unique
students in the sample *** p<0.01, ** p<0.05, * p<0.1
Student School Engagement
As reflected in Table 4, receiving the opportunity to attend three arts-related field trips
significantly increases student engagement a year following treatment when measured by the
number of disciplinary infractions and self-reports. Treatment students have 0.6 fewer infractions
than their control counterparts in a year after treatment. This effect is significant at the 95%
confidence level. They also reported that school was less boring by 0.33 standard deviations;
however, this effect is only significant at the 90% confidence level. These effects are solely

25
found for previously treated students in cohort one, but it is important to note that only cohort
one students have been in the study for two consecutive years.

26
Table 4: Treatment Effect on School Engagement Measures
Number of Infractions "School is Boring"
Combined Cohort 1 Cohort 2 Combined Cohort 1 Cohort 2
1st Treatment 0.049 0.037 0.072 0.00 -0.06 0.07
(0.05) (0.076) (0.078) (0.079) (0.102) (0.109)
2nd Treatment -0.011 0.024 0.084 0.088
(0.103) (0.109) (0.115) (0.137)
Previous Treatment -0.570** -0.622*** -0.327* -0.425**
(-0.24) (0.222) (-0.177) (0.17)
Pre-Composite Test -0.159*** -0.171*** -0.111*** 0.001 -0.035 0.00
(0.036) (0.06) (0.035) (0.032) (0.04) (0.042)
Pre-Infraction Count 0.644*** 0.780*** 0.606***
(0.156) (0.23) (0.152)
Pre "School is boring" 0.287*** 0.234*** 0.329***
(0.036) (0.048) (0.04)
Female -0.117** -0.059 -0.161*** -0.110* -0.07 -0.176**
(0.053) (0.079) (0.056) (0.065) (0.103) (0.075)
Grade 6 0.952*** 0.985*** 0.08 0.101
(0.206) (0.189) (0.136) (0.153)
Observations (N) 1,687 964 950 1,176 657 690
Number of Students 1,205 482 950 919 400 690
Fixed effects for the ten elementary schools and student random effects are included in each model. Standard errors
clustered at the teacher level are in parentheses. Observations refer to the number of observations in the panel. Number
of students refers to the number of unique students in the sample *** p<0.01, ** p<0.05, * p<0.1
26

27
Discussion
We present the first experimental evidence on the effects from students attending
multiple arts-related field trips. We find that treatment students received fewer behavioral
infractions and reported that they enjoyed school more than their control counterparts. The
significant effect on behavioral infractions is only present for treatment students a year after
treatment. We believe that we are able to capture this effect due to a structural change between
elementary and middle schools. Previously treated students consist of cohort one students who
were assigned to the treatment group in fifth grade and in the second year of the study are in
sixth grade where they progressed to middle school (see Table 1). Middle schools are more likely
to write-up students for various behavioral infractions than are elementary schools. It is likely
that treatment affects students’ behavior in all grades, but that there is insufficient variation in
student discipline records in elementary school for our models to detect any differences. Despite
data limitations, we find evidence that arts-related field trips significantly reduce the number of
infractions a student receives. These results provide causal evidence of the benefit of field trips
on student behavior.
Contrary to our hypothesis, we find evidence that students in cohort one experienced test
score gains from one and two years of treatment and that the effect persisted a year following
treatment. We expected that treatment would have no significant impact on student test scores.
We believed that three days out of school were unlikely to negatively affect test scores, but at the
same time, three field trips were unlikely to provide enough math or ELA content to significantly
improve scores. There are a few possible explanations for this unexpected result. First, it is
possible that the treatment affects students’ academic performance through school engagement.
We found that treatment students experienced a significant increase in school engagement.

28
Treatment students could have exerted greater effort in their core subjects which then affected
their test scores. Second, it is possible that students learned skills or content from the field trips
that assisted them on their exams. Each of The Woodruff arts partners design their programing
with the Georgia state standards in mind with the goal of connecting students’ experiences to
classroom content. However, this seems less probably given that the field trips were only three
days and unlikely to provide specific content that overlapped with a significant portion of the
standardized tests. The specific mechanisms of how the field trips benefit students is unknown.
The experimental design, while the only method to produce causal results, is, unfortunately, a
black box and does not give any evidence of mediating mechanisms.
It is important to note that the test score effects are primarily for cohort one students.
While there is no clear reason why the treatment affects cohort one and two students differently,
there were a couple disruptions throughout the school year in the year cohort two entered the
study that could affect how the cohorts responded to the treatment. First, in the fall, Hurricane
Irma hit Atlanta and many schools were closed for more than a week due to loss of electricity
and damage to school buildings. Second, later that same year, Atlanta also experienced severe
winter storms resulting in school cancellations and rescheduling one of the three field trips. Both
natural disasters resulted in multiple missed days, and while missing a few days of school is
unlikely to affect test scores, missing multiple days plus the added stress of natural disasters
could offset any test score increases the treatment caused. It is also possible that there are some
underlying differences between cohort one and two students that we are not capturing which
influences the way students respond to the treatment. However, we believe this is less likely as
both cohorts are not statistically different from each other on key demographic and
administrative measures. Whatever the reason for differential effects on cohorts one and two

29
students, it is clear that missing a few days of school to attend field trips does not negatively
impact student test scores. As such, the practice of reducing field trips due to accountability
pressures to allow more time for instruction is not needed, and furthermore, providing students
with experiences outside the classroom may even improve test scores.
Conclusion
We provide the first causal evidence of sustained academic and school engagement
benefits for students from attending culturally enriching field trips. One of the most intriguing
findings is that student test scores are not negatively affecting from missing three days of
instruction and in some cases test scores substantially increase up to 16% of a standard deviation.
Test score gains also remain one year after treatment. These gains are strikingly significant given
that the elementary schools in our sample are generally low performing schools with very few
students performing at grade level. Test score effects are particularly important when considering
accountability policies. Due to increased accountability pressures to improve student test scores,
many schools have opted for additional instructional time in core subjects along with extensive
test preparations at the expense of other activities. However, the evidence presented here
questions how effective these changes may be. While quality instruction and seat time are
important for student academic progress, there are other valuable ways to increase student
learning while also providing opportunities for a broader curriculum.
Many questions remain about the benefits of field trips for students; specifically, if the
academic and school engagement effects we observe will persist multiple years after treatment
and if additional cohorts will experience these same benefits. We hope to be able to answer these
and many other questions in coming years as a third cohort is added, and as we continue to
follow existing students through their middle and high school experiences.

30
References
Bowen, D., Greene, J., & Kisida, B. (2014). Learning to think critically: A visual art experiment.
Educational Researcher, 43(1), 37-44.
Bowen, D., & Kisida, B. (2018). Investigating Causal Effects of Arts Education: Experimental
Evidence from Houston’s Arts Access Initiative. Kinder Institute for Urban Research
7(4). Retrieved from https://kinder.rice.edu/research/investigating-causal-effects-arts-
education-experiences-experimental-evidence-houstons-arts.
Ellerson, N., & McCord, R. (2009). One year later: How the economic downturn continues to
impact school districts. American Association of School Administrators. Retrieved from
at http://www.aasa.org/content.aspx?id=8152.
Gadsden, V. (2008). The arts and education: Knowledge generation, pedagogy, and the discourse
of learning. Review of Research in Education, 32(1), 29-61.
Gehlbach, H., Brinkworth, M., & Wang, M. (2012). The social perspective taking process: What
motivates individuals to take another’s perspective? Teachers College Record, 114, 1-29.
Greene, J. P., Hitt, C., Kraybill, A., & Bogulski, C. A. (2015). Learning from Live
Theater. Education Next, 15(1), 54-61.
Greene, J., Kisida, B., & Bowen, D. (2014). The educational value of field trips. Education Next,
15(1), 78-86.
Greene, J., Erickson, H., Watson, A., & Beck, M. (2018). The play’s the thing: Experimentally
examining the social and cognitive effects of school field trips to live theater
performances. Educational Researcher, 47(4), 246-254.
Government Accountability Office (2009). Access to arts education: Inclusion of additional
questions in education’s planned research would help explain why instruction time has
decreased for some students. Report to Congressional Requesters. February, GAO-09-
286. Retrieved from https://www.gao.gov/new.items/d09286.pdf
Jaeger, M. M., & Møllegaard, S. (2017). Cultural capital, teacher bias, and educational success:
New evidence from monozygotic twins. Social science research, 65, 130-144.
Keiper, S., Sandene, B., Persky, H., & Kuang, M. (2009). The nation’s report card: Arts 2008 --
music and visual arts. National Assessment of Educational Progress at Grade 8. National
Center for Education Statistics 2009-488. Retrieved from
https://nces.ed.gov/nationsreportcard/pubs/main2008/2009488.asp.
Kisida, B., Greene J., & Bowen, D. (2014). Creating cultural consumers: The dynamics of
cultural capital acquisition. Sociology of Education, 87(4), 281-295.

31
Lacoe, J., Painter, G., & Williams, D. (2016). Museums as classrooms: The academic and
behavioral impacts of “School in the Park.” Working Paper. Sol Price School of Public
Policy, University of Southern California.
Ludwig, M., Boyle, A., & Lindsay, J. (2017). Review of evidence: Arts integration research
through the lens of Every Students Succeeds Act. Washington, DC: American Institutes
for Research. Retrieved from http://www.air.org/resource/review-evidence-arts-
integration-research-through-lens-every-student-succeeds-act.
Randi Korn & Associates (2018). The Effects of Facilitated Single-visit Art Museum Programs
on Students Grades 4-6. National Art Education Association & Association of Art
Museum Directors. Retrieved from https://www.arteducators.org/research/articles/377-
naea-aamd-research-study-impact-of-art-museum-programs-on-k-12-students.
Rabkin, N., & Hedberg, E. (2011). Arts education in America: What the declines mean for arts
participation. National Endowment for the Arts, Research Report #52.
Ruppert, S. (2006). Critical evidence: How the ARTS benefit student achievement. National
Assembly of State Arts Agencies. Retrieved from
https://files.eric.ed.gov/fulltext/ED529766.pdf.
Student Youth & Travel Association (2016). Student youth and travel digest: A comprehensive
survey of the student travel market. Mclean, VA. Retrieved from
https://syta.org/wpcontent/uploads/2017/08/SYTD-Social-Impact-8.11.pdf.
Watson A. R., Greene, J. P., Erickson, H. H., & Beck, M. I. (2019) Altered Attitudes and
Actions: Social-emotional effects of multiple Arts Field Trips. Department of Education
Reform working paper 2019-04.
What Works Clearninghouse. Procedures and Standards Handbook Version 3.0. Institute of
Education Sciences (IES). Retrieved from https://ies.ed.gov/ncee/wwc/Docs/
referenceresources/wwc_procedures_v3_0_standards_handbook.pdf.

32
Chapter 2: The Effect of the Louisiana Scholarship Program on College Entrance3
Introduction
Private school choice continues to be a highly controversial education reform. Choice
remains popular, however, as the number of private school choice programs and participating
students have both increased rapidly in the last decade (EdChoice, 2019. School choice broadly
gives parents the opportunity to select a school for their children other than their residentially
assigned public school. Private school choice, in the form of vouchers, tax-credit scholarships, or
Education Savings Accounts (ESAs), provides families the opportunity to select a private school
for their child and to receive financial support to pay for tuition. Milton Friedman (1962) argued
that a robust market of schools supported by government resources but managed privately would
lead to a more efficient and successful education system. Choice critics contend that education is
a public good best delivered by government-run schools (Gutmann, 1987).
Most research evaluating private choice programs has focused on their effects on student
academic achievement. A majority of experimental evaluations find modest, neutral-to-positive
effects of private school choice on the student achievement of participants (Bettinger & Slonim,
2006; Cowen, 2008; Cowen et al., 2013; Greene, Peterson, & Du, 1999; Greene, 2001; Howell et
al., 2002; Howell & Peterson, 2006; Jin, Barnard, & Rubin, 2010; Krueger & Zhu, 2004; Rouse,
1998; Wolf et al, 2013), with some recent and notable exceptions that find negative effects on
student test scores (Abdulkadiroğlu, Pathak, & Walters, 2018; Dynarski et al., 2017; Figlio &
Karbownik, 2016; Mills & Wolf, 2019; Waddington & Berends, 2018). Abdulkadiroğlu, Pathak,
and Walters (2018) and Mills and Wolf (2019) both evaluate the Louisiana Scholarship Program
(LSP) and find large negative effects on both math and English Language Arts (ELA) test scores
3 This paper is co-authored with Jonathan N. Mills and Patrick J. Wolf

33
in the first year of the program. Mills and Wolf (2019) include three additional years of data and
find that the negative test score effects diminish in the second year and become statistically
insignificant in the third year only to reemerge in the fourth and final year of the program
evaluation. The LSP, demonstrating large negative effects on student test scores, stands out as
the most notable exception to the majority of findings in private school choice research.
In this paper we seek to understand how the LSP impacted college enrollment for
students who applied to the program in its first year, 2012-13. Using detailed data from the
National Student Clearinghouse (NSC) Student Tracker Service, we find that 60% of students
who were awarded a scholarship through a lottery and enrolled in their first-choice private school
enter college, compared to 59.5% of their control student counterparts. We find that treatment
students are two percentage points more likely to enroll in a four-year institutions than a two-
year; however, this difference is not statistically distinguishable from zero.
This paper expands our understanding of how the LSP affected students on multiple
educationally important outcomes. It also contributes to the emerging body of literature on
private school choice programs’ effects on student attainment by using an experimental design to
estimate the causal effect of the LSP on college entrance. Finally, it adds another case to the
growing list of school choice evaluations reporting a disconnect between the short-term test
score effects and longer-term attainment effects of school choice programs (Hitt, McShane &
Wolf, 2018).
The paper proceeds as follows: first, we define the features and policy context of the
LSP; second, we review the previous literature on private school choice including the LSP; third,
we discuss our research methodology and data; fourth, we present our results; and last, we
discuss the implications of our findings and further research.

34
Louisiana Scholarship Program Description
The LSP is a school voucher program providing students a scholarship to attend a private
school of their choice. The program piloted in New Orleans in 2008 and expanded statewide in
2012. Students are eligible for the LSP if their family incomes are below 250% of the federal
poverty line and if they are currently attending a public school rated C, D, or F on the statewide
school grading system. Students entering kindergarten or currently enrolled in the Recovery
School District, which is the state government takeover mechanism for Louisiana schools, are
also eligible to apply for a scholarship.
Scholarship funding comes from the state and is the lesser amount of 90% of state and
local funding or the tuition of the private school of the student’s choice. In order to participate in
the program, private schools are required to administer the state standardized test and cannot
have selective admission policies. They also must comply with state financial and safety
regulations.
In the first year of the statewide program, 2012-13, over 9,500 students applied for and
5,296 were awarded a scholarship (Mills & Wolf, 2017a). The majority of student applications in
the first year were for kindergarten through third grade, with 19% of applications for seventh
through twelfth grades.
Literature Overview
A large body of research evaluates the effects of various private school choice programs
on the student achievement of participants (Abdulkadiroğlu, Pathak, & Walters, 2018; Bettinger
& Slonim, 2006; Cowen, 2008; Dynarski et al., 2017; Greene, Peterson, & Du, 1999; Greene,
2001; Jin, Barnard, & Rubin, 2010; Krueger & Zhu, 2004; Mills & Wolf, 2019; Rouse, 1998;
Waddington & Berends, 2018; Wolf et al., 2013). A recent meta-analysis by Shakeel, Anderson,

35
and Wolf (2016) summarizes the effects of private school vouchers around the world and finds
statistically significant positive effects on student test scores two or three years after random
assignment, with larger results in reading than math. The effects for programs in the United
States are smaller and less conclusive than the effects in non-U.S. countries. In many studies
there are heterogeneous effects for various subgroups. For example, in the D.C. Opportunity
Scholarship Program, test score impacts are larger for girls and students who entered the
program from public schools that were not classified as needing improvement (Wolf et al.,
2013). A number of studies find greater impacts for African American than for non-African
American students (e.g. Howell et al., 2002).
There is a much smaller body of literature on the effects of private school choice on
students’ educational attainment as measured by high school graduation, college entrance, and
degree completion. This research base is less developed than the private school choice
achievement impacts literature because attainment evaluations require following students for
many years after their initial experience in the program. Educational attainment is, however,
arguably, more important than student test scores because it is a more direct proxy for student
success and is strongly associated with a host of positive long-term outcomes. Higher levels of
educational attainment are predictive of a longer, healthier, and more economically productive
life (Belfield & Levin, 2007; Day & Newburger, 2002; Meara, Richards & Cutler, 2008;
Muenning, 2005; Muennig, 2008). Moreover, the achievement effects of a school choice
program seldom predict that program’s later attainment effects. Some choice programs
demonstrate large positive test score impacts for students but null or negative post-secondary
outcomes; while other programs show no effect on test scores but large positive effects on
attainment (Hitt, McShane & Wolf, 2018). Examining both achievement and attainment provides

36
a more comprehensive understanding of the LSP’s effect on students’ future success, particularly
in light of the large negative test score effects students experienced over most of the first four
years of the program.
Literature on Private School Choice and Student Attainment
Eight studies assess the impact of private school choice on student attainment in four
programs: the Milwaukee Parental Choice Program (MPCP), the District of Columbia
Opportunity Scholarship Program (D.C. OSP), the New York School Choice Scholarships
Foundation Program, and the Florida Tax Credit Scholarship.4 Two studies consider high school
graduation only (Warren, 2011; Wolf et al., 2013), four studies consider college enrollment only
(Chingos, Monarrez, & Kuehn, 2019; Chingos, 2018; Chingos & Kuehn, 2017; Chingos &
Peterson, 2015), and two studies examine both (Wolf, Witte & Kisida, 2018; Cowen et al.,
2013).
Of the four total studies that consider the effect of private school choice on the likelihood
of students graduating from high school, all of them find statistically significant positive effects.
The largest impact is in the D.C. OSP experimental evaluation, where the effect of using a
voucher is a twenty-one percentage point increase in the likelihood of graduating from high
school (Wolf et al., 2013). Using student matching methods, Cowen et al. (2013) find that
students participating in the MPCP are two to seven percentage points more likely to graduate
from high school in four years compared to similar peers in traditional public schools, an initial
finding largely replicated by a follow-up study (Wolf, Witte & Kisida, 2018). Evaluating the
same program but with an observational design, Warren (2011) finds that voucher students are
4 For a systematic review of five of these studies see Foreman, 2017.

37
twelve percentage points more likely to graduate in six years compared to the state average high
school graduation rate.
Regarding impacts on college enrollment and persistence, four of the six total studies find
significant positive effects for the overall sample. Students participating in the Florida Tax Credit
(FTC) scholarship program are six percentage points more likely to enter college, with most
entering community colleges (Chingos & Kuehn, 2017). In a follow up study of the FTC using
college enrollment data from the National Student Clearinghouse, Chingos, Monarrez, and
Kuehn (2019) find that FTC participants are between six and ten percentage points more likely
than similar nonparticipants to enroll in both two-year and four-year institutions. FTC
participants are also more likely to earn a bachelor’s degree by one to two percentage points. The
updated study of the FTC is consistent with the previous findings, but in some cases the effects
are larger due to a large portion of FTC participants enrolling in out-of-state colleges. Similarly,
students in the Milwaukee program are four to six percentage points more likely to enter four-
year colleges and persist in them longer than matched public school students (Wolf, Witte &
Kisida, 2018; Cowen et al, 2013). Students in neither the New York City program (Chingos &
Peterson, 2015) nor the DC program (Chingos, 2018) realized any significant college enrollment
benefits of those private school choice initiatives, although African American and non-immigrant
subgroups of students demonstrated attainment impacts in New York.
Overall, private school choice programs tend to have a significant positive effect on
students’ likelihood of graduating from high school and enrolling in postsecondary institutions.
However, research remains limited. Only eight studies have considered the attainment effects of
only four private school choice programs in the U.S. Only three of those evaluations employed a
gold standard, experimental design. We expand this nascent literature by experimentally

38
evaluating the impact of the Louisiana Scholarship Program on students’ likelihood of entering
college.
Previous Literature on the Louisiana Scholarship Program
The LSP is one of the most comprehensively studied private school choice programs in
the United States. There is evidence of the LPS’s impact on students’ academic achievement,
competitive effects on students who remain in traditional public schools, and school segregation.
Researchers also have studied the types of private schools that participate in the LSP, which may
help in understanding the various outcomes of the program.
First, the LSP had large negative effects on achievement for participating students in the
first year. Those negative test score effects ranged from a 0.40 standard deviation
(Abdulkadiroğlu, Pathak, & Walters, 2018) to a 0.65 standard deviation decrease in math test
scores (Mills, 2015).5 The effect was smaller in English Language Arts, but also negative and
statistically significant. These initial negative achievement effects of the LSP decreased in the
second year and became statistically insignificant by the third year, only to reemerge in the
fourth and final year of the evaluation (Mills & Wolf, 2019). The LSP is one of only two voucher
programs, along with the D.C. OSP (Dynarski et al. 2017), to show negative test score effects
based on an experimental design.6
The reasons for the negative achievement effects of the LSP are unknown. Potential
explanations include disruption due to switching schools (especially during the chaotic first year
5 Abdulkadiroğlu, Pathak, & Walters (2018) and Mills, 2015 have slightly different point estimates for two main
reasons. One, the studies use slightly different samples of students. Two, Mills (2015) and Mills & Wolf (2017a)
standardized student test scores to the control group testing distribution, and Abdulkadiroğlu, Pathak, & Walters
(2018) standardize student test scores to New Orleans student test scores. 6 Figlio and Karbowink (2016) and Waddington and Berends (2018) find negative achievement effects in the first
years of the Ohio and Indiana voucher programs, respectively. Both studies use non-experimental designs.

39
of the initiative), differences in testing culture and familiarity, and the quality of participating
private schools.
The LSP was enacted less than three months before the start of the 2012-13 school year.
Program implementers and private school personnel had to rush the roll-out of the new initiative.
Participating private schools had little time to prepare for an influx of new students, many of
whom arrived with challenging backgrounds and low achievement levels (Sude & Wolf, 2019).
At least some of the initial achievement loss of the LSP students compared to the control group
students can be attributed to the extreme conditions in which students had to adjust to new
schools and the schools to new students.
Private schools participating in the program are required to administer the state
accountability test to their LSP students. In the first two years of the LSP, the test came in two
versions, LEAP and iLEAP. The LEAP was fully aligned to the content of the curriculum taught
in Louisiana public schools, while the iLEAP was only partly aligned to the state’s curriculum
standards. The students in the evaluation who took the more aligned LEAP exam demonstrated
negative test score effects of the LSP that were twice as large as the students who took the less
aligned iLEAP exam through the first two years of the study (Mills & Wolf, 2017a, pp. 15-16).
While public schools are accustomed to taking the LEAP/iLEAP, both tests were new for private
schools, which also might have contributed to the negative LSP effects using both tests. The
difference between treatment and control group students’ test scores could in part reflect
differences in familiarity between private and public schools with the state test and the practice
of accountability-based testing. In the third year, when there were no statistical differences
between treatment and control students’ test sores, the state switched assessments from
LEAP/iLEAP to the PARCC. The PARCC test was new to both public and private schools, and

40
no accountability penalties were attached to school-level performance on that test that year. The
effects of the LSP on student achievement were null in outcome year 3, the one year the PARCC
was used. In outcome year 4, the state used a third accountability test, modeled after the PARCC
that was fully aligned to the state curriculum. The test was high-stakes that year, with
accountability rewards and penalties attached to school-level performance. The LSP effects on
test scores returned to statistically significant negative in that fourth year. In sum, the test score
impacts of the LSP varied across time and across tests, from null in year 3 to negative in years 1,
2 & 4, in part probably because of differences in test alignment and test familiarity between the
private and public schools.
Some evidence suggests that the quality of private schools participating in the program is
a factor in the generally negative test score effects of the LSP. Sude, DeAngelis, and Wolf
(2018) find that only 33 percent of Louisiana private schools participated in the program. When
surveyed, private school leaders listed “concerns about future regulations” as their main reason
for not participating in the LSP (Kisida, Wolf & Rhinesmith, 2015). While there is no simple
measure of private school quality at the start of the program, since private schools were not
required to administer or report test scores until they joined the LSP, indicators suggest that
lower quality private schools disproportionately participated in the program. Participating
schools charge lower tuitions, enroll fewer students per grade, and have smaller school staffs
than nonparticipating private schools in the state. In a separate report by our team, Lee, Mills and
Wolf (2019) find that most of the negative test score effects of the LSP were concentrated among
students attending private schools in the lower two-thirds of the distribution on various quality
indicators.

41
Louisiana has a robust private school market with approximately 20 percent of students
attending a private school. The state provides a state tax deduction for parents who self-fund
their child’s private education, providing a resource benefit to private schools that comes with no
restrictions (EdChoice, 2019). As such, high quality private schools in Louisiana have little
incentive to participate in the LSP because demand already exists for private schools and other
government programs provide financial support that does not come with the same regulations as
the LSP.
In sum, the negative test score effects observed throughout most of the longitudinal
evaluation of the LSP have several plausible causes. The especially large negative effects in the
first year of the program likely were magnified due to the challenge of student-school
adjustments amidst a rushed implementation schedule. The smaller, but still substantial, negative
effects observed in the second and fourth outcome years of the evaluation probably are due to
some combination of test alignment favoring students taught in public schools and the average
quality of the private schools participating in the LSP. Conceptually, the supply of private
schools from which parents can choose is largely the school choice program intervention. The
fact that only one-third of the private schools in Louisiana, apparently disproportionately coming
from the lower part of the quality distribution, participated in the LSP is not an excuse for the
generally negative test score effects of the program after four years, but it is a partial explanation
for those results.
Second, Egalite and Mills (2019) evaluated the impact the LSP had on student test scores
in traditional public schools. They use multiple measures of private school competition: distance,
density, diversity, and concentration. Using school fixed effects and regression discontinuity

42
models, they find that students in traditional public schools experienced small gains in math test
scores due to competitive pressures from the LSP.
Third, the LSP has reduced racial segregation in public schools, especially those under
federal desegregation orders (Egalite, Mills, & Wolf, 2016). The effect of school choice on racial
stratification in both private and public schools is an increasingly discussed outcome that can
have significant consequences for students (Swanson, 2017). Egalite and her colleagues find that
students who use an LSP voucher to attend a private school tend to leave schools in which their
own race is dramatically overrepresented relative to the surrounding community. Students
entering private schools are more likely to enter private schools that have a larger proportion of
students of their similar race. However, the racial demographics of the private school is more
closely representative of the larger community than the public school. On balance, the authors
conclude the LSP has decreased racial stratification in Louisiana.
In sum, there is a large amount of research on the LSP to consider when evaluating the
value of the scholarship program. There are clear negative effects on student academic
achievement in the first years of the program that reemerge in the fourth year of the evaluation.
The estimates of the test score effects of the LSP are limited to approximately 15% of all LSP
applicants with baseline and outcome test scores and who faced a placement lottery in their first-
choice private school. As a result of the LSP, public schools also seem to have moderately
benefited both in terms of small test score increases and improved racial integration. We add to
the existing literature by evaluating the impact of the LSP on yet another important dimension,
college entrance.

43
Research Methodology
Experimental designs are considered the gold standard for evaluation because they hold
the greatest potential to identify causal effects (Mosteller & Boruch, 2002; Pirog et al., 2009;
Rossi, Lipsey, & Freeman, 2004). In this paper, we exploit lotteries in oversubscribed private
schools to estimate the causal effect of the LSP on students’ likelihood of entering college. To
participate in the LSP, students apply through a centralized enrollment process administered by
the Louisiana Department of Education (LDOE). Families are able to rank in order their top five
preferred private schools. This enrollment system is similar to the New York City Department of
Education’s public high school choice system (Abdulkadiroglu, Pathak, & Roth, 2005). The LSP
enrollment system awards scholarships based on available seats in students’ preferred private
schools and their priority status. Students with disabilities as well as multiple birth siblings
(twins, triplets, etc.) are automatically awarded a scholarship if space is available in their desired
private schools. Remaining students are awarded a scholarship based on six priority factors.
Priority 1 – Students who receive LSP scholarships in the prior school year who
are applying to the same school
Priority 2– Non-multiple birth siblings of Priority 1 awardees in the current
round
Priority 3 – Students who received LSP scholarships in the prior school year who
are applying to a different school
Priority 4 – New applicants who attend public schools that received a “D” or “F”
grade in Louisiana’s school accountability system
Priority 5 – New applicants who attended public schools that received a “C”
grade

44
Priority 6 – New applicants who are applying to kindergarten
Figure 1 summarizes the process of awarding scholarships. The process begins by trying
to place all students in Priority 1 into their first-choice private school. If there are more seats than
there are students applying for the specific school, then all students are awarded a scholarship to
that given school. If there are no seats available for students in the specific school, no students
are awarded a scholarship for that school. If there are more applicants for a school than seats
available, scholarships are awarded by lottery. Priority 1 students who were not awarded a
scholarship for their first-choice school repeat the same process for their second, third, fourth,
and fifth-choice schools. After all Priority 1 students are placed, the process repeats for students
in priority categories 2 through 6. The process continues until all students are awarded or not
awarded a direct placement in a preferred private school supported by a scholarship.

45
Given the allocation process, only a subset of students faced a lottery. Using data on
student school preferences, we identify if a student faced a lottery when the percentage of
students awarded a scholarship fell between 0%-100% for a given priority category, school, and
grade combination. We limit our sample to students who faced a lottery for their first-choice
school to ensure that each awarded scholarship is independent of any other student being
awarded a scholarship, within the same priority category. This same strategy was used in test
scores evaluations of the LSP (Abdulkadiroğlu, Pathak, & Walters, 2018; Mills & Wolf, 2019;
2017a; 2017b) as well as other evaluations of choice programs with similar lottery designs
(Deming et al., 2014; Bloom & Unterman, 2014).
First choice
school
Applicants < Seats Applicants > Seats No seats
Lottery
Non-awardees
Proceed to next school preference/choice round after
all priority levels have gone through current process
Awardees
End of lottery for current priority level
Priority 1
Priority 5
Priority 2
Priority 3
Priority 4
Figure 1: First Stage of the Louisiana Scholarship Program award allocation process for
the 2012-2013 school year
Source: Mills and Wolf, 2017a

46
Data
We use two data sources in our analysis. First, we use student application data for the
LSP in the first year of program implementation provided by the LDOE. Second, we use data
from the National Student Clearinghouse (NSC) Student Tracker Service for college entrance.
The NSC collects data on college entrance, persistence, and degree attainment from 98 percent of
all public and private post-secondary institutions (National Student Clearinghouse). The
comprehensiveness of the NSC database allows us to capture records for students in our sample
who attend college outside of Louisiana. While the NSC collects information on post-secondary
completion, this paper focuses exclusively on college enrollment, in both two and four-year
institutions, because there are not enough students in our sample who have been enrolled long
enough to complete a degree for our analysis to be able to detect a treatment effect on college
graduation.
Sample
Using these data, our analytic sample consists of LSP applicants who faced a lottery for
their first-choice private school and those who were eligible to have enrolled in college by the
fall of 2018. Table 1 shows how many students applied for the LSP in its first year and how
many students faced a lottery for their first-choice private school. A total of 9,809 students
applied for a scholarship through the LSP for school year 2012-13 (Table 1, Column 1) of which
6,599 students faced a lottery for their first-choice school (Table 1, Column 2). A total of 1,927
students are eligible to have entered college by fall 2018 (Table 1, Column 1), of which 1,113
faced a lottery to gain admission to their first-choice private school (Table 1, Column 2). The
students in our analytic sample are not evenly distributed across grades, with more students
applying for earlier grades (Table 1, Column 2). Students who applied for twelfth grade in 2012-

47
13 could have enrolled in up to five and a half years of college by fall 2018, while students
applying for seventh grade in 2012-13 could have enrolled in one semester of college, assuming
students graduated from high school within four years. Students in our analytic sample are also
concentrated in priority categories four and five (Table 1, Column 2) which are students applying
for a scholarship who were attending public schools that received a C, D, or F grade from the
state accountability system.
Table 1 also contains baseline comparisons between our treatment and control groups on
observable characteristics. Experimental designs rely on randomization to create similar
treatment and control groups. Our treatment and control groups appear similar at baseline on
observable characteristics (Table 1, columns 3-6). Overall, the information on observable
characteristics of treatment and control students suggests that randomization worked properly.
Our treatment and control groups do not greatly differ from each other, at least on observable
characteristics, in any systematic way that would bias our estimates.

48
Table 1:
Descriptive data on Experimental Sample and Baseline Equivalence Baseline Equivalence
(1) (2) (3) (4) (5) (6)
Applicant
Sample
Experimental
Sample
Treatment
Mean
Control
Mean
Adjusted
Diff.
P-Values
Students applied for scholarship in baseline year 9,809 6,599
Eligible for college by 2017-18 1,927 1,113
Enroll in college for at least one semester 52% 55%
Enroll in 4yr. institution (of those who enroll in 1+ semesters) 48% 46%
Enroll in 2yr. institution (of those who enroll in 1+ semesters) 52% 54%
7th Grade 38% 37%
8th Grade 24% 22%
9th Grade 22% 23%
10th Grade 9% 11%
11th Grade 5% 6%
12th Grade 2% 1%
LSP Priority 1 7% 3%
LSP Priority 2 1% 0%
LSP Priority 3 1% 1%
LSP Priority 4 49% 56%
LSP Priority 5 43% 39%
LSP Priority 6 0% 0%
Female 50% 52% 50% 53% -3 0.360
Black 89% 91% 88% 92% -3 0.148
White 7% 5% 6% 4% 2 0.319
Hispanic 3% 3% 3% 3% 0 0.918
Other 2% 1% 2% 1% 1 0.133
Number of School Preferences listed 1.9 2.1 2.0 2.1 -0.1 0.171
Applicant sample includes all students who applied for the LSP for the 2012-13 school year. Experimental sample refers to students
who applied for a scholarship who faced a lottery for their first-choice private schools. The descriptive statistics for each sample are
based on the number of college eligible students; 1,927 students in the applicant sample and 1,113 students in the experimental
sample. Adjusted differences (column 5) is the difference between treatment and control group students controlling for first-choice
school lottery specific fixed effects. The p-values for the adjusted differences are in column 6.
48

49
Analytical Strategy
Due to the demand for the LSP and the nature of the allocation process, we are able to
leverage lotteries and estimate the causal effect of students enrolling in their first-choice private
school on their likelihood of entering college. The lotteries allow us to compare students who
applied for the LSP but received or did not receive a scholarship by random chance.
Randomization is key in determining the causal effect of the scholarship because it removes
selection bias created by students choosing to apply to the program (Bækgaard et al., 2015). In
order to identify the casual effect, we limit our sample to only students who faced a lottery for
their first-choice private schools because the first lottery is the only lottery that is independent of
all other lotteries. For example, a student could have lost a lottery to his or her first-choice school
but won a lottery for a less preferred school; however, the student faced the possibility of a
second lottery because he or she lost a first-choice lottery.
We calculate the Local Average Treatment Effect (LATE) to estimate the causal effect
of students winning a scholarship and enrolling in their first-choice private school. The LATE
provides an unbiased estimate of the effect of the scholarship for students who actually use it.
We argue that the LATE is a more appropriate estimate of the impact of the LSP than the simpler
intent-to-treat estimate because winning a first-choice lottery simultaneously entails the offer of a
scholarship and placement in a particular private school. The LATE is interpreted as the effect
of receiving a scholarship and enrolling in that first-choice private school.
We calculate the LATE using a two-step process via two stage least squares (TSLS). In
the first step, we use students’ lottery assignments to predict the probability of students enrolling
in their first-choice private schools. In the second step, we replace the lottery assignment with
the predicted probability of enrolling in a student’s first-choice school to predict the probability

50
of that student entering college. We use the following linear probability models7 to estimate the
LATE where i denotes student and k denotes lottery.
𝐸𝑛𝑟𝑜𝑙𝑙𝑖 = ƍ0 + ƍ1𝑊𝑖 + 𝛾𝑘 + 𝑋𝑖ƍ2 + 𝑢𝑖𝑘 (1)
𝐶𝑜𝑙𝑙𝑒𝑔𝑒𝐸𝑛𝑡𝑟𝑎𝑛𝑐𝑒𝑖 = 𝛽0 + 𝛽1𝐸𝑛𝑟𝑜𝑙𝑙̂𝑖 + 𝛾𝑘 + 𝛽2𝑋𝑖 + 𝜖𝑖𝑘 (2)
Where, in equation 1, 𝐸𝑛𝑟𝑜𝑙𝑙𝑖 is a dichotomous variable indicating if student i actually enrolled
in his or her first-choice school. 𝑊𝑖 indicates whether or not student i was awarded a scholarship
through the lottery. 𝛾𝑘 is a fixed effect for the specific lottery a student was in, which is a
combination of his or her priority category, school, and grade. The lottery fixed effects account
for where randomization took place and effectively compare students in the same lottery to each
other. 𝑋𝑖 is a vector of student characteristics including gender, race, and the number of school
preferences listed on students’ applications. While student characteristics are not required to
identify the causal effect of the LSP on college entrance due to randomization by the lotteries,
student characteristics can help to more precisely estimate the effect. In the second step (equation
2) of the LATE estimation process, we replace the lottery assignment with the predicted
probability of enrolling in student i’s first-choice school to estimate the probability of entering
college. 𝐶𝑜𝑙𝑙𝑒𝑔𝑒𝐸𝑛𝑡𝑟𝑎𝑛𝑐𝑒𝑖 equals 1 if a student enrolled in any college for at least one semester
and 0 if a student had never started college. To account for clustering of students within lotteries,
we use bootstrapped standard errors (Angrist & Pischke, 2009).
Results
The results of our LATE estimates are presented in Tables 2 and 3 as well as Figure 1.
Table 2 presents the results of the first stage model where we predict the likelihood of students
7 We estimate all the models as linear probability models due to the difficulty of a probit or logit achieving
convergence given the large number of lottery fixed effects in our model. For each of our models the linear
predictions all fall within the appropriate range of zero to one.

51
enrolling in their first-choice private schools by their lottery status. We find that 77% of students
who win a lottery for their first-choice private school use the awarded scholarship to actually
enroll in their given schools. Table 3 contains the results of our second stage and represents the
causal effect of winning a lottery and enrolling in a student’s first-choice private school. We find
that the LSP has no statistically significant effect on college entrance for students who enroll in
their first-choice private school. Column 1 in Table 3 presents the results of the two-step model
without any student level covariates. Column 2 presents the results with student covariates.
Students who receive a scholarship and enroll in their first-choice private school are more likely
to enter college by 0.5 percentage points compared to students who did not win a lottery to attend
their first-choice school. The estimated effect is small and statistically insignificant. The
estimates are also imprecise as the standard errors are relatively large. The lack of precision is
likely due to the demands placed on the data by estimating a two-stage analytic model with fixed
effects.
The majority of students in the analysis enroll in college, with 59.5% of control students
and 60% of treatment students entering college (Table 3, Column 2, and Figure 2). The
percentage of students entering college is particularly higher given that students who applied for
the program came from economically disadvantaged backgrounds. These higher than average
college enrollment rates could be a result of other efforts Louisiana has made to expand access to
college. We also estimate the likelihood of participating students entering two-year or four-year
institutions. We find that the LSP had no significant effect on the rate at which treatment and
control students choose a four-year over a two-year post-secondary institution. Treatment
students enroll at a slightly higher rate, by two percentage points, in four-year institutions than

52
do their control counterparts, but the difference is not statistically significant (Table 3, Columns
3 and 4).
Table 2:
First Stage Results of TSLS: Probability of Enrolling in First Choice
Private School
Scholarship Usage
Win Lottery 0.770***
(0.025)
Female 0.029*
(0.017)
Black 0.057
(0.093)
White 0.046
(0.099)
Hispanic 0.032
(0.106)
# of schools listed 0.013
(0.008)
Constant -0.042
(0.096)
Observations 1,113
Number of Lotteries 106
R-squared 0.728
Notes: Bootstrap standard errors in parentheses to account for
clustering of students within lotteries. All models are linear
probability models. Linear predictions fall within zero and one. ***
p<0.01, ** p<0.05, * p<0.1

53
Table 3:
The Effect of Enrolling in a Student’s First Choice School on College Entrance
(1) (2) (3) (4)
College Entrance 2yr. Institution 4yr. Institution
LSP Enroll -0.001 0.005 -0.020 0.020
(0.043) (0.042) (0.059) (0.059)
Female 0.153*** 0.085* -0.089**
(0.034) (0.045) (0.045)
Black -0.079 -0.048 0.030
(0.122) (0.157) (0.152)
White -0.247** -0.029 0.019
(0.115) (0.215) (0.212)
Hispanic -0.161 -0.092 0.083
(0.147) (0.164) (0.161)
# of schools listed -0.017 0.014 -0.012
(0.017) (0.022) (0.022)
Constant 0.551*** 0.595*** 0.514*** 0.502***
(0.021) (0.135) (0.173) (0.168)
Observations 1,113 1,113 613 613
Number of Lotteries 106 106 99 99
Notes: Bootstrap standard errors in parentheses to account for clustering of students within
lotteries. All models are linear probability models. Linear predictions fall within zero and one.
Columns 3 and 4 are conditional on having entered any college. *** p<0.01, ** p<0.05, * p<0.1

54
Figure 2. Regression-adjusted college enrollment rates for students who ever used an LSP
voucher and students in the control group.
Notes: Enrollment rate is for enrolling in any two-year or four-year institution of higher
education at any time between 2013 and 2018. Regression adjusted for student and family
demographic characteristics.
Discussion
Overall, the LSP did not affect students’ likelihood of enrolling in post-secondary
schooling. There is no statically significant observable difference in the rate at which treatment
and control students enroll in college. Our estimates are imprecise which could be due to the
demands put on the data given the two-step estimation process. With 95 percent confidence, the
true effect of the LSP on the likelihood of college enrollment could be as high as an increase of 9
percentage points or as low as a decrease of 8 percentage points. A larger sample of college-age
students would provide greater statistical power to estimate an attainment effect of the LSP. In
the next few years, the college-aged sample of students who participated in the LSP in 2012-13
will continue to grow. With a larger sample, we also will be able to estimate the effect of the
60.0% 59.5%
0%
10%
20%
30%
40%
50%
60%
70%
Voucher Use Control

55
LSP on college persistence and degree completion. In coming years, we will hopefully
understand much more regarding the effects of the LSP on multiple post-secondary outcomes.
Our research team’s estimate of the LSP’s effect on college entrance differs from our
estimate of the program’s effect on achievement. Students who enrolled in their first-choice
private schools experienced large math and substantial reading test score declines compared to
their control counterparts, even as late as the fourth year after random assignment (Mills & Wolf,
2019). However, we find that treatment students entered college at approximately the same rate
as their control counterparts. One might expect that a program with such negative test score
effects might also negatively affect the likelihood of students entering college.
There are a few probable explanations for the potential disconnect between the LSP’s
effects on student test scores and post-secondary enrollment. First, students in the achievement
analysis are not the same group of students in the attainment analysis. The achievement analysis
included students in the baseline year, 2012-13, who applied for grades four through eight, while
our sample in this paper includes students who applied for seventh through twelfth grades. The
differences between the test score findings and the college enrollment findings could be due to
the difference between elementary and high schools. We estimate the effect of college entrance
for seventh and eighth grade students and find no differential effect for these students; the
treatment coefficient remains small and statistically insignificant.8 This result gives some
evidence that the difference between the achievement and college entrance results is not driven
by school grades, but there will be more conclusive evidence as more students in the
achievement analysis enter college.
8 The LATE point estimate for seventh and eighth graders is -0.034 with a standard error of 0.079 and an associated
p-value of 0.666.

56
Second, the disconnect could be due to the differences in how private and public schools
treat standardized tests. As discussed above, the achievement effects of the LSP over the four
years of the evaluation have been sensitive to the specific state test used as a measure of student
learning. It is possible that a more general measure of learning than the state criterion-referenced
accountability exam would have revealed LSP achievement effects that were more favorable, or
at least less unfavorable, to the program than those reported in our team’s test score analysis
(Mills & Wolf, 2019).
Third, the disconnect between achievement and college enrollment effects of this private
school choice program could be a result of public and private schools having different goals.
While public schools are under great accountability pressures regarding student academic
growth, specifically on math and reading test scores, private schools can focus more broadly on
whole student education where they may focus on academic, social, emotional, and character
development. An initial analysis of the impact of the LSP on student non-cognitive and civic
outcomes reported null effects similar to those found here for student attainment (Mills et al.,
2016).
The disconnect between student outcomes observed in the LSP is consistent with the
tendency for a disconnect between attainment and achievement effects in school choice programs
generally (Hitt, McShane, & Wolf, 2018). For example, evaluations of the Washington, D.C.
Opportunity Scholarship Program (Wolf et al., 2013) and the Milwaukee Parental Choice
Program (Wolf, Witte & Kisida, 2018; Witte et al., 2014; Cowen et al, 2013) both found
marginal to null test score effects but large statistically significant increases in high school
graduation rates. Evaluations of the Boston charter schools (Angrist, et al. 2016), the Harlem
Promise Academy (Dobbie and Fryer, 2015), the KIPP charter schools (Tuttle, et al., 2015), and

57
the SEED Boarding Charter school (Unterman, et al., 2016) reported significant increases in
student test scores but no increase in high school graduation or college entrance rates. The
pattern in the literature suggests that schools affect students in ways not always detected on
standardized tests. It could be that various school sectors, whether they are private, traditional
public, or charter, have diverse goals and a comparative advantage at improving certain, distinct
student outcomes. For example, private schools of choice could have more of a comparative
advantage over public schools in developing the non-cognitive skills of students, including grit,
persistence and conscientiousness. These character traits likely affect the probability that
students continue with higher education independent of their performance on the state
standardized test scores, compared to their public school peers. The LSP is the first private
school choice program to show negative test score effects and null attainment effects. While the
actual reason for the achievement-attainment disconnect in school choice evaluations is
unknown, it seems to be a prevalent pattern that deserves further consideration particularly in
light of the unique findings from the LSP.
Conclusion
We use a rigorous experimental design to estimate the causal effects of the LSP on the
likelihood of students entering post-secondary schooling. We compare students who won a
lottery and enrolled in their first-choice private school to those who lost a lottery. Our findings
indicate that the LSP had no statistically significant impact on students’ likelihood of entering
college if they initially applied for the program entering grades seven through twelve in the
2012-13 school year. While we find no statistically significant effect on college entrance, our
estimates are relatively imprecise.

58
This paper is part of a larger evaluation of the LSP that has considered many aspects of
the scholarship program including the effects on student academic performance. The null
findings in this paper are particularly interesting given the large negative test score effects
students experienced in the first year of the program. The academic and college entrance effects
from the LSP seem to conflict with each other as treatment students experienced a significant
negative effect on test scores but appear to be just as likely as their control counterparts to enter
college. A disconnect between the effects of school choice programs on student achievement and
attainment is a consistent pattern in other school choice literature generally (Hitt, McShane, &
Wolf, 2018). Fortunately, as time passes, our sample will increase as more students graduate
from high school and enter college. A larger sample will increase our analytic power, as well as
allow us to estimate the effect of the LSP on college persistence and degree completion. There is
still a great deal yet to be discovered regarding the effects of the LSP on post-secondary
outcomes and the apparent disconnect between the student achievement and college entrance
findings.

59
References
Abdulkadiroğlu, A., Pathak, P. A., & Walters, C. R. (2018). Free to choose: can school choice
reduce student achievement? American Economic Journal: Applied Economics, 10(1),
175-206.
Abdulkadiroğlu, A., Pathak, P. A., & Roth, A. E. (2005). The New York City high school match.
American Economic Review, Papers and Proceedings, 95, 364-367.
Angrist, J. D., Cohodes, S. R., Dynarski, S. M., Pathak, P. A., & Walters, C. R. (2016). Stand
and deliver: Effects of Boston’s charter high schools on college preparation, entry, and
choice. Journal of Labor Economics, 34(2), 275-318.
Angrist, J. D., & Pischke, J. S. (2009). Mostly harmless econometrics: An empiricist’s
companion. Princeton, NJ: Princeton University Press.
Bækgaard, M., Baethge, C., Blom-Hansen, J., Dunlop, C., Esteve, M., Jakobsen, M.,…Wolf, P.
J. (2015, Spring). Conducting experiments in public management research: A practical
guide. International Public Management Journal, 18(2), 323-342.
Belfield, C., & Levin, H. (2007). The return on investment for improving California's high
school graduation rate. California Dropout Research Project. Santa Barbara, California.
Bettinger, E., & Slonim, R. (2006). Using experimental economics to measure the effects of a
natural educational experiment on altruism. Journal of Public Economics, 90(8-9): 1625-
1648.
Bloom, H. S., & Unterman, R. (2014). Can small high schools of choice improve educational
prospects for disadvantaged students? Journal of Policy Analysis and
Management, 33(2), 290-319.
Chingos, M. M. (2018). The Effect of the DC School Voucher Program on College Enrollment.
Washington, D.C.: Urban Institute. Retrieved from https://www. urban.
org/research/publication/effect-dc-school-voucher-program-collegeenrollment.
Chingos, M. M., & Peterson, P. E. (2015). Experimentally estimated impacts of school vouchers
on college enrollment and degree attainment. Journal of Public Economics, 122, 1–12.
Chingos, M. M., & Kuehn, D. (2017). The effects of statewide private school choice on college
enrollment and graduation: Evidence from the Florida tax credit scholarship program.
Washington, D.C.: Urban Institute. Retrieved from
https://www.urban.org/research/publication/effects-statewide-private-school-choice-
college-enrollment-and-graduation.

60
Chingos, M. M., Monarrez, T. & Kuehn, D. (2019). The effects of the Florida Tax credit
scholarship program on college entrance and graduation: an update. Washington, D.C.:
Urban Institute. Retrieved from https://www.urban.org/research/publication/effects-
florida-tax-credit-scholarship-program-college-enrollment-and-graduation.
Cowen, J. M. (2008). School choice as a latent variable: Estimating the “complier average causal
effect” of vouchers in Charlotte. Policy Studies Journal, 36(2), 301–315.
Cowen, J. M., Fleming, D. J., Witte, J. F., Wolf, P. J., & Kisida, B. (2013). School vouchers and
student attainment: Evidence from a state-mandated study of Milwaukee’s parental
choice program. Policy Studies Journal, 41(1), 147–168.
Day, J., & Newburger, E. (2002). The big payoff: Educational attainment and synthetic estimates
of work-life earnings. Washington, DC: US Census Bureau.
Deming, D. J., Hastings, J. S., Kane, T. J., & Staiger, D. O. (2014). School choice, school
quality, and postsecondary attainment. American Economic Review, 104(3), 991-1013.
Dobbie, W., & Fryer Jr, R. G. (2015). The medium-term impacts of high-achieving charter
schools. Journal of Political Economy, 123(5), 985-1037.
Dynarski, M., Rui, N., Webber, A., & Gutmann, B. (2017). Evaluation of the DC Opportunity
Scholarship Program: Impacts after One Year. NCEE 2017-4022. National Center for
Education Evaluation and Regional Assistance.
Edchoice. (2019). ABC’s of School Choice. Retrieved from:
https://www.edchoice.org/research/the-abcs-of-school-choice/.
Egalite, A. J., & Mills, J. N. (2019). Competitive Impacts of Means-Tested Vouchers on Public
School Performance: Evidence from Louisiana. Education Finance and Policy, 1-45, just
accepted.
Egalite, A. J., Mills, J. N., Wolf, P. J. (2016). The impact of the Louisiana Scholarship Program
on racial segregation in Louisiana schools. Louisiana Scholarship Program Evaluation
Report #3. New Orleans, Louisiana: Education Research Alliance for New Orleans &
School Choice Demonstration Project.
Figlio, D., & Karbownik, K. (2016). Evaluation of Ohio's EdChoice Scholarship Program:
Selection, Competition, and Performance Effects. Thomas B. Fordham Institute.
Foreman, L. M. (2017). Educational attainment effects of public and private school
choice. Journal of School Choice, 11(4), 642-654.
Friedman, M. (1962). Capitalism and freedom. University of Chicago press.
Greene, J. P. (2001). Vouchers in Charlotte. Education Matters, 1(2), 55–60.

61
Greene, J. P., Peterson, P. E., & Du, J. (1999). Effectiveness of school choice: The Milwaukee
experiment. Education and Urban Society, 31(2), 191–213.
Gutmann, A. (1987). Democratic education. Princeton University Press.
Hitt, C.E., McShane, M.Q., Wolf, P.J. (2018). Do test scores even matter? Lessons from the
achievement and attainment effects of school choice programs. Washington, DC:
American Enterprise Institute.
Howell, W. G., Wolf, P. J., Campbell, D. E., & Peterson, P. E. (2002). School vouchers and
academic performance: Results from three randomized field trials. Journal of Policy
Analysis and Management, 21(2), 191-217.
Howell, W. G., & Peterson, P. E. (2006). The education gap: Vouchers and urban schools.
Boston, MA: Brookings Institution Press.
Jin, H., Barnard, J., & Rubin, D. B. (2010). A modified general location model for
noncompliance with missing data: Revisiting the New York City School Choice
Scholarship Program using Principal Stratification. Journal of Educational and
Behavioral Statistics, 35(2), 154–173.
Kisida, B., Wolf, P.J., Rhinesmith E. (2015) Views from private schools: Attitudes about school
choice programs in three states. Washington, DC: American Enterprise Institute.
Retrieved from: https://www.aei.org/publication/views-private-schools-attitudes-school-
choice-programs-three-states/.
Krueger, A. B., & Zhu, P. (2004). Another look at the New York City school voucher
experiment. American Behavioral Scientist, 47(5), 658-698.
Lee, M.H., Mills, J.N., & Wolf, P.J. (2019, April). Heterogeneous impacts across schools in the
first four years of the Louisiana Scholarship Program. EDRE working paper no. 2019-11.
Social Science Research Network, April 23.
Meara, E., Richards, S., & Cutler, D. (2008). The gap gets bigger: Changes in mortality and life
expectancy, by education, 1981-2000. Health Affairs 27(2), 350-360.
Mills, J. N. (2015). The effectiveness of cash transfers as a policy instrument in K-16 education
(Doctoral Dissertation). Retrieved from https://scholarworks.uark.edu/etd/1205.
Mills, J., Cheng, A., Hitt, C., Wolf, P., & Greene, J. (2016). Measures of student non-cognitive
skills and political tolerance after two years of the Louisiana Scholarship Program. EDRE
working paper. Available at SSRN 2738782.

62
Mills, J., & Wolf, P. (2017a). How has the Louisiana Scholarship Program affected students? A
comprehensive summary of effects after three years. Education Research Alliance for
New Orleans & School Choice Demonstration Project. Retrieved from
https://educationresearchalliancenola.org/files/publications/ERA1706-Policy-Brief-
Louisiana-Scholarship-Program-170626.pdf
Mills, J., & Wolf, P. (2017b). The effects of the Louisiana Scholarship Program on student
achievement after three years. Education Research Alliance for New Orleans & School
Choice Demonstration Project. Retrieved from:
https://educationresearchalliancenola.org/files /publications/Mills-Wolf-Effects-of-LSP-
on-Student-Achievement-After-Three-Years.pdf.
Mills, J.N., & Wolf, P.J. (2019, April). The effects of the Louisiana Scholarship Program on
student achievement after four years. EDRE working paper no. 2019-10. Social Science
Research Network, April 23.
Mosteller, F. & Boruch, F. (Eds.) (2002). Evidence matters: Randomized trials in education
research. Washington, D.C.: The Brookings Institution.
Muenning, P. (2005). The economic value of health gains associated with education
interventions. In Manuscript prepared for the Equity Symposium on The Social Costs of
Inadequate Education at Teachers' College, Columbia University.
Muennig, P. (2008). Health selection vs. causation in the income gradient: What can we learn
from graphical trends? Journal of Health Care for the Poor and Underserved, 19(2), 574-
579.
National Student Clearinghouse. n.d. Clearinghouse Facts. Available from
http://www.studentclearinghouse.org/ about/clearinghouse_facts.php.
Pirog, M. A., Buffardi, A. L., Chrisinger, C. K., Singh, P., & Briney, J. (2009). Are alternatives
to randomized assignment nearly as good? Statistical corrections to nonrandomized
evaluations. Journal of Policy Analysis and Management, 28(1), 169–172.
Rossi, P. H., Lipsey, M. W., & Freeman, H. E. (2004). Evaluation: A systematic approach.
Seventh edition. Sage.
Rouse, C. E. (1998). Private school vouchers and student achievement: An evaluation of the
Milwaukee Parental Choice Program. Quarterly Journal of Economics, 113(2), 553–602.
Shakeel, M., Anderson, K. P., & Wolf, P. J. (2016). The participant effects of private school
vouchers across the globe: A meta-analytic and systematic review. Retrieved from:
https://papers.ssrn.com/sol3/papers.cfm?abstract_id=2777633.

63
Sude, Y., & Wolf, P.J. (2019, April). Do you get cream with your choice? Characteristics of
students who moved into or out of the Louisiana Scholarship Program. EDRE working
paper no. 2019-13. Social Science Research Network, April 23.
Sude, Y., DeAngelis, C. A., & Wolf, P. J. (2018). Supplying choice: An analysis of school
participation decisions in voucher programs in Washington, DC, Indiana, and
Louisiana. Journal of School Choice, 12(1), 8-33.
Swanson, E. (2017). Can we have it all? A review of the impacts of school choice on racial
integration. Journal of School Choice, 11(4), 507-526.
Tuttle, C. C., Gleason, P., Knechtel, V., Nichols-Barrer, I., Booker, K., Chojnacki, G., Coen, T.
& Goble, L. (2015). Understanding the effect of KIPP as it scales: Volume I, impacts on
achievement and other outcomes. Mathematica Policy Research.
Unterman, R., Bloom, D., Byndloss, D. C., Terwelp, E. (2016). Going away to school: an
evolution of SEED. DC. MDRC. Retrieved from: https://www.mdrc.org/
sites/default/files/Going_Away_to_School_FR.pdf.
Waddington, R. J., & Berends, M. (2018). Impact of the Indiana Choice Scholarship Program:
Achievement effects for students in upper elementary and middle school. Journal of
Policy Analysis and Management, 37(4), 783-808.
Warren, J. R. (2011). Graduation rates for choice and public school students in Milwaukee,
2003–2009. Milwaukee, WI, USA: School choice Wisconsin, January 2011.
Wolf, P. J., Kisida, B., Gutmann, B., Puma, M., Eissa, N., & Rizzo, L. (2013). School vouchers
and student outcomes: Experimental evidence from Washington, DC. Journal of Policy
Analysis and Management, 32(2), 246-270.
Wolf, P. J., Witte, J. F., & Kisida, B. (2018). Do Voucher Students Attain Higher Levels of
Education? Washington, D.C.: Urban Institute. Retrieved from
https://www.urban.org/research/publication/do-voucher-students-attain-higher-levels-
education.

64
Chapter 3: Who Wins in School Choice? Evaluating the Impact of Charter Schools on the
Market Share of Private Schools
Introduction
Over the past twenty years of education reform in the United States, school choice has
become increasingly popular. School choice is designed to improve education in a variety of
ways: to facilitate a better match between students and schools, to provide access to higher
quality schools, to increase competition among schools, and to allocate funds more efficiently.
School choice can take many forms in both public and private school choice programs; however,
charter schools are the most popular and widespread form of school choice. As of 2015, nearly
2.9 million students, which is six percent of total public school students, attended approximately
7,000 charter schools nationwide (National Alliance of Public Charter Schools). Much of the
school choice literature focuses on evaluating the academic benefits for students attending
schools of choice as well as impacts on students remaining in traditional public schools. In this
paper, I ask a different question: if and to what extent charter schools compete with private
schools for student enrollment. While it follows logically that charter schools attract students
from private schools because charters offer a financially attractive alternative, there is limited
systematic evidence of any significant private school crowd out in the market due to increasing
charter school presence. I seek to expand this literature and estimate the effect of charter school
presence on the market share of private schools, specifically the effect on private school student
enrollment and the number of private schools.
The background and current market of charter and private schooling in the United States
are important to understand when examining how families sort between school sectors. Charter
schools are public schools that do not have typical neighborhood catchment areas; students from
any public school district can attend. Charter schools also have greater autonomy compared to

65
traditional public schools in selecting curriculum, in setting a school’s mission, and in hiring
decisions. The first charter law was passed in Minnesota in 1991. Since then, charter schools
have spread across the country leaving only seven states, as of 2018, without having a charter
school law. Charter laws have received bipartisan support, notably when President Barack
Obama encouraged their growth under the federal Race to the Top program in 2009. Up until
recently, many states expanded students’ access to charter schools by raising or eliminating caps
on charter student enrollment and the number of charter schools allowed. Nationwide charter
schools enroll six percent of all public school students; however, charter enrollment varies
greatly across states with states reporting anywhere from one to fifteen percent of total public
school enrollment (National Center for Education Statistics A).
Private school enrollment across the country over the past twenty years has been
relatively stable at about ten percent of total K-12 enrollment, or approximately 5.8 million
students. Most families whose children attend private schools pay for tuition out of pocket or
find private scholarships. There are a variety of publicly-funded private school choice programs
which take the form of vouchers, education saving accounts, or tax-credit scholarships all of
which provide money for families to select a private school of their choice. Compared to the
rapid rise of charter schools, the number of private school choice programs have grown at a
considerably slower rate in comparison and consist of a much smaller percent of school aged
children (McShane, 2015b). As of 2018, only 31 states had any type of private school choice
program. In 2000, there were less than 50,000 students using a private school choice program,
and as of 2018, over 450,000 students participated in a private choice program (Edchoice, 2019).
Programs are limited in part due to political unpopularity and in part because many private

66
choice programs are targeted specifically for economically disadvantaged families or for families
who have children with disabilities (McShane, 2015b).
Understanding the extent to which charter schools compete with private schools is
important when considering various educational policies. Private schools are an important, albeit
small, part of the schooling market in the United States. A decline or increase in any school
sector whether is it private, charter, or traditional public can have consequences on access to
schools, education quality, and various student outcomes. It is also important to consider the
financial implications of a change in student enrollment across various sectors. If students who
have traditionally attended private schools do enter the public system by enrolling in charter
schools, public education dollars are spread among more children reducing the total amount of
public dollars spent per student. Understanding competition among schooling sectors can also
reveal various family preferences. Specifically, if families decide to leave private schools and
enter charter schools, that decision illustrates that families value whatever it is that charter
schools offer to them more than what their assigned public school offers.
Research Question and Theory
In this paper I ask to what extent do charter schools penetrate the private school market
and eventually crowd out private schools? Specifically, I look at how charter schools impact
private school student enrollment as well as the quantity of private schools within a county. I
operationalize the presence of charter schools by using three definitions: student enrollment in
charter schools, the number of charter schools, and simply if at least one charter school exists in
a county. I then estimate the impact that each measure of charter presence has on private school
student enrollment and the number of private schools in a county.

67
In a non-school choice market, families have the option of attending a public school that
is free of direct costs or a private school where they are responsible for tuition and fees. Due to
the cost differences, public schools have a clear competitive advantage over private schools
when competing for student enrollment. In order for a family to attend a private school, the
perceived benefit of the private school must greatly outweigh the benefit of their nearby public
school due to the large cost associated with the private school.
However, when charter schools are introduced into the market, families have a choice
between two types of public schools, both without any directs costs, in addition to private
schools. Charter schools have greater flexibility than do traditional public schools over hiring
decisions, curriculum, mission statements, and budgets. Charter schools can innovate and
specialize the schools’ missions to attract families. When charter schools are available, families
attending private schools have a less expensive option that may be preferable to the traditional
public school that they were originally assigned. A charter school does not necessarily need to be
as attractive as a private school is for a family to switch to it. The charter school just needs to
offer a more favorable cost benefit ratio to induce the switch. As charters remain in the market,
families who attend private schools are more likely to switch to charter schools as a cost-
effective alternative. As a result of the increased charter presence in the market, private school
enrollment decreases, and, over time, private schools may close due to lower demand, therefore
resulting in a decreased number of private schools.
To further illustrate the competition between charter and private schools, consider the
supply and demand functions for both schooling sectors. Equations (1) and (2) represent the
supply and demand for charter and private schools. The supply of charter schools (equation 1) is
a function of the price of charter schools (𝑃𝑐), in this case the amount of public funding charter

68
schools receive, and the legal regulations on charter schools (𝐿𝑐), such as limits on: student
enrollment, the number of new charter schools, or the number of charter school authorizers. The
demand for charter schools is a function of the price of charter schools (𝑃𝑐), the price of
traditional public schools(𝑃𝑡𝑝𝑠), the price of private schools (𝑃𝑝), and the quality of charter
schools (𝑄𝑙𝑐). In reality, the price to families of traditional public schools and charter schools is
zero. As such, the price of private schools and the quality of charter schools are the largest
contributors in the demand function for charter schools. If the charter market was in equilibrium,
the supply of schools would equal the demand for schools. However, the charter school market is
not in equilibrium demonstrated by many schools having student waitlists.
The supply of private schools (equation 2) is a function of the price of private schools
(𝑃𝑃) and other societal factors (𝐸𝑝) that would affect where private schools are established, such
as whether there is a Catholic Diocese in a given area. The demand for private schools is a
function of the price of private (𝑃𝑝), traditional public (𝑃𝑡𝑝𝑠), and charter schools (𝑃𝑐) as well as
the quality of private schools (𝑄𝑙𝑝) and the quantity of charter schools (𝑄𝑐). The quantity of
charter schools affects the demand for private schools because there are not enough charter
schools to meet the demand. Hence, students enroll in private schools when charter schools are
absent from the market, but when charters are present, students in private schools may switch
sectors.
𝑆𝑐(𝑃𝑐, 𝐿𝑐) ≤ 𝐷𝑐(𝑃𝑐, 𝑃𝑡𝑝𝑠, 𝑃𝑝, 𝑄𝑙𝑐) (1)
𝑆𝑃(𝑃𝑃, 𝐸𝑝) = 𝐷𝑝(𝑃𝑃, 𝑃𝑡𝑝𝑠 , 𝑃𝑐, 𝑄𝑙𝑝, 𝑄𝑐) (2)
The relationship between the presence of charter schools and the supply of private
schools is illustrated in Figure 1. D1 and SSR represent the demand and supply curve prior to
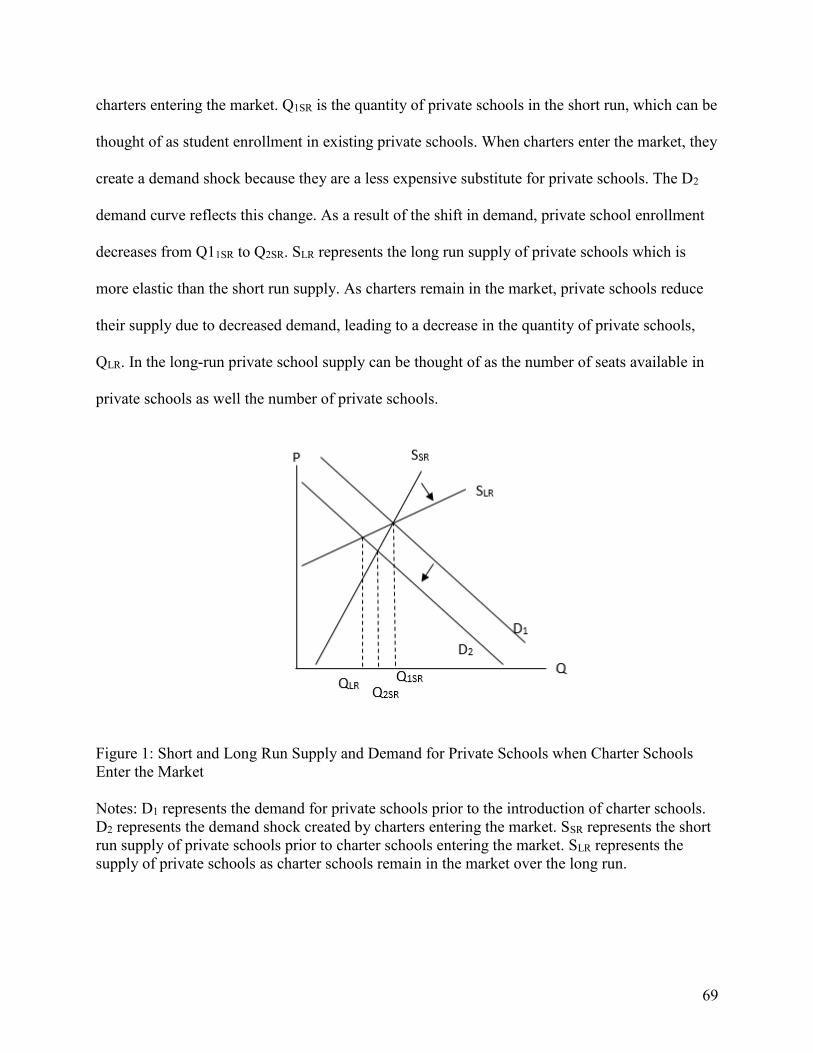
69
charters entering the market. Q1SR is the quantity of private schools in the short run, which can be
thought of as student enrollment in existing private schools. When charters enter the market, they
create a demand shock because they are a less expensive substitute for private schools. The D2
demand curve reflects this change. As a result of the shift in demand, private school enrollment
decreases from Q11SR to Q2SR. SLR represents the long run supply of private schools which is
more elastic than the short run supply. As charters remain in the market, private schools reduce
their supply due to decreased demand, leading to a decrease in the quantity of private schools,
QLR. In the long-run private school supply can be thought of as the number of seats available in
private schools as well the number of private schools.
Figure 1: Short and Long Run Supply and Demand for Private Schools when Charter Schools
Enter the Market
Notes: D1 represents the demand for private schools prior to the introduction of charter schools.
D2 represents the demand shock created by charters entering the market. SSR represents the short
run supply of private schools prior to charter schools entering the market. SLR represents the
supply of private schools as charter schools remain in the market over the long run.

70
Previous Literature
There is a robust body of literature on the academic benefits from school choice (Angrist,
et al. 2016; Betts & Tang, 2011; Foreman, 2017; Forster, 2013; Shakeel, Anderson, & Wolf,
2016; Wolf et al., 2013), the competitive effects on public schools (Arsen and Ni, 2012; Carnoy
et al., 2007; Forster, 2013; Hoxby, 2001; Hoxby, 2003), as well as parental preferences and
satisfaction (Erickson, 2017; Lincove, Cowen, & Imbrogno, 2018; Schneider & Buckley, 2002;
Zeehandelaar & Winkler, 2013). There is less research on the supply of schools of choice and
even less research on how the demand and supply in one school sector affects another (McShane
2015a).
As noted earlier, charter schools have increased rapidly over the past twenty years.
Charters have grown in part due to political popularity and in part due to their organizational
structure. Smarick (2015) describes three factors which charter schools exemplify that have
contributed to their quick growth: school-network structure, incubation of high-potential schools,
and authorizer-based accountability. These features are unique to charter schools and allow for
relatively rapid proliferation of high-quality schools. Smarick suggests that if private schools
embrace these factors, private schools will improve education quality for students in the short-
run and have lasting long-term effects on the quality and quantity of private schools. However,
unlike charter schools, private school choice programs are not designed in similar ways to
encourage new entrants in the market or even the expansion of existing private schools. Current
programs have done well at filling open seats in existing private schools, but the programs have
done little to encourage new private schools to enter the market or to encourage existing private
schools to increase student capacity (McShane, 2015b). As such, the current supply of private
schools is unlikely significantly affected by private choice programs. The supply of private
schools in the market is primarily driven by demand for alternatives to traditional public schools

71
that families are willing to pay for. Given the policy context of charter and private schools,
charter schools are well positioned to compete with private schools for student enrollment.
McShane and Kelly (2014) present empirical evidence of private school crowd-out. They
document a pattern of private Catholic schools in Miami, Washington, D.C., and Indianapolis
actually switching sector by closing and then reopening as charter schools. The private schools
report declining student enrollment and competition created by charter schools in the area as part
of their reason for closing. After converting to charter schools, these schools experienced
increased enrollment due to the removal of tuition as a financial barrier. McShane and Kelly
suggest that in an unbalanced choice market where public school choice is more easily accessible
and where parents who want to send their children to private schools continue to face significant
financial barriers, charter schools have a competitive advantage and, as a result, private schools
leave the market.
In related research, Buddin (2012) examines student enrollment trends across the country
among private, charter, and traditional public schools that are located within the same geographic
school district. He finds that charter schools attract students from traditional public schools as
well as from private schools. He finds that, on average, eight percent of charter elementary
students and eleven percent of middle and high school students in a school district transfer from
private schools. In a similar design, Chakrabarti and Roy (2016) study competition between
charter and private schools in Michigan. However, they find no significant crowd out of private
schools following the passage of charter legislation. Using fixed effects and an instrumental
variable approach, Chakrabarti and Roy find no statistically significant decline in private school
enrollment when charters locate nearby. They also find no differential effects on private school
enrollment when considering religious and non-religious private schools. Chakrabarti and Roy

72
hypothesize that due to the low quality of Michigan charter schools, which they claim have
typically performed no better or even worse than traditional public schools on student test scores,
families in private schools were unlikely to switch sectors. Private school parents may not have
viewed low performing charter schools as viable alternatives to their current private school.
In this paper, I add to the previous literature on private school crowd out by evaluating
the extent to which charter schools crowd out private schools by measuring the effect of charter
competition on both private school student enrollment and the number of private schools
nationwide. While past research evaluates nationwide student enrollment trends among school
sectors, there is no research, to my knowledge, that estimates the impact of the charter schooling
sector on the quantity of private schools nationwide.
Research Methodology
I use county level data covering all private, public and charter schools across the country
to estimate the effect charter schools have on the quantity of and student enrollment in private
schools. I use data from the Private School Universe Study (PSS) which surveys every private
school in the U.S. every two years. For data on traditional public and charter schools, I use the
Common Core of Data (CCD) which collects data on all public and charter schools annually. The
data span from SY1991-1992 to SY 2011-2012 with a total of eleven years of data. I only
include eleven years of data due to the PSS being collected every two years instead of yearly as
is the CCD. It is important to note that while the first charter school law was passed in 1991,
charter schools do not appear in the CCD until 2000. Table 1 contains summary statistics of the
data. Over this time period, a county on average has about 46 total schools with the majority
being public schools and has an average of 9.35 private schools and less than one charter school.
Across all years in the data, the average total K-12 student enrollment in a county is 16,585, with

73
1,670 students in private schools and 221 students in charter schools. When limiting the data
from 2000-2012, the average number of charter schools in a county is 1.2 with average
enrollment of 348 students9.
The data are at the county level where each observation is a county in a given year. The
sample contains 3,149 unique counties and 34,521 observations over the eleven years. I focus at
the county level to restrict the area in which schools can compete with each other. Private and
charter schools can only compete with each other for student enrollment if the schools are
geographically close together. Due to variation in county size varies across and within states,
there is a possibility that some counties are too large for schools to realistically compete with
each other. A charter school locating in one part of the county may not create strong competitive
pressures for a private school that is located on the opposite side of the county. However, other
potential units of analysis risk being too large or too small to detect any effects. A state level
would mask potential effects because charter schools tend to locate in urban areas more than in
rural areas. Some might argue that a school district level would be the best unit of analysis,
similar to Buddin (2012). However, many school districts are geographically very small and
therefore do not capture the full competitive effect a charter school poses. A charter school that
locates in a geographically small school district could attract students from multiple neighboring
districts.
9 When the analysis is limited to only years when the CCD reports charter information, 2000-2012, the estimated
effects are slightly larger but are consistent with the findings presented.

74
Table 1: Summary Statistics by County including eleven years of data
Variable N Mean Std. Dev. Min Max
Year 34,521 1992 2012
All Schools 34,521 45.96 452.14 1
37,207
Charter Schools 34,521 0.76 6.30 0 323
Private Schools 34,521 9.35 38.25 0 2,186
Public Schools 34,521 35.85 444.91 0 37,207
Any Charter 34,521 0.12 0.33 0 1
Private Enroll 34,521 1,670.60 7,322.45 0 246,927
Charter Enroll 34,521 221.83 2,063.10 0 128,665
Public Enroll 34,449 14,717.03 48,789.27 0 1,703,003
Total K-12 Enroll 34,449 16,585.52 56,659.76 0 1,972,756
Notes: The county level data cover eleven years, starting in 1992 and continuing
every two years until 2012. Charter schools do not show up in the data until 2000.
The average number of charter schools in a county from 2000-2012 is 1.2, with
average enrollment in all charter schools of 348.60.
Analytic Strategy
Following the school choice competitive effects literature, I leverage the large panel data
set and use county fixed effects to estimate the effect charter schools have on the share of private
schools within a given county. A fixed effects strategy will compare enrollment trends within a
given county. A county fixed effect controls for all time invariant county characteristics that
could affect the private school market share. In my most conservative models, I estimate the
effect including year fixed effects which controls for any year specific shocks that could affect
private and charter school enrollment. This strategy effectively compares enrollment trends
within the same county within the same year. In additional models, to capture the long-term
effect of charter competition, I include a trend variable which accounts for how long charter
schools have been legal in a given state. The interaction between the measures of charter
presence and the time trend estimates the long-term effect of charter presence on the private
school market share. The model is as follows where i represents county and t represents year:

75
𝑃𝑟𝑖𝑣𝑎𝑡𝑒𝑆ℎ𝑎𝑟𝑒𝑖𝑡
= 𝛽0 + 𝛽1𝐶ℎ𝑎𝑟𝑡𝑒𝑟𝑃𝑟𝑒𝑠𝑒𝑛𝑐𝑒𝑖𝑡 + 𝛽2𝐶ℎ𝑎𝑟𝑡𝑒𝑟𝑃𝑟𝑒𝑠𝑒𝑛𝑐𝑒 ∗ 𝑇𝑟𝑒𝑛𝑑𝑖𝑡 + 𝛽3𝑇𝑟𝑒𝑛𝑑𝑖𝑡
+ 𝛽4𝐾12𝑒𝑛𝑟𝑜𝑙𝑙𝑚𝑒𝑛𝑡𝑖𝑡 + 𝛿𝑖 + 𝛼𝑡 + 휀𝑖𝑡
𝑃𝑟𝑖𝑣𝑎𝑡𝑒𝑆ℎ𝑎𝑟𝑒𝑖𝑡 is measured by private school enrollment and the number of private schools in a
given county, both definitions are included in separate models. To capture 𝐶ℎ𝑎𝑟𝑡𝑒𝑟𝑃𝑟𝑒𝑠𝑒𝑛𝑐𝑒𝑖𝑡,
which is the main variable of interest, I use three different definitions: charter school enrollment,
whether or not there is at least one charter school in the county, and the number of charter
schools. These measures capture the extent of the competition charters pose to private schools in
the same county and are the same definitions of charter presence that Chakrabarti and Roy
(2016) use in their analysis of private school crowd out in Michigan. Also similar to Chakrabarti
and Roy (2016), I include 𝑇𝑟𝑒𝑛𝑑𝑖𝑡which accounts for how long a charter law has been in place
in a given state. The variable takes a 0 in the year a charter law was passed, and negative values
for time periods leading up to passage and positive values in years following passage of the law.
The data is biennial, so if a state passed a charter law in 2000, the trend variable would take the
value 0 in 2000, -1 in 1998, -2 in 1996, 1 in 2002, and 2 in 2004 for each county in the given
state. The interaction of trend and charter presence, 𝐶ℎ𝑎𝑟𝑡𝑒𝑟𝑃𝑟𝑒𝑠𝑒𝑛𝑐𝑒 ∗ 𝑇𝑟𝑒𝑛𝑑𝑖𝑡, represents the
effect of charter competition over time on the market share of private schools. I also include
𝐾12𝑒𝑛𝑟𝑜𝑙𝑙𝑚𝑒𝑛𝑡𝑖𝑡 which is the total K-12 student enrollment in the county, 𝛼𝑡 is a year fixed
effect, and 𝛿𝑖 is the county fixed effect. To correct for correlation of country errors across time,
the error term, 휀𝑖𝑡, is clustered at the county level.
Results
Table 2 contains the estimates for the impacts of charter school presence on private
school enrollment. Columns 1-3 present the results using the charter school enrollment in a

76
county; columns 4-6 include the results using a dummy variable for if a county has any charter
schools; columns 7-9 show the results using the number of charter schools in a county. The first
columns of each new measure of charter presence (Columns 1, 4, and 7) present the results
without year fixed effects. The second columns (Columns 2, 5, and 8) present the results
including year fixed effects. The third columns (Columns 3, 6, and 9) present the results of
charter presence interacted with the time trend variable.
Each measure of charter presence shows generally the same pattern; as charter presence
increases, private school enrollment decreases. Charter school student enrollment has the most
significant effect on private school enrollment as an increase in one student enrolling in a charter
school results in a decrease in private school enrollment by 0.26 students (Table 2, Column 2).
This result is substantial when considering charter school enrollment increasing by 10 or even
100 students then resulting in a decrease in private school enrollment by 2.6 to 26 students,
respectively. When considering the impact of the number of charter schools, increasing the
number of charter schools by one results in a decrease in private school enrollment by nearly 63
students (Table 2, Column 8); however this result is only statistically significant at the 90%
confidence level. When measuring charter presence with a dummy variable for at least one
charter school, the effect on private school enrollment is negative but is not statistically
significant (Table 2, Columns 4 and 5).
In addition, the interaction between charter presence and trend is also negative and
statistically significant, suggesting that there is a considerable, compounding negative effect of
charter presence over time on private school enrollment. The coefficients on charter enrollment
(Table 2, Column 3), any charter (Table 2, Column 6), and the number of charter schools (Table
2, Column 9) are all positive. While this seems opposite to the previously estimated effects in

77
Columns 2,5, and 8, the coefficients on charter presence can be interpreted as the estimated
effect of charters when trend equals zero. However, when trend is equal to zero charter schools
do not yet exist in a county, and, as such, the coefficients have no meaningful interpretation by
themselves in these models.
Table 3 contains the estimates for the impact of charter school presence on the number of
private schools. Columns 1-3 present the results using the charter school enrollment in a county;
columns 4-6 include the results using a dummy for whether or not a county has at least one
charter school; columns 7-9 show the results using the number of charter schools in a county.
The first columns of each new measure of charter presence (Columns 1, 4, and 7) present the
results without year fixed effects. The second columns (Columns 2, 5, and 8) present the results
including year fixed effects. The third columns (Columns 3, 6, and 9) present the results with
charter presence interacted with the time trend variable.
A consistent pattern exists between charter presence and the number of private schools in
a county as it did when looking at private school enrollment; as charter presence increases, the
number of private schools in a county decreases. Having at least one charter school in a county
reduces the number of private schools by 1.3 schools (Table 3, Column 5). In a similar direction,
each additional charter school in a county decreases the number of private schools by 0.53 of a
school. Understandably, charter school student enrollment captures the smallest effect on the
number of private schools; increasing charter enrollment by one student reduces the number of
private schools by 0.002 (Table 3, Column 2). To put it in more realistic terms, increasing charter
enrollment by 100 students reduces the number of private schools by 0.2. These effects are all
significant at the 95% confidence level or higher.

78
When considering any compounding effect of charter presence over time, the interaction
terms between the time trend and the three measures of charter presence are negative and
statistically significant (Table 3, Columns 3, 6, and 9). This pattern suggests that the longer
charters have been legal in a state combined with increased charter school presence in a given
county significantly reduces the number of private schools in that county.

79
Table 2: Impact of Charter School Presence on Private School Enrollment
1 2 3 4 5 6 7 8 9
Charter -0.261*** -0.261*** 0.137
Enrollment (0.085) (0.085) (0.229)
Any Charter -92.287 -89.102 1,002.771***
(121.876) (110.078) (156.599)
# Charter Schools -62.863* -62.835* 91.497**
(33.822) (34.087) (44.371)
Trend*Charter -0.047**
Enrollment (0.021)
Trend*Any -178.779***
Charter (30.124)
Trend*# Charter -19.298***
School (6.113)
Trend -83.464** -80.818** -82.881**
(41.087) (41.136) (41.382)
K-12 Enrollment 0.042* 0.041* 0.038* 0.033** 0.033** 0.032* 0.040* 0.040* 0.037*
(0.025) (0.024) (0.022) (0.017) (0.016) (0.016) (0.024) (0.023) (0.021)
Observations 34,438 34,438 27,967 34,438 34,438 27,967 34,438 34,438 27,967
# of Counties 3,149 3,149 2,553 3,149 3,149 2,553 3,149 3,149 2,553
Year fixed effect YES YES YES YES YES YES
Joint Significance
P-value^
0.000 0.000 0.005
R-squared 0.217 0.227 0.250 0.081 0.093 0.106 0.147 0.158 0.200
Standard errors in parentheses are clustered by county. *** p<0.01, ** p<0.05, * p<0.1
^Joint Significance P-value is the p-value for a test of joint significance of charter presence and the interaction between
charter presence and trend.
Analysis including the time trend excludes 9 states (WV, WA, VT, SD, ND, NE, MT, KY, AL) that did not have a charter
law by 2012.
79

80
Table 3: Impact of Charter School Presence on Number of Private Schools 1 2 3 4 5 6 7 8 9
Charter -0.002*** -0.002*** -0.001 Enrollment (0.001) (0.001) (0.001)
Any Charter -1.429*** -1.350*** 2.625***
(0.504) (0.479) (0.862) # Charter -0.528** -0.531** 0.163
Schools (0.265) (0.271) (0.217)
Trend*Charter -0.000* Enrollment (0.000)
Trend*Any -0.652*** Charter (0.166)
Trend*Charter -0.087***
School (0.025)
Trend 0.197 0.280 0.200
(0.354) (0.390) (0.361)
K-12 0.000 0.000 0.000 0.000 0.000 0.000 0.000 0.000 0.000
Enrollment (0.000) (0.000) (0.000) (0.000) (0.000) (0.000) (0.000) (0.000) (0.000)
Observations 34,438 34,438 27,967 34,438 34,438 27,967 34,438 34,438 27,967
# of Counties 3,149 3,149 2,553 3,149 3,149 2,553 3,149 3,149 2,553
Year fixed effect YES YES YES YES YES YES
Joint
significance p-
value^ 0.000 0.000 0.003
R-squared 0.087 0.095 0.100 0.001 0.011 0.014 0.052 0.061 0.072
Standard errors in parentheses are clustered by county. *** p<0.01, ** p<0.05, * p<0.1
^Joint Significance P-value is the p-value for a test of joint significance of charter presence and the interaction between
charter presence and trend
Analysis including the time trend excludes 9 states (WV, WA, VT, SD, ND, NE, MT, KY, AL) that did not have a
charter law by 2012.
80

81
Discussion
Overall, I find evidence of modest private school crowd out as a result of increasing
charter presence. Charter school presence has an impact not only on private school student
enrollment but also on the number of private schools. These results suggest that private schools
face significant enough competition from charter schools for private schools to lose student
enrollment and actually close or possibly consolidate multiple locations. There are a few
limitations that are important when considering the implications of these findings. First,
restricting the geographical area that schools can reasonably compete with each other always
risks being too large or too small to accurately estimate the effect. It is possible that limiting the
analysis to the county level masks some of the effect given that, in large counties, schools
locating on opposite ends of the county may not actually be competitors with each other. This
analysis also does not capture the competitive effects of schools that are located near each other
but on opposite sides of a county line. However, given that other units of analysis such as school
districts or states have similar if not more severe limitations, the county level is a reasonable
level that balances the risks of being too small to too large to accurately estimate the effect.
Additionally, this analysis does not account for virtual charter or private schools. Virtual private
and charter schools are included in the PSS and CCD. However, virtual charter schools could
pose competitive effects to all private schools in a state, given that families who want to use
virtual schools face no geographic constraints. Including virtual charter schools in this analysis
has the potential to weaken the estimated effect as the model only captures the effect of the
virtual charter school in the county where its offices are located instead of the effect across the
entire state. Given that the current models in this paper find a significant effect, it is possible that

82
the estimated effects are a lower bound of the potential effect charter schools could have on the
private school market share.
Despite these limitations, the findings in this paper are significant when considering
school choice policies broadly. First, these findings suggest that there is demand for other
schooling options. When charter schools enter the market, some families leave private schools,
where they paid a premium, for the more cost-effective alternative of charter schools. However,
the number of families who leave private schools is modest and does not account for all charter
school enrollment. Therefore, charter school enrollment primarily comes from students who
attend traditional public schools, suggesting that there are families in traditional public schools
who prefer other options, but due to financial constraints or the lack of nearby options, are not
able to attend a private school and instead enroll in a charter school when it becomes available.
Similar to what Chakrabarti and Roy (2016) demonstrate, the findings in this paper show that
parents prefer charter schools to traditional public schools, not that parents prefer charter schools
to private schools, due to the additional costs of attending a private school10. This pattern also
suggests that families would sort between school sectors differently than they currently do if
there was a robust choice market that removed cost differences among schooling sectors.
Second, when students move from private schools to charter schools, public education
funding is spread across more students causing an overall decline in the money spent per student.
As charter schools continue to grow in the market, more students in private schools and those
who would have entered private schools will enter charter schools instead, creating greater
financial strain on public resources. In times when public resources are strained among
education, healthcare, and transportation, additional students who would not have entered the
10 For clarity, I run the analysis replacing private school enrollment with public school enrollment as the dependent
variable and find that approximately 74% of charter enrollment comes from students in traditional public schools.

83
public school system if it were not for the introduction of charter schools will increase the
demand for additional funds to be allocated to public education. As charter schools remain in the
market and increase in quality, more private school students will likely opt for charter schools.
The extent of the additional financial burden is unknown as charter schools draw only a portion
of private school users. There is likely a specific group of families who will always be private
school users despite availability of charter schools.
Third, the decline in the number of private schools has implications for further expansion
of private school choice programs as well as for the options available to families in the schooling
market. If the supply of private schools continues to decrease due to competition from charter
schools, families in areas that have a high concentration of charter schools will have fewer
schooling options overall, even if they are willing to pay a premium for a private education.
There are some potential drawbacks from a declining private school market share. Private
schools are the only schools that are able to include religious instruction. Over 50% of private
school students are enrolled in religious schools, with 38% of those students in Catholic schools
(National Center for Education Statistics). There is evidence showing that religious education
has positive effects on student outcomes. Catholic schools have higher graduation rates for
underprivileged students in large urban areas compared to public schools (Grogger & Neal,
2000; Neal 1995). Bowen and Cheng (2016) show that when students receive religious cues
during a task, compared to secular cues, students’ exhibit greater self-regulation and political
tolerance. Their findings suggest that religious based education can provide benefits that charter
or traditional public schools may not be able to replicate. I do not indent to suggest that one
sector is preferable over the other, but that the decline in one market could have unexpected

84
negative effects for the education system as a whole as well as the availability of a variety of
schooling options for families.
A low supply of private schools also creates challenges when implementing new and
expanding existing private school choice programs. Current private school choice programs have
not encouraged a substantial increase in the number of private schools (McShane, 2015b).
However, there is some evidence suggesting that charters do not crowd out private schools when
there is a robust private choice market. Ladner (2007) analyzed the competition between charter
and private schools in Arizona and found no significant crowd out of private schools. He
hypothesized that this pattern could be due to the robust private school choice programs available
in Arizona, which removes the financial advantage of charter schools. If private school choice
programs were expanded and designed to encourage a greater supply of private schools to enter
the market, more families may choose private schools over charter or traditional public schools.
Increasing public and private choice options would allow families to sort based on their
preferences and the perceived quality of schools instead of by cost differences.
Conclusion
This paper demonstrates that charter schools crowd out existing private schools.
Leveraging a national panel data set and using a county-level fixed effects model, I analyze the
extent to which private school student enrollment and the supply of private schools is affected by
the presence of charter schools in a county. I find that when charter schools enter the market,
many families switch from their children attending private schools where they are financially
responsible for tuition and fees to charter schools where they are not. I also find evidence that as
charter schools persist in the market, the number of private schools in a county decreases. These
patterns have implications for broader education policy because a declining private school

85
market causes additional financial strain on public funding as well as an overall loss of schooling
options for families to choose from.

86
References
Angrist, J. D., Cohodes, S. R., Dynarski, S. M., Pathak, P. A., & Walters, C. R. (2016). Stand
and deliver: Effects of Boston’s charter high schools on college preparation, entry, and
choice. Journal of Labor Economics, 34(2), 275-318.
Arsen, D., & Ni, Y. (2012). The Effects of Charter School Competition on School District
Resource Allocation. Educational Administration Quarterly 48 (1): 3-38.
Betts, J. R., & Tang, E. Y. (2011). The Effect of Charter Schools on Student Achievement: A
Meta-Analysis of the Literature. Center for Reinventing Public Education.
http://files.eric.ed.gov/fulltext/ED526353.pdf.
Bowen, D. H., & Cheng, A. (2016). Losing My Religion? The Impact of Spiritual Cues on
Noncognitive Skills. Journal of Catholic Education 20 (1):152-176.
Buddin, R. (2012). The Impact of Charter Schools on Public and Private School Enrollment.
Policy Analysis no. 707. Cato Institute.
Chakrabarti, R., & Roy, J. (2016). Do charter schools crowd out private school enrollment?
Evidence from Michigan. Journal of Urban Economics, 91, 88-103.
Carnoy, M., Adamson, F., Chudgar, A., Luschei, T. F., & Witte, J. F. (2007). What Do We
Know About Research on Competition Effects? Chapter 2 in Vouchers and Public School
Performance: A Case Study of the Milwaukee Parental Choice Program. Washington,
D.C: Economic Policy Institute, pp. 13-19.
Edchoice. (2019). The ABCs of School Choice: The Comprehensive guide to every private
school choice program in America. Retrieved from https://www.edchoice.org/wp-
content/uploads/2019/01/The-ABCs-of-School-Choice-2019-Edition.pdf.
Erickson, H. H. (2017). How do parents choose schools, and what schools do they choose? A
literature review of private school choice programs in the United States. Journal of
School Choice, 11(4), 491-506.
Foreman, L. M. (2017). Educational attainment effects of public and private school
choice. Journal of School Choice, 11(4), 642-654.
Forster, G. (2013). A Win-Win Solution: The Empirical Evidence on School Choice. The
Friedman Foundation for Educational Choice.
Grogger, J. &. Neal D. A. (2000). Further Evidence on the Effects of Catholic Secondary
Schooling. Brookings-Wharton Papers on Urban Affairs 2000, 151-193 Brookings
Institution Press. Retrieved from http://muse.jhu.edu/article/35575/pdf.
Hoxby, C. (2001). Rising tide. Education Next, 1(4), 69-74.

87
Hoxby, C. M. (2003). School choice and school productivity. Could school choice be a tide that
lifts all boats?. In The economics of school choice (pp. 287-342). University of Chicago
Pres
Ladner, M. (2007). The Impact of Charter Schools on Catholic Schools: A Comparison of
Programs in Arizona and Michigan. Journal of Catholic Education, 11 (1).
Lincove, J. A., Cowen, J. M., & Imbrogno, J. P. (2018). What's in Your Portfolio? How Parents
Rank Traditional Public, Private, and Charter Schools in Post-Katrina New Orleans’
Citywide System of School Choice. Education Finance and Policy, 13(2), 194-226.
McShane, M. (2015a). Balancing the Equation: Supply and Demand in Tomorrow’s School
Choice Marketplaces. American Enterprise Institute.
McShane, M. (2015b). School Choice: Encouraging New and Better Schools in New and Better
Schools: The Supply Side of School Choice. Lanham, Maryland: Rowman & Littlefield.
McShane, M. & Kelly A. P. (2014). Sector Switchers: Why Catholic Schools Convert to
Charters and What Happens Next. The Friedman Foundation for Educational Choice.
National Alliance for Public Charter Schools. Charter School Data Dashboard.
https://data.publiccharters.org.
National Center for Educational Statistics A. Fast Facts: Charter Schools.
https://nces.ed.gov/fastfacts/display.asp?id=30.
National Center for Educational Statistics. The Condition of Education: Private school
enrollment. https://nces.ed.gov/programs/coe/indicator_cgc.asp.
Neal, D. (1995). The Effect of Catholic Secondary Schooling on Educational Attainment.
National Bureau of Economic Research, working paper 5353.
Schneider, M., & Buckley, J. (2002). What do parents want from schools? Evidence from the
Internet. Educational Evaluation and Policy Analysis, 24(2), 133–144.
doi:10.3102/01623737024002133.
Shakeel, M., Anderson, K. P., & Wolf, P. J. (2016). The participant effects of private school
vouchers across the globe: A meta-analytic and systematic review. EDRE Working Paper
2016-07 Retrieved from: https://papers.ssrn.com/sol3/papers.cfm?abstract_id=2777633.
Smarick, A. (2015). “What Private School Choice Can Learn from Chartering: Networks,
Incubation, and Authorization” in New and Better Schools: The Supply Side of School
Choice. Lanham, Maryland: Rowman & Littlefield.

88
Wolf, P. J., Kisida, B., Gutmann, B., Puma, M., Eissa, N., & Rizzo, L. (2013). School vouchers
and student outcomes: Experimental evidence from Washington, DC. Journal of Policy
Analysis and Management, 32(2), 246-270.
Zeehandelaar, D., & Winkler, A. M., Eds. (2013). What parents want: Education preferences and
trade-offs. Thomas B. Fordham Institute. Retrieved from:
https://fordhaminstitute.org/national/research/what-parents-want-education-preferences-
and-trade-offs

89
Conclusion
This dissertation demonstrates the importance of expanding existing outcomes that are
presently used to evaluate educational policies. The high-stakes, test-based accountability era has
created a hyper sensitivity to test scores. As a result, researchers and policymakers have focused
their attention primarily on programs designed to increase students’ math and reading test scores.
This increased focus has come at the cost of other valuable programs and has led to a narrow
view of the purpose of a formal education. In the three preceding chapters, I have used rigorous
methods to evaluate three different programs on various education outcomes that are important
for students’ overall success as well as outcomes that are important for the U.S. school system.
The first chapter demonstrates the value of enriching a student’s experience through arts-
related field trips. Schools have decreased the number of field trips due to accountability
pressures. However, my colleagues and I find no evidence that taking multiple days away from
traditional instruction to attend field trips harms student academic learning. We even find
evidence that such experiences have the potential to increase student achievement and
engagement in school. This study presents the results from the second year of an ongoing
longitudinal evaluation. We will continue to follow these students to see if the effects persist
throughout the time when students are in middle and high school.
The second chapter focuses on expanding student outcomes beyond test scores and
evaluates the effect of the Louisiana Scholarship Program (LSP) on college entrance. Previous
evaluations of the LSP have found large negative effects on students’ math and English
Language Arts test scores. However, we find that the LSP had no significant effect on the
likelihood of students entering college. These findings are particularly interesting because they
demonstrate that student test scores are not always correlated with post-secondary outcomes.

90
Policymakers should consider this disconnect as they make decisions regarding the future of
various programs.
The third chapter takes a step back from evaluating student outcomes and illustrates how
policies can have broad effects on the entire U.S. education system. In this chapter, we see how
charter schools have a competitive advantage over private schools for student enrollment. When
charter schools enter the market, private school enrollment and the number of private schools
decrease. Private schools play an important role in the K-12 system with approximately ten
percent of K-12 aged students attending a private school. With the introduction of charter
schools, students who once attended private schools enter the public school system creating
greater financial strain on public resources. This pattern also illustrates that there is significant
demand for cost effective alternatives to traditional public schools. These patterns are important
for policymakers to consider as they plan state and local budgets as well as when designing
school choice programs.
I argue that it is important for researchers and policymakers to consider a breadth of
student and systemic outcomes when evaluating programs; however, I do not intend to suggest
that every new program or policy needs a comprehensive evaluation and that all policy decisions
need to be evidence based. My intention is to question the almost singular-focus on student test
scores and to show instead that broadly considering multiple aspects of education and student
outcomes is important when making policy decisions. Focusing narrowly on student test scores
provides a limited view of education and risks restricting the content that students encounter
during school. Policymakers also risk making incorrect conclusions about the success or failure
of a program when only considering its short-term effects. Researchers and policymakers should

91
work together to improve education for students by considering broadly the effects policies have
on the school system and students’ long-term outcomes.

92
Institutional Review Board Approvals

93