expanding the earned income tax credit - … · expanding the earned income tax credit for ... plus...
TRANSCRIPT

EXPANDING THE
EARNED INCOME TAX CREDITFOR WORKERS WITHOUT
DEPENDENT CHILDREN
Interim Findings from the Paycheck Plus Demonstration in New York City
Cynthia MillerLawrence F. KatzGilda AzurdiaAdam IsenCaroline Schultz
September 2017


Expanding the Earned Income Tax Credit for Workers Without Dependent Children
Interim Findings from the Paycheck Plus Demonstration in New York City
Cynthia Miller (MDRC)
Lawrence F. Katz (Harvard University)
Gilda Azurdia (MDRC)
Adam Isen (U.S. Department of the Treasury)
Caroline Schultz (MDRC)
September 2017

Funding for the demonstration in New York is provided by the New York City Mayor’s Office for Economic Opportunity, the Robin Hood Foundation, the Laura and John Arnold Foundation, the Edna McConnell Clark Foundation, and the U.S. Department of Health and Human Services through a Section 1115 waiver coordinated by the New York State Office of Temporary and Disability Assistance. Funding for the demonstration in Atlanta is provided by the Annie E. Casey Foundation, the W.K. Kellogg Foundation, the Kresge Foundation, the Ford Foundation, the U.S. Department of Health and Human Services, the U.S. Department of Labor, and the Lifepath Project. Dissemination of MDRC publications is supported by the following funders that help finance MDRC’s public policy outreach and expanding efforts to communicate the results and implica-tions of our work to policymakers, practitioners, and others: The Annie E. Casey Foundation, Charles and Lynn Schusterman Family Foundation, The Edna McConnell Clark Foundation, Ford Foundation, The George Gund Foundation, Daniel and Corinne Goldman, The Harry and Jeanette Weinberg Foundation, Inc., The JPB Foundation, The Joyce Foundation, The Kresge Foundation, Laura and John Arnold Foundation, Sandler Foundation, and The Starr Foundation. In addition, earnings from the MDRC Endowment help sustain our dissemination efforts. Con-tributors to the MDRC Endowment include Alcoa Foundation, The Ambrose Monell Foundation, Anheuser-Busch Foundation, Bristol-Myers Squibb Foundation, Charles Stewart Mott Founda-tion, Ford Foundation, The George Gund Foundation, The Grable Foundation, The Lizabeth and Frank Newman Charitable Foundation, The New York Times Company Foundation, Jan Nichol-son, Paul H. O’Neill Charitable Foundation, John S. Reed, Sandler Foundation, and The Stupski Family Fund, as well as other individual contributors. The findings and conclusions in this report do not necessarily represent the official positions or policies of the funders or of the U.S. Department of the Treasury. For information about MDRC and copies of our publications, see our website: www.mdrc.org. Copyright © 2017 by MDRC®. All rights reserved.

iii
Overview
In recent decades, wage inequality in the United States has increased and real wages for less-skilled workers have declined. As a result, many American workers are unable to adequately support their families through work, even working full time. The Earned Income Tax Credit (EITC) has helped to counter this trend and has become one of the nation’s most effective antipoverty policies. But most of its benefits have gone to workers with children. The maximum credit available to workers without dependent children is just over $500, and workers lose eligibility entirely once their annual earnings reach $15,000.
There has been bipartisan support for expanding the EITC for this group of workers. Paycheck Plus is a test of that idea. The program, which provides a bonus of up to $2,000 at tax time, is being evaluated using a randomized controlled trial in two major American cities: New York City and Atlanta, Georgia. This report presents interim findings from the test of Paycheck Plus in New York City. Between September 2013 and February 2014, the project in New York recruited just over 6,000 low-income, single adults without dependent children to take part in the study. Half of them were selected at random to be offered a Paycheck Plus bonus for three years, starting with the 2015 tax season.
Findings The program sought to mirror the process by which filers apply for the federal EITC, even though the bonus was not administered by the Internal Revenue Service. Participants needed to apply for each bonus, and receipt of it was not automatic with tax filing.
• About 64 percent of individuals in the program group who had earnings in the eligible range received bonuses in the first year (2015), and 57 percent received bonuses in the second year (2016). Among those who received bonuses, the average amount received was $1,400.
• Paycheck Plus increased after-bonus income (earnings plus bonuses) in both years, and in-creased employment in 2015.
• Paycheck Plus increased tax filing in both tax filing seasons.
• Paycheck Plus increased the payment of child support in 2015.
• Paycheck Plus increased employment in 2015 for most types of participants, although its effects were larger among women than among men.
These findings are consistent with research on the federal EITC showing that an expanded credit can increase after-transfer income and encourage employment without creating work disincentives. Later reports will examine effects after three years on income, work, and other measures of well-being, in both New York City and Atlanta.


v
Contents
Overview iii List of Exhibits vii Preface ix Acknowledgments xi Executive Summary ES-1 Chapters
1 Introduction 1 2 The Earned Income Tax Credit 5
Proportion of Eligible Families Reached 6 Effects 8
3 The Paycheck Plus Demonstration 11 Recruitment and Enrollment 11 Data Sources 15 Research Questions and Expected Effects 16 Participants’ Characteristics 18 The New York City Context 18 Paycheck Plus in Atlanta 21
4 Implementation and Bonus Receipt Rates 23 Applying for the Bonus 26 Bonus Processing 28 Bonus Receipt Rates 28 Bonus Receipt Rates Among Subgroups 34
5 Effects on Income, Work, Earnings, and Other Outcomes 39
Effects on Employment, Earnings, and Income 39 Effects on Filing Taxes 43 Effects for Subgroups 46 Effects on Child Support Payments 49 Conclusion 52
Appendixes A Supplementary Documents 53 B Testing the Effects of a Referral to Employment Services 59

vi
C Baseline Equivalence of Research Groups 63 References 67 Earlier MDRC Publications on Paycheck Plus 71

vii
List of Exhibits
Table
ES.1 Effects on Work, Earnings, and Income ES-8
3.1 Sample Characteristics 19
3.2 Baseline Characteristics of Men and Women 20
4.1 Paycheck Plus Bonus Receipt in 2015 and 2016 29
4.2 Paycheck Plus Bonus Eligibility and Receipt Among Selected Subgroups in 2015 and 2016 35
4.3 Bonus Receipt in 2015 and 2016, by Earnings Level 37
5.1 Effects on Employment, Earnings, and Income 40
5.2 Effects on Employment and Earnings Covered by Unemployment Insurance 42
5.3 Effects of Employment-Referral Services Among Program Group Members Who Earned Less Than $10,000 in the Year Before They Entered the Study 44
5.4 Effects on Tax Filing 45
5.5 Effects for Subgroups, Year 1 (Tax Year 2014) 47
5.6 Effects for Subgroups, Year 2 (Tax Year 2015) 48
5.7 Effects on Child Support Payments and Debt Among Noncustodial Parents 50
C.1 Baseline Characteristics, by Research Group 65
Figure
ES.1 Paycheck Plus Versus the Federal EITC ES-3
ES.2 Paycheck Plus Bonus Receipt ES-6
2.1 EITC for Single Adults with Different Numbers of Children, 2016 7
3.1 Paycheck Plus Versus the Federal EITC 12
3.2 Program Timeline and Follow-Up Period for This Interim Report 14
4.1 Paycheck Plus Outreach Postcard 25
4.2 Distribution of Program Group Members, by Earnings and Eligibility Status 31
4.3 Bonus Receipt Rates Among Eligible Individuals, by Expected Bonus Amount 33

viii
A.1 Paycheck Plus Take-Home Sheet 55
A.2 Employment-Referral Service Supplementary Insert 56
Box
4.1 The Power of Prompts: Using Insights from Behavioral Science to Encourage People to Participate 24

ix
Preface
The Earned Income Tax Credit (EITC) has been one of the nation’s most effective antipoverty policies. It has helped to counteract decades of stagnating or even falling wages for the bottom part of the wage distribution, increasing employment among single mothers and raising millions of families and children out of poverty.
But it could do more. One important and sizable group has been left out of the EITC’s reach: low-income workers who do not have dependent children. This group includes young men and women just starting out, older workers with adult children, and parents who do not have custody of their children. All have faced the same falling wages over the past decades as workers with children, and the same tough labor market of more recent years, and all could benefit from an expanded tax credit. Yet there has been little or no public-policy response.
An expanded credit for this group is not a new idea. Representatives from both political parties have called for a more generous EITC for childless workers. Part of the bipartisan appeal of the EITC is that it reduces poverty while also encouraging work. What is new about Paycheck Plus is that it tests this idea in two large cities. Testing a tax refund as a demonstra-tion, outside of the Internal Revenue Service, brings with it a set of challenges. Eligible workers did not automatically get bonuses if they filed taxes, for example, as they would if an expanded credit were part of the tax code. Instead they had to go through additional steps. Recipients and even tax preparers did not necessarily understand even the EITC itself, and the project had to make sure that participating workers knew and trusted the new program.
The early results are encouraging. Most eligible workers received bonuses. Paycheck Plus increased workers’ incomes and also led a modest increase in employment rates. It also led to an increase in child support payments among parents who owed them. The findings are consistent with a large amount of other research showing that work-based earnings supplements such as the EITC boost employment and earnings while increasing work effort.
The fact that single people working in low-wage jobs are treated differently from those with children raises questions of equity. The findings presented here show that an expanded tax credit can encourage work and increase incomes, just as the EITC has already done for single mothers. Although such a credit would not fully make up for decades of falling wages, it would be a start.
Gordon L. Berlin
President, MDRC


xi
Acknowledgments
This report reflects the generous contributions and support of many people. We are especially grateful to the individuals participating in the Paycheck Plus evaluation, who have allowed us to learn from their experiences. We also appreciate the assistance of the many staff members at the Volunteer Income Tax Assistance (VITA) sites who helped operate the program.
The project would not have been possible without the work and dedication of several individuals and organizations, including Linda Gibbs, former New York City deputy mayor for Health and Human Services; Kristin Morse, former executive director of the New York City Mayor’s Office for Economic Opportunity (NYC Opportunity); and several staff members at New York City’s Human Resources Administration. We thank Carson Hicks and Jean-Marie Callan at NYC Opportunity for continued support and guidance throughout the project. We also thank Michele Ahern and her colleagues at the New York City Office of Child Support En-forcement for assistance in implementing the program and for providing child support data. German Tejeda, Arlene Sabdull, and Andy Nieto at Food Bank for New York City were instrumental in getting the program up and running. We also thank Dale Grant and Patricia Brooks of Grant Associates for assistance with designing and implementing the employment-referral services.
The authors thank Gordon Berlin, Dan Bloom, Rob Ivry, John Hutchins, and James Riccio from MDRC, and Carson Hicks and Jean-Marie Callan from NYC Opportunity for their helpful comments on the report. The authors also received comments from the Paycheck Plus Policy Advisory Group: Chuck Marr, Lauren Pescatore, and Eugene Steuerle.
At MDRC, Alexandra Bernardi coordinated Paycheck Plus program operations in New York City and contributed valuable insights for this report. Kali Aloisi and Paul Veldman processed the quantitative data and Kali Aloisi also coordinated the production of the report. Leslyn Hall helped design the survey instrument and monitored its administration. Joshua Malbin edited the report and Ann Kottner prepared it for publication.
The Authors


ES-1
Executive Summary
In recent decades, wage inequality in the United States has increased and real wages for less-skilled workers have declined. Wages have increased for workers with college degrees by 19 percent since the early 1970s, but have fallen by 17 percent for workers without high school diplomas.1 As a result, many American workers are unable to adequately support their families solely through work, even working full time.
The Earned Income Tax Credit (EITC) has helped to counter rising earnings inequality and stagnating real wages by increasing the incomes of low-income workers. A working, single mother with two children, for example, can get a federal tax refund of up to $5,600 at tax-filing time from the EITC. The credit has been expanded substantially since the 1980s and is now one of America’s most effective antipoverty policies.2 However, the EITC does little to help low-wage workers who do not have dependent children, a group that has faced the same tough labor market as those with children. The maximum credit a worker without dependent children can receive is $506,3 and that worker loses eligibility once his or her earnings reach $15,000. Put differently, an individual working full time at $9 per hour would earn too much to qualify for any credit. This disparity in the treatment of these two types of workers in low-wage jobs raises questions of equity.
Policymakers on both sides of the aisle have recognized the value of the EITC as a poli-cy that both reduces poverty and encourages work, and they have also promoted the idea of expanding it for adults without dependent children. Paycheck Plus is a test of that idea. The program, which provides up to $2,000 at tax time, is being evaluated using a randomized controlled trial in two major American cities: New York City and Atlanta, Georgia. Paycheck Plus in New York City is funded by the New York City Mayor’s Office for Economic Oppor-tunity (NYC Opportunity), the Robin Hood Foundation, the Laura and John Arnold Foundation, the Edna McConnell Clark Foundation, and the U.S. Department of Health and Human Ser-vices.4 The test in Atlanta is being funded by the Ford Foundation, the Annie E. Casey Founda-
1Economic Policy Institute, “Wages by Education” (website: www.epi.org/data/#?subject=wage-
education, 2017). 2Center on Budget and Policy Priorities, “Policy Basics: The Earned Income Tax Credit” (website:
www.cbpp.org/research/federal-tax/policy-basics-the-earned-income-tax-credit, 2016); Austin Nichols and Jesse Rothstein, “The Earned Income Tax Credit,” pages 137-218 in Robert A. Moffitt (ed.), The Economics of Means-Tested Transfer Programs in the United States Volume 1 (Chicago: University of Chicago Press, 2016).
3In 2017, for tax year 2016. 4The U.S. Department of Health and Human Services’ Office of Child Support Enforcement, with the
support of the New York State Office of Temporary and Disability Assistance, is providing funding to the demonstration in New York through a Section 1115 waiver.

ES-2
tion, the Kellogg Foundation, the U.S. Department of Health and Human Services, the U.S. Department of Labor, and the Lifepath Project. MDRC worked with NYC Opportunity to design the demonstration and partnered with the New York City Human Resources Administra-tion and Food Bank for New York City to implement the program. MDRC is also evaluating its effects.
This report presents interim findings from the test of Paycheck Plus in New York City, presenting the proportion of participants who actually received the expanded credit in the first two years, and the credit’s effects over that time on income, work, earnings, tax filing, and child support payments. The findings are consistent with research on the federal EITC showing that an expanded credit can increase after-transfer incomes and encourage employment without creating work disincentives. Later reports will examine effects after three years on income, work, and other measures of well-being, in both New York City and Atlanta.
Paycheck Plus Paycheck Plus tests the effects of a much more generous EITC for childless adults. Figure ES.1 compares Paycheck Plus with the current EITC for workers without dependent children. Under the current EITC, a worker loses eligibility for benefits once his or her earnings reach about $15,000 and the maximum benefit that he or she can receive is $506. Paycheck Plus increases the maximum amount to $2,000 and expands eligibility so that more low-wage workers qualify for the maximum benefit. An individual can continue receiving some benefits until his or her earnings reach just under $30,000. The Paycheck Plus bonus “tops up” the federal EITC, bringing a worker’s total credit up to a maximum of $2,000. Finally, as is the case with the federal EITC, some or all of the bonus may be intercepted to pay down child support debt owed by a noncustodial parent (a parent who does not have custody of at least one of his or her children).
MDRC partnered with Food Bank for New York City (FBNYC) to run the project in New York. FBNYC, which runs the largest network of Volunteer Income Tax Assistance (VITA) sites in the city, directed its recruitment effort to organizations in its network and throughout the city that served populations who qualified for Paycheck Plus. Additional outreach was conducted through the New York City Human Resources Administration’s cash assistance program, Supplemental Nutrition Assistance Program, and child support program. Between September 2013 and February 2014, the project recruited 6,000 single adults without dependent children to take part in the study, all of whom had earned less than $30,000 in the previous year.
Once individuals agreed to participate, half of them were assigned at random to a group offered Paycheck Plus and half were assigned to a group not offered the program but still able

ES-3
to claim existing tax credits. Individuals assigned to the Paycheck Plus group were given a brief explanation of the bonus on a take-home sheet that illustrated the bonus amounts for various earnings levels. The bonus was available to the program group for three years, payable at tax time in 2015, 2016, and 2017, based on earnings in the previous year.
The program sought to mirror the process by which filers apply for the federal EITC, even though the bonus was not actually administered by the Internal Revenue Service (IRS). One important difference was that participants would need to apply for each bonus; they did not
$0
$500
$1,000
$1,500
$2,000
$0 $10,000 $20,000
Cre
dit a
mou
nt
Annual earnings
Figure ES.1
Paycheck Plus Versus the Federal EITC
Paycheck Plus
Federal EITC 2016$506
$2,000
$14,880 $29,900
Phase-in:30%
Phase-out: 17%
SOURCES: Urban Institute and Brookings Institution Tax Policy Center (2016); Paycheck Plus program documents.
NOTES: Federal EITC illustrates the credit schedule for a single adult with no qualifying children. The phase-in and phase-out rates for the federal EITC shown are 7.65%.

ES-4
receive it automatically once they filed taxes. To apply for the bonus, participants first had to file their taxes (at FBNYC VITA sites, by using other free or paid tax preparers, or by preparing their own taxes). Workers who filed their own taxes or used tax preparers other than VITA sites could bring in or mail in copies of the tax documents that they filed. Once bonus amounts were determined, MDRC worked directly with FBNYC and its payment vendor to request, issue, and monitor the deposit of each bonus payment to a bank account or debit card.
Program staff members faced several challenges in testing the effects of an expanded EITC. First, for there to be a fair test of the program, study participants had to understand and remember the bonus. As is the case with the existing EITC, the structure of the bonus is some-times challenging to understand. Second, program enrollment took place a full year before participants could receive their first bonuses, to allow time for them to adjust their work and earnings in response. The lag meant that many study participants could have forgotten about the bonus and could have failed to claim it at tax time. Third, claiming the bonus required extra steps from participants beyond just filing taxes. To address these challenges, staff members conducted substantial marketing and outreach to individuals in the program group, starting in the spring of 2014 and continuing in the months leading up to each tax season during which the bonus would be paid.
The study will measure the program’s effects on a range of outcomes, the most imme-diate being income, poverty, and work. The expectation is that the bonus should increase after-bonus incomes among those who receive it and, by increasing the payoff to working, could increase employment rates. Economic theory suggests that the program might reduce work effort among higher earners, since the credit is taxed away as earnings increase. The study will gauge whether that reduction takes place.
Finally, increases in after-bonus income and work could have a range of other effects on participants, including reductions in material hardship, improvements in health and subjec-tive well-being, increased child support payments, and reduced involvement with the criminal justice system. The data used for this report include records from the unemployment insurance system, child support payment records, and tax records provided by the IRS, including infor-mation from tax forms for all tax filers and W-2 and 1099 forms for all individuals whether or not they filed taxes.
The sample recruited for the study in New York reflects the diversity of low-wage workers. About 59 percent of the sample members are men, 47 percent were age 35 or older when they joined the study, 22 percent had not obtained a high school diploma or equivalent, and 18 percent had been incarcerated at some point in the past. In addition, 9 percent were noncustodial parents. Although nearly all participants had worked at some point in the past,

ES-5
about a third had no earnings in the year before they enrolled. Another 30 percent had worked in the previous year but earned less than $7,000.
Findings • About 64 percent of program group members with earnings in the eligi-
ble range received bonuses in the first year, and 57 percent received bo-nuses in the second year. Among those who received bonuses, the aver-age amount received was $1,400.
Overall, about 46 percent of the full program group received bonuses in 2015 (see Fig-ure ES.2). It was expected that some number of participants would not be eligible for bonuses, either because they had no earnings or because they had earnings above the $30,000 eligibility cutoff. Low-income earners often have highly variable earnings and employment from year to year. About 70 percent of the program group met the earnings requirement to receive the bonus in 2015 (based on earnings during 2014), and 64 percent of this eligible group received bonuses in 2015. This “take-up rate” is in line with take-up rates of the federal EITC for adults without dependent children, most recently estimated at 65 percent.5 Bonus receipt fell for the full program group from 46 percent of all program group members in 2015 to 35 percent in 2016, in part because fewer participants had earnings in the eligible range and in part because those who were eligible claimed the bonus at lower rates.
Some eligible individuals did not claim the bonus because they did not file taxes, par-ticularly if they had very low earnings. However, even among those who filed taxes, not all applied for the bonus. Recall that individuals were required to apply for the bonus each year. If the federal EITC were made more generous for childless adults along the lines of Paycheck Plus, take-up would probably be higher, since tax filing would trigger the credit automatically.
• Lower proportions of eligible men than women received the bonus, par-ticularly men who were noncustodial parents or former prisoners.
In 2015, 74 percent of eligible women received bonuses compared with 58 percent of eligible men. Women were more likely to receive bonuses than men in part because they were more likely to work, but largely because those with earnings in the eligible range were more likely to file taxes, and were also more likely to apply for bonuses if they did file taxes.
5Maggie R. Jones, “Changes in EITC Eligibility and Participation, 2005-2009,” Center for Administrative
Records Research and Applications Working Paper #2014-04 (Washington, DC: U.S. Census Bureau, Center for Administrative Records Research and Applications, 2014).

ES-6
Relatively low percentages of former prisoners and noncustodial parents applied for and received bonuses, primarily because they were less likely to apply for bonuses when they had earnings in the eligible range. They were less likely to apply even if they filed taxes. For example, 65 percent of eligible filers with previous incarcerations received bonuses, compared with 79 percent of eligible filers without previous incarcerations.
• Paycheck Plus increased after-bonus income in both of the first two years and increased employment in the second year.
About 80 percent of the study sample reported earnings in 2014, with an average of about $10,000 (or $13,000 among those who had some earnings). The program did not have a detectable effect on employment rates — the fraction who had any earnings — in 2014 (see
69%
57%
35%
76%
64%
46%
Receipt among eligible tax filers
Receipt among those eligible
Receipt among the full program group
Figure ES.2
Paycheck Plus Bonus Receipt
2015 (tax year 2014)
2016 (tax year 2015)
SOURCES: IRS tax forms, W-2s, and 1099-MISCs; Paycheck Plus program data on bonus receipt.

ES-7
Table ES.1). In 2015, however, the program led to a modest increase in employment of 2.5 percentage points (over the control group rate of 73.8 percent). The size of the effect is within the range of what would be expected, given existing economic research on how responsive individuals’ work decisions are to incentives of this size. An analysis of the distribution of earnings did not detect that the bonus reduced work effort among those who had higher earnings when they enrolled in the study.
The IRS data also can be used to create a rough measure of after-bonus income, defined as earnings minus taxes plus the bonus. On average, individuals in the program group had after-bonus incomes of about $10,049 in 2014 compared with $9,395 for the control group, a statisti-cally significant increase of $654, or 7 percent. The increase in after-bonus income for the subsequent year was $645, or 6 percent.
• Paycheck Plus increased tax filing and the use of free tax preparation services.
In both 2015 and 2016, program group members were more likely than control group members to file taxes. For example, 68 percent of the control group filed taxes in 2015, com-pared with 73 percent of the program group.
The program also led to a change in the methods used to prepare taxes. Single people typically do not file taxes at VITA sites, as evidenced by the low proportion of the control group who did so: only 20 percent filed taxes at VITA sites in 2015. As expected, given the ease with which participants could receive bonuses by filing there, the program led to a large increase in the use of VITA sites in both years, effects of over 20 percentage points, with about half of the increase coming from a reduction in the use of paid preparers. The increase in the use of VITA sites probably reduced tax-preparation costs for program group members, although it may have also increased the time they had to wait for their taxes to be prepared.
• Paycheck Plus increased the payment of child support in the second year.
When they entered the study, about 9 percent of participants were noncustodial parents who had child support orders or who owed child support debt. Among these noncustodial parents, the program led to an increase in payments in 2015. About 80 percent of noncustodial parents in the program group made a payment during the year, compared with 71 percent of those in the control group. Similarly, the program group paid on average $191 per month in child support, an increase of $54 over the control group.

ES-8
• Paycheck Plus increased employment for most types of participants, al-though its effects were larger among women than men.
The overall positive effect on employment in 2015 is generally consistent among most types of participants. However, the positive effect on employment in the second year is larger among women than men. The program also increased women’s average earnings in 2014 by about 7 percent, an effect that is different from the effect among men by a statistically signifi-cant amount. The larger effect among women is in line with previous research suggesting that women’s employment is more responsive to economic incentives than men’s. The men in Paycheck Plus were less likely to file taxes than the women, but they may have also been less aware or trusting of the program, since men are less likely to participate in benefit programs. If men responded to the program less strongly because they were less aware of it, then they might
Program Control DifferenceOutcome Group Group (Effect) P-value
2014Any earnings (%) 79.7 78.8 0.9 0.338
Earnings ($) 10,079 10,047 33 0.893
After-bonus income ($) 10,049 9,395 654 *** 0.001
2015Any earnings (%) 76.3 73.8 2.5 ** 0.012
Earnings ($) 12,885 12,693 192 0.560
After-bonus income ($) 12,108 11,464 645 ** 0.015
Sample size (total = 5,968) 2,997 2,971
Table ES.1
Effects on Work, Earnings, and Income
SOURCE: IRS tax forms, W-2s, and 1099-MISCs.
NOTES: Earnings refers to wages plus self-employment income. After-bonus income refers to earnings plus credit amount minus taxes. A two-tailed t-test was applied to differences between the outcomes of the program and control groups.
Statistical significance levels are indicated as: *** = 1 percent; ** = 5 percent; * = 10 percent.Estimates were regression-adjusted using ordinary least squares, controlling for pre-random assignment
characteristics of sample members.

ES-9
be expected to respond more strongly if an EITC for workers without dependent children were federal policy and all tax filers automatically received it.
Conclusion The interim results presented here show that the program was successfully implemented in New York City, and that fairly large proportions of eligible workers received the bonus. The program led to an increase in after-bonus incomes and the rate of filing taxes in both of the first two years and to a modest increase in employment during the second year. The employment effects were larger among women than men, but small, positive effects on employment were apparent among many types of participants in the second year. The program also led to an increase in child support payments among noncustodial parents. Finally, there is no evidence that the program reduced work effort or earnings among those who had higher earnings when they enrolled.
Work-based assistance is not appropriate for all low-income individuals. Some people with disabilities or older people may not be able to work even in a strong labor market, and many people have difficult times finding work in recessions. But the findings presented here add to the evidence that the EITC can be a broad-based response to declining wages and an integral component of a functioning social safety net.
Future reports from the Paycheck Plus demonstration will describe the program’s ef-fects after three years and will use survey data to present more comprehensive effects on income, poverty, health, and material and subjective well-being. Findings from Atlanta, which has a different policy environment and labor market, will also add to the evidence about the potential effects of expanding the EITC for low-income workers without dependent children.


1
Chapter 1
Introduction
In recent decades, the U.S. labor market has been characterized by rising wage inequality and by stagnating (or even declining) real earnings for workers without college degrees.1 Workers with bachelor’s degrees have seen their real hourly wages increase by 19 percent since 1973, while wages for those without high school diplomas have fallen by 17 percent.2 Even those with high school degrees earn somewhat less today, in real terms, than they earned in the early 1970s.3
As a result of these trends, many U.S. workers can no longer adequately support their families solely through work, even when working full time. Nearly a third of women and one in five men earn wages too low to move a family of four above the poverty level.4 Less-educated men have seen their wages fall the most dramatically, and in the face of falling earnings opportunities, fewer of them are participating in the formal labor market.5
The Earned Income Tax Credit (EITC) has helped to counter rising earnings inequality and stagnating real wages by helping to increase the incomes of low-income workers. A working, single mother with two children, for example, can get a federal tax refund of up to $5,600 at tax-filing time from the EITC. Policymakers on both sides of the aisle have recog-nized the value of the EITC as a policy that both reduces poverty and encourages work, and it has been expanded substantially in recent decades, particularly for working adults with depend-ent children. As a result, the program now benefits over 26 million families and has become one of America’s most effective antipoverty policies.6
However, while the credit has been expanded to help counter falling wages for low-income workers with children, it provides very little support for workers without dependent children. These individuals make up a large fraction of the low-income worker population and are a diverse group, including, for example, young women and men without children, older workers with adult children, and noncustodial parents (parents who do not have custody of at least one of their children). All have faced the same deteriorating labor-market conditions for
1Autor, Katz, and Kearney (2008); Autor (2014). 2Economic Policy Institute (2017). 3Economic Policy Institute (2017). 4Economic Policy Institute (2017). 5Economic Policy Institute (2017). 6Center on Budget and Policy Priorities (2016); Nichols and Rothstein (2016).

2
several decades. Young adults, for example, were hit especially hard by the Great Recession, and their unemployment rates remain relatively high.7 Wages and employment rates have also fallen dramatically for less-skilled men since the 1970s, as mentioned earlier.8 Many of the men having a tough time in the labor market are also noncustodial parents, whose role in providing for their nonresident children is not recognized by the tax system. In 2017, the maximum federal EITC benefit workers without dependent children could earn was $506, and workers became ineligible for any benefits once their annual earnings exceeded $15,000. In sum, the EITC offsets only a small part of this group’s federal taxes and has done little to counter their falling earnings opportunities.
There have been a number of proposals to make the EITC more generous for childless adults, including proposals from former President Obama and House Speaker Ryan.9 What if the EITC for these workers were increased to $2,000 and extended to provide benefits to workers earning up to $30,000 per year? The Paycheck Plus Demonstration is a test of such a policy in two major U.S. cities. The program was started first in New York City, where 6,000 individuals were recruited to take part in the study, 3,000 of whom were randomly selected to be offered a Paycheck Plus bonus of up to $2,000 a year for three years, beginning with the 2015 tax season. Paycheck Plus was then launched in Atlanta, Georgia, where 4,000 individuals were recruited for the study, 2,000 of whom were randomly selected to be offered the bonus for three years, beginning with the 2017 tax season. By testing an expanded credit in two distinct environments, the demonstration will help to inform discussions of a national expansion of the credit for childless adults.
Paycheck Plus in New York City is funded by the New York City Mayor’s Office for Economic Opportunity (NYC Opportunity), the Robin Hood Foundation, the Laura and John Arnold Foundation, the Edna McConnell Clark Foundation, and U.S. Department of Health and Human Services.10 The test in Atlanta is being funded by the Ford Foundation, the Annie E. Casey Foundation, the Kellogg Foundation, the U.S. Department of Health and Human Ser-vices, the U.S. Department of Labor, and the Lifepath Project. MDRC worked with NYC Opportunity to design the demonstration and partnered with the New York City Human Resources Administration and Food Bank for New York City to implement the program. MDRC is also evaluating its effects.
7Economic Policy Institute (2017). 8Economic Policy Institute (2017). 9Office of Management and Budget (2015); Ryan (2014). 10The U.S. Department of Health and Human Services’ Office of Child Support Enforcement, with the
support of the New York State Office of Temporary and Disability Assistance, is providing funding to the demonstration in New York through a Section 1115 waiver.

3
This report presents interim findings from the test of Paycheck Plus in New York City, presenting the proportion of participants who actually received the expanded credit in the first two years, and the credit’s effects over that span on after-bonus income, work, earnings, tax filing, and child support payments. A final report will use data from a survey administered to study participants to examine effects on a wider range of outcomes, including household income, poverty, subjective well-being, health, and family formation. Those data, along with estimates of the longer-term effects of Paycheck Plus on work and earnings, will provide a more complete assessment of the program’s effects.
Although the results presented here are an early look and only from one city, the find-ings are encouraging. The program was successfully implemented in New York City, and a majority of participants in the program group who had earnings in the eligible range received bonuses in the first two years. It is heartening that most eligible participants did receive bonuses, because as a demonstration program, Paycheck Plus needed to operate outside of the tax system and required participants to take extra steps beyond filing taxes to receive money. The program led to an increase in after-bonus income and in filing taxes in both of the first two years and to a modest increase in employment during the second year. The employment effects were larger among women than men, but small positive effects on employment were consistent among many types of participants. Finally, there is no evidence that the program reduced work effort or earnings among who had higher earnings when they enrolled in the study.
Previous expansions of the EITC provide essential support to low-income working fam-ilies with children, and the Paycheck Plus demonstration provides an opportunity to examine the effects of a more generous EITC for one group that has been left out of these expansions: low-income childless adults, who have also struggled to move ahead in a difficult low-wage labor market. The early effects of Paycheck Plus are consistent with research on the federal EITC, showing that it can increase after-transfer incomes and encourage work without creating work disincentives. Work-based assistance alone is not appropriate for all low-income individu-als. Some people with disabilities or older people may not be able to work even in a strong labor market, and many people have difficult times finding work in recessions. But the findings presented here add to the evidence that the EITC can be a broad-based response to falling wages and an integral component of a functioning social safety net.


5
Chapter 2
The Earned Income Tax Credit
The Earned Income Tax Credit (EITC) has a phase-in range, where the amount of the credit increases as earnings increase, to supplement the earnings of eligible individuals; a plateau range, where the credit remains constant as earnings increase; and a phase-out range, where the credit is reduced, or taxed away, as earnings increase. Although the EITC has grown to be one of the largest antipoverty programs in the country, it started out relatively small. When it was first added to the tax code in 1975, the credit phased in at a rate of 10 percent (meaning that workers received an additional 10 cents for every dollar earned), to a maximum benefit of $400 (or about $1,800 in 2016 dollars), and began phasing out at a rate of 10 percent once earnings reached $4,000 (or about $18,000 in 2016 dollars).1 Initially, the credit was only available to families with children, and it remained that way for some time. As noted in overviews by Hotz and Scholz, and by Nichols and Rothstein, the credit was introduced during a time in which there was substantial debate about the structure of the safety net and the best way to combat poverty.2 A negative income tax (or universal basic income) was one option being considered, as a way to consolidate the various programs targeting the poor. A negative income tax would provide a minimum income to nonworkers that was taxed away as earnings increased. Critics argued that providing benefits to nonworkers would discourage work, and an EITC was proposed by Senator Russell Long that provided benefits only to workers and that phased in and out as earnings increased.
The EITC became a permanent part of the tax code in 1978, and has been expanded several times since then. In 1986, for example, the credit was increased to offset its decline in real dollars since 1975, and it was indexed to inflation going forward. The next big expansion came in 1993, when the maximum benefit was increased substantially, particularly for families with two or more children. The principle underlying the expansion was that a parent working full time should not be poor, making the EITC more explicitly an antipoverty program. Finally, the most recent changes to the credit were part of the American Recovery and Reinvestment Act of 2009, where maximum benefits were increased somewhat and a separate and more generous schedule was introduced for families with three or more children.
The credit is available to singles and married couples. Until 2002, married couples faced the same schedule as single adults. However, because benefits are calculated based on
1Tax Policy Center (2017). 2This section draws heavily on these overviews by Hotz and Scholz (2003) and Nichols and Rothstein
(2016). See also Meyer and Holtz-Eakin (2002) for a review of the history and impact of the EITC.

6
family earnings, there has always been concern about a “marriage penalty” embedded in the EITC: two low-wage working adults who marry typically receive substantially smaller EITC benefits than they would if they were to file as two single adults. To reduce (but not fully eliminate) this penalty, the schedule for married couples phases out over a wider income range than the schedule for singles, and the 2009 changes extended the phase-out even further. There have been several proposals to eliminate the marriage penalty, such as basing EITC benefits on individual income rather than household income, or disregarding a portion of a second earner’s income when determining benefits.3 As discussed below, however, the research to date has not found much evidence that the EITC reduces marriage, although there is some evidence that it modestly reduces work effort among second earners in two-parent families. Paycheck Plus is not designed to address the marriage penalty embedded in the EITC, since it focuses on single adults.
Finally, and most relevant to this paper, beginning in 1994 the credit was made availa-ble to adults without children in the household. The credit for adults without dependent children is very small compared with the benefits available to families with children, and is available over a smaller range of earnings. In 2016, for example, an individual working full time for the full year at $9 per hour would earn too much to qualify for any benefits. Figure 2.1 presents 2016 EITC schedules for single adults with different numbers of dependent children. The phase-in rate is 45 percent for singles with three children, with a phase-out rate of 21.06 percent and a maximum EITC of over $6,000. In contrast, the phase-in rate is just 7.65 percent for singles with children and the maximum credit is only around $500.
Proportion of Eligible Families Reached It is estimated that most eligible families actually receive the EITC, although this “take-up rate” varies among different types of families. Plueger, for example, estimates that about 75 percent of eligible families received the EITC in 2005. Most of those who were eligible but did not receive benefits did not file taxes. Take-up rates were lower among adults with no dependents (56 percent), than they were among those with dependents (86 percent among adults with two or more children).4 Jones finds similar overall take-up rates, increasing from 77 percent in 2005 to about 79 percent in 2009. She also finds similar differences in take-up among families with different numbers of children (for example, a 65 percent take-up rate in 2009 among those
3Berlin (2007); Kearny and Turner (2013); Edelman, Greenberg, Holt, and Holzer (2009). 4Plueger (2009).

7
without children compared with an 83 percent take-up rate among those with two more chil-dren).5 Not surprisingly, take-up of the credit also varies depending on how much the individual stands to receive. Take-up rates are lowest among workers in the phase-in part of the schedule who would earn a relatively small credit. Lower EITC take-up in this group largely reflects lower rates of tax filing, since individuals are not legally required to file taxes if their earnings are below a certain level.
The relatively high take-up rate overall suggests that most potentially eligible individu-als are likely to be aware of the EITC. In fact, there have been media campaigns in many cities to make eligible individuals aware of the benefit and encourage them to claim it. Nonetheless, research suggests that while most recipients understand that they will receive a refund at tax time if they work, they do not understand the details of the credit’s structure, such as its phase-in
5Jones (2014).
$0
$1,000
$2,000
$3,000
$4,000
$5,000
$6,000
$7,000
$0 $10,000 $20,000 $30,000 $40,000 $50,000
Cre
dit a
mou
nt
Annual earnings
Figure 2.1
EITC for Single Adults with Different Numbers of Children, 2016
SOURCE: Urban Institute and Brookings Institution Tax Policy Center (2016).
no children
1 child
2 children
3 children
8
and phase-out rates.6 It is important to keep in mind this imperfect knowledge of the EITC’s financial incentives at different levels of earnings when considering the credit’s potential effects on work and earnings. The EITC typically is received once a year as part of a tax refund, meaning that it may have more muted effects on decisions about exactly how much to earn over the course of a year than it does on the decision about whether to work at all.
Effects The EITC’s effect on work decisions depends on where an individual’s earnings place him or her on the credit schedule and how much he or she understands the precise structure of the credit. For someone who is not working, the credit creates an unambiguous incentive to work, since it increases the payoff to working. For someone who is working and whose earnings are in range to receive the EITC, the response depends on two, sometimes competing effects: the “wage effect” (also known as the substitution effect) and the “income effect.” For a person in the phase-in part of the schedule (the upward-sloping portion shown in Figure 2.1), the wage effect encourages work, since individuals gain additional EITC benefits as they earn more. The income effect, on the other hand refers to the tendency to reduce work effort when one receives additional, unearned income. It might encourage someone in the phase-in part of the schedule to work less, although it would not encourage that person to drop out of work entirely.
In the plateau, or flat, region of the credit, the wage effect is zero (since the credit does not change with earnings) and the income effect serves to discourage work. In fact, if individu-als fully understood the structure of the credit and could easily manipulate their hours and earnings, it would be expected that they would aim to have earnings at the end of the phase-in region, or the first kink in the curves shown in Figure 2.1. In the phase-out region, the wage effect encourages fewer hours, since EITC benefits are reduced as earnings increase, and the income effect also encourages fewer hours. Finally, the existence of the credit might encourage someone with earnings too high to be eligible for any EITC benefits to reduce earnings to become eligible.
Thus, the credit is expected to increase employment rates, although its overall effect on earnings is not easy to predict given the different incentives it creates for individuals earning different amounts. There has been substantial nonexperimental research on the EITC’s labor-market effects, most of which has focused on single mothers and married couples, since the credit for childless adults is so small.7 In general, this research finds that the EITC has led to
6Eissa and Liebman (1996); Chetty and Saez (2013); Chetty, Friedman, and Saez (2013); Bhargava and Manoli (2015).
7Eissa and Leibman (1996); Meyer and Rosenbaum (2001); Eissa and Hoynes (2006); Chetty and Saez (2013); Chetty, Friedman, and Saez (2013).
9
fairly sizable increases in employment rates among single mothers. For example, Meyer and Rosenbaum find that the EITC expansions from 1984 to 1996 accounted for over 60 percent of the increase in annual employment rates among single mothers during this period.8
More recent research has attempted to identify effects on earnings, or whether individu-als change their levels of work in response to the incentives created by the phase-in and phase-out parts of the schedule. Chetty, Friedman, and Saez do identify some effects on earnings, with positive effects in the phase-in part of the schedule and negative effects in the phase-out part of the schedule (especially among the self-employed), although the responses are much smaller than effects on employment rates. Scholars (such as Eissa and Leibman) conclude that the opaqueness of the EITC phase-out rates and the salience of the overall annual tax refund lead the EITC to have to positive effects on employment and little effect on hours worked among those already working.
For married couples, the predictions are a bit different, since the credit is calculated based on family earnings. If one spouse is already working, then the second spouse’s earnings are likely to move the family to the phase-out portion of the schedule, where benefits are reduced as earnings increase, or to make the family ineligible for benefits entirely. This tax levied on the second earner’s income creates an incentive for that person to work less. There is some evidence that the EITC leads to reductions in earnings among married women, although the effects are fairly small.9
In addition to labor-market outcomes, there is growing research on the EITC’s other ef-fects. The EITC is estimated to have lifted 9.1 million families out of poverty in 2013, including 4.7 million children, making it one of the most effective antipoverty programs in America.10 This estimate of poverty reduction uses only the additional income from the credit and does not include any potential increases in employment that the credit may have caused. In addition, the EITC has been found to have positive effects on parents’ and children’s health, on prenatal health, and on children’s school outcomes.11 Finally, research has documented other positive effects of the credit on important, but less tangible outcomes. The simple process where individuals have “earned” their refund through work and receive their benefit in a refund check, as do tax filers of all income levels, confers feelings of social inclusion and citizenship on its recipients.12
8Meyer and Rosenbaum (2001). 9Eissa and Hoynes (2006). 10Nichols and Rothstein (2016). 11Evans and Garthwaite (2014); Hoynes, Miller, and Simon (2015); Dahl and Lochner (2012). 12Halpern-Meekin, Edin, Tach, and Sykes (2015); Sykes, Katz, Edin, and Halpern-Meekin (2015).


11
Chapter 3
The Paycheck Plus Demonstration
Paycheck Plus tests the effects of a much more generous Earned Income Tax Credit (EITC) for adults without dependent children. As shown in Figure 3.1, in 2016, under the current EITC a childless worker loses eligibility for benefits once his or her earnings reach about $15,000, and the maximum benefit that he or she can receive is $506. Paycheck Plus provides a maximum credit to childless adults equal to about 60 percent of the maximum benefits available to a single parent with one child. It also expands the plateau region of the credit, so that more low-wage workers qualify for the maximum benefit. Benefits are phased in at a rate of 30 percent, with a maximum benefit of $2,000, and phased out at a rate of 17 percent. An individual can continue receiving some benefits until his or her earnings reach just under $30,000. The bonus “tops up” the existing federal EITC for this group to bring the total credit up to a maximum of $2,000. Thus, if a worker were eligible for $2,000 from Paycheck Plus and received $300 from the federal EITC, that worker’s Paycheck Plus bonus would be $1,700.
Paycheck Plus was designed to mimic the federal EITC, meaning that the same criteria were applied when calculating eligibility for the bonus (see Chapter 4 for the process by which individuals applied for and received the bonus). An individual must file federal income taxes and have earned income in the relevant range to be eligible for the bonus. He or she also cannot claim any dependent children or be claimed as a dependent by another tax filer, and must have a valid Social Security number. Similarly, as is the case with the federal EITC, some or all of the bonus may be intercepted to pay down child support debt owed by a noncustodial parent.1
Recruitment and Enrollment Paycheck Plus is being tested using a randomized controlled trial. Between September 2013 and February 2014, the project in New York recruited just over 6,000 single adults without depend-ent children to take part in the study. Because the bonus amount paid in 2015 would depend on earnings in 2014, recruitment occurred a full year before the first bonus payout. Participants had a year to adjust their work and earnings in response to the program.
1This interception is the one feature of the program that differs between cities. The bonus is intercepted to
pay down child support debt in New York City but not in Atlanta. Program designers opted to test a version without an interception where it was feasible to do so (Atlanta), to see if it led to different effects among noncustodial parents.

12
MDRC partnered with Food Bank for New York City (FBNYC) to run the project. FBNYC, which runs the largest network of Volunteer Income Tax Assistance (VITA) sites in the city, directed its recruitment effort to organizations in its network and throughout the city that served populations who qualified for Paycheck Plus. These organizations included those in FBNYC’s database of former VITA clients, food pantries and soup kitchens, programs that serve formerly incarcerated people, workforce and job-training organizations, one-stop career centers, community colleges, fatherhood programs, and social service agencies. New York City’s Human Resources Administration, which also helped coordinate the start of recruitment
$0
$500
$1,000
$1,500
$2,000
$0 $10,000 $20,000
Cre
dit a
mou
nt
Annual earnings
Figure 3.1
Paycheck Plus Versus the Federal EITC
Paycheck Plus
Federal EITC 2016$506
$2,000
$14,880 $29,900
Phase-in:30%
Phase-out: 17%
SOURCES: Urban Institute and Brookings Institution Tax Policy Center (2016); Paycheck Plus program documents.
NOTES: Federal EITC illustrates the credit schedule for a single adult with no qualifying children. The phase-in and phase-out rates for the federal EITC shown are 7.65%.

13
for the study, sent letters introducing the study to cash assistance recipients, Supplemental Nutrition Assistance Program recipients, and noncustodial parents. In addition, the study was advertised using a community flyer campaign and various media outlets including local radio stations, city government websites (such as 311), and Twitter.
Individuals were eligible for study enrollment if they were not married, had valid Social Security numbers, were not planning to claim dependent children on their taxes in the subse-quent year, were between the ages of 21 and 64 (note that the federal credit is only available to individuals ages 25 and older),2 had earned less than $30,000 in the previous year, and were not receiving or applying for Supplemental Security Income or Social Security Disability Insurance.
Once eligible individuals agreed to participate, half of them were assigned at random to a group eligible for Paycheck Plus and half were assigned to a group not eligible for the pro-gram but still eligible for existing tax credits. Individuals assigned to the Paycheck Plus group were given a brief explanation of the credit on a take-home sheet that illustrated the bonus amounts for various levels of earnings, indicating that the bonus was reduced to $0 once earnings reached just under $30,000 (see Appendix A for an illustration of the take-home sheet). The bonus was available to the program group for three years, payable at tax time in 2015, 2016, and 2017, based on earnings in the previous year (covering earnings in 2014, 2015, and 2016). Figure 3.2 presents the timeline of the demonstration and the follow-up period for this report.
Although individuals had to be single to enroll in the study, they remained eligible to receive the bonus for three years if they married after they enrolled. In addition, to avoid creating a penalty for marriage, the Paycheck Plus bonus for married participants was calculated based on individual earnings rather than family earnings. If an individual gained dependent children through birth, adoption, or marriage, however, that person would no longer be eligible for any Paycheck Plus bonus, since the federal EITC for families with one or more children is more generous than Paycheck Plus.3
There was some concern heading into the demonstration that some individuals might have difficulty responding to the work incentives created by Paycheck Plus if they could not
2Program designers opted to make younger adults (those ages 21 to 24) eligible for the expanded
credit because this group’s employment rate has been falling over time and fell dramatically during the Great Recession that began in 2008, and because early work experience can strongly influence a person’s later employment.
3In principle, the expanded credit would continue to top up the federal EITC received by the individ-ual’s family. However, because the federal EITC for individuals with one or more qualifying children is more generous than the Paycheck Plus bonus, the top-up amount would be zero.

14
Figure 3.2
Program Timeline and Follow-Up Period for This Interim Report
September 2013 December 2017
2014 2015 2016 2017
April - DecemberBonus Payment
April - DecemberBonus Payment
April - DecemberBonus Payment
2014-2015Follow-Up Period for Administrative Records
September 2013 - February 2014Recruitment
15
find work or increase their earnings. The demonstration therefore also included a second randomized controlled trial embedded within the larger trial. Of the program group members who reported earning less than $10,000 in the year before they joined the study, half were assigned at random to an “employment-referral group” who received additional information about and referrals to employment services nearby. The other half were offered the bonus without any additional information. Comparing these two groups should reveal whether Paycheck Plus combined with additional information about employment services led to larger effects on work than the bonus by itself. The details of this embedded intervention are presented in Appendix B.
Data Sources The demonstration uses several data sources to administer the program and track its effects. Basic demographic and background data were collected from all study participants in a baseline survey administered just before random assignment. The baseline data include information on each participant’s education level, employment and earnings, household composition, and previous involvement with the criminal justice system. These data are used to describe the sample and identify important subgroups.
Administrative records were collected for the study sample from several sources. (“Administrative records” are data collected in the course of administering a program.) First, the New York State Department of Labor provided MDRC with quarterly data on earnings covered by the unemployment insurance system, for the period from the fourth quarter of 2013 through the third quarter of 2015. Although these unemployment insurance data capture most employ-ment, they do not capture self-employment or employment from informal or contract work. Second, administrative records on child support payments and child support debt were obtained from the New York City Office of Child Support Enforcement for the period of January 2014 through December 2015.
Tax data were also collected from two sources. The first source is FBNYC, which pro-vided tax records from program group participants who filed taxes at its VITA sites. These data include information on adjusted gross income, earnings, self-employment earnings, and other information needed to determine Paycheck Plus bonus eligibility and amounts. The second source is the Internal Revenue Service, which provided federal tax records through a data-sharing agreement with the U.S. Department of the Treasury. For this report, these data are available for 2014 and 2015. The tax data are more comprehensive than the New York unem-ployment insurance records, because they reflect self-employment earnings (from 1099 forms and Schedule C filings) and out-of-state earnings. Earnings information from W-2 forms (covering wage earnings) and 1099 forms (covering self-employment income) is available even for those study participants who did not file federal taxes.

16
Finally, the study administered a survey to a subset of 3,300 study participants approx-imately two years and eight months after they entered the study, or just after the second bonus payment. The survey collected information on a number of topics, including employment, earnings, job characteristics, income, subjective and material well-being, housing status, involvement with the criminal justice system, family structure, and child support payments. When it was administered to program group members, the survey included questions to deter-mine how well they understood the bonus, how they spent any bonuses received, and if they did not receive bonuses, their reasons for not participating in the program. Findings based on the survey data are not yet available. They will be presented in the final report.
Because individuals were randomly assigned either to the program group or to the con-trol group, the effects of the program can be estimated as the differences between the two groups’ outcomes.4 Effects are estimated for each outcome using a regression model in which the outcome of interest is regressed on an indicator for program status and several variables measured at or before the time of random assignment. Including baseline variables as covariates in the regression improves the precision of the impact estimates. The covariates include whether the participant is a noncustodial parent and the participant’s age, sex, education level, race/ethnicity, earnings in the year before enrollment, and history of incarceration.5
Research Questions and Expected Effects The study will measure the effects of the bonus on a range of outcomes, the most important of which are income, earnings, and employment. The bonus can directly increase the incomes of those who receive it by up to 30 percent. The data on actual earnings and bonus receipt in the first year after random assignment indicate that on average, bonus recipients saw their after-bonus incomes increase by close to 8 percent. Such increases in income should reduce poverty among recipients and potentially have other effects as well, including possible reductions in material hardship and improvements in health and subjective well-being.
The existing literature on the effects of the EITC on work is only partly helpful in pre-dicting the effects of Paycheck Plus, because past work has examined the EITC’s effects on parents of minor children, most of whom were single mothers. Broader research in economics on work decisions and labor supply suggests that women’s employment decisions are more responsive to wages and economic incentives than men’s, although most of the studies in this
4Appendix Table C.1 presents a comparison of the baseline characteristics of the program and control groups, showing that the two groups were similar on average when they enrolled in the study and indicating that random assignment was properly administered.
5Noncustodial parents are defined as participants who had open child support cases with the Office of Child Support Enforcement when they enrolled in the study, or who owed child support debt.
17
area compare married women with married men.6 This research also typically estimates effects on all men, not specifically the low-income men who are the target of this policy.
Nevertheless, it is possible to predict the bonus’s expected effects on employment rates using estimates from previous studies on labor-supply elasticity (how much employment rates change in response to changes in wage rates). Nearly all of these elasticity estimates are based on nonexperimental analyses, and they vary from study to study and from sample to sample.7 Some estimates suggest, for example, that a 10 percent increase in wages would generate a 2 percent increase in employment, while others predict a 10 percent increase. Thus, an 8 percent increase in earnings from the bonus should increase employment rates by anywhere from 1.6 percent to 8 percent. Again, the elasticity estimates tend to be larger for women, suggesting that Paycheck Plus may have larger effects among female participants. And many estimates for men of prime working age indicate close to zero response to work incentives.8 It is important to note that any employment effects from the program may take over one year to emerge, because it may take time for study participants to understand and come to trust the program. Other research finds, for example, that expansions of the EITC for single parents took one or two years to generate employment effects.9
As noted in Chapter 2, the EITC’s structure means that it creates different work incen-tives at different levels of earnings. Policymakers may be particularly concerned about incen-tives to reduce earnings for workers whose incomes fall in the phase-out portion of the schedule and for those who earn too much to qualify for a bonus. The study will therefore test whether workers with higher previous earnings and workers who are likely to be in the phase-out range do see reductions in earnings.
The bonus also might affect workers’ participation in different types of employment. The most obvious effect is that it might reduce informal work and increase formal work, as the bonus increases the payoff to reporting earnings to tax authorities and filing taxes. Finally, through effects on income and work, the program might have effects on secondary outcomes, including involvement in the criminal justice system, child support payments by noncustodial parents, and marriage. The final report from this study will examine effects on these outcomes, along with hourly wages and broader measures of individual and household income, poverty, and well-being.
6Blundell and MaCurdy (1999). 7See McClelland and Mok (2012) for a review. Elasticity estimates tend to vary by sex, income level, edu-
cation level, and race/ethnicity. 8Pencavel (1987). 9Eissa and Liebman (1996).

18
Participants’ Characteristics The broad recruitment effort conducted by FBNYC succeeded in enrolling a group that reflects the varied characteristics and circumstances of low-wage workers. Although most of the sample is either black or Hispanic, it is quite diverse in gender, age, educational attainment, and recent work history. Table 3.1 presents participants’ characteristics when they entered the study. About 59 percent of the sample is male. Forty-seven percent were older than 35 when they enrolled, 22 percent had not obtained high school diplomas or equivalents, and 18 percent had been incar-cerated at some point in the past. In addition, about 9 percent of study participants had active child support orders or owed child support debt. Fewer than half of the sample members were working when they joined the study and around 30 percent had no earnings in the previous year. Another 28 percent had worked in the past year but had earned less than $6,667 (the end of the phase-in range for the Paycheck Plus bonus).
Although discussions of an expanded EITC for adults without dependent children tend to focus on falling wages and employment among low-income men, a large fraction of the beneficiaries from such an expansion would be low-income women. Table 3.2 presents selected characteristics at enrollment of women and men, separately. The table illustrates that although the women in the study had low incomes, they seem to have been a little better off than the men, with higher education levels and fewer characteristics that might serve as barriers to work, such as a lack of recent work experience or previous involvement with the criminal justice system. For example, 32 percent of women reported having some college education, compared with only 19 percent of men. The women in the study were much less likely than the men to be noncustodial parents when they enrolled, or to have been incarcerated in the past. More than one in four men in the study had previously been incarcerated. Finally, women were substantial-ly more likely than men to have been working when they joined the study, although only modestly more likely to have been working full time, and women were more likely to have filed taxes in the previous year and to have heard of and previously claimed the EITC.
The New York City Context While New York City provides an interesting context under any circumstance, there are several features of the local labor market relevant to the study. The first feature is its relatively strong recovery from the Great Recession that began in 2008. For example, the unemployment rate in New York fell from 10 percent in early 2010 to a low of 5.2 percent by the end of 2015.10 Unemployment rates declined most rapidly between early 2014 and late 2015, which corre-sponds with the follow-up period for this interim report.
10Bureau of Labor Statistics (2017a).

19
Characteristic (%) Full Sample
Male 59.0
Age35 and younger 53.0Older than 35 47.0
Race/ethnicityHispanic 30.0Black/non-Hispanic 57.8White/non-Hispanic/other 12.2
EducationHigh school diploma or equivalent 54.0Some college 24.2
Noncustodial parenta 8.6
Ever incarcerated in jail or prison 18.1
Currently working 45.2
Working full timeb 23.8
Earnings in the past year$0 29.4$1 - $6,666 28.2$6,667 - $17,999 29.4$18,000 or more 13.0
Filed a tax return for tax year 2012 60.7
Has heard of the EITC 45.8
Has received the EITC in the past 19.0
Sample size 5,968
Sample Characteristics
Table 3.1
Table 1 (continued)
SOURCES: MDRC calculations using Paycheck Plus baseline survey data and New York City Office of Child Support Enforcement administrative records.
NOTES: Includes sample members randomly assigned between September 27, 2013 and February 18, 2014.
Percentages for some categories may not add up to 100 due to rounding or missing values. aThe measure refers to noncustodial parents who had open child support cases with positive monthly
obligation amounts or positive child support debt amounts when they enrolled in the study, according to administrative records.
bThe measure refers to working 30 hours or more per week.

20
Characteristic (%) Men Women
Age35 and younger 52.1 54.1Older than 35 47.9 45.9
Race/ethnicityHispanic 30.8 28.9Black/non-Hispanic 57.9 57.6White/non-Hispanic/other 11.3 13.6
EducationHigh school diploma or equivalent 56.3 50.8Some college 19.2 31.5
Noncustodial parenta 13.7 1.2
Ever incarcerated in jail or prison 27.1 5.0
Currently working 38.2 55.3
Working full timeb 22.1 26.4
Earnings in the past year$0 35.1 21.3$1 - $6,666 25.8 31.5$6,667 - $17,999 26.7 33.3$18,000 or more 12.4 13.9
Filed a tax return for tax year 2012 52.5 72.6
Has heard of the EITC 42.1 51.1
Has received the EITC in the past 16.0 23.2
Sample size (total = 5,903) 3,485 2,418
Table 3.2
Baseline Characteristics of Men and Women
SOURCES: MDRC calculations using Paycheck Plus baseline survey data and New York City Office of Child Support Enforcement administrative records.
NOTES: Includes sample members randomly assigned between September 27, 2013 and February 18, 2014. Percentages for some categories may not add up to 100 due to rounding or missing values. aThe measure refers to noncustodial parents who had open child support cases with positive monthly obligation
amounts or positive child support debt amounts when they enrolled in the study, according to administrative records.
bThe measure refers to working 30 hours or more per week.

21
A second feature relevant to Paycheck Plus is the increase in the minimum wage. In New York State the minimum wage was increased to $8 per hour in 2014, to $8.75 per hour in 2015, and to $9 per hour in 2016, with further increases scheduled and a goal of $15 per hour by 2021.11 In mid-2016, the minimum wage was increased further for New York City, to $10.50 for employers with 10 or fewer employees and $11 for employers with 11 or more employees.12 Overall, wages tend to be higher in New York City than the rest of the country, in part reflecting its higher cost of living, and they have increased more rapidly than wages in the rest of the country over the past several years.13
The minimum wage is often proposed as a policy to increase incomes for low-wage workers, and several states and cities outside of New York have also increased their minimum wages recently. The EITC can complement these policies. First, a more generous EITC can still increase incomes even with a higher minimum wage. At $9 per hour, for example, a full-time worker who was employed all year would receive the maximum Paycheck Plus bonus of $2,000. If she earned $11 per hour, she would receive just under $1,200. Second, an expanded EITC might particularly benefit those whose earnings are relatively low because they cannot find full-time work, or find it for the full year.
New York State and City also have their own refundable EITCs, equal to 30 percent and 5 percent of the federal credit, respectively. Noncustodial parents who do not claim the New York State EITC are also eligible to apply for a noncustodial parent EITC (the NCP EIC), instituted in 2006 and available to noncustodial parents who keep up to date on child support payments throughout the tax year.14 Since the Paycheck Plus bonus is calculated to “top up” the federal EITC only, any state or city credits that individuals receive are not subtracted from their Paycheck Plus bonuses.
Paycheck Plus in Atlanta With support from several funders, MDRC has partnered with the United Way in Atlanta to test Paycheck Plus in that city. The Atlanta team recruited 4,000 individuals for the study between October 2015 and April 2016. Half of them were selected at random to be offered Paycheck Plus, to be paid in tax years 2017, 2018, and 2019, and the other half serve as a control group.
11New York State Department of Labor (2017a). 12New York State Department of Labor (2017b). 13Bureau of Labor Statistics (2017c). 14The NCP EIC is calculated as the larger of: 20 percent of the federal EITC for parents with one child or
2.5 times the federal EITC for singles. See New York State Department of Taxation and Finance (2016). See Nichols, Sorenson, and Lippold (2012) for results from a nonexperimental evaluation of the credit’s effects on noncustodial parents’ child support payments and employment rates.

22
As with the New York project, the evaluation will track the outcomes of both groups to deter-mine Paycheck Plus’s effects on income, earnings, well-being, and work.
Atlanta is an appropriate site for a replication because it has a diverse and strong econ-omy, like New York. Although harder hit by the Great Recession than New York City, Atlan-ta’s unemployment rate is now comparable to New York’s. One important difference between the two places, however, can be found in their wage rates. Wage levels tend to be lower in Atlanta than in New York, across all occupations.15 Georgia has a state minimum wage that is lower than the federal minimum wage ($5.15 per hour), although that rate only applies to workers in occupations exempt from the federal minimum, such as farm or seasonal laborers and tipped employees.16 Georgia also does not have a state EITC.
15Bureau of Labor Statistics (2017b). 16National Conference of State Legislatures (2017).

23
Chapter 4
Implementation and Bonus Receipt Rates
This chapter describes the implementation of Paycheck Plus in New York City, and the rate at which participants actually received bonuses (the “take-up rate”). Paycheck Plus faced several challenges in testing the effects of an expanded Earned Income Tax Credit (EITC). First, study participants had to understand and remember the bonus. Although program group members received an explanation of the bonus when they entered the study and a take-home sheet explaining its features, by design there was a long period between study enrollment (in late 2013/early 2014) and receipt of the first bonus (in mid-2015), to allow participants time to adjust their work and earnings in response to the program. This long time gap meant many participants might forget the details of the bonus, or even forget about its existence entirely.
Second, participants needed to apply each year to receive the bonus. Although the pro-gram sought to mirror the process by which tax filers apply for the federal EITC, the bonus was not actually administered by the Internal Revenue Service (IRS) through normal tax filing. Participants could get their bonuses in fewer steps if they filed at one of the participating Volunteer Income Tax Assistance (VITA) sites, but low-income filers do not typically use VITA sites for tax preparation.1
To make sure participants retained information about the program and remained aware of it, the study began reaching out to them during the first half of 2014, soon after study enroll-ment ended in February. Study participants in the program group were offered a $50 gift card to attend a 15-minute reminder orientation on how the program works, which covered how to qualify for the bonus each year, examples of bonus amounts that could be earned at various earnings levels, and an overview of how to apply for the first bonus in early 2015 (see Box 4.1). Overall, about half of program group participants took advantage of the orientation.
Subsequent e-mail and automated (“robocall”) telephone messages were sent to all par-ticipants starting in the fall of 2014. These messages reminded participants that any earnings from work during 2014 could count toward eligibility for the first Paycheck Plus bonus. Additional reminders — along with information about program locations, hours, tax-preparation services, and bonus-application options — were sent during and immediately following the tax season (that is, throughout the first half of 2015). In total, between the fall of 2014 and the middle of 2015, 12 rounds of reminders were sent by letter, postcard, e-mail, text message, and
1Tax Policy Center (2016).

24
robocall. Similar rounds of reminders were repeated during the second program year (from fall 2015 through mid-2016), and again (beginning in fall 2016) for the third, final program year. Figure 4.1 presents an example of one postcard sent to participants early in the tax season.
A VITA call center at Food Bank for New York City (FBNYC), a Paycheck Plus hot-line operated by MDRC, and a Paycheck Plus e-mail account maintained by MDRC provided ways for participants to ask questions of program staff members, resolve complications with their bonus applications, or check on their bonuses after they applied. Beginning in the second program year, participants could also check on the status of a bonus by visiting a Paycheck Plus website.
Box 4.1
The Power of Prompts: Using Insights from Behavioral Science to Encourage People to Participate
To learn about the most effective ways to encourage individuals to attend orientations, a test was embedded in the 2014 outreach effort that included messages informed by behavioral science. The team designed two kinds of postcards to invite participants to attend these meet-ings: one that incorporated concepts from behavioral economics and one that did not (the “standard” version). Half of the sample was sent postcards informed by behavioral science and the other half was sent standard postcards. In addition, half of the people in each of these groups were also sent four text-message reminders. The messages in the texts were either informed by behavioral science or standard, depending on the type of postcards the participant was sent.
The study found that these small and inexpensive changes led to notable increases in attend-ance. The findings were used to design all subsequent messages to participants to remind them about the bonus and encourage them to file taxes.
• Compared with standard messages, messages informed by behavioral science led to a statistically significant increase of 7 percentage points in meeting attendance (over the standard group’s attendance rate of 19 percent).
• Compared with sending only postcards, sending text messages produced a statistically significant increase in attendance of 5 percentage points (over the postcard-only group’s attendance rate of 22 percent).
• Compared with standard postcards alone, text messages and postcards together, both informed by behavioral science, increased meeting attendance by 12 percentage points (over the standard postcard-only group’s attendance rate of 17 percent).
__________________________ NOTE: See Dechausay, Anzelone, and Reardon (2015) for more information.

25
Figure 4.1
Paycheck Plus Outreach Postcard

26
During each tax season, Paycheck Plus posters and flyers were displayed at FBNYC VITA sites, encouraging tax filers to identify themselves if they were Paycheck Plus partici-pants. Staff members at some VITA sites routinely asked filers if they were in the program. If filers said they were in the study or were not sure whether they were, VITA staff members could consult an online tool provided by MDRC to look up individual tax filers and determine whether they were members of the Paycheck Plus program group. In addition, each year FBNYC followed up with participants who had filed their taxes at VITA sites and who ap-peared to be eligible for bonuses, yet who still needed to provide payment instructions.
Cumulatively, between early 2014 and the end of 2016, the program established two-way contact with about three-quarters of program group participants. Two-way contact consist-ed of talking with a Paycheck Plus program staff member in person or by phone, having an e-mail exchange, applying for the bonus, or filing taxes at an FBNYC VITA site. Although this rate suggests that a majority of participants remembered and understood the program, findings from a survey conducted at 32 months will provide more insights into the extent to which these outreach activities helped maintain a high level of awareness and understanding of the Paycheck Plus bonus.
Applying for the Bonus Program group participants could apply annually for the Paycheck Plus bonus as soon as they filed their taxes. The first bonus, based on 2014 earnings, was offered during and immediately following the 2015 tax season. Basic eligibility for the Paycheck Plus bonus was reviewed each year during the spring tax season and for about 10 weeks following the April tax-filing deadline (that is, through the end of June). To receive a bonus for the tax-filing year that had just ended, participants must have had earnings of at least $1 from a job or self-employment and adjusted gross income of less than $30,000. They could not claim dependent children, nor could they be claimed as a dependent by any other tax filer (for example, if the participant was a full-time student being claimed by a parent).2
To apply for the annual bonus, participants first had to file their taxes at FBNYC VITA sites, by using other free or paid tax preparers, or by preparing their own taxes. FBNYC’s VITA program offers many of the same services offered by commercial tax preparers, including common requests such as e-filing, preparing past-year returns, and preparing amended returns.
2Paycheck Plus did not apply the investment income rule used for the EITC when determining eligibility.
That rule states that an adult must have investment income of less than $3,400 to be eligible for a credit. This information was not readily available to the project team, and it would have been costly to collect it. Few individuals in the sample were likely to have had investment income, so it was decided to forgo collecting the information.

27
The program uses professional tax software, and all preparers receive a minimum of 30 hours of training; in contrast, new tax preparers in New York are required to take only 16 hours of training.3 However, VITA has some important limitations: the program cannot process out-of-state returns, or prepare returns for certain types of tax situations such as reporting rental income (Schedule E) or claiming adoption credits. Also, the program operates a limited number of offices throughout the city, meaning that for many filers it may be more convenient to visit tax preparers located in their neighborhoods.
After filing taxes, a participant provided to the Paycheck Plus staff at an FBNYC VITA site a complete copy of the tax return (Form 1040, 1040A, or 1040EZ), copies of all W-2 wage statements and 1099 income statements, and Form 1040 Schedule C (Profit or Loss From Business) if the participant had been self-employed — operating a business or earning cash income. Participants who filed taxes at FBNYC VITA sites typically completed this step the same day they filed their taxes. Those who filed their own taxes or used different tax preparers could bring in or mail in copies of the tax documents that they filed.
To minimize bonus-payment errors, participants or program staff members were also required to furnish documentation that the IRS had accepted their tax forms. For most partici-pants who chose to file taxes electronically at FBNYC VITA sites, this documentation was automatically provided by the IRS within a few days. Participants who filed their own taxes or used other preparers needed to provide additional documentation from their tax preparers or the IRS; in many but all not cases, program staff members were able to help participants collect this information. In rare cases, a bonus application was delayed because the IRS acceptance was delayed — for example, if the filer or the IRS determined that a filer needed to submit an amended tax return, or if the filer was a past or current victim of identity-theft refund fraud.4
Finally, participants chose whether they preferred to receive their bonus payments by direct deposit to their bank accounts, on debit cards that they already owned, or on Paycheck Plus debit cards that they could pick up later from a designated FBNYC tax site. As soon as they applied for the bonus, participants were given a two-page handout listing examples of potential bonus amounts at various earnings levels, summarizing the next steps of processing the application, and providing instructions for how to check on the status and amount of the bonus.
3New York State Department of Taxation and Finance (2017). 4Paycheck Plus did not wait for a refund to be issued to process and pay a bonus. It only required that the
IRS not reject a participant’s tax return when it was filed.

28
Bonus Processing Next, mirroring as much as possible the IRS process for determining and issuing EITC refunds, staff members at FBNYC and MDRC used information from the tax documents to determine whether each applicant was eligible for a bonus and the amount that applicant would receive, and to obtain proof that the IRS had accepted the participant’s tax forms. Before making bonus payments, MDRC sent lists of eligible participants to the New York City Office of Child Support Enforcement, which determined whether any individuals should have some or all of their bonuses intercepted to pay child support debts. If a participant was found to owe child support debt, the bonus was held for 45 days. During this period, the participant was notified of the possibility of the bonus being intercepted and given 45 days to challenge the interception.5
Once bonus amounts were determined, MDRC worked directly with FBNYC and its payment vendor to request, issue, and monitor the deposit of each bonus payment to a bank account or to a debit card. In the first two years of the program, about a third of participants who received bonuses requested Paycheck Plus debit cards as their method of payment.
During each program year, this process was repeated roughly monthly during the tax season and for several months afterwards for late filers. Taking into account the steps listed above, most bonus payments were made about two or three months after participants applied — typically much later than tax-refund payments are made by the IRS. Bonus payments were issued beginning in early April (for participants who applied by the end of February) and continuing through late summer or early fall (for those who applied later, or whose applications required additional documentation).
Bonus Receipt Rates Table 4.1 presents bonus receipt during the 2015 and 2016 tax seasons among the full program group and among those who were eligible based on earnings. The study targeted a broad group of low-income individuals (earning under $30,000 in the previous year), including individuals who had not worked or worked very little in the previous year. Low-income earners often have highly variable earnings and employment from year to year. Thus, it was expected that some fraction of the sample would not be eligible for the bonus, either because they had no earnings or because their earnings exceeded the $30,000 eligibility cutoff.
5Forty-five days is the standard time allowed noncustodial parents to submit a challenge. However, to ex-pedite Paycheck Plus bonus processing in the second year, the Office of Child Support Enforcement, in consultation with New York State’s Office of Temporary and Disability Assistance, reduced this time to 21 days.

29
The top panel presents data on the fraction of sample members who were eligible for the bonus, based on their earnings and whether they filed taxes. About 70 percent of the program group met the earnings requirement to receive the bonus in 2015 (based on earnings during 2014), and among those with eligible earnings, 85 percent filed taxes in 2015. The final
Outcome 2015 2016
Eligibility and filing (%)Eligible for a bonusa 70.3 59.7
Filed taxes, among those eligible for bonuses 84.7 82.7
Eligible for a bonus and filed taxes 59.6 49.4
Bonus receipt (%)Full sample 45.9 34.8
Among those eligible for bonuses 64.4 57.2
Among eligible tax filers 75.8 68.9
Amount received, among recipients ($)Average bonus received 1,399 1,364
Average EITC received 143 140
Sum of bonus and EITC 1,542 1,504
Amount received (%)$1-$500 12.4 13.4$501-$1,000 12.7 13.6$1,000-$1,500 16.3 21.2$1,501-$1,999 38.5 34.1$2,000 20.1 17.7
Sample size = 2,997
Paycheck Plus Bonus Receipt in 2015 and 2016
Table 4.1
SOURCES: IRS tax forms, W-2s, 1040s, and 1099-MISCs; Paycheck Plus program data on bonus receipt.
NOTE: aParticipants eligible for bonuses were those with earnings between $1 and $30,000.

30
row of the top panel shows that 60 percent of the program group had eligible earnings and filed taxes in 2015. As mentioned in Chapter 2, individuals with earnings below a certain amount are not legally required to file taxes.
The next panel presents how many people actually received the bonus in the full sam-ple, among those who were eligible, and among those who were eligible and who filed taxes. In 2015, 46 percent of the full program group received Paycheck Plus bonuses. Among those with earnings in the eligible range, the receipt rate was 64 percent. (Recall that take-up rates for the federal EITC range from 65 percent among childless adults to over 80 percent among families with children. The Paycheck Plus take-up rate of 64 percent is thus similar to the federal EITC take up rate among childless adults.) The final row of the panel presents the percentage who received bonuses among the group who was eligible based on earnings and who filed taxes. Among this group, 76 percent received a bonus. Because nearly all recipients who applied for bonuses were found eligible and received them, tax filers who did not receive bonuses were overwhelmingly those who failed to apply.
Among those who received bonuses, the average amount received was $1,400, and one in five recipients received the full $2,000 in 2015. About a third of the program group received the federal EITC in each year. Among those who received a Paycheck Plus bonus, the average EITC amount received was about $140, and the average amount of bonus plus EITC was about $1,500 in both years.
Only 35 percent of the full program group received bonuses in 2016. Fewer participants were eligible in 2016, as shown in the top panel, but fewer eligible participants also applied. In 2016, for example, only 60 percent of the program group was eligible (based on earnings in 2015), representing a 10 percentage point decline from 2015. Tax filing rates among those eligible for bonuses were roughly similar in both years. Among those who were eligible and who filed taxes, however, only 69 percent applied for and received bonuses in 2016.
The fall in bonus eligibility from 2015 to 2016 reflects in part an increase in the number of participants with zero earnings, but also an increase in the number who earned more than $30,000 (see Figure 4.2). For example, the share of the program group with no earnings in the prior year increased from 17 percent in 2015 to 21 percent in 2016, and the share with earnings over $30,000 increased from 4 percent in 2015 to 9 percent in 2016. Furthermore, the share who claimed dependents increased from 8 percent in 2015 to 10 percent in 2016.6
6Individuals remained eligible for the bonus if they moved outside of New York City, though people who
moved might have been less likely to claim the bonus. A separate analysis (not shown) suggests that the fall in bonus receipt over time is not much affected by moves out of New York City. About 95 percent of eligible filers lived in New York City in Year 1 and that rate only fell to 93 percent in Year 2.

05
1015202530354045
Phase-in$1-$7K
Plateau$7K-$18K
Phase-out$18K-$30K
No earnings Earnings greaterthan $30,000
Has dependents
Perc
enta
geFigure 4.2
Distribution of Program Group Members, by Earnings and Eligibility Status
2015 (tax year 2014)
2016 (tax year 2015)
Earnings Eligibility status
SOURCE: IRS tax forms, W-2s, 1040s, and 1099-MISCs.
NOTE: Phase-in refers to earnings of $1-$6,667; plateau refers to earnings of $6,668-$18,000; phase-out refers to earnings of $18,001-$29,900.
31

32
The fact that not all eligible individuals applied for and received bonuses is also related to the amount they stood to receive. As noted earlier, take-up rates of the federal EITC vary with the expected credit amount, with the lowest take-up rates among those in the phase-in part of the schedule, with lower earnings and lower expected credits. Data for Paycheck Plus show a similar pattern (see Figure 4.3). Individuals whose earnings placed them on the phase-in part of the schedule had the lowest take-up rates, while those on the plateau and in the initial part of the phase-out schedule had the highest take-up rates. The lower take-up rate among those with the lowest earnings (those earning less than $6,667) can in part be attributed to that group’s lower tax-filing rate. Single individuals were not legally required to file taxes in 2015, for example, if their gross incomes in 2014 were less than $10,150. A further look at those who earned less than $6,667 and did not file taxes also shows that half of them would have earned bonuses of less than $500, implying earnings of less than $1,500 for the year.
Yet failure to file taxes does not fully explain the fact that not all eligible individuals applied for bonuses. Even among tax filers, not everyone who was eligible for a bonus received one. In contrast to the federal EITC, Paycheck Plus had no direct means of alerting tax filers who were eligible for bonuses but who failed to claim them.7 Some participants may simply have fallen out of touch with the program, in some cases because of outdated contact infor-mation. Bonus receipt remained very high among those who filed taxes at FBNYC VITA sites, however. Although it may have been that individuals with the most awareness of the program were more likely to file taxes at VITA sites, the reminders and posters about Paycheck Plus at VITA sites may have also made tax filers more likely to remember to apply for bonuses.
In contrast, lower proportions of participants applied for bonuses if they prepared their own taxes or used other free or paid preparers. Past research has proposed various explanations for why more low-income filers do not use VITA tax-preparation services, and nationwide, the use of VITA services is quite low among low-income families.8 One reason is that in-person waiting times can be longer at VITA sites than at paid preparers.9 Also, some filers believe that they can obtain larger refunds with paid preparers. To some extent this perception is true, but paid preparers have also been found to make a high number of errors when preparing clients’ taxes, only some of which are corrected by the IRS.10
7The IRS sends letters and claiming worksheets to filers who appear to have been eligible for the EITC but who did not claim it. See Bhargava and Manoli (2015) for an experiment in which a second round of letters was sent to nonclaimants to test whether modifications to the letter (such as simplification and more infor-mation about the size of the benefit) increased response.
8Tax Policy Center (2016). 9New York City Department of Consumer Affairs, Office of Financial Empowerment (2014). 10U.S. Government Accountability Office (2014).

33
In addition, many filers believe that refunds can be obtained more quickly by using a paid preparer. Although in recent years the Refund Anticipation Loan market has shrunk considerably in response to administrative refund-processing changes at the IRS, some such loans continue to be offered by “fringe financial” providers such as check cashers and payday lenders. Also, many mainstream preparers now instead offer Refund Anticipation Check products — which to consumers may sound like they deliver faster refunds, although they primarily just allow filers to postpone paying their tax-preparation fees until after they receive their refunds.11
Some participants have simply said that they preferred not to use VITA tax preparation services, for these or other reasons. Although these participants have the option of applying
11Wu and Hernandez (2016).
0
10
20
30
40
50
60
70
80
90
$1-$1,000 $1,000-$1,999 $2,000 $1,999-$1,000 $1,000-$1
Phase-in Plateau Phase-out
Perc
enta
geFigure 4.3
Bonus Receipt Rates Among Eligible Individuals, by Expected Bonus Amount
2015 (tax year 2014)
2016 (tax year 2015)
SOURCES: IRS tax forms, W-2s, and 1099-MISCs; Paycheck Plus program data on bonus receipt.

34
separately for the Paycheck Plus bonus, it seems likely that some of them simply forgot to do so or decided that it was not worth the effort.12
Related issues that may affect Paycheck Plus bonus receipt rates are behavioral expla-nations such as a lack of clear information (that is, too little information or overly complex information) about benefit eligibility and the application process, and the amount of effort required to complete the application process (Paycheck Plus requires extra steps beyond tax filing).13 Some of these behavioral issues also apply to the existing EITC and other benefit programs.
Bonus Receipt Rates Among Subgroups Table 4.2 reports bonus receipt rates in 2015 and 2016 among subgroups defined by selected characteristics at study entry. The first column under each year shows the percentage of all Paycheck Plus group members who received a bonus. The second column presents the percent-age of the program group who were eligible for bonuses based on their earnings, and the third column shows the percentage who were eligible based on their earnings and who filed taxes. The final column presents the average bonus amount among bonus recipients.
Table 4.2 shows that in both years higher percentages of women received bonuses than men, in part because higher percentages were eligible for them and in part because more of those who were eligible did apply for and receive them. For example, in 2015, 74 percent of eligible women (54.1 percent ÷ 72.7 percent) received bonuses, compared with 58 percent of eligible men (40.0 percent ÷ 68.7 percent). A larger fraction of eligible women filed taxes, which explains part of the difference in receipt rates. However, even among eligible tax filers, a higher proportion of women than men received bonuses.
Relatively low percentages of former prisoners and noncustodial parents received bo-nuses, largely because they were less likely to apply for and receive them even if they were eligible. Again, the difference in bonus receipt is in part because these two groups filed taxes at lower rates, but in part because even among those who filed taxes, fewer participants applied for and received bonuses. For example, 65 percent of eligible filers with previous incarcerations received bonuses in 2015 (26.1 percent ÷ 40.1 percent), compared with 79 percent of eligible filers without previous incarcerations (50.1 percent ÷ 63.8 percent). Finally, those with earnings in the year before they entered the study were more likely to receive the bonus than those no
12See, for example Kopczuk and Pop-Eleches (2007). 13Bhargava and Manoli (2015).

35
Received a Eligible Eligible and Average Received a Eligible Eligible and AverageSubgroup Bonus (%) (%) Filed Taxes (%) Bonus ($) Bonus (%) (%) Filed Taxes (%) Bonus ($)
Women 54.1 72.7 66.0 1,446 42.8 63.4 56.0 1,356Men 40.0 68.7 54.9 1,356 29.0 56.9 44.6 1,375
35 and younger 48.1 73.4 62.7 1,455 35.1 60.6 51.4 1,398Older than 35 43.2 66.7 56.0 1,326 34.4 58.7 47.1 1,324
Previously incarcerated 26.1 62.7 40.1 1,249 18.2 46.5 32.1 1,276Not previously incarcerated 50.1 72.1 63.8 1,420 38.3 62.6 53.1 1,373
Noncustodial parenta 34.5 70.2 47.7 1,334 24.4 51.9 32.6 1,348Not a noncustodial parent 47.0 70.4 60.7 1,403 35.7 60.5 51.0 1,365
Earnings in the year before enrollmentNo earnings 20.7 53.7 35.4 1,251 16.0 45.8 30.9 1,251$1 to $10,000 54.2 76.7 67.6 1,397 41.8 66.7 57.1 1,356More than $10,000 59.9 78.4 73.1 1,454 44.1 64.2 57.4 1,414
Sample size (total = 2,997)
Table 4.2
Paycheck Plus Bonus Eligibility and Receipt Among Selected Subgroups in 2015 and 2016
20162015
SOURCES: IRS tax forms, W-2s, 1040s, and 1099-MISCs; Paycheck Plus program data on bonus receipt.
NOTES: Average bonus refers to the average bonus amount among bonus recipients.aThe measure refers to noncustodial parents who had open child support cases with positive monthly obligation amounts or positive child support debt
amounts when they enrolled in the study, according to administrative records.

36
earnings in the prior year. Bonus receipt rates fell among all groups from 2015 to 2016, both because lower percentages were eligible and because fewer of those who were eligible applied for and received bonuses.
Table 4.3 presents bonus receipt rates at three earnings levels among the full program group and each subgroup. The table complements the data displayed in Figure 4.3, showing higher bonus receipt rates among those who stood to receive larger bonuses. Individuals whose earnings placed them in the plateau region of the bonus have the highest receipt rates at 75 percent in 2015 and 66 percent in 2016, a pattern that holds for all subgroups and across both years.
Groups with low bonus receipt rates overall have especially low receipt rates along the phase-in portion of the schedule from $1 to $6,667 in annual earnings. For example, among those with earnings of less than $6,667 in 2014, only 26 percent of program group members with prior incarcerations claimed bonuses in 2015, compared with 53 percent of those without prior incarcerations. A similar pattern can be seen among noncustodial parents and to some extent among men. The patterns seem related to the fact that these groups are less likely to file taxes. Separate analyses (not shown) indicate that noncustodial parents and those with previous incarcerations were less likely to receive the bonus even when the analyses controlled for a range of other factors. In other words, considering two individuals of the same age, race, and sex, with similar prior earnings, current earnings, and expected bonus amounts, the one who was a noncustodial parent was still less likely to receive a bonus than the one who was not a noncustodial parent. Similarly, about half of the difference in bonus receipt between men and women can be accounted for by the fact that men were more likely than women to be noncusto-dial parents or former prisoners. However, even among those who were neither noncustodial parents nor former prisoners, men still had lower bonus receipt rates than women.
In sum, the Paycheck Plus program was successfully implemented. Program staff members conducted substantial outreach to program group participants to remind them to claim the bonus. On average, participants received their bonuses two to three months after applying. Fairly high percentages of eligible participants received bonuses, but a fair number of eligible filers did not claim the benefit. The proportion who did not apply for and receive bonuses was particularly high among those with low expected bonus amounts. If the federal EITC were made more generous for childless adults along the lines of Paycheck Plus, a higher percentage of tax filers would probably receive it, since EITC receipt happens automatically with tax filing while the Paycheck Plus bonus-application process involved an additional step and some additional documentation. The lowest-earning groups who are not required to file taxes might still fail to claim the benefit. Thus, the take-up findings from the Paycheck Plus demonstration are probably a conservative test and a lower bound on the likely take-up rates of a more gener-ous federal EITC for adults without dependent children.

Phase-in Plateau Phase-out Phase-in Plateau Phase-outGroup or subgroup (%) $1-$7K $7K-$18K $18K-$30K $1-$7K $7K-$18K $18K-$30K
Full program group 46.7 75.2 75.1 41.1 65.7 64.2
Women 58.7 82.0 77.3 51.4 74.4 70.9Men 39.5 69.3 73.5 33.2 58.1 59.5
35 and younger 43.8 75.1 77.3 37.4 66.8 63.6Older than 35 49.9 75.3 71.6 45.2 64.2 65.0
Previously incarcerated 26.2 63.0 71.0 25.0 50.7 57.5Not previously incarcerated 52.9 76.8 75.8 45.3 67.1 64.9
Noncustodial parenta 34.9 60.0 66.7 26.1 51.7 64.3Not a noncustodial parent 48.1 76.4 75.8 42.4 66.9 64.2
Earnings in the year before enrollmentNo earnings 27.3 56.2 40.0 26.6 42.0 46.0$1 to $10,000 57.5 78.9 77.2 49.3 66.8 69.7More than $10,000 56.1 79.9 78.8 50.0 77.0 65.0
Sample size (total = 2,997)
2015 2016
Table 4.3
Bonus Receipt in 2015 and 2016, by Earnings Level
SOURCES: IRS tax forms, W-2s, 1040s, and 1099-MISCs; Paycheck Plus program data on bonus receipt.
NOTES: Phase-in refers to earnings of $1-$6,667; plateau refers to earnings of $6,668-$18,000; phase-out refers to earnings of $18,001-$29,900.aThe measure refers to noncustodial parents who had open child support cases with positive monthly obligation amounts or positive child support debt
amounts when they enrolled in the study, according to administrative records.
37


39
Chapter 5
Effects on Income, Work, Earnings, and Other Outcomes
Paycheck Plus may affect many outcomes, the most immediate being income, poverty, earn-ings, and employment. The bonus should increase after-bonus incomes among those who receive it, and it may increase employment rates and earnings by increasing the payoff to work. As noted earlier, the bonus may also have the unintended effect of reducing earnings among higher earners in the eligible population. This chapter examines the program’s effects on work, earnings, income, tax filing, and child support payments, along with its effects for certain subgroups. The effects of access to Paycheck Plus are estimated by comparing the outcomes of the program group (which had access to Paycheck Plus) with those of the control group (which did not). The primary data source used to measure the effects presented in this section is tax records from the Internal Revenue Service (IRS), although estimates are also presented using earnings data from New York State unemployment insurance records.
Effects on Employment, Earnings, and Income Table 5.1 presents the effects of Paycheck Plus on employment and average earnings for the full sample. Average wage earnings and self-employment income are available for all sample members, regardless of tax filing status, from W-2 records and 1099 forms, respectively. The program did not have a detectable effect on employment rates or average earnings in 2014. About 80 percent of the study sample worked (that is, reported any earnings) in 2014, with average earnings of about $10,000 (or $13,000 among those with earnings). Self-employment income was a very small fraction of total earnings. About 7 percent of the control group reported any self-employment income (not shown). The employment rate was slightly higher among the program group than the control group in 2014, but not by a statistically significant amount. Average earnings were quite similar among the program and control groups in 2014.
In 2015, however, the program generated a modest increase in employment of 2.5 per-centage points over the control group rate of 73.8 percent.1 This effect, representing a 3.4 percent increase in employment, is in line with predictions based on previous research into labor-supply responses to wage incentives (discussed in Chapter 3). A 10 percent increase in
1As indicated by the asterisks, this difference is statistically significant at the 5 percent level, meaning there is less than a 5 percent chance that differences this large could have been observed by chance if the program had no true effect. The p-value in the right-hand column indicates that there is actually only a 1.2 percent chance (or 0.012) that differences this large could have been observed by chance.

40
earnings from the bonus would be expected to increase employment rates anywhere from 2 percent to 10 percent. The typical bonus recipient got a bonus of $1,364 based on 2015 earnings (as seen in Table 4.1) representing about an 8 percent increase in annual earnings for the typical employed program group member (who had average earnings of $16,887 in 2015). Thus, a 3.4 percent increase in employment for an about 8 percent increase in the wage (or about 4 percent for a 10 percent wage increase) is well within the range predicted by the labor-supply literature.
Program Control DifferenceOutcome Group Group (Effect) P-value
2014Any earnings (%) 79.7 78.8 0.9 0.338
Earnings ($) 10,079 10,047 33 0.893
Wage earnings ($) 9,683 9,628 56 0.816
Self-employment income ($) 396 419 -23 0.722
After-bonus income ($) 10,049 9,395 654 *** 0.001
2015Any earnings (%) 76.3 73.8 2.5 ** 0.012
Earnings ($) 12,885 12,693 192 0.560
Wage earnings ($) 12,413 12,244 169 0.605
Self-employment income ($) 472 449 23 0.756
After-bonus income ($) 12,108 11,464 645 ** 0.015
Sample size (total = 5,968) 2,997 2,971
Table 5.1
Effects on Employment, Earnings, and Income
SOURCE: IRS tax forms, W-2s, and 1099-MISCs.
NOTES: Earnings refers to wages plus self-employment income.After-bonus income refers to earnings plus credit amount minus taxes.A two-tailed t-test was applied to differences between the outcomes of the program and control groups.
Statistical significance levels are indicated as: *** = 1 percent; ** = 5 percent; * = 10 percent.Estimates were regression-adjusted using ordinary least squares, controlling for pre-random assignment
characteristics of sample members.

41
The increase in employment observed in the tax data is not conditional on filing taxes, since the earnings data are from W-2 forms for all participants, not just tax filers. The program also yielded a small (but not statistically significant) increase in average earnings in 2015.
Separate analyses examined whether the program affected the distribution of earnings among workers. Recall that the program creates incentives to increase earnings in the phase-in part of the schedule and reduce earnings at or above the phase-out part of the schedule. Assum-ing individuals understand the structure of the schedule and can adjust their earnings, there may be some reductions in earnings at the higher end of the distribution. The increase in employment in Year 2 seems to be associated with an increase in earnings along the plateau of the credit (or between $6,777 and $18,000). There is no evidence of a reduction in the percentage of workers earning over $30,000, suggesting individuals were not reducing their work effort to remain eligible.
Although effects on a more comprehensive measure of income (derived from a survey) will be presented in the final report, it is possible to obtain a rough estimate using information on bonus receipt, taxes paid, and annual earnings. The IRS data are used to create a measure of after-bonus income (or earnings minus taxes plus credits) for study participants, and this measure is shown at the bottom of each panel in Table 5.1. Because the program group received the Paycheck Plus bonus, its members’ taxes on average are much lower than control group members’ taxes (or put differently, the tax credits they received are much higher). On average, the program group had after-bonus income of about $10,049 in 2014 compared with $9,395 for the control group, a statistically significant increase of $654, or 7 percent. The increase in income for the subsequent year was $645, a 6 percent increase. These increases are averages calculated over the full sample, including those who never received bonuses. Effects on income would be much larger among those who actually received bonuses.
Table 5.2 presents data on employment and earnings from New York State unemploy-ment insurance records. The unemployment insurance data are available quarterly, as opposed to IRS tax data, which are only available on an annual basis. The unemployment insurance data are presented as quarterly averages relative to the time of random assignment. Year 1, for example, roughly corresponds to 2014, although it would be defined as April 2014 through March 2015 for an individual who entered the study in February 2014. Overall, the unemploy-ment insurance data are consistent with the tax data: they show no effect on employment in the early quarters of the follow-up period and a modest increase in employment in the later quarters. Average earnings levels are also very similar to the wage earnings shown in the tax data, at just over $9,000 annually.

42
Program Control DifferenceOutcome Group Group (Effect) P-Value
Ever employed (%)Year 1 74.3 74.2 0.0 0.994Quarter 2 57.3 56.9 0.4 0.707Quarter 3 57.0 56.1 0.9 0.444Quarter 4 58.2 56.6 1.6 0.156Quarter 5 60.0 57.9 2.1 * 0.060Quarter 6 55.9 53.2 2.7 ** 0.017Quarter 7 55.8 53.6 2.2 * 0.053
Average quarterly employment (%)Year 1 58.1 56.9 1.2 0.152
Total earnings ($)Year 1 9,360 9,167 194 0.395Quarter 2 1,986 1,952 34 0.535Quarter 3 2,244 2,215 29 0.644Quarter 4 2,507 2,447 60 0.411Quarter 5 2,623 2,570 52 0.496Quarter 6 2,577 2,510 67 0.401Quarter 7 2,754 2,675 78 0.353
Sample size (total = 5,968) 2,997 2,971
Effects on Employment and Earnings Covered by Unemployment Insurance
Table 5.2
SOURCE: MDRC calculations using data from New York State unemployment insurance wage records.
NOTES: Sample sizes may vary because of missing values.A two-tailed t-test was applied to differences between the outcomes of the program and control
groups. Statistical significance levels are indicated as: *** = 1 percent; ** = 5 percent; * = 10 percent.Estimates were regression-adjusted using ordinary least squares, controlling for pre-random
assignment characteristics of sample members. Rounding may cause slight discrepancies in calculating sums and differences.Dollar averages include zero values for sample members who were not employed.This table includes only employment and earnings in jobs covered by the New York State
unemployment insurance program. It does not include employment outside of New York State, nor in jobs not covered by the unemployment insurance system (for example, "off-the-books" jobs and federal government jobs).

43
Finally, as noted earlier, an additional randomized controlled trial was embedded in the larger study, testing the effects of offering information about and referrals to local employment services to program group members eligible for the Paycheck Plus bonus. Among program group members who earned less than $10,000 in the year before they joined the study, half were randomly selected to receive this additional information. More information about the services is presented in Appendix B. In sum, about half of the employment-referral group received a personal message about the services and a follow-up call, while the remaining half of the employment-referral group received this information in the mail. The results, presented in Table 5.3, show that providing this additional information led to an increase in employment rates in 2015. The group offered the bonus and not given additional information had an employment rate of 68.9 percent in 2015, while the group offered the bonus and given the additional em-ployment information had an employment rate of 72.4 percent, an increase of 3.5 percentage points. Separate analyses (not shown) suggest that a little over half of the program’s total effect on employment reflects the effects on this group that had access to both the bonus and the information about employment services. This finding highlights the need for effective and accessible workforce and training services for low-income workers, even in the presence of policies that make work pay.
Effects on Filing Taxes Table 5.4 presents effects on other outcomes available from tax records. Paycheck Plus led to an increase in the number of participants who filed taxes. In 2015, for example, 68 percent of the control group filed taxes, compared with 73 percent of the program group. Filing rates fell a bit from the first year to the second year, owing to a fall in employment rates over time. However, the program’s sizable positive effect on tax filing is the same in both years.
The next two outcomes relate to the way in which an individual prepared taxes. Low-income people without dependent children typically do not file using Volunteer Income Tax Assistance (VITA) sites, as evidenced by the low rate among the control group: only 20 percent filed taxes using a VITA site in 2015. Not surprisingly, the program led to a large increase in the use of VITA sites, with about half of the increase coming from a reduction in the use of paid preparers. As noted earlier, a participant did not have to file taxes at one of Food Bank for New York City’s VITA sites to receive a bonus, though it was strongly encouraged. Although this increase in the number of people who filed taxes at VITA sites could have increased their waiting times to prepare taxes, it probably also reduced tax-preparation costs for program group

44
members. A recent survey found that Earned Income Tax Credit (EITC) recipients can pay up to $400 to use paid preparers.2
The program also increased program group members’ receipt of the federal EITC by 4 percentage points in 2015 and 2.8 percentage points in 2016. This increase in EITC receipt is most likely due to the increase in the rate of filing, meaning that the program increased tax filing rates among those with relatively low incomes. Recall that workers without dependent children lose eligibility for the federal EITC once their earnings are above $15,000.
2Wu and Hernandez (2016).
Employment- No-Referral DifferenceOutcome Referral Group Group (Effect) P-value
Tax year 2014 Received a bonus in 2015 (%) 40.1 39.6 0.6 0.770
Any earnings in 2014 (%) 75.1 72.8 2.3 0.185
Average earnings in 2014 ($) 7,561 7,428 133 0.729
Tax year 2015Received a bonus in 2016 (%) 31.6 30.2 1.4 0.461
Any earnings in 2015 (%) 72.4 68.9 3.5 * 0.055
Average earnings in 2015 ($) 10,328 9,943 385 0.464
Sample size (total = 2,137) 1,063 1,074
Table 5.3
Who Earned Less Than $10,000 in the Year Before They Entered the StudyEffects of Employment-Referral Services, Among Program Group Members
SOURCE: IRS tax forms, W-2s, and 1099-MISCs.
NOTES: Earnings refers to wages plus self-employment income.A two-tailed t-test was applied to differences between the outcomes of the program and control groups.
Statistical significance levels are indicated as: *** = 1 percent; ** = 5 percent; * = 10 percent.Estimates were regression-adjusted using ordinary least squares, controlling for pre-random assignment
characteristics of sample members.

45
The final two rows in each panel present data on filing status. First, the program led to a small reduction in the rate at which individuals claimed dependent children when filing taxes. About 13 percent of individuals in the control group claimed dependent children in 2016, compared with 10 percent of the program group. Although it it not clear what is causing this
Program Control DifferenceOutcome (%) Group Group (Effect) P-value
2015Filed taxes 73.4 68.4 5.1 *** 0.000
Filed at a VITA site 45.8 19.9 25.9 *** 0.000
Filed using a paid preparer 17.9 31.3 -13.4 *** 0.000
Received the EITC 38.6 34.6 4.0 *** 0.001
Claimed dependent children 8.4 11.0 -2.6 *** 0.001
Filed as married 1.5 1.7 -0.2 0.529
2016Filed taxes 69.0 63.9 5.0 *** 0.000
Filed at a VITA site 36.9 16.1 20.9 *** 0.000
Filed using a paid preparer 19.3 28.9 -9.6 *** 0.000
Received the EITC 32.3 29.5 2.8 ** 0.016
Claimed dependent children 10.1 12.7 -2.6 *** 0.001
Filed as married 2.5 2.3 0.1 0.734
Sample size (total = 5,968) 2,997 2,971
Table 5.4
Effects on Tax Filing
SOURCE: IRS tax forms, W-2s, 1040s, and 1099-MISCs.
NOTES: A two-tailed t-test was applied to differences between the outcomes of the program and control groups. Statistical significance levels are indicated as: *** = 1 percent; ** = 5 percent; * = 10 percent.
Estimates were regression-adjusted using ordinary least squares, controlling for pre-random assignment characteristics of sample members.

46
effect, some individuals who expected to receive Paycheck Plus bonuses and who shared custody of their children may have been more likely to let the other parent claim them as dependents. A separate analysis (not shown) indicated that this reduction in claiming depend-ents is not due to a reduction in fertility (the rate at which participants are having children).
Finally, the program did not affect the rate at which individuals listed their filing status as “married.” One concern heading into Paycheck Plus was that the program might discourage marriage if people thought marriage would cost them the benefit. To address this concern (and avoid creating disincentives to marriage), the Paycheck Plus bonus was calculated based on individual earnings, although this fact was not strongly advertised and may not have been known to program group members. In any case, the data suggest the program had no effect on marriage, and few of the members of either the program or control group filed as married.
Effects for Subgroups Tables 5.5 and 5.6 present effects in each year for subgroups of study participants. In most subgroups, the program led to similar-sized increases in filing rates in both years. The one exception is in Year 1, with a significantly larger increase in filing among older individuals than was seen among their younger counterparts.3 In most groups, however, the program led to an increase in filing rates of about 4 percentage points to 7 percentage points. Filing rates fell among all subgroups from Year 1 to Year 2, although the program’s effects remained similar in size.
When it comes to effects on employment, the overall positive effect in Year 2 does seem to mask differences in effects among different subgroups. There are larger effects, for example, among older participants and among those with no earnings in the year before they joined the study. However, the only difference in effects that is statistically significant is the difference between men and women, with a relatively large positive effect on employment rates among women and no detectable effect among men, although the estimate is positive for men. The program also increased average earnings among women in Year 1 by about 6 percent, an effect that is different from the effect among men to a statistically significant degree. In Year 2, the positive effect on earnings among women is slightly smaller and is not statistically signifi-cant.
3Statistically significant differences in effects for subgroups are indicated in the table by daggers. In this
case there are two daggers, which means the difference in the effects for the two subgroups is statistically significant at the 5 percent level.

47
Program Control Difference Program Control Difference Program Control DifferenceSubgroup Group Group (Effect) Group Group (Effect) Group Group (Effect)
Women 82.9 78.0 4.9 *** 84.0 81.8 2.3 * 11,348 10,656 692 * ††Men 66.9 61.9 4.9 *** 76.7 77.0 -0.3 9,147 9,664 -517
35 and younger 77.9 75.1 2.8 ** †† 85.6 84.6 1.0 11,355 11,147 208Older than 35 68.7 61.0 7.7 *** 73.3 72.5 0.8 8,654 8,860 -206
Previously incarcerated 51.8 47.4 4.3 71.9 69.9 2.0 6,269 6,340 -71Not previously incarcerated 78.8 73.6 5.2 *** 81.8 81.2 0.6 11,003 10,958 46
Noncustodial parenta 59.3 50.6 8.7 ** 76.4 75.7 0.8 8,897 8,809 89Not a noncustodial parent 74.8 70.0 4.8 *** 80.0 79.1 0.9 10,216 10,163 53
Earnings in the year before enrollmentNo earnings 46.8 41.8 4.9 ** 60.1 57.7 2.4 4,930 4,614 315$1 to $10,000 80.1 73.5 6.6 *** 84.0 83.9 0.1 9,211 9,331 -120More than $10,000 90.9 87.9 3.0 ** 93.5 92.7 0.8 16,683 16,777 -94
Sample size (total = 5,968)
Table 5.5
Effects for Subgroups, Year 1 (Tax Year 2014)
Any earnings in 2014 (%) Average earnings in 2014 ($)Filed taxes in 2015 (%)
SOURCE: IRS tax forms, W-2s, and 1099-MISCs.
NOTES: Earnings refers to wages plus self-employment income. A two-tailed t-test was applied to differences between the outcomes of the program and control groups. Statistical significance levels are indicated as: *** =
1 percent; ** = 5 percent; * = 10 percent. Statistical significance levels for differences in subgroup impacts are indicated as: ††† = 1 percent; †† = 5 percent; † = 10 percent.
Estimates were regression-adjusted using ordinary least squares, controlling for pre-random assignment characteristics of sample members.aThe measure refers to noncustodial parents who had open child support cases with positive monthly obligation amounts or positive child support debt
amounts when they enrolled in the study, according to administrative records.

48
Program Control Difference Program Control Difference Program Control DifferenceSubgroup Group Group (Effect) Group Group (Effect) Group Group (Effect)
Women 79.3 73.6 5.8 *** 82.7 78.4 4.3 *** †† 14,159 13,636 523Men 61.7 57.4 4.3 *** 71.6 70.9 0.7 11,967 12,065 -98
35 and younger 76.1 71.6 4.5 *** 83.1 81.7 1.4 14,897 14,678 220
Older than 35 61.4 55.7 5.8 *** 68.9 65.2 3.6 ** 10,684 10,555 129
Previously incarcerated 46.5 41.5 5.0 * 57.4 55.9 1.5 7,738 7,690 47Not previously incarcerated 74.5 69.4 5.1 *** 80.7 78.2 2.5 ** 14,097 13,870 227
Noncustodial parenta 49.3 47.5 1.8 66.1 66.3 -0.1 11,749 10,204 1,545Not a noncustodial parent 70.9 65.5 5.5 *** 77.2 74.5 2.8 *** 13,038 12,927 111
Earnings in the year before enrollmentNo earnings 44.1 38.5 5.7 ** 54.5 50.5 3.9 * 6,971 6,693 278$1 to $10,000 75.0 68.0 7.0 *** 81.4 79.3 2.1 12,349 11,887 462
More than $10,000 85.6 83.9 1.7 91.1 89.4 1.7 19,878 20,108 -230
Sample size (total = 5,968)
Table 5.6
Effects for Subgroups, Year 2 (Tax Year 2015)
Filed taxes in 2016 (%) Any earnings in 2015 (%) Average earnings in 2015 ($)
SOURCE: IRS tax forms, W-2s, and 1099-MISCs.
NOTES: Earnings refers to wages plus self-employment income. A two-tailed t-test was applied to differences between the outcomes of the program and control groups. Statistical significance levels are indicated as: *** =
1 percent; ** = 5 percent; * = 10 percent. Statistical significance levels for differences in subgroup impacts are indicated as: ††† = 1 percent; †† = 5 percent; † = 10 percent.
Estimates were regression-adjusted using ordinary least squares, controlling for pre-random assignment characteristics of sample members.aThe measure refers to noncustodial parents who had open child support cases with positive monthly obligation amounts or positive child support debt
amounts when they enrolled in the study, according to administrative records.

49
The effect on employment among women in Year 2 of 4.3 percentage points, or a 5 percent increase, is in line with previous research suggesting that women’s employment is more responsive to economic incentives than men’s.4 Nonetheless, the smaller employment effect on men is somewhat disappointing since less-skilled men have seen their wages and employment rates fall the most dramatically over the past several decades.
There are other possible reasons for a lower response to the bonus among men. Lower percentages of men eligible for the bonus actually received it than did women, particularly among those with low earnings, and particularly among noncustodial parents and former prisoners. Among those earning less than $7,000 for example, only 41 percent of men received the bonus in 2016 compared with over 59 percent of women. It may be that men were less likely to file taxes if they were not required to. The program may also have been less salient to men than to women. The survey data to be used in the final report will assess participants’ knowledge of the Paycheck Plus bonus. If men responded to the program less strongly because they were less aware of it, then they might be expected to respond more strongly if an EITC for workers without dependent children were to become federal policy and all filers automatically received it.
Effects on Child Support Payments Access to Paycheck Plus could lead to an increase in child support payments and a reduction in child support debt. If the program increased employment and earnings among noncustodial parents, for example, child support payments might increase, either through direct payments or wage withholding. The bonus itself, as additional income, might also lead to additional pay-ments or might reduce child support debt when it was intercepted. Paycheck Plus in New York replicates the Federal Tax Refund Offset Program, which intercepts tax refunds to pay down past-due child support payments. MDRC worked with the New York City Office of Child Support Enforcement to identify program group members who earned bonuses and who met the criteria to have those bonuses intercepted. Once the amount to be intercepted was determined, the intercepted funds were then forwarded to the state child support agency.
Table 5.7 presents effects on child support payments and child support debt among in-dividuals who were noncustodial parents when they entered the study. This sample is defined as those individuals determined by the Office of Child Support Enforcement to have had current child support orders or child support debts in early 2014 (near the start of study enrollment). The top panel presents effects on child support payments in 2014 and 2015 among noncustodial
4Blundell and MaCurdy (1999).

50
Program Control DifferenceOutcome Group Group (Effect) P-Value
Paymentsa
2014Average monthly amount owed ($) 275 269 5 0.782Ever made a payment (%) 77.3 76.8 0.5 0.893Average number of payments 5.0 5.0 0.0 0.937Average monthly amount paid ($) 155 135 20 0.262Average monthly amount paid via wage withholding ($) 78 81 -4 0.797
2015Average monthly amount owed ($) 259 237 22 0.285Ever made a payment (%) 79.4 71.1 8.3 ** 0.045Average number of payments 5.4 4.9 0.4 0.288Average monthly amount paid ($) 191 137 54 ** 0.012Average monthly amount paid via wage withholding ($) 94 81 13 0.420
Sample size (total = 409) 208 201
Child support debtb
2014Had child support debt in December 2014 (%) 85.5 85.7 -0.2 0.955Average debt amount in December 2014 ($) 12,245 13,399 -1,154 0.114Debt amounts in December 2014 (%)
Less than $500 26.9 26.5 0.4 0.923$500 - $7,499 33.9 30.6 3.3 0.426$7,500 - $19,999 18.7 17.2 1.5 0.659$20,000 or more 20.6 25.7 -5.1 ** 0.039
2015Had child support debt in December 2015 (%) 78.4 80.7 -2.3 0.518Average debt amount in December 2015 ($) 12,189 13,036 -847 0.332Debt amounts in December 2015 (%)
Less than $500 35.0 29.5 5.5 0.160$500 - $7,499 24.9 27.0 -2.1 0.592$7,500- $19,999 20.9 21.4 -0.5 0.901$20,000 or more 19.3 22.2 -2.9 0.246
Sample size (total = 513) 258 255(continued)
Table 5.7
Effects on Child Support Payments and DebtAmong Noncustodial Parents

51
parents who had current orders when they entered the study. On average they owed $270 per month in child support, and 77 percent of them made at least one payment in 2014. On average, noncustodial parents in the control group paid $135 per month over the course of 2014. (Note, however, that payment amounts are calculated using the full noncustodial parent sample and thus include zeros for parents who did not pay any support. Separate calculations show that those who did pay in a given month paid $393 on average.)
Paycheck Plus led to an increase in payments in 2015. About 80 percent of noncustodial parents in the program group made at least one payment during the year, compared with 71 percent of those in the control group, an increase of 8.3 percentage points. Similarly, the program group paid on average $191 per month, an increase of $54 over the control group.
It is possible that if the program increased earnings in Year 2, it may have led to an in-crease in the payment of child support. (Note from Table 5.6 that the effect on earnings among noncustodial parents was quite large, although not statistically significant.) However, the increase in payments is also due in part to the interception of the bonus, which results in a one-time payment. Separate analyses show that excluding the interception of the Paycheck Plus bonus from the monthly average payment amount reduces the effect on average payments, although it is still positive and statistically significant. The effect on ever making a payment during the year is unchanged. The interception of the bonus therefore does not appear to be the main explanation for the increased payment of child support. Child support payments may have increased due to the increased earnings noted earlier, or participants may have used their bonuses to make child support payments.
The bottom panel presents data on child support debt for the full sample of noncustodial parents: those who had current orders when they entered the study and those without current orders but with child support debt. Note that any effect on child support debt in 2014 is not the
Table 5.7 (continued)
SOURCE: MDRC calculations using data from the New York City Office of Child Support Enforcement.
NOTES: Sample sizes may vary because of missing values.A two-tailed t-test was applied to differences between the outcomes of the program and control groups.
Statistical significance levels are indicated as: *** = 1 percent; ** = 5 percent; * = 10 percent.Estimates were regression-adjusted using ordinary least squares, controlling for pre-random assignment
characteristics of sample members. Standard errors were adjusted to account for multiple observations per family.Rounding may cause slight discrepancies in calculating sums and differences.aThe top panel includes noncustodial parents who had open child support cases with positive monthly
obligation amounts when they enrolled in the study, according to administrative records. bThe bottom panel includes noncustodial parents who had open child support cases with positive monthly
obligation amounts or positive child support debt amounts when they enrolled in the study, according to administrative records.

52
result of intercepting participants’ bonuses, since the first bonus was paid in spring 2015. The average debt amount among control group members was $13,399 in December 2014, or about a year after random assignment. Although this average is quite high, more than half of parents owed less than $7,500. In general, the Paycheck Plus program did not affect child support debt levels. While the data suggest some reduction in average amounts, this difference should be interpreted with caution. There was a notable difference in average debt amounts at the start of the study, with the program group owing less than the control group. In addition, the lack of an effect on child support debt in 2015, when the first bonus would have been intercepted, is not surprising, since only a third of noncustodial parents received bonuses that year and only about 22 percent had some or part of their bonuses intercepted.
Conclusion The EITC has helped to counter rising earnings inequality and stagnating real wages by increas-ing the incomes of low-income workers. But the EITC has been much more generous to adults with dependent children than to those without dependent children. Paycheck Plus is a test of a more generous EITC for adults without dependent children. This group makes up a significant fraction of low-wage workers and has faced the same deteriorating labor-market conditions for several decades.
The interim results presented here show that the program was successfully implemented in New York City, with a fairly high percentage of eligible workers receiving the bonus. The program led to an increase in after-bonus income and the rate of filing taxes in both of its first two years and to a modest increase in employment during the second year. The employment effects were larger among women than men, but small positive effects on employment were consistent across many types of participants in the second year. There is also no evidence that the program reduced work effort or earnings among those with higher initial earnings. Finally, the program led to an increase in child support payments among noncustodial parents. The findings are consistent with other research on the EITC, showing that it can be an effective work-based safety-net program, increasing income at the lower end of the income distribution while encouraging and rewarding work.
Future reports from the Paycheck Plus demonstration will update these interim effects in New York City through three years and present more comprehensive effects on income, poverty, and material and subjective well-being using survey data. Findings from Atlanta will add to the evidence regarding this potential policy, presenting effects in a different context from New York City.

Appendix A
Supplementary Documents


55
Appendix Figure A.1
Paycheck Plus Take-Home Sheet Welcome to the Paycheck Plus study and congratulations on being selected for the Paycheck Plus group!
• Being a part of the Paycheck Plus group means that you are eligible for the Paycheck Plus Bonus. • This bonus is designed to help workers by giving them additional income as their earnings rise. • As you work over the next year, you will be able to increase your earnings by as much as $2,000. • Your earnings in 2014 will determine how much your bonus is in 2015. • The bonus is offered for three years, for earnings in 2014, 2015, and 2016. This means you could
receive a bonus payment after you file your taxes in 2015, 2016, and 2017! Here is how it works. The bonus has three parts.
1) At first, the bonus amount begins to increase as your earnings grow. 2) Once your earnings reach $7,000, you reach the peak where the bonus amount is at its highest:
$2,000 in a combination of tax credits and bonus. 3) The bonus starts going down slowly as you earn more than $18,000, but you will still be better
off since you will have higher earnings. This chart shows examples of how much you can get, depending on your earnings:
If your earnings are: Your tax credit plus bonus will be:
$6,000 $1,800
$7,000 to $18,000 $2,000
$20,000 $1,664
If you owe unpaid child support to the Office of Child Support Enforcement (OCSE), the bonus that you earn in Paycheck Plus will be applied to reduce or pay off this child support debt. If you talk with OCSE about your debt now, before you receive your bonus in 2015, they have programs that may help you get caught up on payments or even reduce your payments. You also have the right to appeal the amount of the deduction. Also, your earnings bonus may be counted as income for public benefits budgeting purposes. Remember to file your taxes at one of Food Bank’s Volunteer Income Tax Assistance (VITA) sites, where you can get your taxes done free! You can get the bonus after you file taxes starting in 2015. To help you take advantage of your bonus, we’ll remind you to where and when to file and will give you a list of VITA sites.

56
Appendix Figure A.2
Employment-Referral Service Mailing Insert
Do You Need Help Finding a Job? To receive your Paycheck Plus bonus, you need to work
For help getting a job or finding a new job, visit one of the Workforce1 Career Centers listed on the back page. Bring this blue page with you to get help with: job search, placement, improving your resume, career planning, and more.
Visit a Workforce1 Career Center for services like:
• Resume review
• Interview assistance
• Sector-focused workshops
• Career counseling
• Job search support and placement
• Career advancement planning
• Occupational skills trainings
If you are interested in what Workforce1 Career Centers have to offer, just follow these steps:
1. Pick the most convenient location from the list of Centers (see the back of this page).
2. Make sure you bring a picture ID with you – a driver’s license or state ID will work.
3. If you have a resume, bring it with you! If not, bring a list of your past employers and information about your wages and skills.
4. Go to a Workforce1 Career Center at the time listed.
5. If it is your first time at a Workforce1 Career Center, you will need to attend an orienta-tion and be prepared to answer questions about your work history, any criminal record, current employment status, etc.
Optional: If you would like our advice about which Workforce1 Career Center is best for you, or if you have questions about what services the Centers have:

57
• Just call 212-340-4480 by October 10th and leave a message with your name and phone number. Someone from Paycheck Plus will call you back to answer your ques-tions.
Orientation Schedules for Walk-In Orientation will be a detailed informational session on the program services.
Please arrive 30 minutes early for sign in. Orientation seating is on a first come, first served basis. Individuals with Prior Convictions Bronx Employment Works Center (Serves residents of Manhattan, Bronx) Monday through Friday @ 9:00am 1231 Lafayette Avenue, 1st Floor Bronx, NY 10474 Tel: (917) 447-4418
Brooklyn Employment Works Center (Serves residents Brooklyn, Staten Island, Queens) Tuesday @ 11:00am Wednesday @ 11:00am 9 Bond Street, 5th Floor, Brooklyn, NY 11201 Tel: (347) 296-8034
General Workforce Centers Bronx Workforce1 Center Tuesday, Wednesday and Thursday @ 9:00am Tuesday designated to (Spanish) 400 East Fordham Road, Bronx, NY 10458 Tel: (718) 960-2458
Brooklyn Workforce1 Center (Evening hours Wednesday until 7:00pm for returning clients*) Mondays and Wednesdays @10:00am Tuesdays and Thursdays @ 1:00pm 9 Bond Street, 5th Floor, Brooklyn, NY 11201 Tel: (347) 296-8002
Queens Workforce1 Center (Evening hours Wednesday until 7:00pm for returning cli-ents*) Monday and Thursday @ 1:00PM Tuesday and Friday @ 10:00AM 168-25 Jamaica Avenue, 2nd Floor • Jamaica, New York 11432 Tel: (718) 557-6755 • TTY (718) 658-6906
Staten Island Workforce1 Center Monday through Thursday @ 8:45am 120 Stuyvesant Place, 3rd Floor • Staten Island, NY 10301 Between Wall and Hyatt Streets Tel: (718) 285-8388

58
Workforce1 Industrial & Transportation Career Center Monday through Friday @ 9:00am 168-46 91st Ave., 2nd Floor • Jamaica, NY 11432 Between 168th and 169th Streets Tel: (718) 577-2194
*Or register for Workforce1 services at: www.nyc.gov/html/sbs/wf1/html/register/register.shtml

Appendix B
Testing the Effects of a Referral to Employment Services


61
By increasing the payoff to work, the Paycheck Plus bonus is expected to lead to an increase in employ-ment rates. As noted in the main text of the report, however, the size of this effect is unclear and depends on how responsive individuals are to incentives. One concern with work incentives is that many people who want to respond to them may have difficulty doing so if they cannot find work. They may be especially likely to have trouble during economic downturns, but it can be challenging to find work even in better economic times, given changes in the economy that have reduced demand for less-skilled labor.
One question, then, is whether the addition of employment assistance to the offer of the bonus could lead to larger effects than the offer of the bonus alone. To test this idea, and with additional support from the Robin Hood Foundation, the project included an embedded randomized controlled trial. A subset of individuals assigned to the program group (offered the Paycheck Plus bonus) who also reported earnings less than $10,000 in the year before they entered the study were assigned at random to one of two groups: (1) an employment-referral group, eligible to receive additional information about and referrals to employment services near them, or (2) a no-referral group, not eligible to receive these services, although they could seek out employment assistance on their own. Both groups continued to be offered the Paycheck Plus bonus for three years. By comparing the outcomes of these two groups it is possible to test whether additional referral information on top of the bonus increases employment rates more than the bonus alone.
MDRC worked with Grant Associates, a well-known employment-assistance provider in New York City, to design and implement the employment-referral services. These referrals took place in the spring of 2014 in conjunction with an additional marketing effort conducted to encourage all program group members to visit Volunteer Income Tax Assistance (VITA) sites to hear again about Paycheck Plus. Employment-referral group members who never visited or called VITA sites were provided employment-assistance referrals by mail.
Grant Associates developed training materials and protocols for Paycheck Plus. For a participant in the employment-referral group, a Paycheck Plus staff member was instructed to determine whether employment assistance was needed and whether the participant was already receiving services from an employment agency. The staff member then directed the participant to one of New York City’s Work-force1 Career Centers, providing a referral ticket and a suggested time to visit. The participant left the meeting with a handout and an appointment time to visit a nearby Center. That participant was then called by a staff member at Grant Associates in the subsequent months to determine whether he or she had visited a Center, and to encourage him or her to do so if not.
Of the 1,063 individuals assigned to the employment-referral group, about 480 visited VITA sites and received referrals and follow-up calls from Grant Associates. Observations by MDRC indicated that Paycheck Plus staff members delivered the referrals as designed. Many participants told these staff members about their employment goals, challenges, and plans. Some participants had not been aware of the employment services offered by the providers mentioned. Others had tried using such services before without success; of these, many agreed nevertheless to try using the services again.
Grant Associates reported making follow-up contact with 83 percent of these people over the subsequent several months, speaking with an individual more than once in about a third of the cases. Among the people called, 21 percent were employed, and 25 percent reported having visited a Work-

62
Force1 Center. (Similar data were not collected for the group that was not assigned to receive the em-ployment referral, so it cannot be known how many more members of the employment-referral group received such services than members of the no-referral group.) Staff members reported that in follow-up phone calls, many participants reported that they had forgotten about the information or were planning to visit a Workforce1 Center soon. Many others had not known of the providers in their areas and were planning to attend. Some participants also used the calls to request additional information about Paycheck Plus.
The remaining approximately 500 individuals in the employment-referral group who did not visit VITA sites in the spring of 2014 were sent employment-referral information by mail in September 2014. This group was also encouraged to go to Workforce1 Career Centers if they needed jobs, given a list of Centers, and directed to the Centers closest to them. They were also given the option to provide their phone numbers if they wanted Grant Associates to follow up with them to provide further assistance. See Appendix A for an example of the mailing.
Thus, the employment services were minimal but did provide additional information about and encouragement to use existing workforce services. About half of the employment-referral group received a personal message about the services, with the majority of that group receiving at least one follow-up call. The remaining half received a mailing about the services. Because the services were minimal and because only half of the employment-referral group received the services in person, it was expected that the employment referral might increase employment rates, but only modestly.

Appendix C
Baseline Equivalence of Research Groups

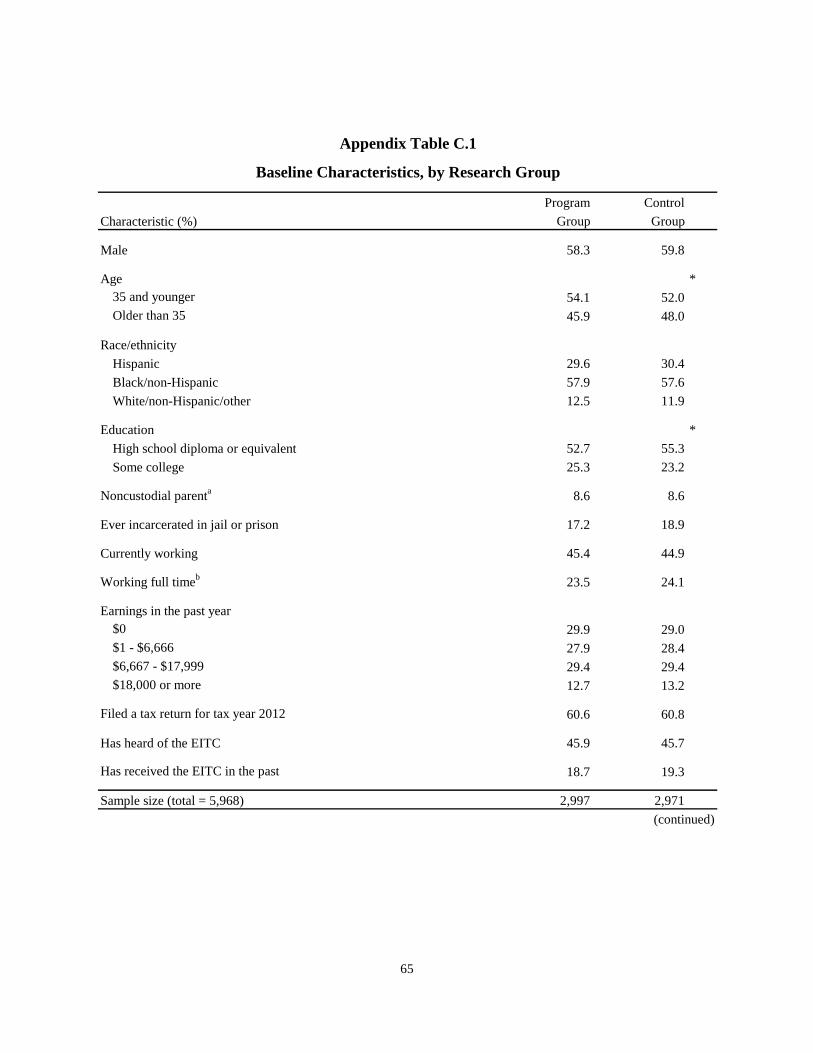
65
Program ControlCharacteristic (%) Group Group
Male 58.3 59.8
Age *35 and younger 54.1 52.0Older than 35 45.9 48.0
Race/ethnicityHispanic 29.6 30.4Black/non-Hispanic 57.9 57.6White/non-Hispanic/other 12.5 11.9
Education *High school diploma or equivalent 52.7 55.3Some college 25.3 23.2
Noncustodial parenta 8.6 8.6
Ever incarcerated in jail or prison 17.2 18.9
Currently working 45.4 44.9
Working full timeb 23.5 24.1
Earnings in the past year$0 29.9 29.0$1 - $6,666 27.9 28.4$6,667 - $17,999 29.4 29.4$18,000 or more 12.7 13.2
Filed a tax return for tax year 2012 60.6 60.8
Has heard of the EITC 45.9 45.7
Has received the EITC in the past 18.7 19.3
Sample size (total = 5,968) 2,997 2,971
Appendix Table C.1
Baseline Characteristics, by Research Group
(continued)

66
Appendix Table C.1 (continued)
SOURCE: MDRC calculations using Paycheck Plus baseline survey data and New York City Office of Child Support Enforcement administrative records.
NOTES: Includes sample members randomly assigned between September 27, 2013 and February 18, 2014. To assess differences in characteristics across noncustodial parent groups, chi-square tests were used for
categorical variables. Significance levels are indicated as: *** = 1 percent; ** = 5 percent; * = 10 percent. The significance level indicates the probability that one would be making an error in concluding that there is a difference between research groups for the variable in question. Percentages for some categories may not add up to 100 due to rounding or missing values.
aThe measure refers to noncustodial parents who had open child support cases with positive monthly obligation amounts or positive child support debt amounts when they enrolled in the study, according to administrative records.
bThe measure refers to working 30 hours or more per week.

67
References
Autor, David H. 2014. “Skills, Education, and the Rise of Earnings Inequality Among the Other 99 Percent.” Science 344, 6,186: 843-851.
Autor, David H., Lawrence F. Katz, and Melissa S. Kearney. 2008. “Trends in U.S. Wage Inequality: Revising the Revisionists.” Review of Economics and Statistics 90, 2: 300-323.
Berlin, Gordon. 2007. “Rewarding the Work of Individuals: A Counterintuitive Approach to Reducing Poverty and Strengthening Families.” The Future of Children 17, 2: 17-42.
Bhargava, Saurabh, and Dayanand Manoli. 2015. “Psychological Frictions and the Incomplete Take-Up of Social Benefits: Evidence from an IRS Field Experiment.” American Economic Review 105, 11: 3,489-3,529.
Blundell, Richard, and Thomas MaCurdy. 1999. “Labor Supply: A Review of Alternative Approaches.” Pages 1,559-1,698 in Orley C. Aschenfelter and David Card (eds.), Handbook of Labor Economics Volume 3A. Amsterdam: Elsevier Science.
Bureau of Labor Statistics. 2017a. “Labor Force Statistics from the Current Population Survey.” Website: https://data.bls.gov/timeseries/LNU01300061.
Bureau of Labor Statistics. 2017b. “May 2016 Metropolitan and Nonmetropolitan Area Occupational Employment and Wage Estimates, Atlanta-Sandy Springs-Roswell, GA.” Website: www.bls.gov/oes/current/oes_12060.htm.
Bureau of Labor Statistics. 2017c. “New York City Economic Summary.” Website: www.bls.gov/regions/new-york-new-jersey/summary/blssummary_newyorkcity.pdf.
Center on Budget and Policy Priorities. 2016. “Policy Basics: The Earned Income Tax Credit.” Website: www.cbpp.org/research/federal-tax/policy-basics-the-earned-income-tax-credit.
Chetty, Raj, John N. Friedman, and Emmanuel Saez. 2013. “Using Differences in Knowledge Across Neighborhoods to Uncover the Impacts of the EITC on Earnings.” American Economic Review 103, 7: 2,683-2,721.
Chetty, Raj, and Emmanuel Saez. 2013. “Teaching the Tax Code: Earnings Responses to an Experiment with EITC Recipients.” American Economic Journal: Applied Economics 5, 1: 1-31.
Dahl, Gordon B., and Lance Lochner. 2012. “The Impact of Family Income on Child Achievement: Evidence from Changes in the Earned Income Tax Credit.” American Economic Review 102, 5: 1,927-1,956.
Dechausay, Nadine, Caitlin Anzelone, and Leigh Reardon. 2015. The Power of Prompts: Using Behavioral Insights to Encourage People to Participate. New York: MDRC.
Economic Policy Institute. 2017. “Wages by Education.” Website: www.epi.org/data/#?subject =wage-education.

68
Edelman, Peter, Mark Greenberg, Steve Holt, and Harry Holzer. 2009. “Expanding the EITC to Help More Low-Wage Workers.” Washington, DC: Georgetown Center on Poverty, Inequality, and Public Policy.
Eissa, Nada, and Hilary W. Hoynes. 2006. “Behavioral Responses to Taxes: The Earned Income Tax Credit and Labor Supply.” Pages 73-110 in James Poterba (ed.), Tax Policy and the Economy Volume 20. Cambridge, MA: MIT Press.
Eissa, Nada, and Jeffrey B. Liebman. 1996. “Labor Supply Response to the Earned Income Tax Credit.” Quarterly Journal of Economics 111, 2: 605-637.
Evans, William N., and Craig L. Garthwaite. 2014. “Giving Mom a Break: The Impact of Higher EITC Payments on Maternal Health.” American Economic Journal: Economic Policy 6, 2: 258-290.
Halpern-Meekin, Susan, Kathryn Edin, Laura Tach, and Jennifer Sykes. 2015. It’s Not Like I’m Poor: How Working Families Make Ends Meet in a Post-Welfare World. Oakland, CA: University of California Press.
Hotz, V. Joseph, and John Karl Scholz. 2003. “The Earned Income Tax Credit.” Pages 141-197 in Robert A. Moffitt (ed.), Means-Tested Transfer Programs in the United States. Chicago: University of Chicago Press.
Hoynes, Hilary, Doug Miller, and David Simon. 2015. “Income, the Earned Income Tax Credit, and Infant Health.” American Economic Journal: Economic Policy 7, 1: 172-211.
Jones, Maggie R. 2014. “Changes in EITC Eligibility and Participation, 2005-2009.” Center for Administrative Records Research and Applications Working Paper #2014-04. Washington, DC: U.S. Census Bureau, Center for Administrative Records Research and Applications.
Kearney, Melissa S., and Lesley Turner. 2013. “Giving Secondary Earners a Tax Break: A Proposal to Help Low- and Middle-Income Families.” The Hamilton Project Discussion Paper 2013-7. Washington, DC: The Hamilton Project.
Kopczuk, Wojciech, and Cristian Pop-Eleches. 2007. “Electronic Filing, Tax Preparers and Participation in the Earned Income Tax Credit.” Journal of Public Economics 91, 7: 1,351-1,367.
McClelland, Robert, and Shannon Mok. 2012. “A Review of Recent Research on Labor Supply Elasticities.” Congressional Budget Office Working Paper 2012-12. Washington, DC: Congressional Budget Office.
Meyer, Bruce D., and Douglas Holtz-Eakin (eds.). 2002. Making Work Pay. New York: Russell Sage Foundation.
Meyer, Bruce D., and Dan T. Rosenbaum. 2001. “Welfare, the Earned Income Tax Credit, and the Labor Supply of Single Mothers.” Quarterly Journal of Economics 116, 3: 1,063-1,114.
69
National Conference of State Legislatures. 2017. “State Minimum Wages: 2017 Minimum Wage by State.” Website: www.ncsl.org/research/labor-and-employment/state-minimum-wage-chart.aspx.
New York City Department of Consumer Affairs, Office of Financial Empowerment. 2014. “Virtual VITA: Expanding Free Tax Preparation: Program Insights.” Website: www1.nyc.gov/assets/dca/downloads/pdf/partners/ Research-VirtualVITAProgramInsights.pdf.
New York State Department of Labor. “History of the General Hourly Minimum Wage in New York State.” https://labor.ny.gov/stats/minimum_wage.shtm. Accessed on June 12, 2017a.
New York State Department of Labor. “Minimum Wage.” Website: www.labor.ny.gov/ workerprotection/laborstandards/workprot/minwage.shtm. Accessed on June 7, 2017b.
New York State Department of Taxation and Finance. 2016. “Instructions for Form IT-209 Claim for Noncustodial Parent New York State Earned Income Credit.” Website: www.tax.ny.gov/pdf/current_forms/it/it209i.pdf.
New York State Department of Taxation and Finance. 2017. “New York State Tax Return Preparer Continuing Education Requirements.” Website: www.tax.ny.gov/tp/reg/ cont_ed_req.htm.
Nichols, Austin, and Jesse Rothstein. 2016. “The Earned Income Tax Credit.” Pages 137-218 in Robert A. Moffitt (ed.), The Economics of Means-Tested Transfer Programs in the United States Volume 1. Chicago: University of Chicago Press.
Nichols, Austin, Elaine Sorenson, and Kye Lippold. 2012. “The New York Noncustodial Parent EITC: Its Impact on Child Support Payments and Employment.” Washington DC: Urban Institute.
Office of Management and Budget. 2015. “The President’s Budget for Fiscal Year 2016.” Washington, DC: Office of Management and Budget.
Pencavel, John. 1987. “Labor Supply of Men: A Survey.” Pages 3-102 in Orley Aschenfelter and Richard Layard (eds.), Handbook of Labor Economics Volume 1. Amsterdam: Elsevier.
Plueger, Dean. 2009. “Earned Income Tax Credit Participation Rate for Tax Year 2005.” Paper given at the 2009 IRS Research Conference, July 8-9, Washington, DC. Website: www.irs.gov/pub/irs-soi/09resconeitcpart.pdf.
Ryan, Paul. 2014. “Expanding Opportunity in America: A Discussion Draft from the House Budget Committee.” Washington, DC: U.S. House of Representatives Budget Committee.
Sykes, Jennifer, Katrin Katz, Kathryn Edin, and Sarah Halpern-Meekin. 2015. “Dignity and Dreams: What the Earned Income Tax Credit (EITC) Means to Families.” American Sociological Review 80, 2: 243-267.

70
Tax Policy Center. 2016. “Why Do Low-Income Families Use Tax Preparers? Briefing Book: A Citizen’s Guide to the Fascinating (Though Often Complex) Elements of the Federal Tax System.” Website: www.taxpolicycenter.org/briefing-book/why-do-low-income-families-use-tax-preparers.
Tax Policy Center. 2017. “EITC Parameters, 1975-2017.” Website: www.taxpolicycenter.org/ statistics/eitc-parameters.
U.S. Government Accountability Office. 2014. “Paid Tax Return Preparers: In a Limited Study, Preparers Made Significant Errors.” Washington, DC: U.S. Government Accountability Office.
Wu, Chi Chi, and Chantal Hernandez. 2016. Minefield of Risks: Taxpayers Face Perils from Unregulated Preparers, Lack of Fee Disclosure, and Tax-Time Financial Products. Boston, MA: National Consumer Law Center and Consumer Federation of America.

71
Earlier MDRC Publications on Paycheck Plus
Testing an Expanded Earned Income Tax Credit for Single Adults Year 1 of Paycheck Plus 2015. Cynthia Miller, Caroline Schultz, and Alexandra Bernardi. The Power of Prompts Using Behavioral Insights to Encourage People to Participate 2015. Nadine Dechausay, Caitlin Anzelone, and Leigh Reardon. Paycheck Plus Making Work Pay for Low-Income Single Adults 2014. Paycheck Plus A New Antipoverty Strategy for Single Adults 2014. Rachel Pardoe and Dan Bloom. ____________________________ NOTE: A complete publications list is available from MDRC and on its website (www.mdrc.org), from which copies of reports can also be downloaded.

About MDRC
MDRC is a nonprofit, nonpartisan social and education policy research organization dedicated to learning what works to improve the well-being of low-income people. Through its research and the active communication of its findings, MDRC seeks to enhance the effectiveness of social and education policies and programs.
Founded in 1974 and located in New York; Oakland, California; Washington, DC; and Los Angeles, MDRC is best known for mounting rigorous, large-scale, real-world tests of new and existing policies and programs. Its projects are a mix of demonstrations (field tests of promising new program approaches) and evaluations of ongoing government and community initiatives. MDRC’s staff members bring an unusual combination of research and organizational experience to their work, providing expertise on the latest in qualitative and quantitative methods and on program design, development, implementation, and management. MDRC seeks to learn not just whether a program is effective but also how and why the program’s effects occur. In addition, it tries to place each project’s findings in the broader context of related research — in order to build knowledge about what works across the social and education policy fields. MDRC’s findings, lessons, and best practices are shared with a broad audience in the policy and practitioner community as well as with the general public and the media.
Over the years, MDRC has brought its unique approach to an ever-growing range of policy areas and target populations. Once known primarily for evaluations of state welfare-to-work programs, today MDRC is also studying public school reforms, employment programs for ex-prisoners, and programs to help low-income students succeed in college. MDRC’s projects are organized into five areas:
• Promoting Family Well-Being and Children’s Development
• Improving Public Education
• Raising Academic Achievement and Persistence in College
• Supporting Low-Wage Workers and Communities
• Overcoming Barriers to Employment
Working in almost every state, all of the nation’s largest cities, and Canada and the United Kingdom, MDRC conducts its projects in partnership with national, state, and local governments, public school systems, community organizations, and numerous private philanthropies.