expansion of the panama canal and its impact … · expansion of the panama canal and its impact on...
TRANSCRIPT
EXPANSION OF THE PANAMA CANAL AND ITS IMPACT ON TANKERS
José Ramón Arango S.Liquid Bulk Segment
October 4th 2017

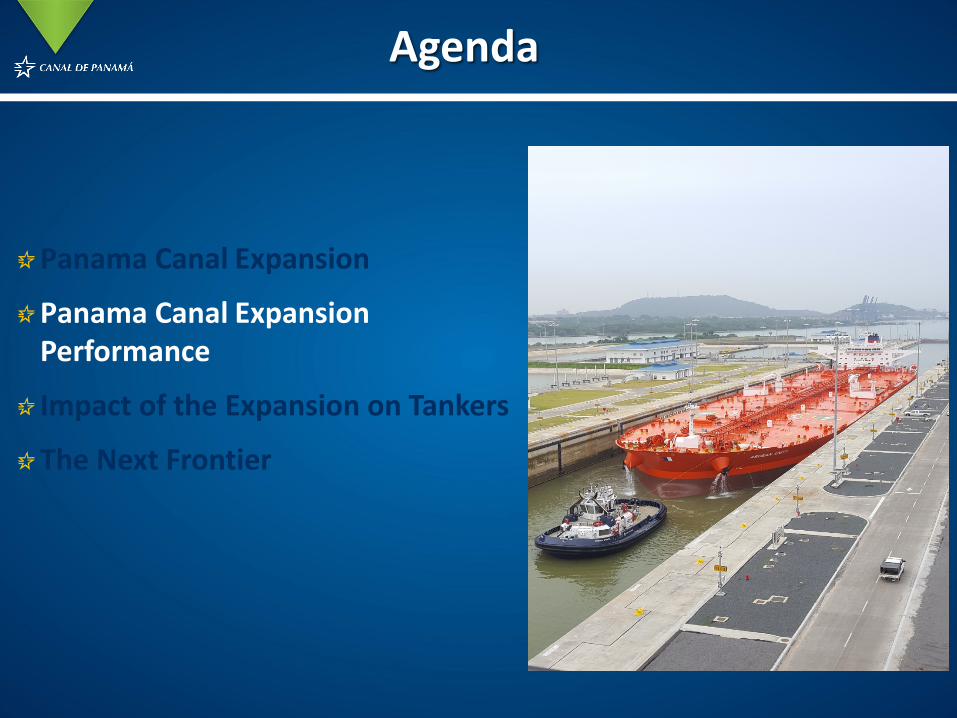
Agenda
Panama Canal Expansion
Panama Canal ExpansionPerformance
Impact of the Expansion on Tankers
The Next Frontier


4,400 TEU’s33.5 m (110’)
32.3 m (106’)
12.8 m (42’)
12.04 m(39.5’)
Maximum existing Locks:
55 m (180’)
13,000 – 14,000 TEU’s
18.3 m (60’)
15.2 m(50’)
New Locks Max Vessel Size:
Dimensions of Locks and Ships
Agenda
Panama Canal Expansion
Panama Canal ExpansionPerformance
Impact of the Expansion on Tankers
The Next Frontier
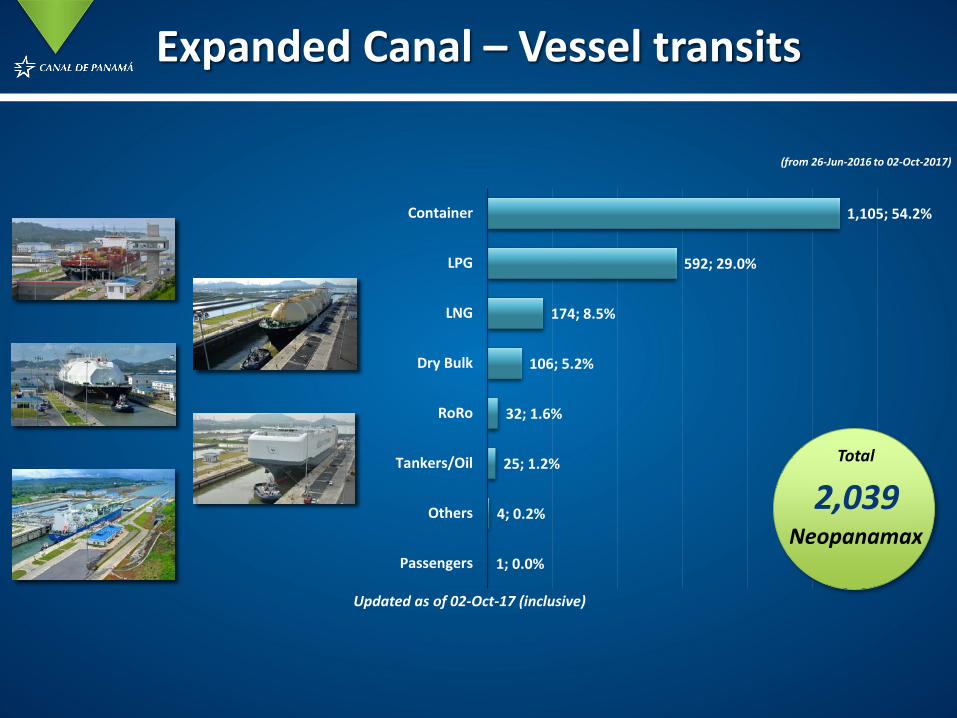
Expanded Canal – Vessel transits
1; 0.0%
4; 0.2%
25; 1.2%
32; 1.6%
106; 5.2%
174; 8.5%
592; 29.0%
1,105; 54.2%
Passengers
Others
Tankers/Oil
RoRo
Dry Bulk
LNG
LPG
Container
Updated as of 02-Oct-17 (inclusive)
(from 26-Jun-2016 to 02-Oct-2017)
Neopanamax2,039
Total

236; 11.6%
1; 0.0%
4; 0.2%
25; 1.2%
32; 1.6%
106; 5.2%
174; 8.5%
592; 29.0%
1,105; 54.2%
Panamax
Passengers
Others
Tankers/Oil
RoRo
Dry Bulk
LNG
LPG
Container
Updated as of 02-Oct-17 (inclusive)
NPxPx 236
2,039
2,275Total
(from 26-Jun-2016 to 02-Oct-2017)
Expanded Canal – Vessel transits
7.8
7.1
8.4
7.9
9.0
6.6
3.3
2.9
7.9
9.6
43.0
41.5
50.3
53.9
59.3
64.3
101.1
49.8
1.4
20.0
16.0
0.0
1.6
0.9
8.1
8.3
79.7
2.6%1.9%2.7%2.1%
3.5%7.1%
4.2%1.1%
0.8%2.5%
2.5%14.2%11.6%
16.7%14.8%
19.9%19.6%
36.3%35.2%
0 20 40 60 80 100 120 140
FY 2016FY 2017FY 2016FY 2017FY 2016FY 2017FY 2016FY 2017FY 2016FY 2017FY 2016FY 2017FY 2016FY 2017FY 2016FY 2017FY 2016FY 2017FY 2016FY 2017
Carg
aG
ener
al
Carg
aRe
frig
erad
a
Gas
eros
(LPG
)LN
GO
tros
Pasa
jer
o
Port
ave
hic
ulo/
Ro
RoTa
nqu
eros
Gra
nele
roSe
co
Port
aco
nte
nedo
r
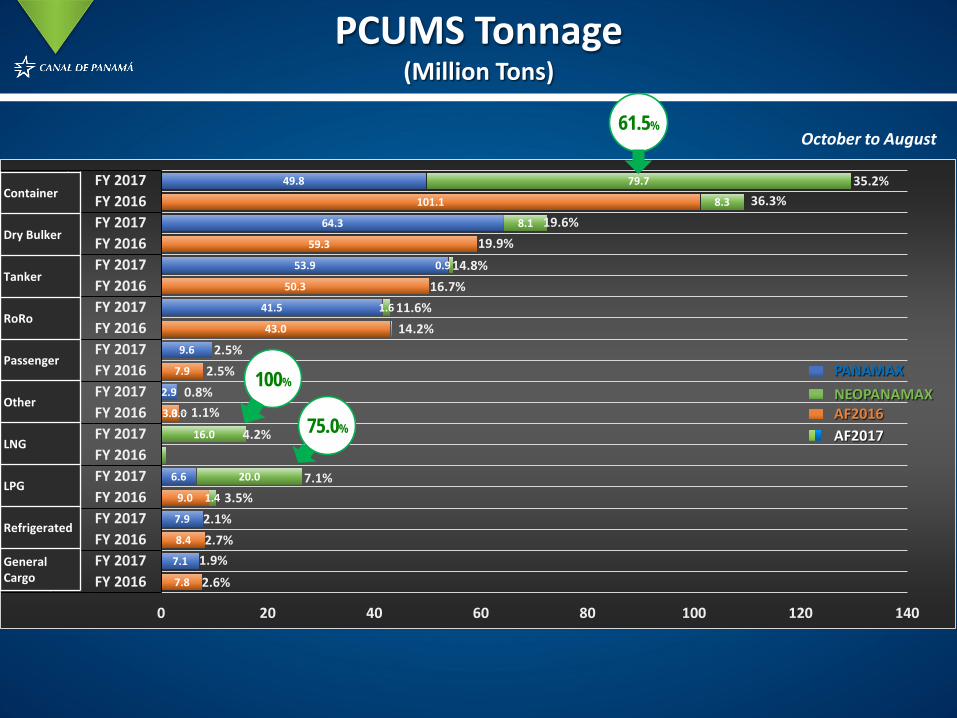
PCUMS Tonnage(Million Tons)
October to August
100%
Container
Dry Bulker
Tanker
RoRo
Passenger
Other
LNG
LPG
Refrigerated
General Cargo
61.5%
75.0%
PANAMAXNEOPANAMAXAF2016AF2017
Agenda
Panama Canal Expansion
Panama Canal ExpansionPerformance
Impact of the Expansion on Tankers
The Next Frontier

Panama Canal Tankers TrafficFY2010-FY2017
1,286 1,3111,477 1,418 1,378
1,5841,777 1,838
178 186
227 238 275
422
449
877
365454
433 459 393
436
456
431
314306
300 311273
289
221
301
17
163
8059
39 2630
24
25
14
0
500
1,000
1,500
2,000
2,500
3,000
3,500
4,000
FY2010 FY2011 FY2012 FY2013 FY2014 FY2015 FY2016 FY2017
Num
ber o
f tra
nsits
Chemical/Oil Tanker LPG Carrier Products Tanker Crude Oil Tanker LNG Carrier Chemical Tanker
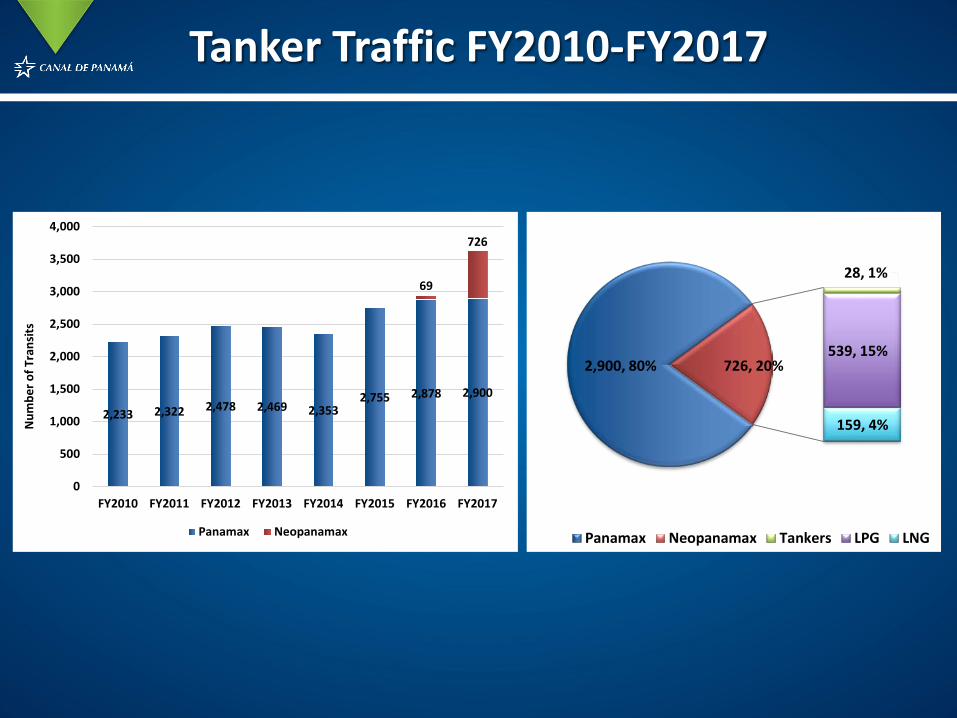
2,900, 80%
28, 1%
539, 15%
159, 4%
726, 20%
Panamax Neopanamax Tankers LPG LNG
2,233 2,322 2,478 2,469 2,3532,755 2,878 2,900
69
726
0
500
1,000
1,500
2,000
2,500
3,000
3,500
4,000
FY2010 FY2011 FY2012 FY2013 FY2014 FY2015 FY2016 FY2017
Num
ber o
f Tra
nsits
Panamax Neopanamax
Tanker Traffic FY2010-FY2017

Main Commodities Carried by Tankers FY2010-FY2017
0
10,000
20,000
30,000
40,000
50,000
60,000
70,000
80,000
FY2010 FY2011 FY2012 FY2013 FY2014 FY2015 FY2016 FY2017
LON
G T
ON
S O
F CA
RGO
(IN
THO
USA
ND)
OTHERS VEGETABLE OILS AND MOLASSES CHEMICALSPETROLEUM CHEMICALS CRUDE PETROLEUM DIESEL OILGASOLINE JET FUEL LPG
Diesel
Gasoline
Crude
LPG
LNG
Chemicals

United States
Peru
Chile
Ecuador
Mexico
Guatemala
Diesel – Main Routes

United States
Peru
Chile
Ecuador
Mexico
Guatemala
Gasoline – Main Routes
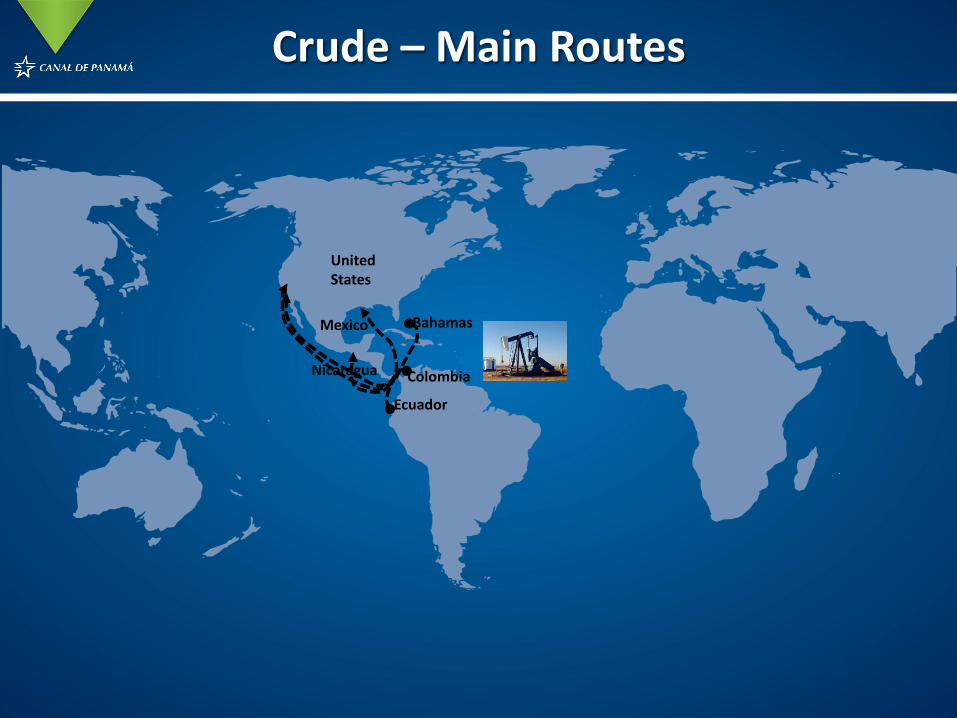
United States
Ecuador
Mexico
Nicaragua Colombia
Bahamas
Crude – Main Routes

United StatesJapan
Benzene – Main Routes
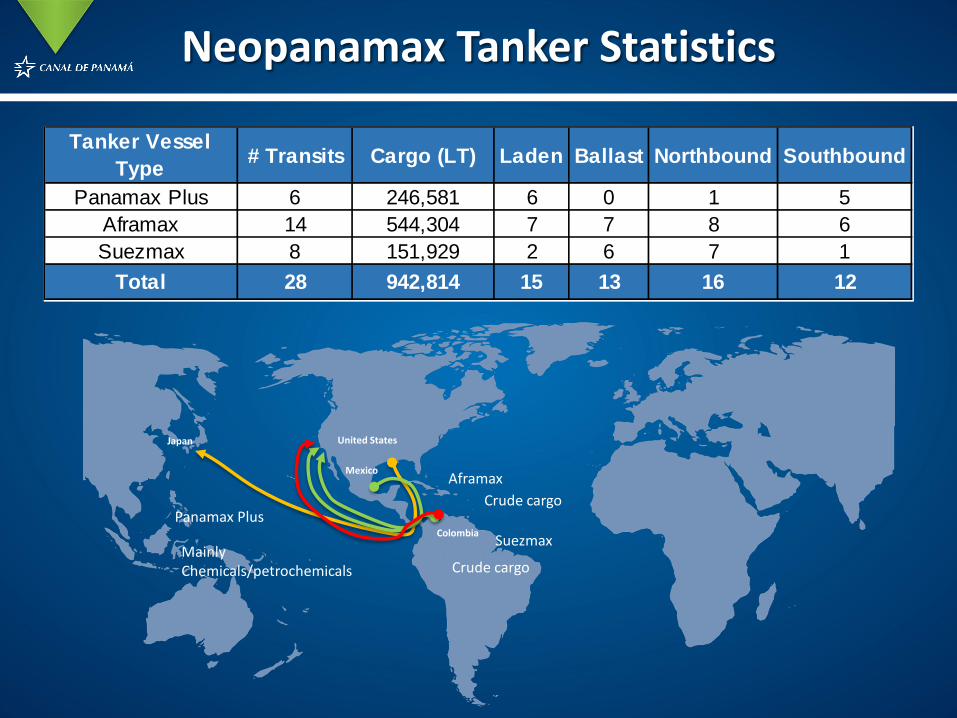
Neopanamax Tanker Statistics
Tanker Vessel Type # Transits Cargo (LT) Laden Ballast Northbound Southbound
Panamax Plus 6 246,581 6 0 1 5Aframax 14 544,304 7 7 8 6Suezmax 8 151,929 2 6 7 1
Total 28 942,814 15 13 16 12
Panamax Plus
Mainly Chemicals/petrochemicals
United StatesJapan
SuezmaxColombia
Mexico
Crude cargoAframax
Crude cargo

Liquid Bulk – Market Outlook
15,750
40,875
18,000
13,000
30,000
14,625
12,500
28,750
13,000
0
5,000
10,000
15,000
20,000
25,000
30,000
35,000
40,000
45,000
2010
-Jan
2010
-Mar
2010
-May
2010
-Jul
2010
-Sep
2010
-Nov
2011
-Jan
2011
-Mar
2011
-May
2011
-Jul
2011
-Sep
2011
-Nov
2012
-Jan
2012
-Mar
2012
-May
2012
-Jul
2012
-Sep
2012
-Nov
2013
-Jan
2013
-Mar
2013
-May
2013
-Jul
2013
-Sep
2013
-Nov
2014
-Jan
2014
-Mar
2014
-May
2014
-Jul
2014
-Sep
2014
-Nov
2015
-Jan
2015
-Mar
2015
-May
2015
-Jul
2015
-Sep
2015
-Nov
2016
-Jan
2016
-Mar
2016
-May
2016
-Jul
2016
-Sep
2016
-Nov
2017
-Jan
2017
-Mar
2017
-May
2017
-Jul
Tanker Time Charter Evolution
1 Year Timecharter Rate 150,000 dwt D / H Modern Tanker 1 Year Timecharter Rate 110,000 dwt D / H Modern Tanker
1 Year Timecharter Rate 74,000 dwt Modern Products Tanker

Source: Clarksons Research, October 2017
Tankers Actual Capacity (in million DWT)
265%
7212% 61
10%
10919%87
15%
22439%
Handysize
Handymax
Panamax
Aframax
Suezmax
VLCC
3, 4% 5, 7%
7, 10%
15, 22%
10, 14%
30, 43%
Tankers Capacity by 2022 (in million DWT)
Tanker Fleet Actual Fleet Total Capacity FleetPanamax 4,277 158,680,738 Neopanamax 1,495 184,374,642 Postpanamax 802 236,318,999 Grand Total 6,574 579,374,379
Tanker Fleet Order Book by 2022 Capacity Added by 2022Panamax 417 13,926,914 Neopanamax 195 24,662,656Postpanamax 95 29,558,212 Grand Total 707 68,147,782
88% 59% 87% 56%
Tanker Fleet Capacity Current and Estimated by 2022

Neopanamax Tanker Economics160,000 dwt Suezmax
DWT @ 50 f ≈ 130,000 m. tons
US crude oil API barrelsWTI 39.6 1,000,003
Colombian crude oils API barrelsCaño-limon 30.0 933,173Vasconia 24.3 900,238
Venezuelan crude oilsBachaquero Heavy 17.0 858,057Bachaquero Extra Heavy 13.0 834,945Tia Juana Light 31.0 938,951
Brazilian crude oilFrade 20.5 878,223
Ecuadorian crude oilOriente 24.0 898,504

Agenda
Panama Canal Expansion
Panama Canal ExpansionPerformance
Impact of the Expansion on Tankers
The Next Frontier

Corozal Container Terminal
New container terminal to serve more than 5MM TEU.
LNG Terminal Capitalizes on global LNG flows by offering LNG bunkering to
vessels. Competitive LNG traffic toll system will support U.S. to Asia market.
Pipelines Opportunities related to the flow of
petrochemicals and refined products from one ocean to the other.
Vessel Repairs Services Facilities to provide major scheduled ship
repairs, routine maintenance or emergency repairs.
Top-Off Operations Potential for developing a ship-to-ship top-off
operation in Panama.
Power Generation Cost-competitive through the use of LNG as
alternate fuel source.
Logistics Park Offers a strategic location for distribution and
value-added activities.
Bunkering Opportunities to obtain a larger market share in
vessel bunkering.
Roll-on Roll-off Terminal Potential for a dedicated terminal for vehicle
transshipment in Panama
Areas with Development Potential

EXPANSION OF THE PANAMA CANAL AND ITS IMPACT ON TANKERS
José Ramón Arango S.Liquid Bulk Segment
October 4th 2017